COVID-19 Pandemic Severity, Lockdown Regimes, and People's Mobility: Early Evidence from 88 Countries - MDPI
←
→
Page content transcription
If your browser does not render page correctly, please read the page content below
sustainability

Article
COVID-19 Pandemic Severity, Lockdown Regimes,
and People’s Mobility: Early Evidence from
88 Countries
Md. Mokhlesur Rahman 1,2 , Jean-Claude Thill 3, *            and Kamal Chandra Paul 4
 1    Department of Urban and Regional Planning, Khulna University of Engineering & Technology,
      Khulna 9203, Bangladesh
 2    INES Program, The William States Lee College of Engineering, The University of North Carolina at
      Charlotte, 9201 University City Blvd, Charlotte, NC 28223, USA; mrahma12@uncc.edu
 3    Department of Geography and Earth Sciences and School of Data Science, The University of North Carolina
      at Charlotte, 9201 University City Blvd, Charlotte, NC 28223, USA
 4    Department of Electrical and Computer Engineering, The William States Lee College of Engineering,
      The University of North Carolina at Charlotte, 9201 University City Blvd, Charlotte, NC 28223, USA;
      kpaul9@uncc.edu
 *    Correspondence: jfthill@uncc.edu; Tel.: +1-704-687-5973

 Received: 2 October 2020; Accepted: 30 October 2020; Published: 1 November 2020

 Abstract: This study empirically investigates the complex interplay between the severity of the
 coronavirus pandemic, mobility changes in retail and recreation, transit stations, workplaces,
 and residential areas, and lockdown measures in 88 countries around the world during the early phase
 of the pandemic. To conduct the study, data on mobility patterns, socioeconomic and demographic
 characteristics of people, lockdown measures, and coronavirus pandemic were collected from multiple
 sources (e.g., Google, UNDP, UN, BBC, Oxford University, Worldometer). A Structural Equation
 Modeling (SEM) framework is used to investigate the direct and indirect effects of independent
 variables on dependent variables considering the intervening effects of mediators. Results show that
 lockdown measures have significant effects to encourage people to maintain social distancing so as to
 reduce the risk of infection. However, pandemic severity and socioeconomic and institutional factors
 have limited effects to sustain social distancing practice. The results also explain that socioeconomic
 and institutional factors of urbanity and modernity have significant effects on pandemic severity.
 Countries with a higher number of elderly people, employment in the service sector, and higher
 globalization trend are the worst victims of the coronavirus pandemic (e.g., USA, UK, Italy, and Spain).
 Social distancing measures are reasonably effective at tempering the severity of the pandemic.

 Keywords: COVID-19; lockdown; social distancing; mobility; SEM

1. Introduction
     The novel coronavirus, also known as Coronavirus Disease 2019 (COVID-19), first emerged
in Wuhan (P.R. China) in late fall 2019 and has now spread to 213 countries around the globe [1].
The World Health Organization (WHO) declared COVID-19 a pandemic on 11 March 2020, considering
its outbreak in many countries [2]. As of now, more than 44 million people have been infected by
this highly infectious disease and over 1.1 million people have died [1,3]. The current fatality rate
among closed cases is about 10%, which speaks volume about the sheer severity of the pandemic.
The increasing number of coronavirus cases and deaths poses challenges to the healthcare system,
economic development, supply chain, education, and travel pattern of the people [4]. Figure 1
represents the increasing number of coronavirus infection cases and deaths (in million) in the world

Sustainability 2020, 12, 9101; doi:10.3390/su12219101                       www.mdpi.com/journal/sustainability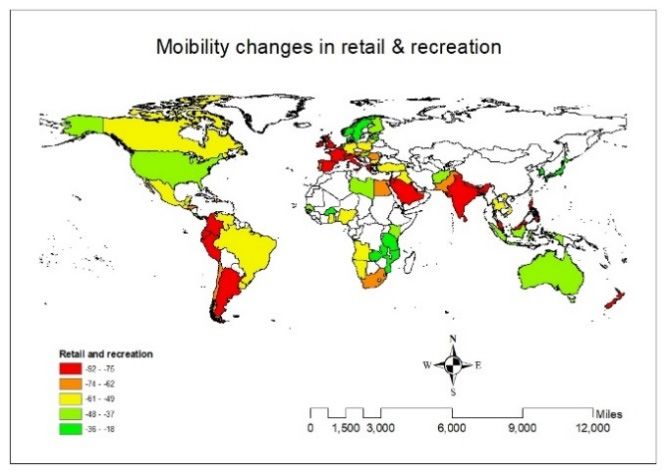
Sustainability 2020, 12, x FOR PEER REVIEW 2 of 17
Sustainability 2020, 12, 9101 2 of 17
represents the increasing number of coronavirus infection cases and deaths (in million) in the world
from 31 December 2019 to 29 October 2020. To control the spread of COVID-19, governments have
from 31 December
implemented 2019 tothrough
travel bans 29 October 2020. Tolockdown,
national control the stay-at-home
spread of COVID-19,
order,governments
restriction have
on mass
implemented travel bans through national lockdown, stay-at-home order, restriction on mass gathering
gathering and non-essential travel, which further affected people’s mobility and social distancing
and non-essential travel, which further affected people’s mobility and social distancing practices.
practices.
Figure 1. Total
Figure number
1. Total numberofofcoronavirus infectioncases
coronavirus infection casesand
and deaths
deaths in the
in the world
world [5]. [5].
ThisThis study
study mainly
mainly aims
aims atatunraveling
unraveling the
the complex
complexrelationships
relationships between thethe
between incidence of the
incidence of the
pandemic, lockdown measures on populations and their social distancing and mobility
pandemic, lockdown measures on populations and their social distancing and mobility behaviors inbehaviors
in the early stage of the pandemic. The following three research questions are form the core of the
the early stage of the pandemic. The following three research questions are form the core of the
understanding these interrelated relationships:
understanding these interrelated relationships:
(1) What are the impacts of different lockdown measures on reducing people’s mobility patterns and
(1) What are the impacts of different lockdown measures on reducing people’s mobility patterns
the severity of the pandemic?
and the severity of the pandemic?
(2) What are the effects of socioeconomic and institutional arrangements and dispositions on
(2) What are the mobility
population effects ofandsocioeconomic
on the pandemicand institutional arrangements and dispositions on
severity?
population mobility and on the pandemic severity?
(3) What are the consequences of pandemic severity on the condition of social distancing of the people?
(3) What are the consequences of pandemic severity on the condition of social distancing of the
The impacts of COVID-19 on public health have been discussed in many previous papers [6–9].
people?
This disease is imposing tremendous pressure on the health care system [8]. Besides, COVID-19 is
The impacts
affecting of COVID-19
the mental on public
health of people in thehealth
form ofhave
massbeen
fear, discussed in many previous
panic, and uncertainties [10–12].papers
Because[6–9].
Thisofdisease is imposing
the escalation tremendous
of the pandemic, therepressure
has been aon theincrease
huge healthincare system stockpiling
the personal [8]. Besides, COVID-19 is
of necessary
goodsthe
affecting (e.g.,mental
food staples,
healthtoilet paper, cleaning
of people in the supply)
form ofwhich massisfear,
unsettling
panic,theand
balance in the demand
uncertainties [10–12].
and supply
Because of consumer
of the escalation ofgoods [6].
the pandemic, there has been a huge increase in the personal stockpiling
Many researchers have investigated
of necessary goods (e.g., food staples, toilet paper, the impactscleaning
of COVID-19 on thewhich
supply) global is
economy [4,6,9,13,14].
unsettling the balance
Globally, stock markets collapsed by 50%. As COVID-19 threw millions out of work in the US, it caused
in the demand and supply of consumer goods [6].
an unemployment rate soaring to 14.7% in April 2020, which is the highest rate since the Great
Many researchers have investigated the impacts of COVID-19 on the global economy
Depression [15,16]. The US Congress passed a $2 trillion coronavirus aid package to help businesses
[4,6,9,13,14]. Globally, stock markets collapsed by 50%. As COVID-19 threw millions out of work in
and workers. Global annual GDP is expected to contract by 3–4%. With the COVID-19 outbreak,
the US, it caused
a massive an unemployment
freeze in the industrial andratelogistical
soaring to 14.7% in April
infrastructure 2020,
caused which is thethroughout
a devastation highest ratethesince
the Great Depression [15,16]. The US Congress passed a $2 trillion coronavirus
global economy. Many investors moved towards safer investments because of the fear of a worldwide aid package to help
businesses
recessionand[9]. workers.
Meanwhile, Global annual
the global GDP
supply is expected
chain to contract
has been deeply by 3–4%.
disrupted. With
About 940 theFortune
of the COVID-19
outbreak, a massive
1000 companies havefreeze in athe
reported industrial
supply and logistical
chain disruption infrastructure
due to COVID-19 caused
[17]. A a devastation
simulation study
observed that changes in opening and closing time of the facilities due
throughout the global economy. Many investors moved towards safer investments because of theto the coronavirus pandemic
fear of a worldwide recession [9]. Meanwhile, the global supply chain has been deeply disrupted.
About 940 of the Fortune 1000 companies have reported a supply chain disruption due to COVID-19
[17]. A simulation study observed that changes in opening and closing time of the facilities due to the
coronavirus pandemic are affecting supply chain performance [18]. However, considering the sharp
economic downturn, people are also very much concerned about reopening the economy. A recent
Sustainability 2020, 12, 9101                                                                         3 of 17

are affecting supply chain performance [18]. However, considering the sharp economic downturn,
people are also very much concerned about reopening the economy. A recent study using Twitter data
indicated that Americans are more supportive than fearful regarding reopening the economy [11].
Thus, adequate protective measures need to be adopted to safeguard people from COVID-19, even if
the authorities forge ahead with a normal reopening of the economy.
      Meanwhile, the travel industry is now facing an unprecedented reduction of flights,
both internationally and domestically [14] after years of unbridled growth. As a precautionary
measure in the face of the outbreak, human mobility has been curtailed across the board, entailing
reductions in long-distance travel as well as in household trips for daily activities. This is an
indirect consequence of the pandemic, which the world previously experienced during the Severe
Acute Respiratory Syndrome (SARS) and the Middle East Respiratory Syndrome (MERS) outbreaks
of 2002–2003 and 2011–2012, respectively. The virus has spread fast because of the transmission
from infected regions to uninfected regions through the movement of people [7]. The analysis of
mobility-based data suggested that a simultaneous restriction on travel across different regions and
migration control is an effective way to control the spread of the virus [19–22]. Additionally, constrained
human mobility by enacting lockdown or shelter-in-place orders can control community transmission
of the virus.
      The outflow of population from the infected regions poses a major threat to the destination
regions. Mass transport (e.g., buses, trains) plays a very important role in the importation of COVID-19.
A positive correlation of case importation has been found with the frequency of flights, buses,
and trains from infected cities [20]. Thus, travel from the infected cities and regions can reduce the
rapid transmission of the COVID-19. Similarly, different non-pharmaceutical interventions (NPIs)
(e.g., travel ban, school, and public transport closure, restriction on public gathering, stay-at-home
order) imposed by governments can mitigate community transmission of the COVID-19 in the affected
regions, which dramatically curtails the mobility of people [6,13,21,23–33].
      Apart from essential trips, non-essential businesses, amusement parks, cinemas, sports venues,
public events, and exhibitions are curtailed. Nowadays, people are adjusting their travel decisions
voluntarily to avoid coronavirus infection. Moreover, people are canceling and postponing their trips
because of perceived danger and negative impacts on the health of family members and relatives [34].
A recent study using GPS location-based data observed that a change in infection rate of 0.003% is
accompanied by mobility reduction in the order of 2.31% at the county level in the US [35]. On the
other hand, the stay-at-home order reduces mobility by 7.87%. Thus, lockdown measures are very
effective means of social distancing and ultimately alleviating pandemic severity. This study also
observed higher mobility reduction in the counties with a higher number of elderly people, lower share
of republican supporters in the 2016 presidential election, and higher population density.
      Travel bans and restrictions provide some reprieve that is very helpful to reinforce and establish
necessary measures in controlling the spread of the epidemic [33]. Researchers estimated that travel
reduction from 28 January to 07 February 2020 prevented 70.4% coronavirus infections in China [26].
Using the count data model they observed that travel restriction resulted in the delay of a major
epidemic by two days in Japan, and the probability of a major epidemic reduced by 7 to 20%.
Researchers in [36] developed an interactive web map to show the spatial variation of mobility during
the COVID-19 pandemic. Analyzing county-level mobility data released by SafeGraph, this study
found that mobility decreased considerably by March 31, 2020 in the US, when most states ordered
lockdown and imposed stay-at-home orders. Using the susceptible-exposed-infectious-recovered
(SEIR) model, studies in Taiwan [27] and Europe [31] showed that reduction of intercity and air travel,
respectively, can effectively reduce the coronavirus pandemic. However, using the same methodology,
another study commented that travel restriction may be an effective measure for a short term case,
yet it is ineffective to eradicate the disease as it is impossible to remove the risk of seeding the virus to
other areas [25].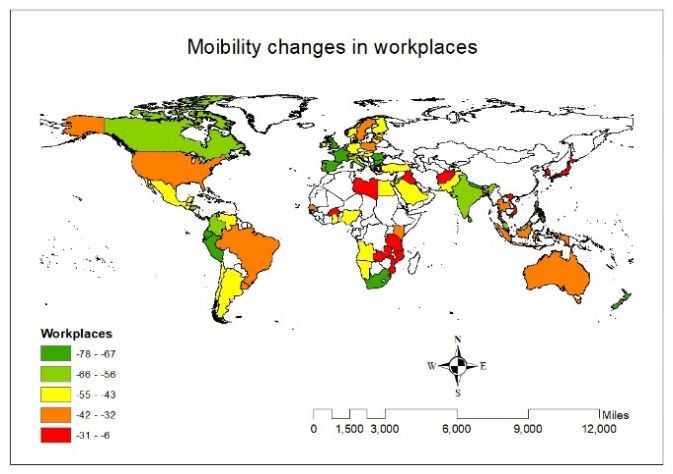
Sustainability 2020, 12, 9101 4 of 17
Sustainability 2020, 12, x FOR PEER REVIEW 4 of 17
National and international travel restrictions may only modestly delay the spread of the virus
unless there is a certain level of control in community transmission (i.e., inability to identify the sources
pandemic. Similarly,Using
of infections). pharmaceutical interventions
a global metapopulation (PIs)transmission
disease are mandatory model,toresearchers
provide proper observedmedication
to infected
that evenpeoplewithand
90%improve health conditions.
travel restrictions to and from Thus, China, aonlycoordinated effortincomprising
a mild reduction coronavirus NPIs and
PIs is necessary to mitigate the impacts of COVID-19 [37].
pandemic could be envisioned until community transmission is reduced by 50% at least [28]. Thus,
appropriateinNPIs
Reduction to reduce community
community transmission
transmission is seen areas
necessary to weaken
an effective the pandemic.
measure Similarly,
to control coronavirus
pharmaceutical interventions (PIs) are mandatory to provide proper medication to infected people and
severity. On the other hand, lockdown regimes such as local travel ban, stay-at-home order,
improve health conditions. Thus, a coordinated effort comprising NPIs and PIs is necessary to mitigate
restrictions on public
the impacts gatherings,
of COVID-19 [37]. and school closures, essentially reduce community transmission of
the COVID-19 by reducing
Reduction in community the mobility of the
transmission people.
is seen as an Because there istono
effective measure theoretical
control basis to hold
coronavirus
the view these On
severity. arethe
simple dependencies,
other hand, this study
lockdown regimes such asassesses
local travelhowban,lockdown
stay-at-home measures on populations,
order, restrictions
on public gatherings, and school closures, essentially reduce community
their social distancing and mobility behaviors, and the severity of the COVID-19 pandemic transmission of the COVID-19
by reducing the mobility of the people. Because there is no theoretical basis to hold the view these
triangulate to portray the public health state of a country. Also, we study how the socioeconomic and
are simple dependencies, this study assesses how lockdown measures on populations, their social
institutional
distancing contexts of a behaviors,
and mobility country and condition
the severity the specific
of the COVID-19 modalities
pandemicof these relationships.
triangulate to portray The
analysis theispublic
conducted within
health state of a the framework
country. of a Structural
Also, we study Equation Model
how the socioeconomic (SEM). contexts
and institutional
Based on thecondition
of a country literature review,
the specific a conceptual
modalities framework The
of these relationships. hasanalysis
been developed
is conducted (Figure
within 2). The
the framework of a Structural Equation Model (SEM).
conceptual framework posits that socioeconomic and institutional contexts have a significant role in
pandemic Based on the literature review, a conceptual framework has been developed (Figure 2).
severity, social distancing, and in the enactment of lockdown measures. Different
The conceptual framework posits that socioeconomic and institutional contexts have a significant role in
lockdown pandemicmeasures
severity,implemented
social distancing,in andaffected countries
in the enactment influence
of lockdown pandemic
measures. Differentseverity
lockdownand social
distancing
measures(i.e., implemented
mobility). Moreover,
in affected lockdown measures
countries influence indirectly
pandemic influence
severity and social pandemic
distancingseverity by
changing (i.e.,people’s
mobility).mobility.
Moreover,Sociallockdowndistancing
measures has a direct
indirectly effectpandemic
influence on pandemicseverityseverity.
by changingA high level
of socialpeople’s
distancingmobility.
(i.e.,Social distancing
reduction has a direct
of mobility) iseffect on pandemic
considered severity. measure
an effective A high level of socialinfectious
to reduce
distancing (i.e., reduction of mobility) is considered an effective measure to reduce infectious diseases.
diseases. However, pandemic severity also has a direct effect on how people effectively practice social
However, pandemic severity also has a direct effect on how people effectively practice social distancing,
distancing, which implies that self-motivated people reduce their mobility when the severity of the
which implies that self-motivated people reduce their mobility when the severity of the pandemic
pandemic is higher.
is higher.
Figure 2. Conceptualization of the study.
Figure 2. Conceptualization of the study.
This study empirically explores the relationships between lockdown measures, mobility
patterns, pandemic severity, and socioeconomic and institutional factors of 88 countries in the world
using SEM. Collecting data from multiple sources, this study finds that lockdown measures have
significant influence on reducing mobility and thus control the severity of the pandemic. Social
Sustainability 2020, 12, 9101 5 of 17
This study empirically explores the relationships between lockdown measures, mobility patterns,
pandemic severity, and socioeconomic and institutional factors of 88 countries in the world using
SEM. Collecting data from multiple sources, this study finds that lockdown measures have significant
influence on reducing mobility and thus control the severity of the pandemic. Social distancing also has
direct impact on reducing pandemic severity, although the effect is rather marginal. The socioeconomic
and institutional factors of a country significantly affect pandemic severity. However, pandemic
severity, socioeconomic and institutional factors have no significant impacts on social distancing.
2. Materials and Methods
2.1. Data
To test and validate the conceptual model in Figure 2, data were collected from multiple sources
(Table 1). The data sources include Google, the United Nations (UN), United Nations Development
Program (UNDP), Worldometer, Oxford University, Hofstede, The Fraser Institute, KOF Swiss Economic
Institute, and BBC.
Table 1. Description of the variables and data sources.
Variable Description Source
RR Percentage change of mobility in retail and recreation trips [38]
TS Percentage change of mobility in transit stations trips [38]
WP Percentage change of mobility in workplaces trips [38]
RD Percentage change of mobility in residential trips [38]
l_case Total coronavirus infection cases per 1 million population [1]
l_death Total coronavirus deaths per 1 million population [1]
NL National lockdown [39]
WPC Workplace closing [40]
SH Stay-at-home order [40]
SI Stringency index 1 [40]
FS Percentage of female smokers [40]
AGE65 Percentage of the population age 65 and older [40]
MA Median age [41]
EI Average of years of schooling vs. expected years of schooling [41]
AE Percentage of the population employed in agriculture [42]
SE Percentage of the population employed in services [42]
HE Percentage of health expenditure to total GDP [42]
IDV Individualism versus Collectivism emphasis 2 [43]
KOFGI KOF Globalization Index 3 [44]
1 A composite index considering all implemented lockdown measures. The score of this index ranges from 0 to
100. A high score indicates the strictest measures and low score indicates loose measure. 2 This indicator measures
the degree of interdependence among the members of a society. The score ranges from 0 to 100. A low score
indicates collective culture and higher interdependence among the members and conversely a high score indicates
Individualist culture and a low level of interdependence. 3 A composite index that indicates openness to trade and
capital flows considering economic, social and political aspects. The score of the index ranges from 0 to 100. A high
score denotes a highly globalized country and a low score indicates poorly globalized country.
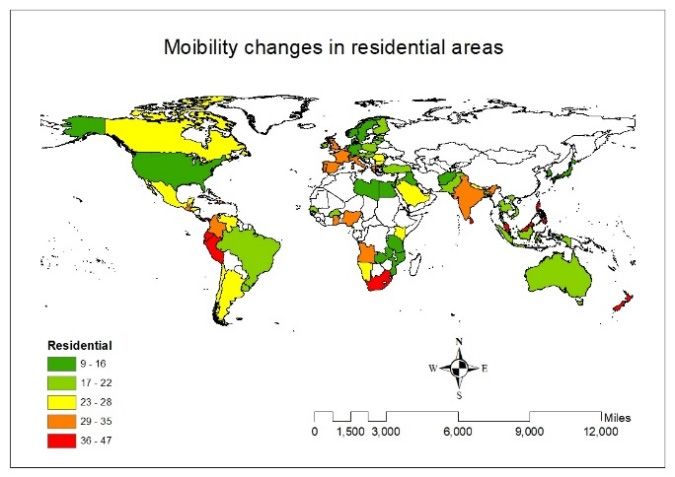
Google prepared a COVID-19 Community Mobility Report to help policymakers and public
health professionals to understand changes in mobility in responses to lockdown measures (e.g., travel
ban, work-from-home, shelter-in-place, restriction on public gathering) [38,45]. This report shows
how visits and length of stay at different places, such as retail and recreation (e.g., restaurant, café,
shopping center, theme park), workplaces (i.e., place of work), transit stations (e.g., subway stations,
seaport, taxi stand, rest area), residential areas (i.e., place of residence), parks (e.g., public park, national
forest), grocery stores and pharmacies (e.g., supermarket, convenience store, drug store) changed as of
April 17 compared to a baseline value, with a potential to reduce the impact of COVID-19 pandemic.
The baseline value is the median value of the corresponding week during the 5-week period from
3 January to 6 February 2020. The data were collected from the Google account holders who haveSustainability 2020, 12, 9101 6 of 17
turned on their travel location history. This study uses mobility changes in retail and recreation,
workplaces, transit stations, and residential areas for 88 countries (Figure 3). Due to the ambiguity of
the nature of visits and trips to grocery stores and pharmacies and the inconsistent definition of parks
across countries (i.e., only include public parks), mobility changes in these two points of interest (POIs)
were excluded from the study.
Sustainability 2020, 12, x FOR PEER REVIEW 6 of 17
Figure 3. Mobility changes in POIs.
Figure 3. Mobility changes in POIs.
The total number of coronavirus infection cases and death cases as of April 17 were collected
The total number of coronavirus infection cases and death cases as of April 17 were collected
from Worldometer [1]. They collect data from thousands of sources around the world, analyze and
from Worldometer [1]. They collect data from thousands of sources around the world, analyze and
validate them in real-time, and provide COVID-19 live statistics. To flatten the curve of COVID-19,
validate them in real-time, and provide COVID-19 live statistics. To flatten the curve of COVID-19,
governments issued different lockdown measures for part or whole country to restrict all non-essential
governments issued different lockdown measures for part or whole country to restrict all non-
movements. Data related to lockdown measures were collected from Dunford, Dale [39] and
essential movements. Data related to lockdown measures were collected from Dunford, Dale [39] and
Oxford [40]. This study also collected socioeconomic (e.g., age, education, employment sector) and
Oxford [40]. This study also collected socioeconomic (e.g., age, education, employment sector) and
institutional context (e.g., individualism versus collectivism, globalization index) data to investigate
institutional context (e.g., individualism versus collectivism, globalization index) data to investigate
their impacts
their impactsononcoronavirus
coronavirusinfection
infection cases
cases and
and deaths, lockdown measures,
deaths, lockdown measures,and andtravel
travelpatterns
patterns
(Table 1). After collecting data for 88 countries, they were integrated to build a complete
(Table 1). After collecting data for 88 countries, they were integrated to build a complete dataset and dataset and
conduct
conduct this study.
this study.Table 1 lists
Table thethe
1 lists variables that
variables thatwere
wereincluded
includedininthe
thefinal
finalmodel.
model.AAcomplete
completelist
listof
variables
of variables that were tested in the SEM framework to achieve the final model is provided inA.
that were tested in the SEM framework to achieve the final model is provided in Appendix
Descriptive
Appendix A. statistics of 19 different social distancing measures, lockdown variables, coronavirus
infection cases andstatistics
Descriptive deaths,ofsocioeconomic, anddistancing
19 different social institutional context
measures, variablesvariables,
lockdown of all 88 coronavirus
countries are
reported in Table 2. They are included in the statistical model as dependent variables,
infection cases and deaths, socioeconomic, and institutional context variables of all 88 countries independent
are
variables,
reportedmediators,
in Table 2.and
Theycontrol variables.
are included in the statistical model as dependent variables, independent
variables, mediators, and control variables.
Table 2. Descriptive statistics of the variables (N = 88).
Variable Unit Min Max Mean SD
RR % −92 −18 −59.41 18.20
TS % −95 −20 −60.91 15.06
WP % −78 −6 −48.41 16.86
RD % 7 47 24.19 8.78
l_case Cases/1M pop 0.69 8.64 4.98 2.10
l_death Deaths/1M pop 0.69 6.11 2.25 1.52
NL Dummy (1, 0) 0 1 0.59 0.49Sustainability 2020, 12, 9101 7 of 17
Table 2. Descriptive statistics of the variables (N = 88).
Variable Unit Min Max Mean SD
RR % −92 −18 −59.41 18.20
TS % −95 −20 −60.91 15.06
WP % −78 −6 −48.41 16.86
RD % 7 47 24.19 8.78
l_case Cases/1M pop 0.69 8.64 4.98 2.10
l_death Deaths/1M pop 0.69 6.11 2.25 1.52
NL Dummy (1, 0) 0 1 0.59 0.49
WPC Dummy (1, 0) 0 1 0.83 0.38
SH Dummy (1, 0) 0 1 0.67 0.47
SI Index 38.22 100 82.07 13.73
FS % 0.2 35.3 13.02 10.05
AGE65 % 1.14 27.05 11.09 6.88
MA Year 16.7 48.4 33.68 8.95
EI Index 0.3 1 0.72 0.16
AE % 0.1 73.2 16.72 18.51
SE % 21.1 87.6 61.79 15.83
HE % 2.4 17.1 6.95 2.74
IDV Index 6 91 40.02 22.95
KOFGI Index 38.2 91.3 71.82 12.96
2.2. Statistical Model
SEM is used to investigate the causal relationships between socioeconomic and institutional
factors, lockdown variables, coronavirus infection and death rates, and social distancing measures.
This multivariate statistical technique is a common method to investigate complex relationships between
dependent variables, independent variables, mediators, and latent dimensions. Many researchers have
used SEM to investigate the factors that affect travel behaviors (e.g., mode choice, trip purpose, travel
distance), for instance [46–49]. SEM consists of regression analysis, factor analysis, and path analysis
to explore interrelationships between variables. It is a confirmatory technique where an analyst tests a
model to check consistency between the existing theories and the nature of constructs.
Based on Exploratory Factor Analysis (EFA) and extant theories, latent dimensions are created to
reduce dimensions and easily understand the data and represent underlying concepts. The following
four latent dimensions are created based on the observed data:
(1) Social distancing measures: TS, RR, WP, and RD
(2) Pandemic severity: l_case and l_death
(3) Lockdown measures: NL, WPC, SH, and SI
(4) Socioeconomics and institutional factors: MA, AGE65, KOFGI, AE, SE, HE, FS, EI, and IDV
Moreover, a path diagram is constructed to graphically represent interdependencies of the
independent variables, mediators, and dependent variables in the model specification. Finally, a set
of fit indices (e.g., Chi-square, CFI, TLI, RMSEA, SRMR) are estimated to establish goodness-of-fit of
the model.
3. Results
3.1. Calibrated Model
The model is calibrated using the SEM Builder within STATA 15 [50]. The maximum likelihood
estimation method is used to calculate the coefficients. The overall structure of the model with direct
standardized coefficients is depicted in Figure 4. The final structure of the model includes interactions
between dependent and independent variables through mediators.Sustainability 2020, 12, 9101 8 of 17
Sustainability 2020, 12, x FOR PEER REVIEW 8 of 17
l case l_death
0.96 0.87
Pandemic
Severity
MA
AGE65 TS
-0.065 -0.16 0.93
0.93
0.89 0.85
KOFGI 1.10
0.94 RR
Social
AE -0.75 -0.046 Distancing 0.87
Socioeconomic and WP
-0.75
SE 0.78 Institutional Factors
0.76 -0.09 RD
HE 0.70 -0.63
0.91
0.73
FS
Lockdown
EI Measures
0.41
0.68 0.61 0.91
IDV
NL WPC SH SI
Figure 4. The calibrated model with direct standardized effects.
Figure 4. The calibrated model with direct standardized effects.
Table 3. Goodness-of-fit Statistics.
The fit of the calibrated model is Fitevaluated
Statistic based on several goodness-of-fit statistics (Table 3).
Value
The Chi-square statistic of the estimated model is 261.331. A lower
Chi-square value of the Chi-square indicates
261.331
Chisq/df 2.026
a better-fit model. Other fit statistics confirm that the estimated model is satisfactory. Thus, by all
RMSEA (Root mean squared error of approximation) 0.108
accounts, the goodness-of-fit of the
CFIestimated SEM
(Comparative is within the acceptable
fit index) 0.920 range and is quite satisfactory,
TLI (Tucker-Lewis
which validates the use of this model [46,47]. index) 0.894
SRMR (Standardized root mean squared residual) 0.099
Table 3. Goodness-of-fit Statistics.
3.2. Standardized Direct Effects
Table 4 reports on the standardized coefficients by pair of variables in the model,
Fit Statistic including the
Value
direction of the modeled effect. These coefficients indicate the direct impacts of the socioeconomic
Chi-square 261.331
and institutional factors, on the dependent variables of lockdown measures, pandemic severity and
Chisq/df 2.026
social distancing measures, and the direct interactions between and among dependent, independent,
RMSEA (Root mean squared error of approximation) 0.108
and latent variables. However, this table does not represent any indirect effects of independent
variables through mediators. CFI (Comparative
Table fit the
4 also reports index) 0.920
standard error, z-value, and probability level
TLI (Tucker-Lewis
(P-value) of the estimates. Most index)
of the coefficients are statistically significant at 0.894
the 0.001 level.
However, a few SRMR (Standardized
coefficients root greater
with a P-value mean squared residual)
than 0.001 0.099to preserve
are retained in the model
the overall representation of the relationships.
3.2. Standardized Direct Effects
Table 4 reports on the standardized coefficients by pair of variables in the model, including the
direction of the modeled effect. These coefficients indicate the direct impacts of the socioeconomic
and institutional factors, on the dependent variables of lockdown measures, pandemic severity and
social distancing measures, and the direct interactions between and among dependent, independent,
and latent variables. However, this table does not represent any indirect effects of independent
variables through mediators. Table 4 also reports the standard error, z-value, and probability level
(P-value) of the estimates. Most of the coefficients are statistically significant at the 0.001 level. However,
a few coefficients with a P-value greater than 0.001 are retained in the model to preserve the overall
representation of the relationships.Sustainability 2020, 12, 9101 9 of 17
Table 4. Estimated standardized direct effects (N = 88).
Variables Std. Coef. Std. Err. z P>z
Social DistancingSustainability 2020, 12, 9101 10 of 17
Pandemic Severity: This endogenous latent dimension is measured by two observed variables:
l_case and l_death. Pandemic severity is positively associated with both of the observed variables
(l_case: 0.963 and l_death: 0.876). In contrast, pandemic severity is negatively associated with social
distancing, which implies that increasing severity of the pandemic reduces mobility in transit stations,
retail and recreation, and workplaces and increases the time spent at one’s residence. However,
the association is not statistically significant (p-value: 0.767).
Lockdown measures: This endogenous latent factor is estimated by using four observed variables:
NL, WPC, SH, and SI. The Lockdown latent dimension is positively associated with all of the measures
(NL: 0.413, WPC: 0.681, SH: 0.614, and SI: 0.911) taken by governments to bring about social distancing
and control the pandemic. Furthermore, lockdown measures are negatively associated with social
distancing (−0.626). Thus, adopting strict lockdown measures (e.g., restriction on public gathering,
workplace closing, and stay-at-home order) significantly reduces mobility at transit stations, retail and
recreation facilities, and workplaces and increases time spent near one’s home, all of which entailing
people to stay home and avoid unnecessary travel.
Socioeconomic and institutional factors: This is the only exogenous latent dimension in the model.
It comprises nine observed variables: MA, AGE65, KOFGI, AE, SE, HE, FS, EI, and IDV. Socioeconomics
and institutional factors are positively associated with median age (0.925), elderly people (0.887),
level of globalization (0.936), employment in the service sector (0.777), expenditure on health (0.762),
female smokers (0.701), level of education (0.911), and the degree of interdependence in the society
(0.734). Conversely, it is negatively associated with employment in the agricultural sector (−0.746).
This latent dimension can therefore be interpreted as an indicator of urbanity and modernity. Moreover,
socioeconomic and institutional factors are positively associated with pandemic severity (0.847) and
negatively associated with lockdown measures (−0.090) and social distancing (−0.046). Thus, one unit
change in socioeconomic and institutional factors leads to an increase in pandemic severity by 0.847 unit
through increases in the number of elderly people, level of globalization, employment in the service sector,
and reduction in employment in the agricultural sector. In contrast, one unit change in socioeconomic
and institutional factors lead to a decrease in lockdown measures and in social distancing by 0.090 units
and 0.046 units, respectively, by encouraging people to be more considerate of their impact on the rest
of society. However, the impacts of socioeconomic and institutional factors on lockdown measures and
social distancing are very minor and statistically non-significant at P-value 0.05.
3.3. Estimated Standardized Total Effects
It is important to analyze the total effect of latent factors on social distancing, pandemic severity,
and lockdown measures considering their indirect effects, which remain unrevealed in the path diagram
(Figure 4). Table 5 details the standardized total effects of latent factors on each of the observed
variables of social distancing, pandemic severity, and lockdown regime.
Table 5. Total effects on social distancing and pandemic severity.
Social Distancing Pandemic Severity Lockdown Measures
Latent Factor
TS RR WP RD l_case l_death NL WPC SH SI
Pandemic severity −0.061 −0.075 −0.057 0.049 - - - - - -
Lockdown measures −0.591 −0.717 −0.550 0.475 0.098 0.088 - - - -
Socioeconomic and
−0.042 −0.051 −0.039 0.034 0.823 0.746 −0.037 −0.061 −0.055 −0.082
institutional factors
Social distancing - - - - −0.156 −0.141 - - - -Sustainability 2020, 12, 9101 11 of 17
Taking into account both direct and indirect effects, the analysis reveals that pandemic severity,
lockdown measures, and socioeconomic and institutional factors reduce mobility at transit stations,
retail and recreation centers, and workplaces and increase residential mobility. However, lockdown
measures have much stronger and significant effects on all four social distancing aspects than pandemic
severity and socioeconomic and institutional factors. In addition, the SEM analysis shows that lockdown
and socioeconomic and institutional factors magnify pandemic severity while social distancing reduces
pandemic severity. However, the impacts of socioeconomic and institutional factors are higher and
statistically significant than lockdown measures and social distancing. Thus, lockdown measures are
important to persuade people to stay home and maintain social isolation, and socioeconomic and
institutional variables of urbanity and modernity substantially increase the severity of coronavirus
pandemic. The table also indicates that only socioeconomic and institutional factors have direct impacts
on the lockdown regime. However, the impacts are very insignificant.
Considering the complex relationships on hand, SEM extracts direct and indirect effects of variables
and latent dimensions on social distancing, pandemic severity, and lockdown regime (Table 6). Direct
and indirect impacts allow us to comprehend the core causes of social distancing and pandemic
severity in different countries. Observing the direct and indirect effects, we understand that the direct
effects of different latent factors on social distancing and pandemic severity is higher and significant
compared to indirect effects. In some cases, indirect effects are statistically insignificant and often
trivially small (Table 6). Thus, overall, the direct effects of latent factors represent the total effects
without any mitigating or amplifying indirect effects. Results articulated in Table 6 illustrates that
lockdown measures directly reduce people’s mobility while socioeconomic and institutional factors
increase the severity of the pandemic to a greater extent. Socioeconomic and institutional factors only
have direct effects on lockdown, without any indirect influence on it.
Table 6. Direct, indirect, and total effects on social distancing, pandemic severity, and lockdown regime.
Social Distancing Pandemic Severity Lockdown
Latent Factor
Direct Indirect Total Direct Indirect Total Direct Indirect Total
Pandemic severity −0.065 −0.001 −0.066 - 0.011 0.011 - - -
Lockdown measures −0.626 −0.007 −0.633 - −0.101 −0.101 - - -
Socioeconomic and
−0.046 0.001 −0.045 0.847 0.007 0.855 −0.090 - −0.090
institutional factors
Social distancing - 0.011 0.011 −0.160 −0.002 −0.162 - - -
4. Discussion and Conclusions
COVID-19 has become a piercing issue and its numerous negative impacts on public health,
economy, lifestyle, and wellbeing of populations are striking policymakers to come up with some
solutions. To this end, this study provides significant contributions by empirically investigating the
root causes of the interplay between mobility changes, pandemic severity, and lockdown regimes in
88 countries in the early stage of the pandemic. To perform this study, data were collected from multiple
sources. An SEM was developed to find out the complex relationships among the observed variables
and latent dimensions. Results from the SEM exhibit that different lockdown measures have significant
repercussions to maintain social distancing. However, pandemic severity and socioeconomic and
institutional context factors have no significant impact to sustain social distancing practices. The results
also explain that socioeconomic and institutional context factors have significant effects on increasing
pandemic severity. Elderly people, globalization, and employment in the service sector are primarily
responsible for a higher number of coronavirus infection cases and deaths in many countries (e.g., USA,
UK, Italy, and Spain). Moreover, social distancing is reasonably able to reduce the severity of coronavirus
pandemic, although the impacts are marginal at the granularity of national populations (−0.162). It is
also understood that lockdown measures affect the socio-economic context of the countries along with
reducing the severity of the coronavirus pandemic. People are adjusting their lifestyle and travel
pattern to cope with the new circumstances. Individuals and industries are adopting new alternativeSustainability 2020, 12, 9101 12 of 17
strategies to keep pace with the global trend. New possibilities are emerging in the world (i.e., a greater
use of information and communication technologies in business and personal life) to flourish in a new
environment. Thus, it is surmised that this new normal situation is shaping the personal and business
world in such a way to keep moving and meet every demand of the people.
Several policy implications can be drawn from this analysis. An effective way to maintain
social distancing is to implement strict lockdown measures. Rather than putting into effect casual
stay-at-home recommendations and piecemeal efforts, comprehensive and strict lockdown measures
are indispensable to maintain social distancing that can reduce coronavirus infection cases and deaths
in a meaningful way. However, since globalization is a reality in the modern era, imposing strict
restrictions on people and freight movement within and outside country boundaries is detrimental to
the economy and to business partnership. Thus, alternative strategies (e.g., e-shopping, application of
information technology) should be undertaken by the authorities to ensure the safe transfer of the
people and freight from origin to destination and continue international trade during crisis times.
Despite making significant and timely contributions, the strengths of this study are bound by
a few cautionary remarks. First, the Google mobility report was prepared based on data collected
from Google account users who turned on their travel location history setting [38]. Thus, it may not
represent the true travel behaviors of the general population. More generally, the sway that data
quality may have on the conclusions of the analysis should not be brushed off. Data quality may
be a concern because health outcome variables are difficult to measure with good accuracy as the
pandemic unfolds. Furthermore, international studies are notoriously difficult to conduct due to the
heterogeneous adherence to data quality standards in different national contexts. Second, data were
collected from multiple sources and integrated to perform the analysis. Thus, it is very challenging to
make consensus and consistent policy decisions that can be applied generally. Thirdly, to deal with the
ambiguous definition of trips, a comparative analysis of essential versus non-essential travels can be
performed based on a recent dataset on changes in the visits to non-essential venues (e.g., restaurants,
department stores, and cinemas) published by Unacast [35]. Finally, this study has been conducted
at the coarse geographic resolution of countries. Thus, a future study at a finer scale would provide
more insights on the interplay between social distancing, pandemic severity, and lockdown regimes.
In addition, we propose to pursue further research at the interface of mobility changes, pandemic
severity, and lockdown regimes as the COVID-19 pandemic continues to afflict populations around the
globe. As more complete time series become available and as the pandemic will have eased into other
phases, the stability of our model, or alternatively its dynamic properties, will be critically important to
assess to better prepare the world for future pandemics under changing socio-politico-medical contexts.
However, this horizon maybe 6, 9, or even 12 months away. We believe the present analysis and results
achieved here have value as they stand, as they capture the reality of the pandemic a few months after
its global onset.
Author Contributions: Data curation, M.M.R., J.-C.T. and K.C.P.; Formal analysis, M.M.R., J.-C.T. and K.C.P.;
Investigation, M.M.R., J.-C.T. and K.C.P.; Methodology, M.M.R. and J.-C.T.; Software, M.M.R.; Supervision,
J.-C.T.; Validation, J.-C.T.; Visualization, M.M.R. and K.C.P.; Writing—original draft, M.M.R., J.-C.T. and K.C.P.;
Writing—review & editing, M.M.R., J.-C.T. and K.C.P. All authors have read and agreed to the published version
of the manuscript.
Funding: This research did not receive any specific funding from agencies in public, private,
and non-profit organizations.
Conflicts of Interest: The authors declare no conflict of interest. The authors are responsible for the contents of
this paper.Sustainability 2020, 12, 9101 13 of 17
Appendix A. List of Variables Tested in the Model
Table A1. Description of the variables considered in the study.
Variable Description Measure Source
l_case Total infection cases per 1 million population Cases/1M Worldometer
l_death Total deaths per 1 million population Deaths/1M Worldometer
Case_Mar20 Total number of infection cases on March 20 # Worldometer
Case_May15 Total number of infection cases on May 15 # Worldometer
Wcase_Pre Weekly change of infection cases before April 17 # Worldometer
Wcase_post Weekly change of infection cases after April 17 # Worldometer
Death_Mar20 Total number of deaths on March 20 # Worldometer
Death_May15 Total number of deaths on May 15 # Worldometer
Wdeath_Pre Weekly change of death counts before April 17 # Worldometer
Wdeath_post Weekly change of death counts after April 17 # Worldometer
Percentage change of mobility to retail and recreation
RR % Google
POIs compared to baseline
Percentage change of mobility to transit stations POIs
TS % Google
compared to baseline
Percentage change of mobility to workplaces
WP % Google
compared to baseline
Percentage change of time spent at home
RD % Google
compared to baseline
PODEN Population density Pop/km2 UN
MFR Male-female ratio Ratio UN
GDPGR Annual GDP growth rate % UN
GDPP GDP per capita $ UN
AE Percentage of population employed in agriculture % UN
IE Percentage of population employed in industry % UN
SE Percentage of population employed in services % UN
UR Percentage of unemployed people in the workforce % UN
CPI Consumer Price Index Index UN
HE Percentage of health expenditure to total GDP % UN
HP Number of physicians per 1000 population # UN
FA Percentage of forested areas to country land area % UN
Number of tourist/visitor arrivals at
Tourist # UN
national borders (000)
Average years of schooling (adults) and expected years
EI Index UNDP
of schooling (children)
Percentage of population aged 15 and above who can
LR % UNDP
read and/or write
Percentage of exports and imports of goods and
ExIm % UNDP
services to total GDP
Percentage of additional long-term and short-term
FDI % UNDP
capital of total GDP
Remit Percentage of earning by migrants to total GDP % UNDP
IU Percentage of people with access to the internet % UNDP
MU Mobile phone subscriptions per 100 people # UNDP
Ratio of difference between in-migrants and
MR out-migrants to the average population Ratio UNDP
per 1000 people
MA Median age of the people Year UNDP
Number of elderly (65 and older) per 100
DR Ratio UNDP
working age (15–64)
UR Percentage of people living in urban areas % UNDP
Temp Average temperature in April (DC: Degree Centigrade) DC Weatherbase
Rainfall Average precipitation in April Mm WeatherbaseSustainability 2020, 12, 9101 14 of 17
Table A1. Cont.
Variable Description Measure Source
DE1 Days elapsed since the lockdown to April 17 Days Different sources
Days elapsed between first case and imposing social
DE2 Days Different sources
distancing measures
PDI Power Distance Index Index Hofstede
IDV Individualism Versus Collectivism Index Hofstede
MAS Masculinity Versus Feminity Index Hofstede
UAI Uncertainty Avoidance Index Index Hofstede
Long Term Orientation versus Short Normative
LTO Index Hofstede
Orientation
IVR Indulgence Versus Restraint Index Hofstede
EFS Economic Freedom Score Score The Fraser Institute
KOF Swiss
KOFGI KOF Globalisation Index (2017) Index
Economic Institute
Regime Regime classification (2008) Type Xavier Marquez
Age in years of the current regime as classified
Agereg Year Xavier Marquez
by regime (2008)
FC Date of the first reported infection case Date Worldometer
LRL Localized recommended lockdown (1 = Yes, 0 = No) Dummy (1, 0) BBC
LL Localized lockdown (1 = Yes, 0 = No) Dummy (1, 0) BBC
NRL National recommended lockdown (1 = Yes, 0 = No) Dummy (1, 0) BBC
NL National lockdown (1 = Yes, 0 = No) Dummy (1, 0) BBC
Asia Country located in Asia continent (1 = Yes, 0 = No) Dummy (1, 0) Wikipedia
Africa Country located in Africa continent (1 = Yes, 0 = No) Dummy (1, 0) Wikipedia
Europe Country located in Europe continent (1 = Yes, 0 = No) Dummy (1, 0) Wikipedia
Country located in North America continent
North America Dummy (1, 0) Wikipedia
(1 = Yes, 0 = No)
Country located in South America continent
South America Dummy (1, 0) Wikipedia
(1 = Yes, 0 = No)
Country located in Australia continent
Australia Dummy (1, 0) Wikipedia
(1 = Yes, 0 = No)
ME Country located in Middle East (1 = Yes, 0 = No) Dummy (1, 0) Wikipedia
Closing of schools and universities (1 = required
SC Dummy (1, 0) Oxford University
closing, 0 = no measure/recommended closing)
Closing of workplaces (1 = required closing, 0 = no
WPC Dummy (1, 0) Oxford University
measure/recommended closing)
Cancellation of public events (1 = required canceling,
CPE Dummy (1, 0) Oxford University
0 = no measure/recommended canceling)
Restriction on gatherings (1 = restriction on
gathering-less than 100 people, 0 = no
RG Dummy (1, 0) Oxford University
restrictions/restriction on very large gathering-above
100 people)
Closing of public transport (1 = required closing,
CPT Dummy (1, 0) Oxford University
0 = no measure/recommended closing)
Stay-at-home order (1 = required not to leave, 0 = no
SH Dummy (1, 0) Oxford University
measure/recommended not to leave)
Restriction on internal movement between
RIM cities/regions (1 = required not to travel, 0 = no Dummy (1, 0) Oxford University
measure/recommended not to travel)
Restriction on international travel (1 = ban/quarantine
RIT Dummy (1, 0) Oxford University
arrivals, 0 = no restriction/screening arrivals)
Direct cash payments to people who lose their jobs or
CP cannot work (1 = income support from govt., 0 = no Dummy (1, 0) Oxford University
income supportSustainability 2020, 12, 9101 15 of 17
Table A1. Cont.
Variable Description Measure Source
Freezing financial obligations for households
FO Dummy (1, 0) Oxford University
(1 = debt/contract relief, 0 = no measures)
ES Announced economic stimulus spending $ Oxford University
Public campaigns (1 = public information campaign,
PIC Dummy (1, 0) Oxford University
0 = public officials urging caution)
Testing policy (1 = comprehensive testing policy,
TP Dummy (1, 0) Oxford University
0 = no/limited testing policy)
Contact testing after positive diagnosis
CT (1 = comprehensive testing policy, 0 = no/limited Dummy (1, 0) Oxford University
testing policy)
Short term spending on healthcare system
EIH $ Oxford University
(e.g., hospitals, masks)
IV Public spending on Covid-19 vaccine development $ Oxford University
Government Response Stringency Index (0 to 100,
SI Index Oxford University
100 = strictest)
AGE65 Percentage of population aged 65 and older % Oxford University
AGE70 Percentage of population aged 70 and older % Oxford University
DB Percentage of people with diabetes % Oxford University
FS Percentage of female smokers % Oxford University
MS Percentage of male smokers % Oxford University
HB Hospital beds per 1000 people Beds/1k people Oxford University
PD Presidential democracy Dummy (1, 0) Oxford University
SPD Mixed (semi-presidential) democracy Dummy (1, 0) Oxford University
ParD Parliamentary democracy Dummy (1, 0) Oxford University
CD Civilian dictatorship Dummy (1, 0) Oxford University
MD Military dictatorship Dummy (1, 0) Oxford University
RD Royal dictatorship Dummy (1, 0) Oxford University
References
1. Worldometer. Reported Cases and Deaths by Country, Territory, or Conveyance. Available online:
https://www.worldometers.info/coronavirus/#countries (accessed on 30 April 2020).
2. CDC. New ICD-10-CM code for the 2019 Novel Coronavirus (COVID-19); CDC: Atlanta, Georgia, USA, 2020.
3. Hopkins, J. COVID-19 Dashboard Johns Hopkins Coronavirus Resource Center. Available online: https:
//coronavirus.jhu.edu/map.html (accessed on 30 April 2020).
4. Evans, O. Socio-economic impacts of novel coronavirus: The policy solutions. Bizecons Q. 2020, 7, 3–12.
5. Ritchie, E.O.-O.H.; Beltekian, D.; Mathieu, E.; Hasell, J.; Macdonald, B.; Giattino, C.; Roser, M. Coronavirus
(COVID-19) Cases. Available online: https://ourworldindata.org/coronavirus (accessed on 30 April 2020).
6. Abodunrin, O.; Oloye, G.; Adesola, B. Coronavirus pandemic and its implication on global economy. Int. J.
Arts Lang. Bus. Stud. 2020, 4, 13–23.
7. Craig, A.T.; Heywood, A.E.; Hall, J. Risk of COVID-19 importation to the Pacific islands through global air
travel. Epidemiol. Infect. 2020, 148, e71. [CrossRef] [PubMed]
8. Ma, T.; Heywood, A.; MacIntyre, C.R. Travel health risk perceptions of Chinese international students in
Australia—Implications for COVID-19. Infect. Dis. Health 2020. [CrossRef]
9. Igwe, P.A. Coronavirus with Looming Global Health and Economic Doom; African Development Institute of
Research Methodology: Enugu North, Nigeria, 2020.
10. Samuel, J.; Ali, G.G.M.N.; Rahman, M.M.; Esawi, E.; Samuel, Y. COVID-19 Public Sentiment Insights and
Machine Learning for Tweets Classification. Information 2020, 11, 314. [CrossRef]
11. Samuel, J.; Rahman, M.; Ali, G.; Samuel, Y.; Pelaez, A. Feeling Like It is Time to Reopen Now? COVID-19 New
Normal Scenarios based on Reopening Sentiment Analytics. IEEE Access 2020, 8, 142173–142190. [CrossRef]
12. Rahman, M.; Ali, G.; Li, X.J.; Paul, K.C.; Chong, P.H. Twitter and Census Data Analytics to Explore
Socioeconomic Factors for Post-COVID-19 Reopening Sentiment. arXiv 2020, arXiv:2007.00054. [CrossRef]
13. Ayittey, F.K.; Ayittey, M.K.; Chiwero, N.B.; Kamasah, J.S.; Dzuvor, C. Economic impacts of Wuhan 2019-nCoV
on China and the world. J. Med. Virol. 2020, 92, 473–475. [CrossRef] [PubMed]Sustainability 2020, 12, 9101 16 of 17
14. Iacus, S.M.; Natale, F.; Satamaria, C.; Spyratos, S.; Vespe, M. Estimating and Projecting Air Passenger Traffic
during the COVID-19 Coronavirus Outbreak and its Socio-Economic Impact. arXiv 2020, arXiv:2004.08460.
[CrossRef]
15. Long, H.; Dam, A.V. U.S. Unemployment Rate Soars to 14.7 Percent, the Worst Since the Depression Era.
The Washington Post. Available online: https://www.washingtonpost.com/business/2020/05/08/april-2020-
jobs-report/?utm_campaign=wp_post_most&utm_medium=email&utm_source=newsletter&wpisrc=nl_
most. (accessed on 8 May 2020).
16. Economics, T. United States Unemployment Rate: 2021–2022 Forecast. Available online:
https://tradingeconomics.com/united-states/unemployment-rate#:~{}:text=In%20the%20long%2Dterm%
2C%20the,according%20to%20our%20econometric%20models (accessed on 30 April 2020).
17. Sherman, E. Fortune 2020. In Fortune; Fortune Media Group Holdings: New York, NY, USA, 2020; p. 2020.
18. Ivanov, D. Predicting the impacts of epidemic outbreaks on global supply chains: A simulation-based
analysis on the coronavirus outbreak (COVID-19/SARS-CoV-2) case. Transp. Res. Part E: Logist. Transp. Rev.
2020, 136, 101922. [CrossRef] [PubMed]
19. Liu, H.; Bai, X.; Shen, H.; Pang, X.; Liang, Z.; Liu, Y. Synchronized Travel Restrictions across Cities can be
Effective in COVID-19 Control. medRxiv 2020. [CrossRef]
20. Zheng, R.; Xu, Y.; Wang, W.; Ning, G.; Bi, Y. Spatial transmission of COVID-19 via public and private
transportation in China. Travel Med. Infect. Dis. 2020, 101626. [CrossRef] [PubMed]
21. Adekunle, A.I.; Meehan, M.; Alvarez, D.R.; Trauer, J.; McBryde, E. Delaying the COVID-19 epidemic in
Australia: Evaluating the effectiveness of international travel bans. medRxiv 2020. [CrossRef] [PubMed]
22. Bryant, P.; Elofsson, A. Estimating the Impact of Mobility Patterns on COVID-19 Infection Rates in 11 European
Countries. Medrxiv 2020. [CrossRef]
23. Flaxman, S.; Mishra, S.; Gandy, A.; Unwin, H.J.T.; Mellan, T.A.; Coupland, H.; Whittaker, C.; Zhu, H.;
Berah, T.; Eaton, J.W. Estimating the effects of non-pharmaceutical interventions on COVID-19 in Europe.
Nature 2020, 584, 257–261. [CrossRef]
24. Fang, H.; Wang, L.; Yang, Y. Human Mobility Restrictions and the Spread of the Novel Coronavirus (2019-nCoV) in
China; 26906; National Bureau of Economic Research: Cambridge, MA, USA, 2020.
25. Aleta, A.; Hu, Q.; Ye, J.; Ji, P.; Moreno, Y. A data-driven assessment of early travel restrictions related to the
spreading of the novel COVID-19 within mainland China. medRxiv 2020. [CrossRef]
26. Anzai, A.; Kobayashi, T.; Linton, N.M.; Kinoshita, R.; Hayashi, K.; Suzuki, A.; Yang, Y.; Jung, S.-m.; Miyama, T.;
Akhmetzhanov, A.R.; et al. Assessing the Impact of Reduced Travel on Exportation Dynamics of Novel
Coronavirus Infection (COVID-19). J. Clin. Med. 2020, 9, 601. [CrossRef]
27. Chang, M.-C.; Kahn, R.; Li, Y.-A.; Lee, C.-S.; Buckee, C.O.; Chang, H.-H. Modeling the impact of human
mobility and travel restrictions on the potential spread of SARS-CoV-2 in Taiwan. medRxiv 2020. [CrossRef]
28. Chinazzi, M.; Davis, J.T.; Ajelli, M.; Gioannini, C.; Litvinova, M.; Merler, S.; Piontti, A.P.y.; Mu, K.; Rossi, L.;
Sun, K.; et al. The effect of travel restrictions on the spread of the 2019 novel coronavirus (COVID-19)
outbreak. Science 2020, 368, 395–400. [CrossRef]
29. Devi, S. Travel restrictions hampering COVID-19 response. Lancet 2020, 395, 1331–1332. [CrossRef]
30. Jin, H.; Liu, J.; Cui, M.; Lu, L. Novel coronavirus pneumonia emergency in Zhuhai: Impact and challenges.
J. Hosp. Infect. 2020, 104, 452–453. [CrossRef]
31. Linka, K.; Peirlinck, M.; Costabal, F.S.; Kuhl, E. Outbreak dynamics of COVID-19 in Europe and the effect of
travel restrictions. Comput. Methods Biomech. Biomed. Eng. 2020, 1–8. [CrossRef] [PubMed]
32. Qiu, Y.; Chen, X.; Shi, W. Impacts of social and economic factors on the transmission of coronavirus disease
(COVID-19) in China. Medrxiv 2020. [CrossRef]
33. Tian, H.; Li, Y.; Liu, Y.; Kraemer, M.; Chen, B.; Cai, J.; Li, B.; Xu, B. Early evaluation of the Wuhan City travel
restrictions in response to the 2019 novel coronavirus outbreak. Medrxiv 2020, 7. [CrossRef]
34. Jittrapirom, P.; Tanaksaranond, G. An Exploratory Survey on the Perceived Risk of COVID-19 and Travelling;
SocArXiv, University of Maryland: College Park, MD, USA, 2020.
35. Engle, S.; Stromme, J.; Zhou, A. Staying at Home: Mobility Effects of COVID-19. SSRN J. 2020. [CrossRef]
36. Gao, S.; Rao, J.; Kang, Y.; Liang, Y.; Kruse, J. Mapping County-Level Mobility Pattern Changes in
the United States in Response to COVID-19. SSRN J. 2020. [CrossRef]
37. Rodríguez-Morales, A.J.; MacGregor, K.; Kanagarajah, S.; Patel, D.; Schlagenhauf, P. Going global–Travel
and the 2019 novel coronavirus. Travel Med. Infect. Dis. 2020, 33, 101578. [CrossRef]You can also read