Southwestern US 2020 Wildfire Season: An Overview - JULY 2021
←
→
Page content transcription
If your browser does not render page correctly, please read the page content below
2020 Wildfire Season: An Overview

Southwestern US
          J U LY 2 0 2 1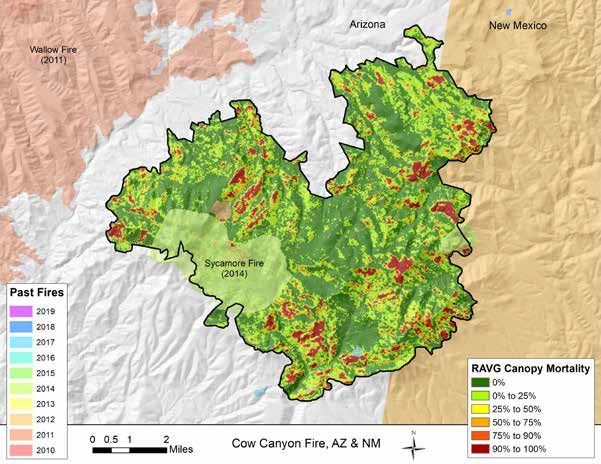
Intermountain West Frequent-fire Forest Restoration
Ecological restoration is a practice that seeks to heal degraded ecosystems by
reestablishing native species, structural characteristics, and ecological processes.
The Society for Ecological Restoration International defines ecological restoration
as “an intentional activity that initiates or accelerates the recovery of an ecosystem
with respect to its health, integrity and sustainability….Restoration attempts to
return an ecosystem to its historic trajectory” (Society for Ecological Restoration
International Science & Policy Working Group 2004).
Most frequent-fire forests throughout the Intermountain West have been degraded
during the last 150 years. Many of these forests are now dominated by unnaturally
dense thickets of small trees, and lack their once diverse understory of grasses, sedges,
and forbs. Forests in this condition are highly susceptible to damaging, stand-replacing
fires and increased insect and disease epidemics. Restoration of these forests centers on
reintroducing frequent, low-severity surface fires—often after thinning dense stands—
and reestablishing productive understory plant communities.
The Ecological Restoration Institute at Northern Arizona University is a pioneer in
researching, implementing, and monitoring ecological restoration of frequent-fire forests
of the Intermountain West. By allowing natural processes, such as low-severity fire,
to resume self-sustaining patterns, we hope to reestablish healthy forests that provide
ecosystem services, wildlife habitat, and recreational opportunities.
The Southwest Fire Science Consortium (SWFSC) is a way for managers, scientists,
and policy makers to interact and share science. SWFSC’s goal is to see the best available
science used to make management decisions and scientists working on the questions
managers need answered. The SWFSC tries to bring together localized efforts to develop
scientific information and to disseminate that to practitioners on the ground through
an inclusive and open process.
Authors: Michael Lynch and Alexander Evans
Reviewers: Barb Satink Wolfson, Southwest Fire Science Consortium/Northern Arizona University; Richard Naden,
National Park Service; and Margaret Hangan Kaibab National Forest, USDA Forest Service
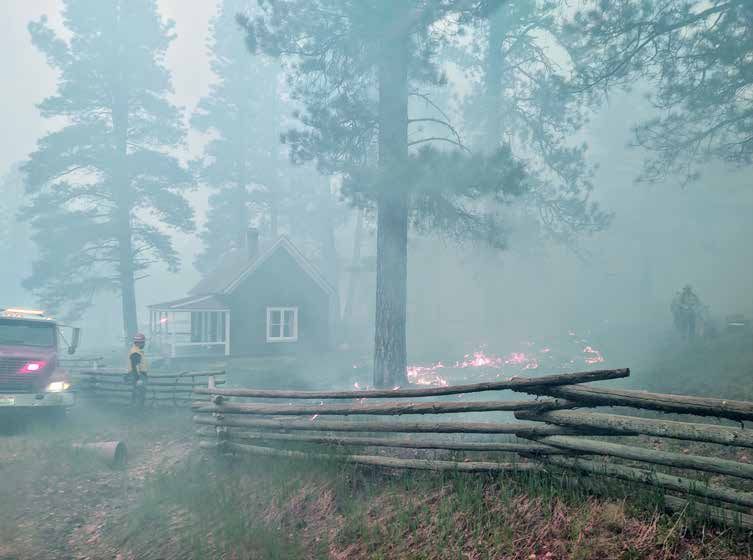
Cover photo: The Mangum Fire burned for 46 days and covered 71,450 acres on the Kaibab Plateau near the North Rim of
Grand Canyon National Park. Fire managers used a full suppression approach, which allowed for some point protection of
infrastructure like the historic Jacob Lake Ranger Station featured in this photo. Photo courtesy of the Kaibab National Forest,
USDA Forest Service
Please use the following citation when referring to this report:
Lynch, M., and A. Evans. 2021. 2020 Wildfire Season: An Overview, Southwestern US. Special Report. Ecological
Restoration Institute and Southwest Fire Science Consortium, Northern Arizona University. 18 p.
Northern Arizona University is an Equal Opportunity/Affirmative Action Institution.
This report was funded by a grant from the USDA Forest Service.
In accordance with Federal law and U.S. Department of Agriculture policy, this institution is prohibited from discriminating on the
basis of race, color, national origin, sex, age, or disability. (Not all prohibited bases apply to all programs.)
To file a complaint of discrimination, write USDA, Director, Office of Civil Rights, Room 326-W, Whitten Building, 1400
Independence Avenue, SW, Washington, DC 20250-9410 or call (202) 720-5964 (voice and TDD). USDA is an equal opportunity
provider and employer.
2020 WILDFIRE SEASON: AN OVERVIEW / SOUTHWESTERN US Ecological Restoration Institute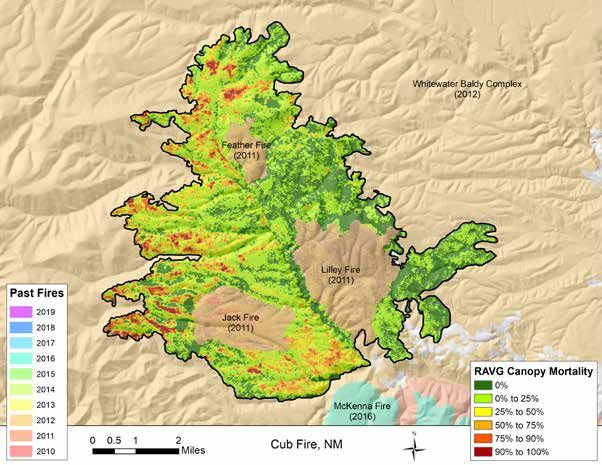
Table of Contents
Introduction................................................ 1

Wildfire Management................................ 1

The 2020 Fire Season................................. 1

Regional Context ....................................... 2

Data Sources............................................... 3

Bush Fire, Arizona...................................... 5

Bighorn Fire, Arizona................................. 6

Mangum Fire, Arizona................................ 7

Griffin Fire, Arizona.................................... 8

Cow Canyon Fire, Arizona......................... 9

Blue River Fire, Arizona............................ 10

Valley Fire, Arizona................................... 11

Blue River 2 Fire, Arizona......................... 11

Cub Fire, New Mexico.............................. 12

Luna Fire, New Mexico............................ 13

Medio Fire, New Mexico.......................... 14

Conclusion................................................. 15

Appendix I. Fire Statistics........................ 18
Introduction                                                                Wildland fire management strategies are based on a thoughtful
                                                                            and systematic risk-based approach that considers firefighter
Wildfire is part of the landscape in the Southwest. It can
                                                                            and public safety, cause of the wildfire, location, existing land
be a threat to lives and property, but it is also crucial to
                                                                            management plans, availability of resources, values at risk, and
maintaining healthy ecosystems. Plant communities in the
                                                                            social and economic factors. Federal policy dictates that “initial
Southwest are adapted to fire. For example, ponderosa pine
                                                                            action on human-caused wildfire will be to suppress the fire.” 2
forests need regular, low-severity fires to remain healthy. Over
                                                                            The same federal policy allows naturally ignited wildfires (or
decades without fire on the landscape, fuel loads accumulated
                                                                            parts of wildfires) to be managed for resource benefits, such as
and facilitated more intense, high-severity fire. Each fire is
                                                                            mitigating fuel loads to reduce the risk of high-severity fire,
different, and while some burn in ways that increase ecosystem
                                                                            enhancing wildlife habitat, improving watershed health, and
resilience, others burn with greater severity than forests are
                                                                            reducing risk to neighboring communities. Though multiple
adapted to, killing even the toughest trees and threatening lives
                                                                            strategies are used to manage wildfires, it is important to
and homes. Weather, climate, vegetation type, fuel conditions,
                                                                            note that federal agencies only recognize two types of fires:
and topography all influence how an individual wildfire burns
                                                                            prescribed fire (planned) and wildfire (unplanned).
on the landscape and whether it has beneficial effects. Some
fires will leave many unburned patches, creating a mosaic burn
pattern, whereas others will burn more contiguously.                        The 2020 Fire Season
                                                                            In 2020, wildfire burned 1,068,373 acres in the Southwest
This report is the eighth in a series of annual overviews
                                                                            (Arizona and New Mexico), which is greater than the average
available from the Southwest Fire Science Consortium and
                                                                            number of acres burned annually in these two states over the
the Ecological Restoration Institute. The goal of this overview
                                                                            previous ten-year period.” Arizona had significantly more
is to provide a concise summary of the fire season and to
                                                                            wildfire (929,522 acres) than its ten-year average (305,623 acres),
facilitate comparison with past fires and fire seasons. It follows
                                                                            while New Mexico had fewer acres of wildfire (138,851 acres)
the format of past years’ overviews1 and describes the impacts
                                                                            than its ten-year average (299,773 acres). Unplanned human
of the nine wildfires over 25,000 acres in Arizona and New
                                                                            ignitions made up 28 percent and 12 percent of wildfire acres in
Mexico in 2020. Also included are two wildfires in New
                                                                            Arizona and New Mexico respectively (though these estimates
Mexico worthy of note. As described in the main report, the
                                                                            excluded wildfires with an unknown cause) (Figure 1).
Medio Fire provides a useful example of fuel reduction efficacy
in a high-value watershed. The Luna Fire is notable because
                                                                            In 2020, wildfires over 100 acres represented 98 percent of the
of its late start date, October 17. As in previous overviews, this
                                                                            total acreage burned by wildfire in Arizona and New Mexico.
report covers when each fire burned, fire management costs,
                                                                            In 2019, the Southwest Coordination Center recorded the
vegetation types, previous burn footprints, and burn severity,
                                                                            strategies managers employed for wildfires, but that data was not
where available. The conclusion section summarizes these same
                                                                            available in 2020. During the fall and winter of 2019, managers
measures for the large wildfires in the region and touches on
                                                                            were on track for a successful prescribed fire season. For example,
how these fires burned in proximity to human communities.
                                                                            the US Forest Service had completed 60,396 acres of prescribed
                                                                            burning in Arizona and New Mexico between October and
Wildfire Management                                                         end of December 2019. Then, during 2020, the COVID-19
                                                                            pandemic hit and made prescribed fire and all fire management
Managers can approach each wildfire with multiple objectives
                                                                            more difficult. COVID-19 caused the temporary suspension of
that range from managing the wildfire for public safety to
                                                                            prescribed fires on many jurisdictions to reduce smoke impacts
managing the fire to benefit natural resources. Federal wildland
                                                                            on people at risk from COVID-19 and to reduce transmission
fire management policy states:
                                                                            among fire personnel. Fire management strategies focused on
                                                                            rapid suppression to avoid extended exposure to smoke or spread
     “Response to wildland fires is based on
                                                                            of COVID-19. In an April 3, 2020 letter, the Chief of the US
     ecological, social and legal consequences of the
                                                                            Forest Service identified objectives to respond to wildfires during
     fire. The circumstances under which a fire occurs,
                                                                            the pandemic including:
     and the likely consequences on firefighter and
     public safety and welfare, natural and cultural
                                                                            •     Minimize to the extent feasible COVID-19 exposure and
     resources, and, values to be protected, dictate the
                                                                                  transmission and smoke exposure to firefighters and com-
     appropriate response to the fire.”2
                                                                                  munities;
                                                                            •     Prioritize the use of local suppression resources with the
A full range of wildland fire response strategies may be
                                                                                  predominant strategy being rapid containment; and
employed to meet these objectives, including containing,
                                                                            •     Commit resources only when there is a reasonable expec-
confining, or suppressing the wildfire. The national Incident
                                                                                  tation of success in protecting life and critical property and
Management Situation Report identifies the percentage of each
                                                                                  infrastructure.
fire managed with a monitor, confine, point zone protection,
or suppression strategy. This report compiles these figures to
                                                                            The COVID-19 pandemic led to significant changes to fire
better explain how fires were managed in 2020.
                                                                            management that are beyond the scope of this report. The
                                                                            Wildland Fire Lessons Learned Center compiled many of the
1 2019, 2018, 2017, 2016, 2015, 2014, and 2013 Wildfire Season: An Over-    pandemic impacts in a Coronavirus Lessons Summary.3
  view, Southwestern U.S.
  https://cdm17192.contentdm.oclc.org/digital/collection/p17192coll1/
  id/877/rec/3
2 Guidance for Implementation of Federal Wildland Fire Management Policy,
  2009 https://www.doi.gov/sites/doi.gov/files/uploads/2009-wfm-guid-       3 Lessons Learned Center https://www.wildfirelessons.net/orphans/view-
  ance-for-implementation.pdf                                                 incident?DocumentKey=1d838a70-f78c-4c47-a949-bde579427760

Ecological Restoration Institute                                                2020 WILDFIRE SEASON: AN OVERVIEW / SOUTHWESTERN US              1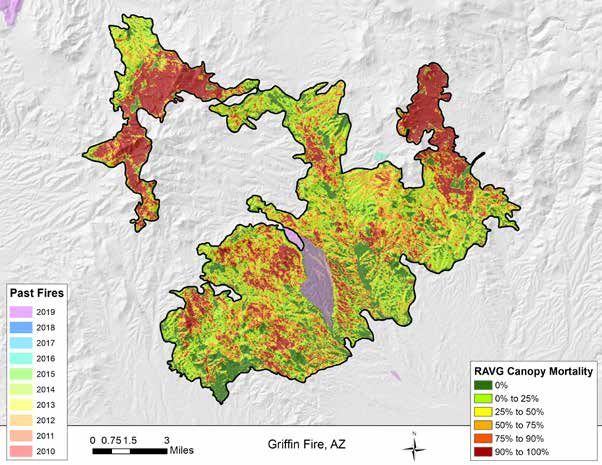
Figure 1. Wildfire and prescribed fire acres burned in Arizona and New Mexico, 2002 to 2020.4

                      Figure 2. Map indicating the location of the 11 large fires in 2020 analyzed in this report. Note the Blue River 2
                      Fire is not labeled on the map but is located adjacent to the Blue River Fire.

                                                                                   growth of fine fuels. Snowpack was less than 50 percent of the
This overview focuses on the 11 large fires, which include eight                   long-term median. Spring 2020 precipitation was sufficient
Arizona fires: Bush, Bighorn, Mangum, Griffin, Cow Canyon,                         to encourage growth of fine fuels toward average levels. Fuel
Blue River, Valley, and Blue River 2; and three New Mexico                         moistures for 100-hour fuels were below five percent in the
fires: Cub, Luna, and Medio. The 11 large fires in this report                     southern half of the region and less than ten percent in the
represent 57 percent of the acres burned by wildfire in 2020                       northern half at the beginning of fire season in May. Even
(Figure 2).                                                                        1,000-hour fuels had less than ten percent moisture in June.
                                                                                   Strong wind events combined with these low fuel moistures
                                                                                   and persistent hot and dry conditions facilitated large fires
                                                                                   across the Southwest. Monsoons started later than usual across
Regional Context                                                                   the Southwest. Due to the late onset and lack of significant
Northeast Arizona and northwest New Mexico were in severe                          precipitation in Arizona, much of the state remained at below
drought in early 2020. The Southwest had well below average                        normal precipitation with above normal temperatures through
precipitation through the winter and spring. Poor precipitation                    the summer. Persistent circulation anomalies during summer
in the second half of 2019 led to reduced fine fuel growth                         caused an abnormally inactive monsoon season with notable
and below normal carryover of warm-season fine fuels.5                             northerly component winds in the low-mid levels of the
However, the 2019–2020 winter was wetter than average in                           atmosphere. In fact, the wider Southwest (including California)
the southern part of the region and facilitated above normal                       had the warmest and driest July–September period on record.6

4 National Interagency Coordination Center Wildland Fire Annual                    6 Center for Western Weather and Water Extremes https://cw3e.ucsd.
  Reports www.predictiveservices.nifc.gov/intelligence/intelligence.htm              edu/2020-north-american-monsoon-recap/
5 https://www.drought.gov/news/2020-us-fire-outlook

2    2020 WILDFIRE SEASON: AN OVERVIEW / SOUTHWESTERN US                                                                     Ecological Restoration Institute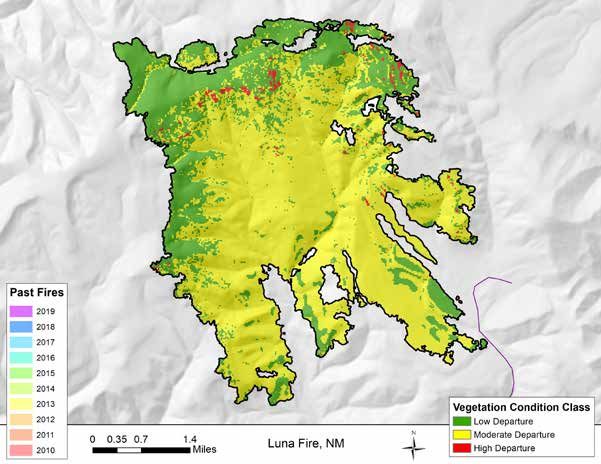
Figure 3. Energy release component (ERC)
                                                                                                 index for the 2020 fire season in northern New
                                                                                                 Mexico. Note the elevated ERCs at the start of
                                                                                                 the Luna Fire (black circle).

This unusually warm and dry summer exacerbated existing                   strategic objectives often change during a fire, review of the
drought conditions. Upper-level ridging over California and               most common or persistent strategic objectives for each fire
the Southwest led to well below normal precipitation and above            provides some insight into the overarching management goals.
normal temperatures during October.
                                                                          Perimeters
The composite statewide Energy Release Component (ERC)                    Boundaries for each fire were taken from the Geospatial Multi-
was about average until August when it increased to the                   Agency Coordination (GeoMAC) archive of fire perimeter
observed maximum. In October, the region-wide ERC spiked                  maps (rmgsc.cr.usgs.gov/outgoing/GeoMAC/). GeoMAC
well above the previous maximum. The ERC is an index that                 also provides perimeters of fires dating back to 2000, which
estimates potential available energy released per unit area in            provided a historic context for 2020 fires.
the flaming front of a fire based on the fuel model and live and
dead fuel moistures. The ERC is often used to track seasonal              Vegetation
fire danger focused on fuel loading, woody fuel moistures, and            Basic information about vegetation and topography of burned
larger fuel moistures. A graph of ERC from northern New                   areas was available from LANDFIRE (www.landfire.gov).
Mexico shows the 2020 fire season (blue line) in comparison to            LANDFIRE provides nationally consistent, scientifically based
the ten-year average (gray line) and ten-year maximums (red               maps of existing vegetation as well as Vegetation Condition
line) (Figure 3).7                                                        Class (VCC). Vegetation Condition Class displays how
                                                                          existing vegetation has departed from estimated natural or
                                                                          historic condition. In the Southwest, this departure is generally
                                                                          due to fire exclusion, past logging and grazing and results in
Data Sources                                                              greater density of trees and less healthy conditions. Vegetation
Management, Objectives, and Cost                                          Condition Class is a useful metric because it integrates
The InciWeb website (inciweb.nwcg.gov) provides background                information on existing vegetation, historic vegetation, and fire
information on most large fires such as location and start date.          regimes into one variable and has been used to help determine
InciWeb is an interagency information management system                   where to focus restoration efforts. The most current VCC maps
designed to provide the public with a single source of incident-          (2016) were used in this report.
related information. Because InciWeb only sporadically
reports costs, Incident Status Summary (ICS-209) reports                  Soil Burn Severity
were collected to document suppression or management                      Soil burn severity maps provide Burned Area Emergency
costs. These costs do not reflect any post-fire costs such as             Response (BAER) teams a tool to quantify soil impacts and
rehabilitation or soil stabilization. The cost data from each fire        assess potential for post-fire erosion (https://fsapps.nwcg.gov/
is collected in a final table at the end of the document. Incident        baer/baer-imagery-support-data-download). In the immediate
Status Summaries also provide “strategic objectives,” which               aftermath of fire on federal lands, BAER teams perform an
briefly describe the desired outcome for the incident, high-              emergency assessment of post-fire soil conditions based on a
level objectives, and in some cases, strategic benefits. Though           combination of field observations and remote sensing change
                                                                          detection products derived from the differenced Normalized
7 http://gacc.nifc.gov/swcc//predictive/fuels_fire-danger/nfdrs_charts/   Burn Ratio (dNBR). The dNBR measures change in the ratio
  Areawide.htm                                                            of near infrared reflected by healthy green vegetation to the

Ecological Restoration Institute                                           2020 WILDFIRE SEASON: AN OVERVIEW / SOUTHWESTERN US                    3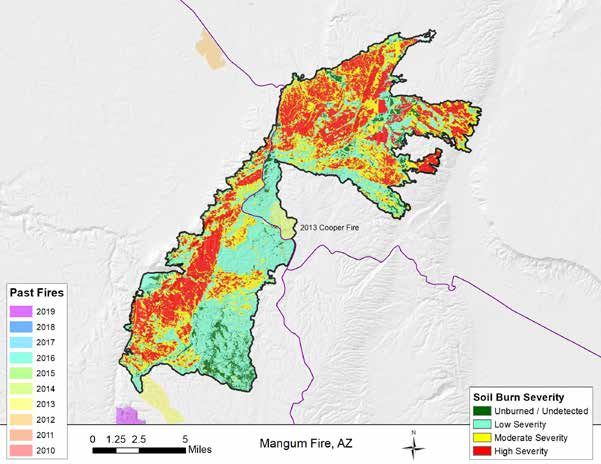
shortwave infrared reflected by bare soil and rock. Most soil     While soil burn severity maps and RAVG canopy mortality
burn severity maps have four classes: high, moderate, low, and    maps use similar satellite change detection methods, they
unburned; however, some maps combine the last two categories      measure fundamentally different forest attributes. In many
into a “low/unchanged” category. The distribution of soil burn    areas, canopy mortality and soil burn severity patterns are
severity is included in the individual fire discussions (where    similar. However, in some vegetation types, such as chaparral or
available) as well as in the final summary table.                 grass, it is possible for a fire to cause complete canopy mortality
                                                                  with little effect on soils.
Rapid Assessment of Vegetation Condition after Wildfire
Rapid Assessment of Vegetation Condition after Wildfire           Caveats
(RAVG) maps estimate canopy mortality (https://fsapps.            There are important caveats for all data used in this summary.
nwcg.gov/ravg/). The USDA Forest Service Remote                   First, the fire information presented here was taken from
Sensing Applications Center provides RAVG analysis as a           official sources between November 2020 and January 2021 and
first approximation of areas that may require reforestation       may not include updates or revisions. Second, the geospatial
treatments because of canopy killed by high-severity fire.        data used to generate the maps and tables are also based on
RAVG maps are created for wildfires that burn greater than        the best available information, however these data contain
1,000 acres of wooded Forest Service land or fires for which      errors and uncertainties. For example, the remote sensing data
it is requested. The maps are produced by measuring the           used in all these datasets can include errors introduced during
change between a satellite image before and immediately           collection, processing, and interpretation. As noted for specific
after a wildfire using an algorithm called relative differenced   fires in this report, soil burn severity and RAVG maps are not
Normalized Burn Ratio (RdNBR), which is sensitive to              available for every wildfire.
vegetation mortality resulting from the wildfire event. The
RdNBR is derived directly from the dNBR but is more
sensitive to vegetation mortality than the dNBR.

4   2020 WILDFIRE SEASON: AN OVERVIEW / SOUTHWESTERN US                                               Ecological Restoration Institute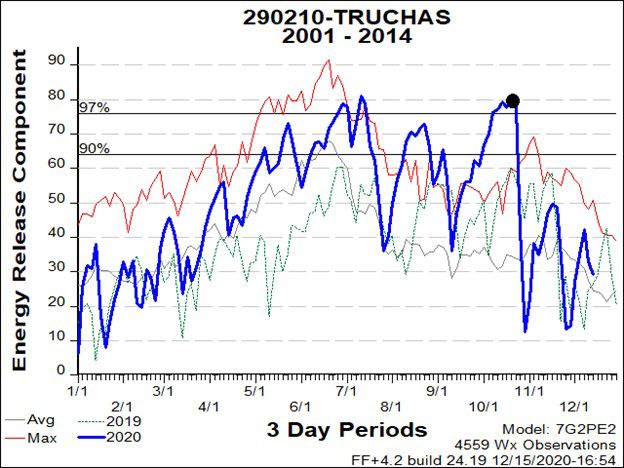
Figure 4. RAVG canopy mortality in the Bush Fire burn area.

Bush Fire, Arizona
The Bush Fire was a human-caused wildfire that started in                        this fire was abundant, fully cured, invasive and native grasses
the Tonto National Forest northeast of Phoenix, Arizona.                         present at all elevations in nearly all habitat types.
The fire started on June 13, 2020 near the intersection of
Bush Highway and SR 87 and burned 193,455 acres before                           Most of the area affected by the Bush Fire had not burned in
it was fully contained on July 6, 2020. This was the largest                     the past ten fire seasons, however fire return intervals of most
fire in Arizona or New Mexico during the 2020 season and                         vegetation types within the fire perimeter are significantly
the fifth-largest wildfire in Arizona history. The Bush Fire                     longer than ten years. There were only three relatively small
presented numerous challenges with rugged terrain, extreme                       fires in this area over this period: 2014 Browns (900 acres),
weather, and an abundance of dry invasive grasses coupled with                   2015 Peters (650 acres), and 2016 Peaks (850 acres). The
the operational challenges around COVID-19 concerns. The                         124,000-acre Woodbury Fire of 2019 was just a few miles
fire was approached by fire managers with a full suppression                     southeast of the Bush Fire. Arizona State Highway 188 served
approach according to the 209 report, using a values-driven                      as the primary boundary along the fires 30-mile eastern edge
strategy, incorporating a mix of tactics (direct and indirect)                   while State Highway 87 served the same function on its 35-
when and where the probability of success was high, and the                      mile western boundary.
risk was acceptable in relationship to the values. Suppression
tactics were more active outside the designated wilderness areas                 All but a few scattered acres within the Bush Fire perimeter
with confine and monitor tactics utilized inside the wilderness.                 were classified as low (88 percent) or moderate (11 percent)
                                                                                 departure from historic vegetation conditions according to the
Nearly 2,000 civilians were evacuated from their homes in                        LANDFIRE Vegetation Condition Class analysis. Per Tonto
response to the Bush Fire. Despite these evacuations and                         National Forest staff, LANDFIRE data for the area within the
the fire’s proximity to metropolitan Phoenix only one non-                       fire perimeter greatly underestimated the presence of invasive
residential commercial property was damaged and no structures                    grasses, therefore departure from historic vegetation conditions
were lost. Arizona State Highways 87 and 188 were closed                         percentages are likely inaccurate.
during the fire in addition to several smaller roads. No injuries
or illnesses to responders were reported during on the Bush                      Fire Severity
Fire. Wildfire management costs associated with the Bush Fire                    The RAVG analysis indicated a relatively even distribution of
were estimated at $11.6 million, or about $60 per acre.                          acres across the canopy mortality categories with 19 percent
                                                                                 showing more than 90 percent mortality and 18 percent showing
Vegetation and Past Fires                                                        zero percent canopy mortality (Figure 4). The Bush Fire primarily
The primary vegetation types included scrub (25 percent),                        burned through vegetation types with relatively low canopy
grass (23 percent), chaparral (19 percent), and piñon-juniper                    heights, and canopy mortality in these vegetation types can be
(12 percent). The scrub type often includes the iconic saguaro                   less informative on fire severity than other vegetation types but
cactus, which is not fire adapted. Notably, there were also small                can provide information on the variability across the burn area.
patches of ponderosa pine on high elevation north-facing                         The Sonoran Desert and semi-desert grassland ecosystem types
slopes and drainages. Nineteen percent of the area within the                    in the Bush Fire footprint exhibited poor soil conditions before
Bush Fire perimeter was classified as non-vegetated. Although                    the fire. This made the soil burn severity analysis, which is based
LANDFIRE only classified 23 percent of the burned area as                        on change in condition, more challenging to interpret. The soil
grass, the Incident Status Summary and several other resources                   burn severity analysis showed 48% of the burn area with moderate
cited that a primary factor that led to the immense size of                      severity and five percent with high burn severity.

Ecological Restoration Institute                                                  2020 WILDFIRE SEASON: AN OVERVIEW / SOUTHWESTERN US               5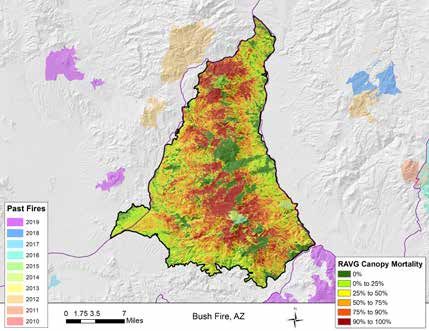
Figure 5. Canopy mortality map for the Bighorn Fire.                Figure 6. Soil burn severity in the Bighorn Fire.

Bighorn Fire, Arizona
Lightning started the Bighorn Fire on June 5 in the Catalina        (10 percent), and ponderosa pine (8 percent) and small areas
Mountains northwest of Tucson, Arizona. The Bighorn Fire            of riparian forest, chaparral, mixed conifer, and non-vegetated
burned for the next 54 days, eventually encompassing nearly         areas. The majority of the Bighorn Fire was identified as low
120,000 acres making it the seventh-largest wildfire in Arizona     (44 percent) or medium (44 percent) departure from historic
history. The fire burned in and around the Coronado National        conditions but nearly 14,000 acres (11 percent) was identified
Forest, including well-known areas like Mt. Lemmon and              as high departure, according to LANDFIRE Vegetation
the upper Sabino Canyon watershed. The fire burned in the           Condition Class analysis, which may underestimate the
steep and rugged terrain of the Pusch Ridge Wilderness and          presence of invasive grasses, especially at low elevations. Most
extended out toward the Catalina Foothills making it visible        of the area affected by the Bighorn Fire had not burned in the
throughout Tucson. In some areas, invasive grasses impacted         previous ten fire seasons. It did however reburn approximately
the fire at low elevations, carrying it through stands of saguaro   two-thirds of the 27,000-acre Burro Fire from 2017. A review
cactus, which are not fire adapted.                                 of the Burro Fire was provided in the 2017 Fire Season
                                                                    Overview. The Bighorn Fire also reburned a few fires from
Land managers chose to utilize a full suppression approach to       2015 including the 750-acre Finger Rock and the 205-acre
minimize the threat and impacts to communities and private          Buster Mountain Fire, as well as a portion of the Woods Tank
infrastructure, but also sought to minimize the impacts of          Fire. A small area inside the fire perimeter was included in
suppression activities where feasible in consideration of the       2015, 2017, and 2020 fires.
natural and cultural values at risk. Consideration was also
taken to allow for social distancing to reduce and prevent the      Fire Severity
potential exposure and transmission of COVID-19.                    Canopy mortality, as depicted in the RAVG analysis, varied
                                                                    across the fire (Figure 5). More than 21,000 acres (17 percent)
The area affected by the Bighorn Fire contained numerous            of the burn area experienced zero percent mortality. These
cultural, biological, and recreational values, including numerous   areas of low canopy mortality were scattered around the burn
archeological and cultural resources, waterways, riparian areas,    area with the largest concentration lying in a 2,400-acre block
wildlife, and watersheds. The area also provides habitat for rare   of ponderosa pine and conifer-oak along the Mt. Lemmon
and threatened species such as the Gila chub, Gila top minnow,      Highway. There were also areas of near complete canopy
lesser long-nosed bat, lowland leopard frog, and Mexican            mortality with over 20,000 acres (16 percent) exhibiting greater
spotted owl.                                                        than 90 percent mortality. Areas of high canopy mortality
                                                                    were also scattered throughout the burn area with the largest
The Incident Status Summary indicated 10 responders lost            concentration in a 7,200-acre block on the north slope of Mt.
time to injuries/illnesses on the Bighorn Fire and that 744         Lemmon. The soil burn severity analysis showed a similar
residences had been evacuated during the blaze. Despite its         spatial distribution of severity areas (Figure 6). The five percent
proximity to Tucson and the number of evacuations, only two         (6,100 acres) of the burn area that showed high soil burn
minor structures were reported destroyed in the fire. The cost      severity was primarily concentrated in the area on the north
for managing the Bighorn Fire was estimated at $50 million, or      slope of Mt. Lemmon that had very high (greater than 90
about $417 per acre.                                                percent) canopy mortality.

Vegetation and Past Fires
The Bighorn Fire burned through a mix of conifer-oak (42
percent), piñon-juniper (20 percent), grass (15 percent), scrub

6    2020 WILDFIRE SEASON: AN OVERVIEW / SOUTHWESTERN US                                                        Ecological Restoration Institute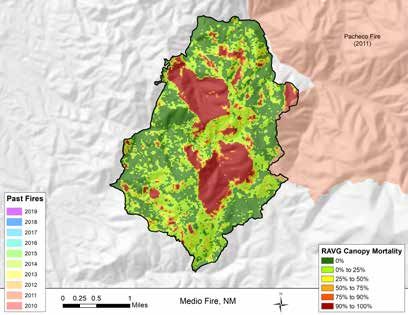
Figure 7. Soil burn severity in the Mangum Fire.

Mangum Fire, Arizona
The Mangum Fire was reported on June 8 in the Kaibab              exact cause of the fire remains under investigation; however,
National Forest near Mangum Camp, approximately two               fire officials confirmed it was human caused. The cost for
miles north of Big Springs, Arizona in Coconino County.           managing the Mangum Fire was estimated at $25 million, or
The fire burned for 46 days and covered 71,450 acres on           about $350 per acre.
the Kaibab Plateau near the North Rim of Grand Canyon
National Park. Fire managers used a full suppression approach     Vegetation and Past Fires
on the Mangum Fire. This approach allowed for some point          The Mangum Fire burned primarily through ponderosa pine
protection of infrastructure (buildings, transport routes, and    (51 percent) and piñon-juniper (31 percent) with several other
power utility lines) and placed a concerted effort on limiting    vegetation types, each representing less than 10 percent of the
the size and acreage of the fire with a focus on limiting smoke   area. Thirty-nine percent of the Mangum Fire was classified as
impacts on the Navajo Nation and surrounding communities          high departure from historic vegetation conditions based on the
to not further complicate COVID-19 impacts. Gusty winds,          LANDFIRE Vegetation Condition Class analysis. Most of the
warm temperatures, low humidity, and rugged topography led        area affected by the Mangum Fire had not burned in any of the
to challenges controlling the Mangum Fire. Non-motorized          previous ten fire seasons. The exception being 970 acres that
characteristics and values were maintained within the             burned as part of the Cooper Fire in 2013. The Mangum Fire
wilderness areas.                                                 did share a 1.7-mile perimeter with the 2013 Castle Fire and
                                                                  was only about one mile north of the 2019 Castle Fire, which
The Mangum Fire threatened the community of Jacob Lake,           was reviewed in last year’s Southwest Fire Season Overview.
Arizona and resulted in area closures and evacuations. The
fire remained in the Kaibab National Forest and did not enter     Fire Severity
Grand Canyon National Park, however, several highways             Fifty-six percent of the area was in high (28 percent) or
were closed, including US Highway 89A and AZ 67, which            moderate (28 percent) soil burn severity categories (Figure
resulted in closure of the North Rim of Grand Canyon NP.          7) and very little was classified as unburned or undetected (6
Additionally, areas of the Paria Canyon-Vermilion Cliffs          percent). The RAVG analysis showed a similar pattern of high-
Wilderness were inaccessible due to closures.                     severity fire with nearly 50 percent of the burn area (35,000
                                                                  acres) classified as greater than 90 percent canopy mortality.
The Incident Status Summary indicated 15 responders lost          This included nearly 75 percent of the piñon-juniper and 37
time to injuries/illnesses on the Mangum Fire. The fire           percent of the ponderosa pine communities with near complete
destroyed two cabins and two outbuildings at Mangum               canopy mortality.
Camp, a facility managed by the Grand Canyon Trust. The

Ecological Restoration Institute                                   2020 WILDFIRE SEASON: AN OVERVIEW / SOUTHWESTERN US         7
Figure 8. RAVG canopy mortality in the Griffin Fire.
Griffin Fire, Arizona
The Griffin Fire resulted from three lightning fires in the the Griffin Fire has burned several times in the last ten fire
Apache Mountains north-northeast of Globe, Arizona that seasons, including the 33,800-acre Hilltop Fire—reviewed
merged into a 61,821-acre fire over a 20-day span in late August. in the 2017 Fire Season Overview—and several fires in the
The Griffin and Gin Fires started on August 17 with the Gin summer of 2020 that are reviewed in this report such as the
Fire burning into the Griffin Fire on August 22. The Champion Blue River, Blue River 2, Valley, and Cassadore Springs fires.
Fire was discovered on August 23, was located directly adjacent The area directly affected by the Griffin Fire, however, had not
to the Griffin Fire, and burned into the Griffin Fire. All three burned in the last ten fire seasons, except for 1,960 acres in the
fires were managed as the Griffin Fire. Fire managers chose to southern portion of the fire that burned in the summer of 2019
use a full suppression approach on the Griffin Fire with a values- as the Champion Fire. Ninety-five percent of the Griffin Fire
driven strategy that used a mix of tactics (direct, indirect, and had a low departure from historic vegetation conditions based
point protection) when and where the probability of success was on the LANDFIRE Vegetation Condition Class analysis.
high, and the risk was commensurate to the identified values.
Fire Severity
Nearly 200 structures were threatened in communities that Fire severity in the Griffin Fire was patchy. There were more
were elevated to either “Set” or “Go” status on the Ready, Set, than 12,500 acres (21 percent) that experienced greater than 90
GO model for evacuation; however, no structures were reported percent canopy mortality, according to the RAVG analysis. The
damaged or destroyed by the Griffin Fire. There were also areas of highest canopy mortality were concentrated in the two
several area and road closures, including shutting down US northern spurs of the Griffin Fire (Figure 8). These spurs were
Highway 60 in both directions north of Globe due to threats to dominated by piñon-juniper.
public safety. Two minor injuries were reported for responders
during the fire. Management of the wildfire was estimated at The soil burn severity analysis was only available for
$6 million, or $97 per acre. approximately 16,000 acres (26 percent) of the total burn area
that extended up toward the Tonto National Forest. Most of
Vegetation and Past Fires the area was identified as low (56 percent) or moderate (31
The area affected by the Griffin Fire was predominantly percent) severity in this analysis. The area of highest soil burn
chaparral (65 percent) with lesser components of piñon-juniper severity correlated with the areas with the highest canopy
(20 percent) and scrub (11 percent). The greater area around mortality in the RAVG analysis.
8 2020 WILDFIRE SEASON: AN OVERVIEW / SOUTHWESTERN US Ecological Restoration InstituteFigure 9. RAVG canopy mortality in the Cow Canyon Fire. Note that the fire crosses the Arizona and New Mexico state line.
Cow Canyon Fire, Arizona
The Cow Canyon Fire was ignited by lightning on August along with a few other minor fires. The rest of the area had not
18 in the Alpine Ranger District on the Apache-Sitgreaves burned in over ten years but was located only about 0.5 miles
National Forests about four miles southeast of Blue, Arizona. southeast of the 538,000-acre 2011 Wallow Fire. The Cow
It burned in steep, rugged terrain with limited access, on the Canyon Fire burned primarily in ponderosa pine (59 percent)
Arizona and New Mexico border. The fire eventually burned with lesser components of conifer-oak (16 percent), mixed
over 35,000 acres, with approximately 28,000 acres in the conifer (14 percent), and piñon-juniper (8 percent). The Cow
Apache-Sitgreaves National Forests and 7,000 acres in Gila Canyon burn area had the second highest percentage of high
National Forest. Due to the steep and hazardous terrain departure from historic vegetation conditions (56 percent) of
with no roads, fire managers chose to use a full suppression any of the fires in this report according to the LANDFIRE
approach utilizing point protection when needed. The fire was Vegetation Condition Class analysis.
continually monitored as it burned through the Blue Range
Primitive Area in Arizona and Blue Range Wilderness in New Fire Severity
Mexico toward the desired holding features and structures The Cow Canyon Fire had a relatively wide range of severity,
along the Blue River. according to the RAVG analysis (Figure 9). Nearly 18,000
acres (53 percent) of the Cow Canyon Fire experienced no
One non-specified injury to a responder was reported. No canopy mortality while there were pockets of canopy mortality
damaged structures were reported. The wildfire cost an greater than 90 percent scattered throughout the burn area
estimated $3 million to manage, or about $85 per acre. totaling over 2,300 acres (7 percent). The soil burn severity
analysis showed a similar spatial distribution of severity areas.
Vegetation and Past Fires Eighty-seven percent of the burn area was documented as low
The Cow Canyon Fire encompassed nearly all 3,800 acres (15,000 acres) or unburned/undetected (13,900 acres) and only
burned in the 2014 Sycamore and 345-acre Tige (2014) fires 430 acres (1 percent) showed high soil burn severity.
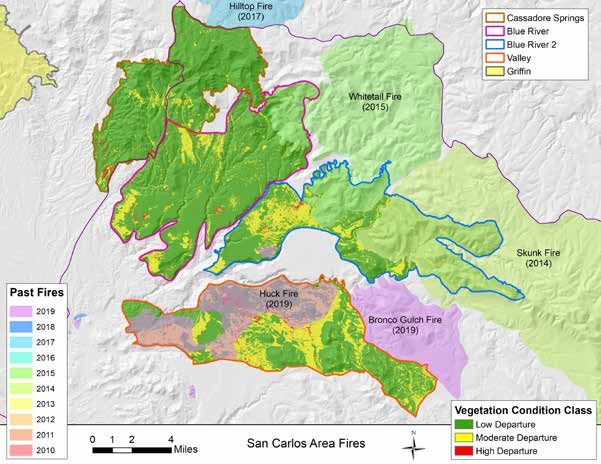
Ecological Restoration Institute 2020 WILDFIRE SEASON: AN OVERVIEW / SOUTHWESTERN US 9Figure 10. Vegetation departure from historic conditions based on the LANDFIRE Vegetation Condition Class analysis for the four
large fires that burned near San Carlos, Arizona in 2020. The Griffin Fire (yellow) was also in the San Carlos area.
Blue River Fire, Arizona
Lightning ignited the Blue River Fire on June 5 approximately southwest. Firefighters were fed and supported at their remote
seven miles southeast of Alpine and 10 miles northeast of San spike camps by local drivers that met the tribal COVID-19
Carlos on the San Carlos Apache Indian Reservation in Gila testing requirements, delivering food and supplies several times
County, Arizona. Very heavy, continuous fine fuels coupled a day.
with low daytime humidity and gusty and erratic winds rapidly
pushed the fire north and east to a total burn area of just over No injuries, structural damage, or evacuations were reported for
30,000 acres. Fire managers chose to use a full suppression this fire. Management of the Blue River Fire was estimated at
approach with the strategic objective of containing the fire $100,000, or about $3.30 per acre.
within the existing road system to prevent it from getting
into more complex terrain and heavier fuels. This approach Vegetation and Past Fires
was chosen to protect cultural sites, dance grounds, and holy The Blue River Fire burned through chaparral (42 percent),
grounds from damage as well as provide protection for a scrub (22 percent), grass (17 percent), and piñon-juniper (16
commercial ponderosa pine forest, threatened and endangered percent). Eighty-seven percent of the vegetation within the
fish habitat, and livestock/range improvements. Blue River Fire was classified as low departure from historic
conditions according to the LANDFIRE Vegetation Condition
The Blue River Fire Incident Status Report identified Class analysis (Figure 10). The Blue River Fire reburned
operational challenges, including a shortage of type 1 hand approximately 3,000 acres of the 2015 Whitetail Fire but the
crews, firefighter and community health and safety issues remaining 27,000 acres had not burned in the last ten years.
related to COVID-19, and the logistics of supporting multiple The Blue River was one of four large fires to burn in the San
camps that made implementing appropriate strategies and Carlos area in 2020. The others were Blue River 2, Valley, and
tactics more challenging. These additional logistical challenges Cassadore Springs. The Griffin Fire, summarized above, was
included temperature testing all firefighters and team members not far to the northwest of these fires.
before entering tribal lands and having all firefighters spike
camping in designated remote areas safely adjacent to the Fire Severity
fires while team members assisting with incident support No fire severity data were available for the Blue River Fire.
were working remotely from Globe, 22 air miles to the west-
10 2020 WILDFIRE SEASON: AN OVERVIEW / SOUTHWESTERN US Ecological Restoration InstituteValley Fire, Arizona Blue River 2 Fire, Arizona
Lightning ignited two more fires on July 13 in the San Carlos The Blue River 2 Fire was one of four large acreage fires to
Apache Indian Reservation a month after the Blue River Fire burn on the San Carlos Apache Indian Reservation in Gila
was contained. These two fires are the Blue River 2 and Valley County, Arizona during 2020. The Blue River 2 Fire was
fires. The Valley Fire consumed nearly 30,000 acres in twelve ignited by lightning on July 13 and grew to over 28,000 acres
days approximately six miles northeast of San Carlos. Fire about a month after the 30,000-acre Blue River Fire was
managers chose to use a full suppression approach with a direct contained immediately to the north. The Blue River 2 Fire
attack to secure the fire’s edge and minimize burned acreage posed a threat to ancestral oak groves for acorn gathering and
using existing control features. Within a couple days, the Valley commercial timber harvest areas. Fire managers chose to use
Fire was contained to burning within the interior of identified full suppression tactics as much as safety allowed. COVID-19
containment lines through available fuel. One residence was concerns played a role in fire responses with the use of
reported destroyed in this fire. Management of the Valley Fire additional aerial resources to assist hand crews in suppression
was estimated at $2 million, or about $67 per acre. efforts and line spiking crews to reduce travel and minimize
COVID-19 exposure. Precipitation eventually slowed fire
Vegetation and Past Fires growth and aided in direct attack suppression tactics. The
The Valley Fire burned through a mix of scrub (55 percent), Incident Status Summary indicated that no structures were
chaparral (30 percent), grass (8 percent), non-vegetated (4 lost to the Blue River 2 Fire and that one responder lost time
percent), and piñon-juniper (3 percent). Over one-third of the to injuries/illnesses while working the fire. Management of the
Valley Fire had burned just 12 months earlier as the Huck Fire. Blue River 2 Fire was estimated at $4 million, or about $143
The Valley and Huck fires shared several of the same fire lines. per acre.
On its eastern side the Valley Fire shared a nearly seven-mile
perimeter with the 2019 Bronco Gulch Fire. Ninety-eight Vegetation and Past Fires
percent of the vegetation within the Valley Fire had low (63 The Blue River 2 Fire burned through a mix of piñon-juniper
percent) or moderate (35 percent) departure from historic (29 percent), grass (27 percent), chaparral (20 percent), scrub
conditions according to the LANDFIRE Vegetation Condition (17 percent), and non-vegetated (5 percent) areas. Over half of
Class analysis (Figure 10). The Valley Fire was one of four large the Blue River 2 Fire had burned in the last ten fire seasons.
fires to burn in the San Carlos area in 2020. The others were Nearly 12,000 acres burned in the 2014 Skunk Fire and an
Blue River, Blue River 2, and Cassadore Springs. additional 4,400 acres in the 2015 Whitetail Fire. The Blue
River 2 Fire shared a roughly eight-mile boundary with the
Fire Severity Blue River Fire from June 2020. Ninety-nine percent of the
No fire severity data were available for the Valley Fire. vegetation within the Blue River 2 Fire had low (79 percent)
or moderate (20 percent) departure from historic conditions
according to the LANDFIRE Vegetation Condition Class
analysis (Figure 10).
Fire Severity
No fire severity data were available for the Blue River 2 Fire.
Ecological Restoration Institute 2020 WILDFIRE SEASON: AN OVERVIEW / SOUTHWESTERN US 11Figure 11. RAVG canopy mortality in the Cub Fire. Note the Cub Fire was completely within the 2012 burn area of the 298,000-acre
Whitewater-Baldy Complex Fire.
Cub Fire, New Mexico
The Cub Fire burned 25,950 acres during a 27-day stretch riparian areas. The Cub Fire lies entirely within the perimeter
from late June into July, approximately three miles northeast of the 298,000-acre Whitewater-Baldy Complex Fire (2012).
of the Mogollon Baldy Lookout on the Gila National Forest Many of these areas also burned in 2011 as the Lilley, Jack, and
in Catron County, New Mexico. The Cub Fire was entirely Feather fires that were part of the Jack Complex. There have
within the perimeter of the 2012 Whitewater-Baldy Complex been no recorded fires within the Cub Fire perimeter since
Fire and fire managers noted minimal to no opportunity to 2012. The perimeter was located only about 0.2 miles from the
engage the fire with direct handline due to a high volume of 2016 McKenna Fire (10,200 acres). Sixty-three percent of the
snags in the old burn scar. Fire managers chose to classify the vegetation within the Cub Fire perimeter had high departure
approach as full suppression but utilized a variety of direct from historic conditions according to the LANDFIRE
and indirect tactics on this lightning-caused fire due to the Vegetation Condition Class analysis.
danger to fire personnel posed by the inaccessible terrain and
numerous snags, its remote wilderness location, and limited Fire Severity
threat to life, property, and communities. Only two percent (400 acres) of the Cub Fire was identified as
having greater than 90 percent canopy mortality according to
Two injuries to responders were reported, including a chemical the RAVG analysis and over 75 percent of the burn area was
burn to a sawyer from leaking gasoline. No damaged structures identified as no canopy mortality (7,500 acres) or less than 25
were reported. Management of the Cub Fire was estimated at percent (10,600 acres) mortality (Figure 11). This pattern is
$442,500 or $17 per acre. consistent with the primary land cover in this area as the fire
burned primarily through ponderosa pine and mixed conifer.
Vegetation and Past Fires There was a preliminary soil burn severity analysis, but these
The Cub Fire burned primarily through ponderosa pine (61 data were never finalized into a format usable for this report.
percent), mixed conifer (22 percent), and piñon-juniper (9
percent), with smaller amounts of conifer-oak, grass, and
12 2020 WILDFIRE SEASON: AN OVERVIEW / SOUTHWESTERN US Ecological Restoration InstituteFigure 12. Vegetation departure from historic conditions based on the LANDFIRE Vegetation Condition Class analysis in the Luna
Fire.
Luna Fire, New Mexico
The Luna Fire was reported on October 17 approximately 2 No injuries were reported. Several roads were closed, or
miles north of the community of Chacon, New Mexico. This restricted access, and the Luna Canyon area was voluntarily
October fire burned more than 10,000 acres at elevations evacuated, but there were no mandatory evacuation orders. The
ranging from 9,000 to 11,000 feet. Despite being outside the Luna Fire cost $6,120,000 to manage, or about $600 per acre.
traditional fire season, this fire burned through dry timber
and brush with high winds leading to extreme fire behavior Vegetation and Past Fires
with crowning, running, and long-range spotting. Fire The Luna Fire was a high-elevation fire with most of the
managers used a full suppression approach with a focus on vegetation classified as mixed conifer (71 percent) or spruce-
opportunities to stop fire spread toward the communities of fir (24 percent). The area affected by the Luna Fire had not
Black Lake, Sierra Bonita, Angel Fire, Chacon, Guadalupita, burned in any of the previous ten fire seasons. The 2018
Valle Escondido, and Coyote Creek State Park, as well as Sardinas Canyon Fire (2,300 acres), about three miles west, is
working on point protection activities for outlying private the only fire during that timeframe to burn in the vicinity of
residences and the Forest Service’s Cerro Vista Repeater. The the Luna Fire. Sixty-nine percent of the vegetation within the
Luna Fire threatened multiple critical watersheds supporting Luna Fire was classified as moderate departure from historic
communities, ranching, and agriculture, along with acequias conditions in the LANDFIRE Vegetation Condition Class
and irrigation infrastructure, and traditional tribal cultural analysis (Figure 12). Only one percent, or approximately
places and religious sites. The fire also threated critical habitat 100 acres, was classified as a high departure from historic
for threatened, endangered, or sensitive species including the conditions.
New Mexico meadow jumping mouse, Southwest willow
flycatcher, Mexican spotted owl, Canada lynx, and aboriginal Fire Severity
Rio Grande cutthroat trout. No fire severity data were available for the Luna Fire.
Ecological Restoration Institute 2020 WILDFIRE SEASON: AN OVERVIEW / SOUTHWESTERN US 13Figure 13. RAVG canopy mortality in the Medio Fire.
Figure 14. Soil burn severity in the Medio Fire.
Medio Fire, New Mexico
The Medio Fire was a lightning-caused wildfire reported on Seven injuries or illnesses were reported on this fire. There were
August 17, 2020 in the Española Ranger District of the Santa no reports of structural damage or mandated evacuations for
Fe National Forest. Conditions were unseasonably dry for the Medio Fire. Management of the Medio Fire was estimated
August and resembled conditions typically observed in June. at $5.5 million, or $1,370 per acre.
The fire burned for the next 27 days and had a final perimeter
of 4,010 acres. There were numerous values at risk, including Vegetation and Past Fires
homes within Pacheco Canyon and the villages of Chupadero The Medio Fire mainly burned through mixed conifer (92
and En Medio, culturally sensitive sites, watersheds that percent) with small areas of ponderosa pine (7 percent) and
provide water to communities downstream, recreational piñon-juniper (1 percent). Ninety-nine percent of the Medio
sites including the Santa Fe ski area, Aspen Vista, Big Fire was identified as moderate departure from historic
Tesuque, Hyde Park, a network of forest trails, and power and conditions according to the Vegetation Condition Class
communication infrastructure. Fire managers chose to use a analysis. The area affected by the Medio Fire had not burned
confine approach utilizing a variety of strategies, including in the preceding ten fire seasons but roughly three-miles of
burnouts and structure protection. Strong north winds the Medio’s eastern boundary was shared with the 10,000-acre
increased the size of the fire but also pushed it toward the Pacheco Fire from 2011.
2011 Pacheco Fire scar and toward a significant fuel change
of green quaking aspen, which greatly reduced fire behavior Fire Severity
and movement. The majority of the Medio Fire showed no canopy mortality
(38 percent) or canopy mortality limited to less than 25 percent
These reports historically have provided a summary of only (30 percent), according to the RAVG analysis (Figure 13).
the largest fires in the region based on acres. The Medio Fire There were, however, pockets of higher mortality with over
was included in this analysis due to its proximity to Santa Fe, 20 percent of the burn area displaying greater than 90 percent
New Mexico and the reported effectiveness of a long-term mortality. Canopy mortality is more ecologically significant in
fire treatment plan for the area. Fire managers noted the a predominantly mixed conifer area than in some of the earlier
effectiveness of fire lines from a previous prescribed burn that fires described in this report that are dominated by grasses and
held the wildfire from racing up the mountain toward the low shrubs. Soil burn severity data indicated 28 percent of the
Santa Fe Ski Basin. This highlighted the ability of prescribed fire had high (14 percent) or moderate (14 percent) severity
fire to prevent wildfires from becoming uncharacteristically (Figure 14).
high intensity, causing widespread damage.
14 2020 WILDFIRE SEASON: AN OVERVIEW / SOUTHWESTERN US Ecological Restoration InstituteConclusion
This report covers the nine largest wildfires in Arizona and Full soil burn severity data were available for five of the 11
New Mexico, an unusual late season wildfire, and a wildfire that fires analzyed in this report, covering nearly 250,000 acres
burned near a metropolitan area. These 11 wildfires represented (40 percent of acres in report). Additional limited data were
57 percent of all acres in the Southwest burned by wildfire in available for the Bush Fire. Sixty-two percent of the area
2020. The most widespread vegetation types affected by these covered by these five fires was classified as low or undetectable
fires were scrub, piñon-juniper, and chaparral, with more than soil burn severity (Figure 16). Eleven percent of the acres for
100,000 acres burned of each type (Figure 15). The largest fires which soil burn severity data were available displayed high soil
reviewed in this report covered an additional 150,000 acres burn severity. Three-quarters of these high-severity acres were
compared to the 12 largest fires covered in our 2019 report. in the Mangum Fire and most of the rest were in the Bighorn
As a result, more acres of all vegetation categories other than Fire. Note that Soil Burn Severity data were only available for
mixed conifer were burned in 2020. The starkest increase was the northern 16,000 acres of the Griffin Fire.
in the conifer-oak type with a seven-fold increase. Much of the
conifer-oak increase was in the Bighorn Fire. The large fires in Rapid Assessment of Vegetation Condition after Wildfire
2020 burned nearly 40,000 more acres of ponderosa pine than (RAVG) data were available for seven of the eleven large fires
the largest fires in 2019 and about the same number of acres covered in this report (Figure 17). Of these 512,000 acres, 21
included in the 2018 analysis. percent (106,000 acres) showed no detectable canopy mortality,
Figure 15. Summary of acres burned in the largest fires by vegetation type.
Figure 16. Summary of acres burned by soil burn severity class.
Ecological Restoration Institute 2020 WILDFIRE SEASON: AN OVERVIEW / SOUTHWESTERN US 15while nearly 107,000 acres (21 percent) showed greater than that the high proportions of wildfire burning with low-severity
90 percent mortality. The Bush and Mangum fires account and the high portion of the area burned close to the historic
for two-thirds of the highest canopy mortality areas. In the condition are related. Nearly all the 79,000 high-departure
Bush Fire, this highest canopy mortality class was primarily acres were isolated to four fires: Mangum (35 percent), Cow
in chaparral, piñon-juniper, and grass with relatively low Canyon (25 percent), Cub (21 percent), and Bighorn (17
associated soil burn severity classifications. Much of the high percent). The Mangum Fire had the highest percentage of
canopy mortality in the Mangum Fire was also found in piñon- high soil burn severity, canopy mortality, and vegetation that
juniper but also included 13,500 acres of ponderosa pine and departed from historic conditions. Reports on several of these
had a much higher soil burn severity classification. Canopy fires indicated that the LANDFIRE data for the area greatly
mortality in these ponderosa pine communities can be more underestimated the presence of invasive grasses, therefore
ecologically significant than fires that mainly burn in vegetation some of the departure from historic vegetation conditions
such as grass, scrub, and chaparral. percentages are likely inaccurate.
Only 13 percent of the area in this analysis was highly departed The fires reviewed in this report led to some evacuation
from historic conditions based on the LANDFIRE Vegetation and smoke-related impacts, but despite the large numbers
Condition Class analysis (Figure 18). It is reasonable to assume of acres burned, human communities were not significantly
Figure 17. Summary of acres burned by canopy mortality class.
Figure 18. Summary of acres burned by vegetation condition class.
16 2020 WILDFIRE SEASON: AN OVERVIEW / SOUTHWESTERN US Ecological Restoration Instituteaffected by any of the largest fires of 2020. There certainly the Cub Fire, fell completely within a past fire perimeter. The
were localized impacts that should not be minimized, but Valley Fire included several areas that were burned as recently
only one residence and a few non-residential structures as the 2019 fire season. It should be noted that fire regimes
were lost in these 11 fires; there were relatively few reported vary significantly across vegetation types and time since fire
evacuations for most of the fires. In comparison, the 2018 may be less or more meaningful depending on type.
Tinder Fire destroyed 33 residences and 63 minor structures
while the 2018 Ute Park Fire led to the evacuation of nearly The 11 fires in this analysis were managed at an estimated cost
3,500 civilians, consumed 14 buildings, and damaged critical of nearly $114 million dollars, for an average of $186 per acre.
power infrastructure. None of the 2020 fires listed in this This average cost was similar to the costs reported in the 2018
report caused structure loss at this scale even though three and 2019 analyses, but roughly half of the cost in the 2017
of the fires burned near some of the Southwest’s largest report. As noted above, managers identify the most appropriate
metropolitan areas, such as the Phoenix (Bush), Tucson strategy for each part of a wildfire to minimize threats and
(Bighorn), and Santa Fe (Medio). maximize positive outcomes. In 2020, managers classified their
strategy as full suppression on all ten of the largest fires, with
Past reports noted that the majority of the large fires in the only the Medio Fire reported as a confine strategy. This differs
Southwest are caused by lightning (naturally ignited). Only from reported strategies in past fire season overviews, which
three of the eleven fires reviewed in this report were identified had approximately 50 percent of the acres approached with
as naturally caused, while four were listed as human caused full suppression. The human or unknown ignitions of the 2020
and another four were listed as undetermined at the time of fires likely factored into these approaches in addition to the
this writing. variety of challenges that COVID-19 presented responders. It
should also be noted that while the overall strategy may have
The role of past fires was highly variable in the fires been full suppression, the implementation of specific wildland
summarized in this report. Past fires played a role in many fires fire strategies includes a variety of factors that often leads to
in this analysis, and in some cases, the edges of these past burn a variety of approaches. While there was a wide variety of
areas may have served as fire breaks with only limited overlap. vegetation types and burn severity across these fires, it is likely
There were also several fires in areas that had not burned in that a significant portion of the 215,096 acres provided some
many years such as the Bush, Mangum, Griffin, and notably ecological benefit.
the Luna, which was a high-altitude fire. Other fires, such as
Ecological Restoration Institute 2020 WILDFIRE SEASON: AN OVERVIEW / SOUTHWESTERN US 17You can also read