CAPITAL MARKETS DAY 2018 - AKER BP ASA 15 January 2018
←
→
Page content transcription
If your browser does not render page correctly, please read the page content below
CAPITAL MARKETS
         DAY 2018
        AKER BP ASA
           15 January 2018
Disclaimer

This Document includes and is based, inter alia, on forward-looking information and statements that are subject to risks and uncertainties that
could cause actual results to differ. These statements and this Document are based on current expectations, estimates and projections about
global economic conditions, the economic conditions of the regions and industries that are major markets for Aker BP ASA’s lines of business.
These expectations, estimates and projections are generally identifiable by statements containing words such as ”expects”, ”believes”,
”estimates” or similar expressions. Important factors that could cause actual results to differ materially from those expectations include, among
others, economic and market conditions in the geographic areas and industries that are or will be major markets for Aker BP ASA’s
businesses, oil prices, market acceptance of new products and services, changes in governmental regulations, interest rates, fluctuations in
currency exchange rates and such other factors as may be discussed from time to time in the Document. Although Aker BP ASA believes that
its expectations and the Document are based upon reasonable assumptions, it can give no assurance that those expectations will be achieved
or that the actual results will be as set out in the Document. Aker BP ASA is making no representation or warranty, expressed or implied, as to
the accuracy, reliability or completeness of the Document, and neither Aker BP ASA nor any of its directors, officers or employees will have
any liability to you or any other persons resulting from your use.

                                                                                                                                             2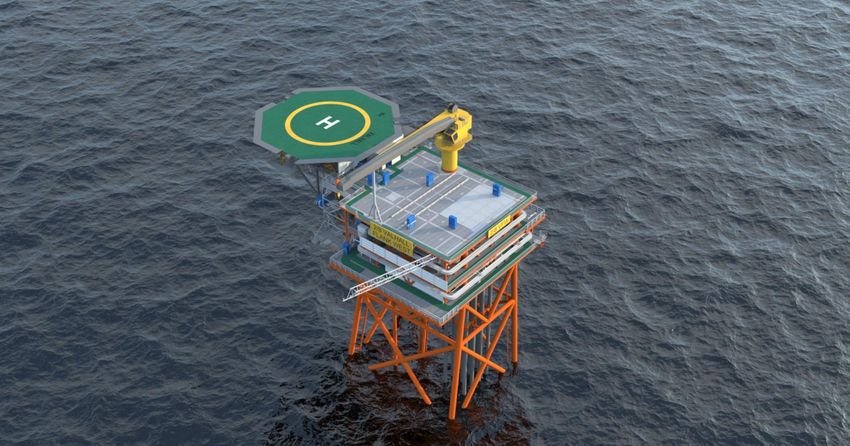
CAPITAL MARKETS DAY 2018
Agenda
Session 1: 13:00 – 14:30
Corporate strategy - Karl Johnny Hersvik, Chief Executive Officer
Execute - Karl Johnny Hersvik, Chief Executive Officer
Improve – Per Harald Kongelf, SVP Improvement
Q&A
Coffee Break
Session 2: 15:00 – 16:00
Grow - Karl Johnny Hersvik, Chief Executive Officer and Gro Gunleiksrud Haatvedt, SVP Exploration
Finance – Alexander Krane, Chief Financial Officer
Concluding remarks – Karl Johnny Hersvik, Chief Executive Officer
Q&A
3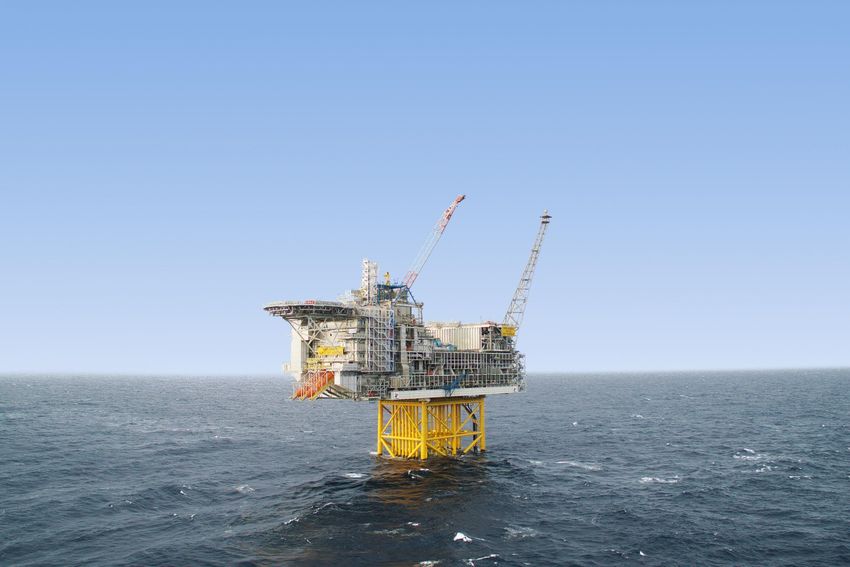
CAPITAL MARKETS DAY 2018
Today’s speakers

Karl Johnny Hersvik, Chief Executive Officer                                                                                       Per Harald Kongelf, SVP Improvement
             Karl Johnny Hersvik (born 1972) has been CEO of Aker BP since May 2014. Prior to joining Aker BP, he served as                    Per Harald Kongelf (born 1959) is responsible for Aker BP's improvement program. Prior to joining Aker BP, Per
             head of research for Statoil.                                                                                                     Harald Kongelf served as head of the Norwegian operations in Aker Solutions.

             Mr Hersvik has held a number of specialist and executive positions with Norsk Hydro and StatoilHydro. He holds a                  Kongelf holds an MSc degree from NTNU in Trondheim and has more than 25 years of industrial experience through
             number of directorships and is a member of several boards whose objective is to promote cooperation between                       numerous technical and management positions in Aker Solutions.
             industry and academia. Mr Hersvik holds a Cand. Scient. (second cycle) degree in Industrial Mathematics from the
             University of Bergen.

Alexander Krane, Chief Financial Officer                                                                                           Gro Gunleiksrud Haatvedt, SVP Exploration
             Alexander Krane (born 1976) took up the position of CFO with Aker BP in 2012. Prior to joining Aker BP, he held the               Gro Gunleiksrud Haatvedt (born 1957) joined Aker BP in 2014. She came from the position of SVP Exploration for the
             position of Corporate Controller with Aker ASA. He has also worked as a public accountant with KPMG, both in                      Norwegian Continental Shelf with Statoil ASA, where she also served as country manager in Libya.
             Norway and in the US.
                                                                                                                                               She has held several positions with Norsk Hydro (head of Geology, Technology and Competence). She has been
             Mr Krane holds a Bachelor of Commerce degree (“siviløkonom”) from Bodø Graduate School of Business and an                         responsible for business development and exploration in Iran, and VP Exploration for NCS. Ms Haatvedt holds a
             MBA degree from the Norwegian School of Economics in Bergen. He is also a state-authorized public accountant in                   Cand. Scient degree in Applied Geophysics from the University of Oslo.
             Norway.

                                                                                                                                                                                                                                                          4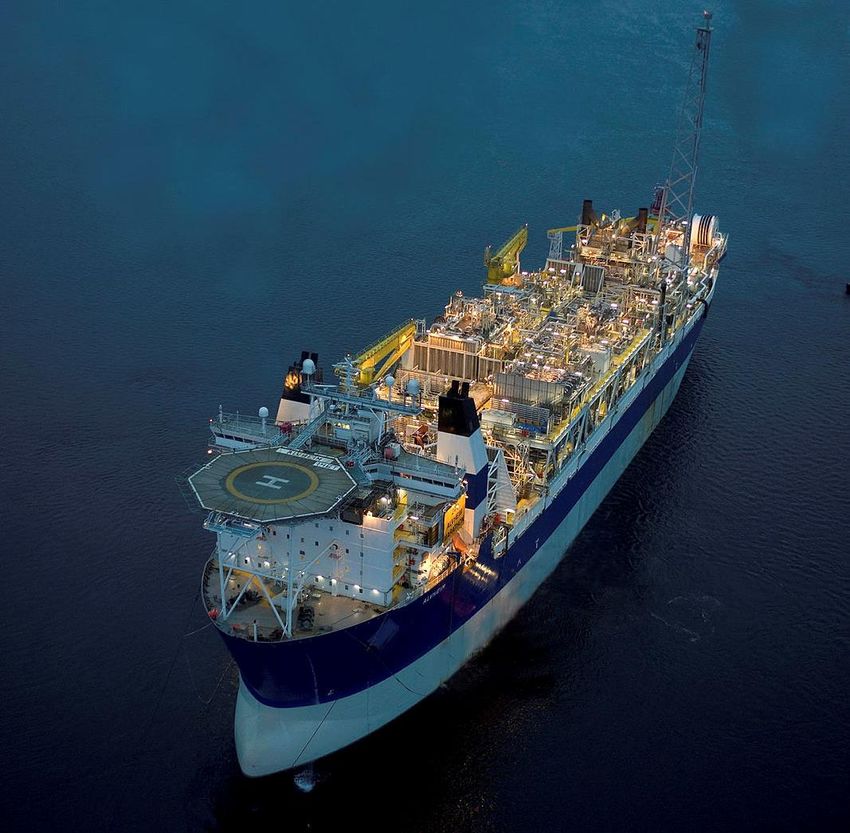
AKER BP ASA
2017 achievements
Hess Norge AS acquisition
Building on successful M&A track record
Farm-down 10% in Valhall/Hod to Pandion Energy
Added 134 mmboe in new reserves
Delivered three PDO’s to the authorities
CAPEX decreased by ~20% from concept selection
Efficient operations with high operational uptime
Production of 160 (139 ex. Hess) mboepd
2017 production ~6% above CMD guidance (ex. Hess)
Organic RRR of 2.3x
2P reserves of 913 mmboe
Total RRR of 4.5x
3x free cash flow coverage last four quarters
USD 250 million in dividend payments Proposal to increase dividends to USD 450 million in 2018 with
and ambition to increase by USD 100 million per year to 2021
5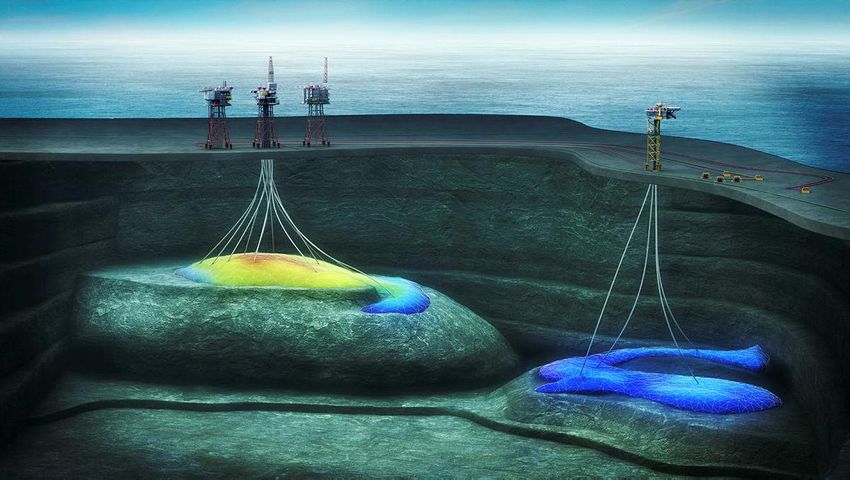
AKER BP ASA
Aker BP investment case
Well positioned to be profitable across the market cycles
• Purely operating on the NCS: Low political risk and attractive fiscal regime
• Strong balance sheet and capital flexibility: USD 2.9 billion in liquidity
• Robust investment program with average break-even of 18 USD/bbl*
• Substantial cash generation and growing dividends
Extensive improvement agenda to strengthen long-term competitiveness
• Reorganizing the value chain with strategic partnerships and alliances
• Aim to be an industry reference for digital project execution
• Focus on flow efficiency to substantially reduce execution time
Strong platform for future growth
• Materially oil-weighted portfolio (~80% liquids): 2P reserves of 913 mmboe and 2C
contingent resources of 785 mmboe at year-end 2017
• Potential to reach 330 mboepd in 2023 (13% CAGR)
• Proven M&A track record – targeting further selective inorganic growth
* Sanctioned projects, discounted to 01.01.2018 6
Corporate strategy
       Karl Johnny Hersvik
      Chief Executive Officer

                                7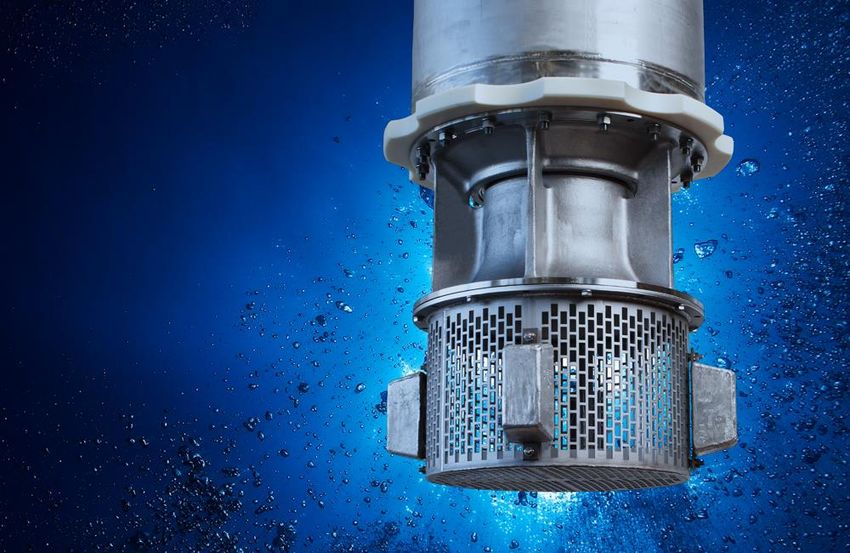
SHAPING THE STRATEGY
Oil market volatility calls for resilient strategy
Steady growth in oil demand Cyclicality is the name of the game
World oil demand Oil market balance
OECD demand Non-OECD demand 2.5 Oversupply Undersupply Brent 140
100 2.0
120
1.5
80 100
1.0
0.5
mmbbl/day
80
mmbbl/day
USD/bbl
60
-
60
-0.5
40
-1.0 40
-1.5
20
20
-2.0
- -2.5 0
1Q04
3Q04
1Q05
3Q05
1Q06
3Q06
1Q07
3Q07
1Q08
3Q08
1Q09
3Q09
1Q10
3Q10
1Q11
3Q11
1Q12
3Q12
1Q13
3Q13
1Q14
3Q14
1Q15
3Q15
1Q16
3Q16
1Q17
3Q17
1Q18
2001
2002
2003
2004
2005
2006
2007
2008
2009
2010
2011
2012
2013
2014
2015
2016
2017
2018
Source: IEA 8
SHAPING THE STRATEGY
NCS remains an attractive place to be
>50% of oil & gas remains to be produced on the NCS                                   CO2 emissions per unit oil & gas produced

                                                                                        206
         16          Undiscovered resources   Contingent resources                               201

                     Reserves                 Sold and delivered
         14                                                                                               174

         12

                                                                                                                                             Global average:129
         10
                                                                                                                   112
BCM oe

         8                                                                                                                    99
                                                                                                                                      88

         6
                                                                                                                                             61
                                                                                                                                                     54
         4                                                                                                                                                    48

         2

         0
              1990 1992 1994 1996 1998 2000 2002 2004 2006 2008 2010 2012 2014 2016    Africa    North    Asia    S/C         FSU   Europe   NCS   Aker BP   Middle
                                                                                                America          America                            2017      East

                       Source: NPD                                                    Source: NOROG, IOGP data series, 2016
                                                                                                                                                                   9
STRATEGIC AMBITION
Create the leading offshore independent E&P company

                                   Safety

                     Focused                     Cost leading

                                 Maximise
                                shareholder
                                   value

                     Growth                        Robust

                               Entrepreneurial
                                and flexible

                                                                10
CORPORATE STRATEGY
Strategic toolbox
Execute
Reorganising the value chain Be at the forefront for
with strategic partnerships
and alliances digitizing E&P
Safety
Improve
Value chain based on a shared
Flexible business model
LEAN understanding,
ready for growth and volatility
toolbox and culture
Grow
11Safety
CORPORATE STRATEGY
Always prioritise safety
2018 HSSE forward agenda
Safety is our number 1 priority
Maintain safe and reliable operations with zero HSSE
incidents and no cyber attacks with significant impact on
performance
Expand and roll out sustainability and energy efficiency
strategies throughout the organization
Develop new systems for managing barrier health,
including operational, organizational and technical barriers
to strengthen process safety
Work towards a climate neutral operations environment
Further develop our HSSE footprint in the Barents region
12Cost
CORPORATE STRATEGY leading
Targeting significant efficiency improvements
Great savings possible – requires new way of thinking Illustrative project economics (USD/boe)
Development cost1 (USDbn) Break-even (USD/boe)
Strategic 20 70
Digitalization
Alliances 60 OPEX (10 yrs)
60
Facility CAPEX
Lean Flexible 15 Drilling CAPEX
50
operations business model
35 40
10
Target production cost Target full cycle break-even 30
below 7 USD/boe below 35 USD/bbl
25
20
5
10
0 0
2 2
Historical NCS Current benchmark Continued
improvement
1. Total CAPEX over Life of field and OPEX for 10 operating years. Current base case assumes 20 years of operation, depending on oil price. All numbers in real terms 2017
2. Illustrative for NCS Projects pre-2014 oil price drop and potential for future projects 13Cost
CORPORATE STRATEGY leading
Improvement program showing tangible results
Ærfugl Valhall Flank West Skogul
Volume 197 56 10
(mmboe) +40% +7% -5%
gross
275 60 10
CAPEX 10.6 7.2 1.6
(NOKbn) -20% -24% -3%
gross 8.5 5.5 1.5
Break-even 32.0 33.9 34.1
oil price -42% -16% -3%
(USD/bbl) 18.5 28.5 33.0
Concept selection PDO submission
14Robust
CORPORATE STRATEGY
Robust balance sheet and strong dividend capacity
Rapid deleveraging over the past two years 3x dividend cover last four quarters
Leverage ratio (Net debt / EBITDAX) Dividend coverage
3.0x 2.8x 500
2.6x 450
2.5x Free cash flow (USDm)
2.5x
400
Dividend paid (USDm)
1.9x 350
2.0x
300
1.4x
1.5x 250
1.1x
200
1.0x 1.0x
150
100
0.5x
50
0.0x 0
Q1-16 Q2-16 Q3-16 Q4-16 Q1-17 Q2-17 Q3-17 Q4-16 Q1-17 Q2-17 Q3-17
15Robust
CORPORATE STRATEGY
Ambition to increase dividends in the coming years
Rationale Aker BP ambition for dividend payments (USDm)
Robust balance sheet and strong cash flow generation The Board proposes that annual dividend increases to
USD 450 million for 2018 with an ambition to increase
by USD 100 million per year to 2021
Improvement program yielding better than expected
results
Break-even prices of 18 USD/bbl on average across
portfolio for sanctioned projects*
Accelerated investment profile in coming years will result
in improved cash flows post 2020 450
Expecting to retain leverage ratio below 1.5x to 2021
based on current business plan
250
2017 2018 2019 2020 2021
* Sanctioned projects, discounted to 01.01.2018 16Flexible
CORPORATE STRATEGY
Efficient decision making and execution
Enabled by an entrepreneurial and flexible organization
From farm-down decision at
1 month Valhall/Hod to signed agreement
From Skarv well shut-in due to
3 months damaged X-mas tree to workover
started with new rig
From project sanction to start-up
8 months of drilling at Tambar
Reduction in execution time of the
9 months Volund infill subsea scope
17Growth
CORPORATE STRATEGY
Profitable growth from existing portfolio
2018 CMD illustrative production potential, mboepd net
Strong production base of operated assets 350
• ~80% liquids / ~20% gas
300 Reserves and resources Development of
at 2017 CMD
Maximize resource utilization from existing hubs existing discoveries
Reserves at 2017 CMD
• Data acquisition 250
• New technology Upsides and
200
tie-ins to existing hubs
Attractive portfolio with potential to reach production
above ~330 mboepd from 2023 (13% CAGR from 2017)
150
from existing discoveries
High quality development projects with low break-evens 100
• Sanctioned project portfolio has a break-even of 18
USD/bbl* (22 USD/bbl ex. Johan Sverdrup) Reserves
50
0
2018 2019 2020 2021 2022 2023 2024 2025
* Sanctioned projects, discounted to 01.01.2018 18Growth
CORPORATE STRATEGY
Year-end 2017 preliminary 2P reserves of 913 mmboe
Development in 2P reserves (mmboe) Proven & probable reserves (2P), end 2017*
Other
Alvheim area
134
-58 1 7
126 111
Johan
Sverdrup Skarv area
300
114
913
913
Organic RRR: 2.3x mmboe
711
Total RRR: 4.5x
59
257
Ivar Aasen 66
Valhall area
Ula area
End 2016 M&A Production Revisions Converted End 2017
2017 from
resources
* Numbers may not add due to rounding. Reserves are according to Petroleum Resources Management System (PRMS) 19Growth
CORPORATE STRATEGY
More than 300 mmboe added to the resource hopper in 2017
Development in 2C contingent resources (mmboe) Preliminary year-end 2017 2C contingent resources*
160
Garantiana
279 Gohta
229 NOAKA 22
-134
25 Filicudi
24 Other
13
Alvheim area
-70
785 30
785 Ula area
16 mmboe
600 Valhall area
Skarv area
Gohta
Other
376
Valhall area
End 2016 Negative Positive M&A Converted End 2017
revisions revisions/ to reserves
additions
* Numbers may not add due to rounding 20Growth
CORPORATE STRATEGY
Ambition to grow through further M&A
Building on a strong M&A track record
Targeting new opportunities:
Acquisition of Norwegian Merger between Det Acquisition of Norwegian Financially accretive
subsidiary for a cash norske and BP’s subsidiary for a cash
Norwegian subsidiary,
consideration of USD 2.1 consideration of USD 2.0 Operated assets
billion (2014) creating Aker BP (2016) billion (2017)
Predominantly liquids
Upside potential
Acquisition of Norwegian Acquisition of license
Acquisition of Norwegian portfolio in Norway, incl. Acquisition of license Acquisition of license
subsidiary for USD 75 subsidiary for USD 120
NOK 45 million (2016) portfolio in Norway (2016) portfolio in Norway (2016)
million (2015) million (2015)
21Focused
CORPORATE STRATEGY
A focused portfolio on the NCS
Skarv / Ærfugl
Solid base performance and area upside potential
Alvheim area
High production efficiency and low operating cost
Ivar Aasen Skarv / Ærfugl
Production ramp-up and IOR opportunities
Johan Sverdrup
World class development with break even price below 25 USD/bbl*
Alvheim area
Ivar Aasen
Ula/Tambar
Late life production with significant upside potential Johan Sverdrup
Ula/Tambar Aker BP operator
Aker BP partner
Valhall/Hod Valhall/Hod
2018 exploration wells
1 billion barrels produced, ambition to produce additional 1 billion barrels
* Full field 22Maximize
shareholder
CORPORATE STRATEGY value
Delivered superior shareholder return* last three years
2015 2016 2017
AKERBP-NO 39 AKERBP-NO 183 AKERBP-NO 35
NFX-US 20 CLR-US 124 BRENT 21
LUPE-SE 9 TLW-GB 89 STL-NO 15
FP-FR 3 LUPE-SE 62 REP-ES 15
ENI-IT 2 RDSB-GB 62 CXO-US 13
STL-NO 0 BP-GB 52 RDSB-GB 13
CXO-US -7 BRENT 50 COP-US 12
BP-GB -7 MUR-US 44 CVX-US 10
XOM-US -13 APC-US 44 BP-GB 9
PXD-US -16 EOG-US 44 EOG-US 7
CVX-US -16 PXD-US 44 MUR-US 3
EOG-US -22 CXO-US 43 CLR-US 3
RDSB-GB -25 MRO-US 39 LUPE-SE 1
COP-US -28 REP-ES 38 FP-FR 0
REP-ES -30 CVX-US 36 MRO-US -1
HES-US -33 STL-NO 34 XOM-US -4
BRENT -36 HES-US 31 PXD-US -4
APC-US -40 WLL-US 27 ENI-IT -6
CLR-US -40 NFX-US 24 NFX-US -22
MUR-US -53 FP-FR 24 HES-US -22
MRO-US -53 XOM-US 20 TLW-GB -22
TLW-GB -60 ENI-IT 18 APC-US -23
WLL-US -71 COP-US 10 WLL-US -45
*Source: Factset, return in percent including dividends, in local currency 23Execute
Karl Johnny Hersvik
Chief Executive Officer
24EXECUTE
Alvheim Area status
Operated, ~65%* working interest
2017 production of 70.9 mboepd net to Aker BP
• Increased compared to previous year due to new wells at
Viper-Kobra and Volund infills
High operational efficiency with well embedded continuous
improvement culture
Drilling of Volund and Boa infills in 2017
PDO submitted for Skogul
More infill wells being matured to arrest the production
decline and minimize unit production cost
PL203, PL088BS, PL036C, PL036D, PL150,
License:
PL340
Discovery year: 1998
End 2017 2P reserves (net): 111 mmboe
Production start: 2008
ConocoPhillips, Lundin, Point (PL340), Statoil
Partners:
(PL036D), PGNiG (PL036D)
*57.62% in PL088BS (Boa), 46.9% in PL036D (Vilje) 25EXECUTE
The Alvheim FPSO production and Alvheim area reserves
Alvheim FPSO historical production (mboepd gross) Reserves vs. PDO (2P gross), mmboe
160
400
140
350
120 Remaining reserves
300
Produced to end 2016
100
+123% Reserves at PDO
250
80
200
60
150
40
100
+72% +79%
20 50
0 0
2008 2009 2010 2011 2012 2013 2014 2015 2016 2017 PDO End 2017 PDO End 2017 PDO End 2017 PDO End 2017
Alvheim Vilje Volund Bøyla
26EXECUTE
Alvheim – Maximizing area recovery
Development of discoveries in the area
• Skogul (2020), Gekko/Kobra East (2021), Caterpillar (2021)
Near-infrastructure exploration
• Frosk, Rumpetroll, Deep Alvheim
• New exploration prospects being matured
Late-life gas blowdown
• Kameleon, Gekko
Priorities
Safe and reliable operations
4D seismic
Infrastructure debottlenecking
27EXECUTE
Valhall & Hod status
Operated, 90% working interest
2017 performance
• Production 34.7 mboepd (net)
• Stable opex/boe due to cost reductions
Driving improvement and growth
• Drilling new wells from IP platform
• Plugging abandoned wells
• Two wireline crews performing well interventions
• Valhall Flank West PDO submitted
• Maturing further infill projects Valhall and Hod production (mboepd, gross)
120 Hod
100 Valhall
80
License: PL006B, PL033, PL033B
60
Discovery year: 1975 40
2P reserves per end-2017: 257 mmboe net 20
Production start: 1982 0
1982
1984
1986
1988
1990
1992
1994
1996
1998
2000
2002
2004
2006
2008
2010
2012
2014
2016
Partners: Pandion
28EXECUTE
Valhall Flank West PDO submitted
Tie-back to Valhall field center
• Unmanned wellhead platform
• Six production wells
• Six additional well slots allowing for future expansion
Robust economics
• 2P reserves 60 mmboe gross / 54 mmboe net
• CAPEX NOK 5.5 billion gross (USD 0.7 billion net)
• Production start Q4-2019 (accelerated from 2021)
• Peak production ~30 mboepd (gross)
• Breakeven oil price of 28.5 USD/bbl
Reserves gross mmboe CAPEX gross NOKbn Break-even oil price (USD/bbl)
+7% -16%
-24%
56 60 7.2 33.9
5.5 28.5
At concept At PDO At concept At PDO At concept At PDO
selection submission selection submission selection submission
29EXECUTE
Valhall & Hod outlook
Valhall & Hod gross resource base (bn boe)
Valhall is a giant oil field with huge potential
• Initial in-place volume (HCIIP) ~4 billion boe 0.3
• Produced ~1 billion boe to date
0.4
• Current 2P reserves indicate ~30% recovery rate
0.3
Ambition to produce another 1 bn boe from the area 2.0
• Drilling more and ‘smarter’ wells
• Improved reservoir monitoring and modeling = better decisions 1.0
• Fishbones technology
• Water injection
• Several digitalization projects initiated
Produced 2P reserves Contingent Ambition Target EUR
per end 2017 resources
Future opportunities identified
• Valhall Flank West PDO submitted Fishbones technology
• Flank North water injection
• Flank South infill wells
• Hod redevelopment
• Lower Hod formation
Source: http://fishbones.as
30EXECUTE
Skarv Area status
Operated, 23.84% working interest
2017 production of 26.7 mboepd (net)
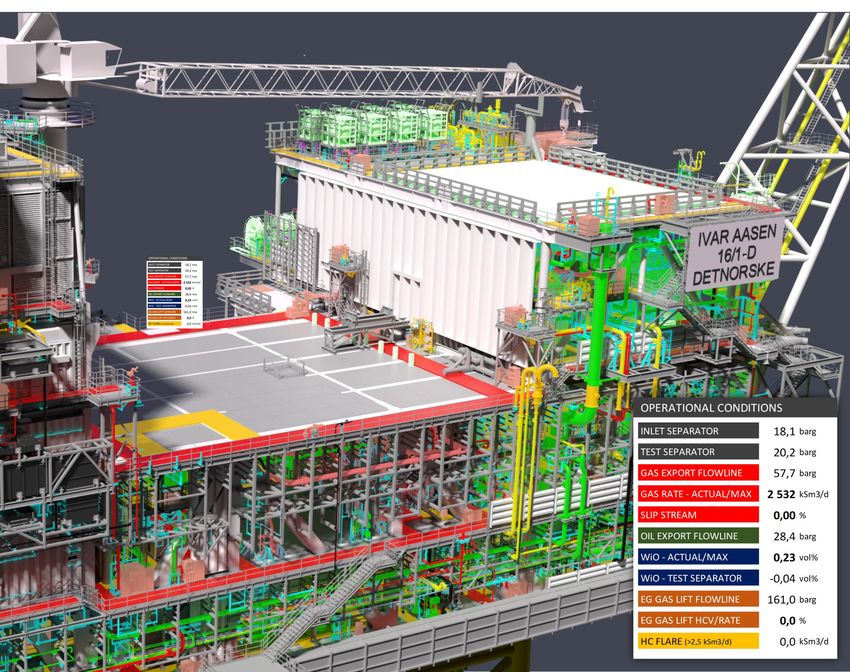
Skarv FPSO is anchored to the seabed and has one of the
world’s largest gas processing plants offshore
Field developed with subsea wells tied back to Skarv FPSO
from five sub-sea templates
Transport solution:
• 80 km long 26” line to Åsgard Transport System
• Shuttle tanker loading of oil for direct transport to the market
• Ability to process third party gas
Skarv area production (mboepd, gross)
200
License: PL159, PL212, PL212B PL262 150
Discovery year: 1998 100
End 2017 2P reserves (net): 114 mmboe 50
Production start: 2013
0
Partners: Statoil, DEA, PGNiG Q1-13 Q3-13 Q1-14 Q3-14 Q1-15 Q3-15 Q1-16 Q3-16 Q1-17 Q3-17
31EXECUTE
PDO submitted for Ærfugl
Reserves gross mmboe
Two phased subsea tie-back to Skarv FPSO +40%
• 275 mmboe gross reserves 275
• Gross CAPEX of NOK 8.5 bn (NOK 4.5 bn for phase 1) 197
• Phase 1: Three new wells tied into the Skarv A template
• Peak production of ~100 mboepd for both phases
• Estimated first gas 2020
At concept selection At PDO submission
Technology driven project CAPEX gross NOKbn (real)
• Electrically trace heated pipe-in-pipe to prevent hydrate -20%
formation and improving production efficiency 10.6
• Hybrid Vertical X-mas Tree (VXT) increasing flexibility by 8.5
allowing for direct wellbore access and reducing future
intervention costs
At concept selection At PDO submission
Attractive economics and significant improvements
• Break-even of 18.5 USD/boe for the full-field development Break-even oil price (USD/bbl)
• Significant increase in reserves -42%
• Material reduction in CAPEX primarily related to D&W cost 32.0
• Alliance model selected following competitive tendering
18.5
At concept selection At PDO submission
32EXECUTE
Skarv area outlook
Focus areas
Improvement program targeting Skarv FPSO production
cost < 7 USD/boe when Ærfugl reaches plateau
Step-up in exploration activity to appraise attractive area
resource potential and utilize significant spare oil capacity
• Drilling of Kvitungen Tumler prospect in Q1 2018
• Follow-on exploration drilling in 2019
Maturing near-field and infill drilling opportunities to
increase oil production and optimize production
• Processing of 4D seismic shot in summer of 2017
• Reservoir work ongoing on Gråsel discovery
• Assessing completion techniques to increase recovery in low-
permeability Tilje formation
Re-instate production from shut-in wells
• One well successfully re-completed (on stream in Dec. 2017)
• Firming up plans for re-completion two wells in 2018
Foto credit: Odfjell Drilling 33EXECUTE
Ula / Tambar status
Operated, ~80%* working interest
2017 performance
• Production 8.4 mboepd (net)
• High unit production cost
Ongoing activities to improve productivity and cost
• Drilling two new Tambar wells
• Oda development ongoing
License: PL019, PL019B, PL065, PL300 Ula and Tambar production (mboepd, gross)
160
Discovery year: 1976 140 Tambar
Production start: 1986 120
Ula
100
2P reserves per end-2017: 66 mmboe net 80
60
Partners: Aker BP (80%), Faroe Petroleum (20%) 40
20
0
1986
1987
1988
1989
1990
1991
1992
1993
1994
1995
1996
1997
1998
1999
2000
2001
2002
2003
2004
2005
2006
2007
2008
2009
2010
2011
2012
2013
2014
2015
2016
2017
* 80% working interest in Ula and 55% working interest in Tambar 34EXECUTE
Ula / Tambar outlook
Tambar (55%) re-development underway
• Two new production wells
• New gas lift module
• Drilling started in October 2017 – first oil in 2018
• Will improve understanding of the reservoir
Oda (15%) development underway
• Subsea tie-back to Ula
• Est. CAPEX NOK 5.4 billion
• First oil expected in 2019
Tambar and Oda provides strong synergies
• Increased volumes will drive down unit cost
• Improves availability of injection gas
• Provides capacity for more WAG-wells in Ula Production cost Ula area
2017
Evaluating further opportunities 40
2018
USD/boe
• More infill wells at Ula and Tambar 30
• Expand use of WAG/injection 20
• Appraisal of Ula North and Ula Triassic 2021
10
• Near-field exploration
10 15 20 25 30
Gross volume, mboepd
35EXECUTE
Ivar Aasen and Hanz status
Operated, ~35%* working interest
2017 production of 18.1 mboepd (net)
First oil from Ivar Aasen on December 24, 2016
• Successful start up with production according to agreed delivery
commitment to Edvard Grieg
Achieved excellent production performance with high uptime
during first year of production
Development scope in PDO completed
Plateau production reached in Q4-2017, one year ahead of plan
PL001B, PL242, PL457, PL338 (Unit), PL028B
License:
(Hanz)
Discovery year: 2008
End 2017 2P reserves (net): 59 mmboe
Production start: 2016
Statoil, Spirit Energy, Wintershall, VNG, Lundin,
Partners:
OKEA
*34.78% in PL 001B/242/457, 35% in Hanz PL 028B 36EXECUTE
Ivar Aasen outlook
Aker BP’s laboratory for operational improvements
Drilling of two water injectors in 2018
Hanz appraisal well planned in 2018
Area infill drilling opportunities identified, first IOR/infill
campaign planned for 2019
Maturing near-by exploration prospects
Optimize use of onshore control room to reduce costs and
optimize production
Ivar Aasen to serve as a laboratory for operational
improvements across the Aker BP portfolio
Drive down operation cost by application of technology,
digitalization and lean work processes
Power from shore from 2022
37EXECUTE
MMO activity to prolong field life
Ula Tambar Valhall & Hod
• Oda tie-in to Ula • Ula Power • Tambar Artificial Lift • Topside modifications for tie-in of Flank West platform
• Ula lifeboat project • Flank North water Injection
Skarv/Snadd Alvheim Ivar Aasen
• Turret modifications for Snadd tie-back • Prepare for new subsea tie-ins including Boa • Digitalization projects including remote operations
• Topside scope - methanol pumps, scale inhibitor infills and Skogul • Hanz tie-in (non-sanctioned)
package, electrical modifications for flowline heating
38EXECUTE
5 operated rigs in 2018
Rig Q1 Q2 Q3 Q4
Maersk Tambar Ivar Aasen Hanz
Interceptor Sublet to Oda license
(infill) (production wells) (appraisal)
Transocean Frosk Raudåsen Valhall
Arctic (EXP) (EXP) (pilot)
Valhall
Drilling Valhall (production wells)
Platform
Maersk Valhall NF
Valhall (plug & abandonment)
Invincible (production well)
Deepsea Kvitungen Skarv Barents Sea Kamelon Infill South
Stavanger Tumbler (EXP) (workover) (EXP) (production well)
39Improve
Per Harald Kongelf
SVP Improvement
40IMPROVE
Improvement is a strategic imperative
Aker BP is running a comprehensive improvement program to maximise flow efficiency and remove waste
Reorganising the value chain Be at the forefront for
with strategic partnerships
and alliances digitizing E&P
Value chain based on a shared
Flexible business model
LEAN understanding,
ready for growth and volatility
toolbox and culture
41IMPROVE
The problems with traditional supplier relationships
Alliance Traditional
Time horizon Long-term From project to project
No. of suppliers Minimum sufficient Several
Risk sharing & Aligned incentives and shared upside and
Dis-aligned incentives, no risk sharing
Incentives downside risk
Team Integrated team, empowered team, “best person
Separate organizations with interfaces and hand-overs
Organization for the job”
Geography Co-location of teams Many teams in separate locations
Leadership Trust-based leadership Control and transaction based
Documentation Minimum sufficient Large documentation (control culture and tailor make)
Common improvement language based on
Improvement Separate, uncoordinated improvement initiatives
Lean
Standardization Repetition and re-use Tailor-make
42IMPROVE
Alliance principles
One integrated organization Incentives – shared risk and reward Early involvement
Aker BP
Overrun
Cap
Most Likely Cost
Overrun Overrun
DG0 DG1 DG2 DG3
Contractor A Evaluate Select Concept Mature Execute
Savings viability Concept Scope of
work
Ability to
influence
concept and
Actual Cost Actual Cost schedule
Actual Cost
Contractor B
Alliance Conventional
Model Model
Alliance team Time after start of concept definition
Underrun share Overrun shared Cost above cap
between alliance between alliance compensated at net
partners partners rate to contractors
43IMPROVE
Alliance delivery: Volund infill project
The first project completed by the subsea alliance – delivered 30% below target
-33%
-30%
Traditional Market effects Budget subsea Unrealised risk Budget subsea Alliance MLC + Cost MLC underrun AFE Facility
benchmark project (2016) allowance project (excl. effects before outside MLC execution Actual Cost
subsea risk allowance) execution before
project (2014) sharing with
Contractors*
44IMPROVE
The alliance model continues to deliver
Selected projects currently being worked by the Subsea Alliance (subsea scope only)
Valhall Flank West Skogul
-30% -35% -20% -24%
DG2 DG3 Facility AFE Revised Facility
Subsea Alliance effects subsea target Facility Alliance effects DG3 target
traditional estimate cost DG3 estimate cost
45IMPROVE
Digitalization opens up for massive improvements
Big data & analytics Cloud computing/storage Collaborative technology Virtual reality
platforms
Instant analysis of large data Highly scalable, variable-cost Employee engagement and Interact more naturally with
sets to identify new patterns storage & processing on demand collaboration enabled by digital digital devices and services
platforms and communities
Real-time communication 3D scanning Additive manufacturing Mobile connectivity & AR
and tracking
Every asset, equipment, Analyses of real-world object or Print objects & parts on demand with Virtual telepresence to remove the need
employee always connected environment to collect data on its shape / increasing precision, and range of for on-site humans and omnipresent
appearance materials mobile devices
Unmanned aerial vehicles Sensors Robotics & automation Cyber security
Autonomous, low-cost vehicles Low cost, low power, connected Intelligent robots take on Protecting system integrity is a "must-
able to perform complex tasks sensors capturing spatial and complex assignments have"
and remove human presence environment information
46IMPROVE
It all starts with data
Aker BP has established a data platform in cooperation with Cognite
Design criteria for the data platform
• Open architecture
End-user • Scaleable, flexible and robust
applications Operational Operations 3rd Party 3rd Party
Intelligence Support Applications Solutions
• Cloud-based
Data feed established from ~200.000 sensors
• Live data from all Aker BP’s installations
• Complete historic data
Cognite
data-
About Cognite
platform
• Norwegian IT company
• Strategy: Develop world-class horizontal industrial data
platform, making data a strategic asset in the industrial’s
own terms
Data • Aker BP is Cognite’s first customer and has 10%
sources ownership
47IMPROVE
Digitalization in Aker BP
Developing use cases on the data platform… …and progressing key digital initiatives
Insert Insert
image as image as Remote operations Ivar Aasen
End-user fill fill
applications
Operational Operations 3rd Party 3rd Party
Intelligence Support Applications Solutions
Unmanned Wellhead Platform Concept
Cognite PUSH
data-
platform
Automated well design and autonomous
drilling
Data
sources
Digital logistics
48IMPROVE
The Framo story
Sharing operational data with equipment manufacturer
Framo is a leading supplier of pumping systems
Framo is using Ivar Aasen as a case for exploring remote operations
with live data access (free of charge) through the Cognite system
The purpose is to develop diagnostic capability and to identify further
improvements on its equipment packages for future projects
Illustration source: Framo website
49IMPROVE
Supporting offshore operations using tablets and AR
Cognite Operations Support
Current features
• Computer vision to read equipment tags
• Live sensor data feed
• Locate failing equipment in interactive 3D model
• Shows all relevant information available
Roadmap for more functionality
• Interactive P&IDs
• Additional information sources continuously added
• Navigation on walk path to equipment
• Augmented reality to overlay equipment data
• Expert support live video feed on tablet
• Work order process integrated into portable device
• Maintenance planning optimization (timing and
walking routes)
• Capture images of equipment to enable time lapse
of critical equipment
• Update 3D model based on scans from application
50IMPROVE
Ivar Aasen digital operations model
Aker BP’s laboratory for developing the digital oil field
Digital twin based on live data from the Cognite data
platform
Digital tools, e.g. Cognite Operations Support
Integrate OEMs in operations, e.g. Framo
Predictive maintenance based on machine learning on
top of Cognite platform
Automation of repetitive tasks
New business models for sourcing products and
services
Remote operations to reduce waste and increase quality
51IMPROVE
PUSH – Digital project execution
Joint collaboration between Aker Solutions and Aker BP
where the objective is to radically improve the way Accellerating the transition to fully
offshore projects are engineered digitized field development projects
Developing digital tools to reduce execution time by 25
percent and reduce costs from discovery to operations
Initial focus on front end and platform solutions
PUSH will ultimately provide a digital red thread from
engineering to operations
• Generate 3D digital twin of the platform
• Accessing historical data and drawings: Re-using design
properties and information to save engineering cost
PUSH is currently being tested and implemented in the
NOAKA project
• Master equipment list for concept studies
• Automated topside weight estimation
• Automated generation of topside 3D layouts
52IMPROVE
Data liberation and sharing will improve NCS competitiveness
Current state Desired state
High degree of rework in subsurface projects and limited Faster maturation of subsurface projects and faster learning
ability to benchmark performance of equipment and assets enabled by industry benchmarks
Inaccessible data in a world of silos All data consumable with open API standards feasible for
Poor quality and not standardized formats big data analytics
Locked in applications Separation of data and applications
Specialized systems not using open source limit open Sharing of data across the value chain and between
innovation peers
Limited sharing, and “internal data” below critical mass Open source software
Sharing of workflows
53IMPROVE
Improvement is a strategic imperative
Aker BP is running a comprehensive efficiency improvement program
Reorganising the value chain Be at the forefront for
with strategic partnerships
and alliances digitizing E&P
Mimimize waste
Maximize flow efficiency
=
Reduced execution time
Improved margins
Value chain based on a shared
LEAN understanding, Flexible business model
toolbox and culture ready for growth and volatility
54CAPITAL MARKETS DAY 2018
Q&A
55Grow
Karl Johnny Hersvik
Chief Executive Officer
Gro Gunleiksrud Haatvedt
SVP Exploration
56GROW
Johan Sverdrup development on track
Drilling platform heavy lift at Klosterfjorden
Project progressing according to plan:
• Construction was close to 80% complete by end 2017
• Drilling platform modules integrated on barge in Norway
• Riser platform modules ready for transport to Norway in
February
• 9 water injectors pre-drilled and completed
Costs continue to come down
• Phase 1 CAPEX estimated at NOK 92 billion (nom.) with
break-even oil price below 20 USD/boe
• Full field CAPEX estimated at NOK 132 – 147 billion (nom.)
with break-even oil price below 25 USD/boe Photo: Arne Reidar Mortensen/Statoil
The project aims to deliver PDO for phase 2 in the second
half of 2018
57GROW
Targeting an area solution for NOAKA
Statoil, LOTOS and Aker BP have agreed to establish an
area forum to evaluate a joint area development for North of
Alvheim* and Krafla/Askja (NOAKA)
Two area solutions to be evaluated;
• PQ alternative with a field hub with processing platform in the
middle of the area
• UPP x 2 alternative with two unmanned processing platforms,
one in Krafla/Askja area and one in the North of Alvheim area
Gross resources in the area estimated to be in excess of
500 mmboe
• Including tie-in from Frigg and Rind
Concept selection targeted for Q1-18
* North of Alvheim consist of Frigg Gamma Delta (PL442), Langfjellet (PL442), Frøy (PL364) and Fulla (PL873) 58GROW
Aker BP assessment of NOAKA
Maturing of selected concept towards DG2 should be based
on concept that facilitates for highest area resource recovery
The NOAKA area is prospective with a lot of possible future
tie-ins from exploration prospects
• Unrisked exploration resources in the area is estimated to
about 400 mmboe
• PQ alternative will include a processing platform located
centrally in the area within effective reach of existing and new
discoveries
The PQ alternative have an acceptable break-even price and
high value creation
• Low risk development with PQ platform based on conventional
design and proven technology
• Area fields developed as subsea or unmanned wellhead
platforms with tie-back to the PQ platform
• Power to be supplied from shore
59GROW
Project inventory provides flexibility
Plateau
Aker BP Gross Est. first
Project Operator production
Equity mmboe oil/gas
(gross)
Valhall IP wells Aker BP 90.0% 54 ~12 mboepd 2018
Boa infills 2017 Aker BP 57.6% 15 ~8 mboepd 2018
Tambar development Aker BP 55.0% 26 ~10 mboepd 2018
Kameleon infill South Aker BP 65.0% 5 ~6 mboepd 2018
Johan Sverdrup Statoil 11.6% 2 594 ~660 mboepd 2019
Oda Centrica 15.0% 47 ~30 mboepd 2019
Ula WAG from Tambar/Oda Aker BP 80.0% 15 ~7 mboepd 2019
Valhall Flank North injector Aker BP 90.0% 7 ~2 mboepd 2019
Valhall Flank West Aker BP 90.0% 60 ~30 mboepd 2019
Valhall Flank South infill Aker BP 90.0% 14 - 2019
Skogul Aker BP 65.0% 10 ~13 mboepd 2020
Ærfugl Aker BP 23.8% 275 ~108 mboepd 2020 Additional possible projects include:
Valhall Lower Hod Aker BP 90.0% 65 - 2020 IOR drilling at Ivar Aasen and Johan Sverdrup
Trell
Hanz Aker BP 35.0% 18 ~21 mboepd 2021
Valhall Upper diatomite
Gekko/Kobra East Aker BP 65.0% 35 - 2021
Hod Upper diatomite
Caterpillar Aker BP 65.0% 9 - 2021 Valhall and Hod extended production
Garantiana Statoil 30.0% 73 - 2022 Valhall Flank West waterflood
NOAKA* Aker BP Various 279 - 2022 Ula infill drilling
Hod re-development Aker BP 90.0% 71 - 2022 Gohta & Filicudi
2P reserves Best estimate contingent resources
* Frigg Gamma Delta, Frøy, Langfjellet, Fulla, Krafla, Askja, Rind 60GROW | EXPLORATION
Creating the leading explorer
ENSURE ESTABLISH DISCOVER CONTINUOUS IMPROVE
long term reserve new core areas 250 mmboe net positioning for data quality and
replacement and to Aker BP in significant technology to
value creation 2016 - 2020 additional create a
discoveries competitive edge
61GROW | EXPLORATION
NCS production stable to 2025 – then what?
Decline after 2025 – possible to mitigate? NCS robust in several demand scenarios
Postponement to 2025 by upsides in fields and discoveries Offshore less hit by global peak demand than unconventionals
Yet to Find in known basins and unopened basins Based on cost curve, NCS more competitive than other offshore
5000
4500
4000
Daily production kboe/d
3500
3000
2500
2000
1500
1000
500
0
1971
1972
1973
1974
1975
1976
1977
1978
1979
1980
1981
1982
1983
1984
1985
1986
1987
1988
1989
1990
1991
1992
1993
1994
1995
1996
1997
1998
1999
2000
2001
2002
2003
2004
2005
2006
2007
2008
2009
2010
2011
2012
2013
2014
2015
2016
2017
2018
2019
2020
2021
2022
2023
2024
2025
2026
2027
2028
2029
2030
2031
2032
2033
2034
2035
2036
2037
2038
2039
2040
Source: NPD, Aker BP, Rystad Energy 62GROW | EXPLORATION
Loppa North
Exploration thriving
Loppa South
on the NCS
Barents Sea SE
Aker BP 2018 exploration campaign
Skewed towards frontier prospects
12 exploration wells
Risked pre drill estimates ranging from
Norwegian Sea NE
50 – 150 mmboe net to Aker BP
Skarv
Trends
Exploration well cost reduced by ~50 %
Aker BP office locations
Tampen
Development cost reduced significantly Aker BP operator
Aker BP partner
Increased area of influence for cluster Greater NOAKA
Aker BP operated fields
developments Other active licenses
Greater Alvheim
Digitalisation will further strengthen cost
reduction trend Greater Utsira Exploration Area
Existing Core Area
Valhall - Ula
63GROW | EXPLORATION
Barents Sea:
A long term game Shenzhou
Korpfjell
Gråspett
Gemini N
Disappointing exploration wells in 2017 Koigen
Scarecrow
WISTING
Continued exploration on new Bone
plays/areas in 2018
Børselv Stangnestind
Kayak
Barents Sea still above global JOHAN CASTBERG
Filicudi oil discovery
exploration average: Hurri
Hufsa Svanefjell
50% 40 Gohta III Gjøkåsen
GOHTA - ALTA
45%
mmboe per well
30 Blåmann
40%
35% 20 Goliat Eye
Oil discovery
30%
10 Gas discovery
25% Dry well
To be drilled
20% 0
Success rates Volumes per well
Aker BP operator
Barents Globally Aker BP partner
Source: NPD/ Woodmac, 2006-2017
64GROW | EXPLORATION
Northern areas Gråspett Shenzhou
Scarecrow
- Exploration campaign 2018 Stangnestind
Svanefjell
Barents Sea Gjøkåsen
Stangnestind megaclosure, new play
Svanefjell possible high-impact well
Four partner wells, diversified targets
Skarv
Kvitungen Tumler – potential high value creation
Aker BP Wells 2018
Kvitungen-Tumler
Aker BP operator
Aker BP partner
65GROW | EXPLORATION
North Sea: Increasing value of
producing assets
- Establishing new fields Raudåsen
Twofold Exploration task:
Deliver high value volumes to Aker BP
1 production hubs
Alvheim
Frosk
Ula
Valhall
Hornet
2 Reveal hydrocarbon accumulations to
establish new core areas
Sleipner Area – possible new hub
Cassidy
Raudåsen Aker BP wells 2018
Possible new APA 2017 well Aker BP operator
Hod Appraisal Aker BP partner
66GROW | EXPLORATION
The producing assets
– how to create high value
Exploration within tie-in radius to
producing assets
Even small discoveries close to existing fields
create large values ULA
Require unified seismic data sets covering the
entire area of interest
Invested USD 10 million in new 3D data in
southern North Sea (out of total USD 50 million)
Value creation example:
Minimum economic field size near Ula is 5 mmboe
VALHALL
EXAMPLE FROM Aker BP operator
ULA AND VALHALL: Aker BP partner
67I K
J
GROW | EXPLORATION
E
Summary 2018 exploration wells D
H
Aker BP Pre-drill
License Prospect name Operator share mmboe* Time
PL340 Frosk Aker BP 65 % 3 - 21 Q1 A
PL790 Raudåsen Aker BP 30 % 9 - 74 Q1 B
PL839 Kvitungen Tumler Aker BP 24 % 37 - 269 Q1 C
PL659 Svanefjell Aker BP 50 % 17 - 331 Q2 D
PL858 Stangnestind Aker BP 40 % 30 - 190 H2 E C
PL777 Hornet Aker BP 40 % 17 - 166 Q4 F
PL033 Hod Appraisal Aker BP 90 % - Q4 G
PL857 Gjøkåsen Statoil 20 % 26 - 1427 Q3 H
PL721 Gråspett DEA 40 % 32 - 263 Q4 I
B
PL852 Scarecrow Spirit 40 % 83 - 245 Q4 J
PL722 Shenzhou Statoil 20 % 40 - 295 Q4 K
A
PL405 Cassidy Spirit 15 % 5 - 48 Q4 L
F Aker BP operator
Aker BP partner
* Preliminary volume span (gross) L
G
68Finance
Alexander Krane
Chief Financial Officer
69FINANCE
Funding our business
Financial strengths
Strong cash flow generation in the years to come
USD 2.9 billion in liquidity provides capital flexibility
• Attractive organic reinvestment opportunities Ownership Cash flow
• Inorganic growth opportunities
Strong support from principal owners Aker ASA (40%)
and BP plc (30%) Financial
risk Balance
sheet
Credit rating obtained in 2017 management
BB+ Ba2
Taxes Liquidity
70FINANCE
Debt structure
Pro-forma Q4-17 debt capacity and drawings (USDm) Debt maturity profile (USDbn)
400 6 155
4.0
255
RBL - drawn (LIBOR + 2.0 - 3.0%)
1 500
Bank Term Loan (LIBOR + 1.5 - 2.0%)
2 670 US bond (6.0% fixed)
3.0
DETNOR02 (NIBOR + 6.5%)
4 000
RBL - undrawn
Undrawn 2.0
2 670 Drawn
3 485
1.0
1 330
0.0
RBL Bank term loan DETNOR02 US bond Pro-forma 2018 2019 2020 2021 2022
Debt capacity
71FINANCE
Tax regime supportive of growth
NCS tax system and implications for Aker BP Tax-adjusted net debt (USDbn) prelim. end 2017
Key attractions of the NCS tax system
• ~90% of investments recovered over 6 years 3.2 2.0
• OPEX, exploration and decommissioning costs 78% Special
immediate tax recovery tax value
• Financial costs recovered ~50%** 1.5
• Full tax recovery under all scenarios
– If not in tax position, losses accumulated
– Losses refunded if petroleum activities discontinued Corporate
tax value
0.5
Aker BP considerations
Expected to be
• Gearing considered relative to tax receivable settled in 2018
– Current debt position more than covered by tax receivable
1.5
• Tax balances expected to increase going forward due to
organic capex program
0.2
0.2
Net interest- Non deprec. Tax losses Tax payable Adjusted net
bearing debt* Tax balances (2017 activity) cash position
(Numbers may not add due to rounding )
* Estimated book value, before adjustments for tax receivables
** Depending on tax balances and debt, estimate for 2018 72FINANCE
Financial risk management
Hedging Overview of current commodity hedges
Commodity Hedges 2018 2019 →
Hedging policies in place to mitigate foreign exchange and
commodity risks % Hedged of total
20% -
oil production
Foreign Exchange
Put option strike price USD 50-60/bbl -
• Aker BP is a USD-company and is mainly exposed to
investments, operating costs in NOK and tax balances Cost of hedge
USD 1.82/bbl -
nominated in NOK (weighted average, pre-tax)
Commodities
• Policy to secure up to ~30% of production volume (100% of
after-tax value)
• Loss of production insurance covered after 45 days at net
USD 50/bbl
Interest rate
• Of total gross debt, 22%** is at fixed rate
* Corresponding to approximately 50% of after-tax exposure
73
** As of 11 Jan 2018FINANCE
2018 guidance
Item 2018 guidance
2018 Production 155 – 160 mboepd
2018 Production cost USD ~12 per boe
2018 CAPEX USD ~1.3 billion
2018 EXPEX USD ~350 million
2018 decommissioning
USD ~350 million
expenditures
Note: Guidance based on USD/NOK 8.0
* All amounts are presented pre-tax 74FINANCE
2018 guidance - production and production cost
Key activities Comparison of operated hubs, 2018 vs 2017 (9m)
2018 production expected between 155 – 160 mboepd
• 80% liquids / 20% gas
40
2018 production cost expected to average ~12 USD/boe Ula area
2018 FY guidance
• Including tariffs and transportation costs
2018 Production cost (USD/boe)
2017 9m actual
30
Aim to reduce unit costs across the portfolio
• Cost reduction
• Investments to increase production
20 Valhall area
Skarv
10
Ivar Aasen Alvheim area
0
0 10 20 30 40 50 60 70 80
2018 Production (mboepd)
75FINANCE
2018 guidance - CAPEX
Key activities Split by main project
Alvheim area
• Drilling Kameleon infill South and Volund sidetrack North Alvheim area
• Skogul: Construction of subsea systems and flowlines
Johan Sverdrup
Valhall area
• IP drilling program (3 wells)
• Flank West: Detailed engineering and start-up of construction
• Flank North water injection: drilling of one well
Ula area ~1.3
• Tambar and Oda development, Ula power project
Skarv area Skarv area
USDbn
Valhall
• Ærfugl: Fabrication of subsea production systems, control
cables and flowlines Other
Johan Sverdrup Ivar Aasen
• Offshore installation of platforms and steel jackets
• Construction of the first process platform and living quarter NOAKA
• Installation of oil and gas export pipelines and power cable Ula area
• Engineering and procurement for Phase 2 Assumes USDNOK = 8.0
76FINANCE
2018 guidance – EXPEX and Decommissioning
Exploration expenditures Decommissioning expenditures
Drilling of 12 exploration wells (7 operated) Continuous P&A activity on Valhall until 2020
Field evaluation costs (NOAKA, Hod redevelopment) Decommissioning program for legacy assets (Varg, Jette)
Seismic acquisition on/near existing acreage and Ula area
Area fees and other exploration costs
Other
Seismic
Other
~350 Wells and ~350
G&G
USDm testing USDm
Valhall
Field
evaluation Assumes USDNOK = 8.0
77FINANCE
Cash flow outlook 2018
Illustrative 2018 break-even prices
2018 cash flow illustration based on mid-point of Realized Hydrocarbon Price (USD/boe) 50 60 70 80
production guidance range Production cost (USD/boe) (12) (12) (12) (12)
Other OPEX (USD/boe) (1) (1) (1) (1)
Financial cost (USD/boe) (3) (3) (3) (3)
Tax losses from Hess Norge expected to be settled in 2018 Cash taxes (USD/boe) (4) (8) (12) (16)
Netback (USD/boe) 30 36 42 48
Total investments (CAPEX, EXPEX, DECOM) of USD 2.0 bn
equalling 35 USD per boe of estimated 2018 production CAPEX (USD/boe) (23) (23) (23) (23)
EXPEX (USD/boe) (6) (6) (6) (6)
Decommissioning expenditures (USD/boe) (6) (6) (6) (6)
Cash cost (pre-tax) of USD 16 per boe Investments (USD/boe) (35) (35) (35) (35)
Cash break-even in 2018 at a realized hydrocarbon price of Tax refund (USD/boe) 26 26 26 26
approximately USD 29 per boe before dividends
Free cash flow (ex. working capital) (USD/boe) 21 27 33 39
Cash flow break-even before dividends (USD/boe) 29
Cash flow B/E post dividends (USD/boe) 37
Assumes USDNOK = 8.0
* Numbers may not add due to rounding
** Not including effects of commodity hedges 78Concluding remarks
Karl Johnny Hersvik
Chief Executive Officer
79CONCLUDING REMARKS
Aker BP investment case
Well positioned to be profitable across the market cycles
• Purely operating on the NCS: Low political risk and attractive fiscal regime
• Strong balance sheet and capital flexibility: USD 2.9 billion in liquidity
• Robust investment program with average break-even of 18 USD/bbl*
• Substantial cash generation and growing dividends
Extensive improvement agenda to strengthen long-term competitiveness
• Reorganizing the value chain with strategic partnerships and alliances
• Aim to be an industry reference for digital project execution
• Focus on flow efficiency to substantially reduce execution time
Strong platform for future growth
• Materially oil-weighted portfolio (~80% liquids): 2P reserves of 913 mmboe and 2C
contingent resources of 785 mmboe at year-end 2017
• Potential to reach 330 mboepd in 2023 (13% CAGR)
• Proven M&A track record – targeting further selective inorganic growth
* Sanctioned projects, discounted to 01.01.2018 80CONCLUDING REMARKS
Priorities going forward
Safe and efficient operations
Execute Excellent project delivery
Relentless focus on cost reductions and
Safety
productivity gains
Improve
Mature projects to below 35 USD/boe break-even
Maximize recovery from existing resource base
Grow Pursue inorganic growth opportunities
81CAPITAL MARKETS DAY 2018
Q&A
82You can also read