Hecla Mining Company - H. C. Wainwright Global Investment Conference Value in Precious Metals

Page created by Tina Romero
 
CONTINUE READING
Hecla Mining Company - H. C. Wainwright Global Investment Conference Value in Precious Metals
H. C. Wainwright
Global Investment
Conference

Value in Precious Metals

September 2019

                           RESPONSIBLE. SAFE. INNOVATIVE.

Hecla Mining Company
NYSE: HL
Hecla Mining Company - H. C. Wainwright Global Investment Conference Value in Precious Metals
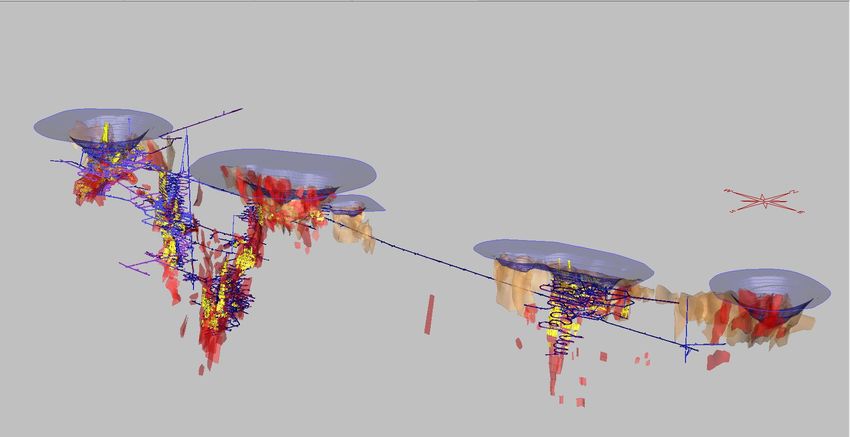
CAUTIONARY STATEMENTS

 Cautionary Statement Regarding Forward Looking Statements

 This presentation contains “forward-looking statements” within the meaning of Section 27A of the Securities Act of 1933, as amended, and Section 21E of the Securities Exchange Act of 1934, as amended, which are intended to be
 covered by the safe harbor created by such sections and other applicable laws, including Canadian securities laws. When a forward-looking statement expresses or implies an expectation or belief as to future events or results, such
 expectation or belief is expressed in good faith and believed to have a reasonable basis. However, such statements are subject to risks, uncertainties and other factors, which could cause actual results to differ materially from future
 results expressed, projected or implied by the forward-looking statements. Forward-looking statements often address our expected future business and financial performance and financial condition, and often contain words such as
 “anticipate,” “intend,” “plan,” “will,” “could,” “would,” “estimate,” “should,” “expect,” “believe,” “project,” “target,” “indicative,” “preliminary,” “potential” and similar expressions. Forward-looking statements in this presentation may include,
 without limitation: (i) over the next five years we expect to see higher than the average reserve grade and cash flow at Greens Creek; (ii) Greens Creek’s strong cash flows in the first half of the year should be repeated in the second
 half and into the future, including 40% more cash flow over the next 5 years compared to the last 5 years at current prices; (iii) we expect there to be more than a decade of reserve life at each of Greens Creek, Casa Berardi and Lucky
 Friday; (iv) our ability to make our mines better with new technologies that can generate returns for many years to come, including automation at Casa Berardi reducing operating costs to $1.50/ton; (v) our efforts to reduce planned
 2019 expenditures by $25 million; (vi) the expectation that our cash flow will increase over the remainder of 2019, including generating more cash than we spend in the third quarter; (vii) cash generation increasing in the fourth quarter;
 (viii) the expectation that we can generate additional EBITDA so that our debt to EBITDA will be less than 2.5x and the stabilization of our financial position will be reflected by year end; (ix) that we will not experience any constraints on
 availability of the revolver due to compliance with covenants; (x) that we will be able to successfully refinance our outstanding senior notes in the 1H2020; (xi) that we will receive additional revenues from anticipated higher commodity
 prices and higher production of gold in 2H19 along with similar silver production; (xii) improvement in our net debt to EBITDA ratio covenant in the revolver; (xiii) that the net balance drawn on the revolver is expected to be zero by the
 end of the year; (xiv) we are taking the necessary actions on a timely basis that we think will improve our financial position; (xv) that we expect to mine out Fire Creek by the middle of next year; (xvi) that in the near future we will obtain
 approval from the U.S. Bureau of Land Management to increase permitted water discharge at Fire Creek; (xvii) we expect water inflows of approximately 300 gallons per minute in the future at Fire Creek; (xviii) we expect to obtain a
 non-consumptive water right of 1000 gallons per minute at Fire Creek from the State of Nevada within 12 months; (xix) ability to achieve forecast silver and gold production, cost of sales, cash and all in sustaining cost, after by-product
 credit and sustaining capital estimates at Greens Creek, Casa Berardi, Lucky Friday, San Sebastian and in Nevada; (xx) stope development at Fire Creek should be completed in September 2019; (xxi) we project the AISC, after by-
 product credits to be under $1,000 in the second half of 2019 at our Nevada Operations unit; (xxii) we forecast 2019 annual silver production of 9 million ounces; (xxiii) at Casa Berardi, we expect to continue pre-crushing ore and that
 this yield an additional 400 tons per day of throughput and several thousand ounces in the second half of the year; (xxiv) we expect grades to improve by 10% in the second half of 2019 at Casa Berardi; (xxv) we reach our estimate of
 2019 annual production at Lucky Friday; (xxvi) at San Sebastian, we expect the contractor should begin the long-hole mining trial soon, and the sulfide bulk sample is progressing well and could add 1.2 million tons or 5 years of mine
 life; (xxvii) that the plan to move high-grade forward in the mine plan at Greens Creek will occur in 2020 as planned; (xxviii) that drilling in the 148 and 152 zones at Casa Berardi has potential to be brought in as additional production in
 2020; (xix) that the El Toro exploration has the potential to extend San Sebastian production past 2020; (xxx) that exploration results in the 160 zone at Casa Berardi could lead to production using bulk mining methods; (xxxi) surface
 drilling will commence at the surface at Hollister east of the current Hatter Graben resource; (xxxii) ability to secure third party toll milling and realize lower milling and transportation costs at Fire Creek which could lower the cutoff
 grade; (xxxiii) ability to mine Fire Creek reserves and resources to 2023; and (xxxiv) successful deliver of remote vein mining machine to Lucky Friday in the second quarter of 2020 and its ability to increase production and
 development in 2020. The material factors or assumptions used to develop such forward-looking statements or forward-looking information include that the Company’s plans for development and production will proceed as expected
 and will not require revision as a result of risks or uncertainties, whether known, unknown or unanticipated, to which the Company’s operations are subject.

 Estimates or expectations of future events or results are based upon certain assumptions, which may prove to be incorrect, which could cause actual results to differ from forward-looking statements. Such assumptions, include, but are
 not limited to: (i) there being no significant change to current geotechnical, metallurgical, hydrological and other physical conditions; (ii) permitting, development, operations and expansion of the Company’s projects being consistent
 with current expectations and mine plans; (iii) political/regulatory developments in any jurisdiction in which the Company operates being consistent with its current expectations; (iv) the exchange rate for the USD/CAD and USD/MXN,
 being approximately consistent with current levels; (v) certain price assumptions for gold, silver, lead and zinc; (vi) prices for key supplies being approximately consistent with current levels; (vii) the accuracy of our current mineral
 reserve and mineral resource estimates; (viii) the Company’s plans for development and production will proceed as expected and will not require revision as a result of risks or uncertainties, whether known, unknown or unanticipated;
 (ix) counterparties performing their obligations under hedging instruments and put option contracts; (x) sufficient workforce is available and trained to perform assigned tasks; (xi) weather patterns and rain/snowfall within normal
 seasonal ranges so as not to impact operations; (xii) relations with interested parties, including Native Americans, remain productive; (xiii) economic terms can be reached with third-party mill operators who have capacity to process
 our ore; (xiv) maintaining availability of water rights; (xv) factors do not arise that reduce available cash balances, (xvi) there being no material increases in our current requirements to post or maintain reclamation and performance
 bonds or collateral related thereto, and (xvii) the Company's plans for refinancing its high yield notes proceeding as expected.

NYSE: HL                                                                                                                                                                                                                RESPONSIBLE. SAFE. INNOVATIVE. l 2
Hecla Mining Company - H. C. Wainwright Global Investment Conference Value in Precious Metals
CAUTIONARY STATEMENTS (cont’d)

Cautionary Statement Regarding Forward Looking Statements (Cont’d)
In addition, material risks that could cause actual results to differ from forward-looking statements include, but are not limited to: (i) gold, silver and other metals price volatility; (ii) operating risks; (iii) currency fluctuations; (iv)
increased production costs and variances in ore grade or recovery rates from those assumed in mining plans; (v) community relations; (vi) conflict resolution and outcome of projects or oppositions; (vii) litigation, political, regulatory,
labor and environmental risks; (viii) exploration risks and results, including that mineral resources are not mineral reserves, they do not have demonstrated economic viability and there is no certainty that they can be upgraded to
mineral reserves through continued exploration; (ix) the failure of counterparties to perform their obligations under hedging instruments, including put option contracts; (x) our plans for improvements at our Nevada operations,
including at Fire Creek, are not successful; (xi) our estimates for the third and fourth quarter results are inaccurate; (xii) we take a material impairment charge on our Nevada operations; (xiii) we are unable to remain in compliance
with all terms of the credit agreement in order to maintain continued access to the revolver, and (xiv) we are unable to refinance the maturing high yield notes. For a more detailed discussion of such risks and other factors, see the
Company’s 2018 Form 10-K, filed on February 22, 2019, and Form 10-Q filed on each of May 9, and August 7, 2019 with the Securities and Exchange Commission (SEC), as well as the Company’s other SEC filings. The Company
does not undertake any obligation to release publicly revisions to any “forward-looking statement,” including, without limitation, outlook, to reflect events or circumstances after the date of this presentation, or to reflect the
occurrence of unanticipated events, except as may be required under applicable securities laws. Investors should not assume that any lack of update to a previously issued “forward-looking statement” constitutes a reaffirmation of
that statement. Continued reliance on “forward-looking statements” is at investors’ own risk.

Cautionary Note Regarding Estimates of Measured, Indicated and Inferred Resources
The SEC permits mining companies, in their filings with the SEC, to disclose only those mineral deposits that a company can economically and legally extract or produce. We use certain terms in this presentation, such as
“resource,” “measured resources,” “indicated resources,” and “inferred resources” that are recognized by Canadian regulations, but that SEC guidelines generally prohibit U.S. registered companies from including in their filings with
the SEC, except in certain circumstances. U.S. investors are urged to consider closely the disclosure in our most recent Form 10-K and Form 10-Q. You can review and obtain copies of these filings from the SEC’s website at
www.sec.gov.

Qualified Person (QP) Pursuant to Canadian National Instrument 43-101
Dean McDonald, PhD. P.Geo., Senior Vice President - Exploration of Hecla Mining Company, who serves as a Qualified Person under National Instrument 43-101("NI 43-101"), supervised the preparation of the scientific and
technical information concerning Hecla’s mineral projects in this presentation, including with respect to the newly acquired Nevada projects. Information regarding data verification, surveys and investigations, quality assurance
program and quality control measures and a summary of analytical or testing procedures for the Greens Creek Mine are contained in a technical report titled “Technical Report for the Greens Creek Mine” effective date December
31, 2018, and for the Lucky Friday Mine are contained in a technical report titled “Technical Report for the Lucky Friday Mine Shoshone County, Idaho, USA” effective date April 2, 2014, for Casa Berardi are contained in a technical
report titled "Technical Report on the mineral resource and mineral reserve estimate for Casa Berardi Mine, Northwestern Quebec, Canada" effective date December 31, 2018 (the "Casa Berardi Technical Report"), and for the
San Sebastian Mine, Mexico, are contained in a technical report prepared for Hecla titled “Technical Report for the San Sebastian Ag-Au Property, Durango, Mexico” effective date September 8, 2015 . Also included in these four
technical reports is a description of the key assumptions, parameters and methods used to estimate mineral reserves and resources and a general discussion of the extent to which the estimates may be affected by any known
environmental, permitting, legal, title, taxation, socio-political, marketing or other relevant factors. Information regarding data verification, surveys and investigations, quality assurance program and quality control measures and a
summary of sample, analytical or testing procedures for the Fire Creek Mine are contained in a technical report prepared for Klondex Mines, dated March 31, 2018; the Hollister Mine dated May 31, 2017, amended August 9, 2017;
and the Midas Mine dated August 31, 2014, amended April 2, 2015. Copies of these technical reports are available under Hecla's and Klondex's profiles on SEDAR at www.sedar.com.

Dr. McDonald reviewed and verified information regarding drill sampling, data verification of all digitally-collected data, drill surveys and specific gravity determinations relating to the Casa Berardi mine. The review encompassed
quality assurance programs and quality control measures including analytical or testing practice, chain-of-custody procedures, sample storage procedures and included independent sample collection and analysis. This review
found the information and procedures meet industry standards and are adequate for Mineral Resource and Mineral Reserve estimation and mine planning purposes.

Cautionary Note Regarding Non-GAAP measures
Cash cost per ounce of silver and gold, net of by-product credits, EBITDA, adjusted EBITDA, AISC, after by-product credits, and free cash flow represent non-U.S. Generally Accepted Accounting Principles (GAAP) measurements.
A reconciliation of these non-GAAP measures to the most comparable GAAP measurements can be found in the Appendix.

NYSE: HL                                                                                                                                                                                                              RESPONSIBLE. SAFE. INNOVATIVE. l 3
Hecla Mining Company - H. C. Wainwright Global Investment Conference Value in Precious Metals
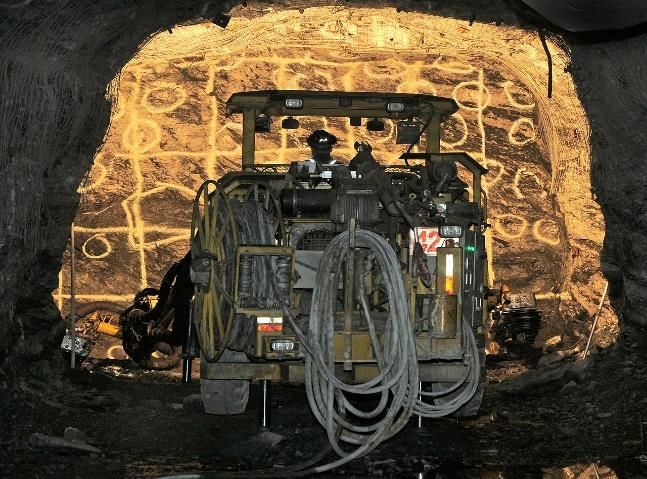
HECLA HAS FUNDAMENTAL VALUE
Strength obscured by the Nevada acquisition

                       Characteristics are unique among peers                                                                                            Asset Overview

•   Largest primary silver producer in the US, third largest producer
    of lead and zinc
•   Best mining jurisdictions: Alaska, Quebec, Idaho, Nevada, and
    Durango (Mexico)
•   Mine lives are long: most mines have 10+ year lives
•   Low-cost, high-margin: silver margin of $5.50, gold margin of $75
    at $18/oz silver and $1,500/oz gold
•   Proven history
•   Brand value of Hecla equity having been among the best
    performing NYSE stocks multiple times
                                                                                                                                      Key Operating and Financial Highlights
                                                                                                                                                           262                           $646
                                                                                                                                234           233                                                      $578          $567
                                                                                                                         17.2
                                                                                                                  189                                                      $444
                                                                                                                                       12.5

                                                                                                                                                                   ($mm)
                                                                                                           11.6
                                                                                                                                                    10.4                                        $265
                                                                                                                                                                                                              $232          $212
                                                                                                                                                                                  $117

                                                                                                            2015A         2016A         2017A        2018A                  2015A         2016A         2017A          2018A
                                                                                                                  Ag Prod. (Moz)        Au Prod. (Koz)                              Revenue             Adj. EBITDA¹

    Established miner, proven operational track record, with assets in mining friendly jurisdictions in North America
           Source: Company disclosures
NYSE: HL   1 Adjusted EBITDA is a non-GAAP measure; please refer to appendix for reconciliation to GAAP.                                                          RESPONSIBLE. SAFE. INNOVATIVE. l 4
Hecla Mining Company - H. C. Wainwright Global Investment Conference Value in Precious Metals
SOLID PLANS TO DEAL WITH CHALLENGES
Does not impair Hecla’s fundamental value found in Greens Creek and Casa Berardi

 Challenges                        Plans
 Refinancing the 2021 debt         •   Bring the net revolver debt to zero by year end
                                   •   Increase EBITDA so Debt/EBITDA ratio is < 2.5
                                   •   Refinance in 1H20

 Ramping Lucky Friday production   •   Continuous mining machine on site in 2Q20
                                   •   Increase production/development in 2020
                                   •   Workforce slowly returning, supplement with others

 Methodically improving Nevada     • Pause on significant investment until have clearer ability
                                     to generate returns
                                   • Focus on
                                      • Water rights and permits
                                      • Third Party processing of refractory ore
                                      • Lower mining costs

NYSE: HL                                                                            RESPONSIBLE. SAFE. INNOVATIVE. l 5
Hecla Mining Company - H. C. Wainwright Global Investment Conference Value in Precious Metals
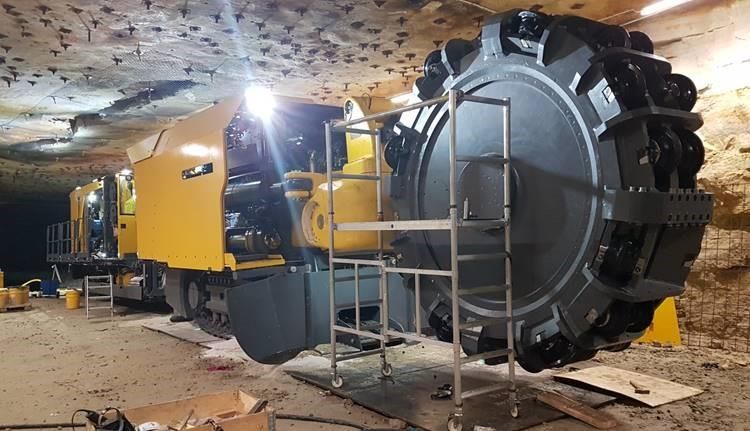
DIVERSE ASSET PORTFOLIO IN MINING FRIENDLY JURISDICTIONS

                                              Fundamental Operations                                                                                 Growth / Transformation
                                  Greens Creek                              Casa Berardi                            San Sebastian                                 Nevada                         Lucky Friday

 Location/ Risk Score1            Alaska, USA (76.9)                    Quebec, Canada (87.5)                    Durango, Mexico (65.1)                     Nevada, USA (90.5)                  Idaho, USA (84.5)

   Primary Product                        Silver                                   Gold                                     Silver                                   Gold                          Silver / Zinc

   2018 % Revenue
                                          47 %                                     37 %                                      9%                                      5%                                2%
     Contribution
    2018 Reserves                  107.1 Moz silver                           1.9 Moz gold                             2.8 Moz silver                            77 Koz gold                       81 Moz silver

  2019E Production2                 24.0 Moz AgEq.                          12.7 Moz AgEq.                            3.0 Moz AgEq.                            5.5 Moz AgEq.                      1.3 Moz AgEq.

 2019E Cost of Sales                     $201 M                                   $210 M                                   $46 M                                   $147 M                              N/A

     2019E AISC3                     $ 7.50 / oz Ag                          $ 1,250 / oz Au                          $ 13.00 / oz Ag                          $ 1,600 / oz Au                         N/A

2019E Sustaining Capex                   $ 42 M                                   $ 43 M                                  $ 1.5 M                                      ─                                ─

   2018 Gross Profit                     $75 M                                    $11 M                                     $8 M                                       ─                                ─

      2018 FCF3                          $ 84 M                                   $ 43 M                                  $ (0.8) M                                    ─                                ─

    Start-Up Year                         1989                                     1989                                     2015                                 2012 / 2005                           1942

 Mine Life at Start-up                   7 years                                  6 years                                18 months                            3 years / 2 years                       2 years

Remaining Reserve Life                  11 years                                 15 years                                  2 years                             3 years / 1 year                      17 years
                                                                         Doubled tonnage for
                              Hecla’s flagship mine:                                                                                                                                          Historic mine with higher
                                                                       economies of scale with                  Production diversification            Large land package with high-
                           ~$1bn in cumulative free cash                                                                                                                                    grades and new technology in
                                                                       open pit supplementing                     with attractive upside                   grade prospectivity
                              flow over last 10 years                                                                                                                                                 the future
                                                                            underground
                         ¹ Political Risk Score based on Fraser Institute of Mining 2017 Report (Higher is Better).
                         2 Please refer to footnote 3 on the Endnotes slide in the Appendix.
NYSE: HL                 3 AISC, after by-product credits, per produced silver/gold ounce. AISC and FCF are non-GAAP measures; please refer to appendix for reconciliation to GAAP.
                                                                                                                                                                                      RESPONSIBLE. SAFE. INNOVATIVE. l 6
Hecla Mining Company - H. C. Wainwright Global Investment Conference Value in Precious Metals
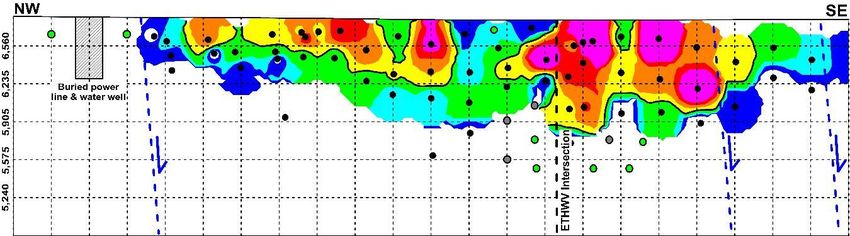
OUR BEST MINES KEEP GETTING BETTER
New Technical Reports show over $1.5 billion of NPV from reserves alone

                                 Greens Creek                                                                                                           Casa Berardi
    Expect 40% more free cash flow in the next 5 years than the $72
          million averaged in the past 5 years (current prices).                                                                Once pits stripped could generate Greens Creek-like free cash flow.

  Generates an after-tax Net Present Value (NPV) of $1 billion at a 5%                                                    Generates an after-tax NPV of $545 million (CAN$735 million) at a 5%
                             discount rate 2                                                                                                         discount rate3

                          Significant exploration potential                                                                                       Significant exploration potential

                 Significant gold, zinc and lead reserves too                                                                                       Consolidated land package

                                                                            More Value Beyond the Known Reserves

                        Reserve Life of Mine to 2030                                                                                           Reserve Life of Mine to 2034
                 107.1 Moz
                                        97.4 Moz                                                                                             1.91 Moz

                                                                                                                                                              1.2 Moz

                                                                36 Moz                                                                                                       0.652 Moz

                            Silver Reserves/Resources                                                                                               Gold Reserves/Resources
                               P+P        M&I       Inferred                                                                                            P+P    M&I      Inferred
             1 Silverreserves calculated at $14.50/oz; gold reserves calculated at $1,200/oz.
             2 For price assumptions refer to the Greens Creek Technical Report, which can be found on the Company’s website.
NYSE: HL     3 For price assumptions refer to the Casa Berardi Technical Report, which can be found on the Company’s website.                                             RESPONSIBLE. SAFE. INNOVATIVE. l 7
Hecla Mining Company - H. C. Wainwright Global Investment Conference Value in Precious Metals
GREENS CREEK: STRONG PRODUCTION, CASH FLOW
30th year of operations, long runway ahead

                                                                                               Q2 2019      2019E4

           Silver Production (Moz)                                                                 2.4        9.0
           Gold Production (Koz)                                                                  13.3       52.0
           Cost of Sales1                                                                      $45.6 M      $202 M
           Cash cost, after by-product credits, per silver oz2                                 $2.38/oz     $2.25/oz

           AISC, after by-product Credits, per silver oz3                                      $6.37/oz     $7.50/oz

                     Metal Produced Over Past 30 Years

               225 Moz
                                                   1.6 Moz                             3 Blbs
                                                                                                               1 Blbs

                                                  Silver           Gold           Zinc           Lead
                 Note: Please see endnotes in the appendix for footnote references.
                 AISC and FCF are non-GAAP measures; please refer to appendix for reconciliation to GAAP.
NYSE: HL                                                                                                                RESPONSIBLE. SAFE. INNOVATIVE. l 8
Hecla Mining Company - H. C. Wainwright Global Investment Conference Value in Precious Metals
GREENS CREEK HAS GENERATED OVER $1B OF NET CASH FLOW
Significant improvement in performance since Hecla became operator

                                        Cumulative Net Cash Flow                                                                                  Greens Creek Throughput has Grown 15% Since Purchase in 2008
                                                                                                                                                850                          Greens Creek Production and Reserves                                         16
                                                                                                              $1,246
                                                                                                     $1,162                                                                                                                                               14
                                                                                            $1,061
                                                                                    $983                                                                                                                                                                  12
                                                                            $941

                                                                                                                                                                                                                                                               Ore Reserves (Mtons)
                                                                    $875                                                                        800

                                                                                                                       Ore Production (ktons)
                                                            $812                                                                                                                                                                                          10

                                                    $698
                                                                                                                                                                                                                                                          8

                                            $504                                                                                                                Hecla became
                                                                                                                                                                  operator                                                                                6
                       Hecla became                                                                                                             750
                         operator
                                  $324
                                                                                                                                                                                                                                                          4
                             $216
                     $122                                                                                                                                                                                                                                 2

                                                                                                                                                700                                                                                                       0

                                                                                                                                                      2005

                                                                                                                                                             2006

                                                                                                                                                                    2007

                                                                                                                                                                           2008

                                                                                                                                                                                  2009

                                                                                                                                                                                         2010

                                                                                                                                                                                                2011

                                                                                                                                                                                                       2012

                                                                                                                                                                                                                2013

                                                                                                                                                                                                                       2014

                                                                                                                                                                                                                              2015

                                                                                                                                                                                                                                     2016

                                                                                                                                                                                                                                            2017

                                                                                                                                                                                                                                                   2018
             $(11)
$(118)
              2006

                      2007

                              2008

                                     2009

                                             2010

                                                     2011

                                                             2012

                                                                     2013

                                                                             2014

                                                                                     2015

                                                                                              2016

                                                                                                       2017

                                                                                                                2018
Cumulative
Until 2005

                                                                                                                                  • Automation drive beginning in 2017 leads to further efficiencies
                                                                                                                                  • Consistent exploration success enables reserves to be maintained

NYSE: HL                                                                                                                                                                                                      RESPONSIBLE. SAFE. INNOVATIVE. l 9
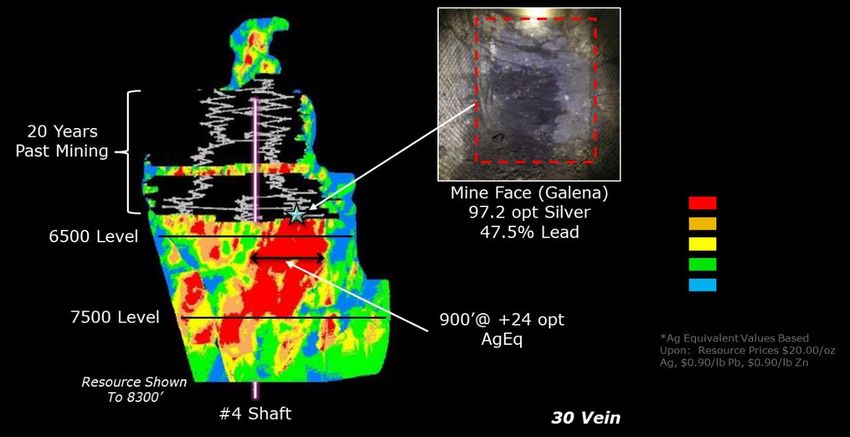
Hecla Mining Company - H. C. Wainwright Global Investment Conference Value in Precious Metals
GREENS CREEK
Continuous improvement projects adding value
                                                                                         Ventilation Fan

• Ventilation on demand reduces energy usage.
    • $300,000 project to add variable speed drives saves $200,000
      in annual electricity cost.
• Automation increases efficiency by operating during down-times
  (teleremote LHD).
• Mine planning moving high grade forward in plan and reducing
  development adding 40 percent more cash flow over next 5 years
  at current prices.

                                                                     Teleremote LHD
                                   New Mine Plan Design
           Old Design
                                   Utilize existing workings

NYSE: HL                                                                       RESPONSIBLE. SAFE. INNOVATIVE. l 10
CASA BERARDI
Large reserves and resources position for strong cash flow

                                                                                        Q2 2019          2019E4

                     Gold Production (Koz)                                                31.3           146.0

                     Cost of Sales1                                                     $55.2 M          $210 M

                     Cash cost, after by-product credits, per gold oz2                 $1,101/oz        $950/oz

                     AISC, after by-product credits, per gold oz3                      $1,437/oz       $1,250/oz

  2019E Sustaining Capital                $43 M

                                          CF from operating activities of $82.9 M (GAAP) less capital expenditures of
  FCF 20186
                                          $39.7 M resulted in $43.2 M FCF (non-GAAP).

                                                        At 12/31/18                                   At 12/31/17
  2P Reserves                             1.9 Moz gold @ 0.08 oz/t gold                 1.49 Moz @ 0.11 oz/t gold
  M+I Resources                           1.2 Moz gold @ 0.09 oz/t gold                 1.4 Moz @ 0.10 oz/t gold

                                                                    Note: Please see endnotes in the appendix for footnote references.
NYSE: HL                                                            * AISC and FCF are non-GAAP measures; please refer to appendix for reconciliation to GAAP.   RESPONSIBLE. SAFE. INNOVATIVE. l 11
CASA BERARDI
Increasing safety, productivity with a commitment to innovation

                                                              Automated
                                                               Hoisting

                                   Wi-Fi                                                     Automated
                                Communication                                                Jumbo Drill

                                                            Commitment
                                                            to Innovation
                                                                                                    Automated
                             Telemetry                                                             Underground
                                                                                                     Haulage

                                           Ventilation on                    Automated
                                             Demand                         Stope Drilling

NYSE: HL                                                                                                         RESPONSIBLE. SAFE. INNOVATIVE. l 12
985 DRIFT AUTONOMOUS HAULAGE IN OPERATION
Two trucks run 24 hours a day; cost savings realized
                                                                                  Loading 40-tonne
                                                                                  autonomous
                                                                                  Sandvik truck

  •    2 self-driving underground haulage vehicles instead of 5 manned vehicles
  •    Capital investment was $3.5 M vs $5.5 M for traditional manned vehicles (includes rebate)
  •    Operating costs per ton are reduced by more than 50% ($2.58/tonne vs $5.15/tonne traditional)
  •    Expected to decline to $1.50/tonne over time

NYSE: HL                                                                                RESPONSIBLE. SAFE. INNOVATIVE. l 13
GROWING OPEN PITS AND NEW HIGH GRADE UNDERGROUND
West Mine Crown Pillar (WMCP) latest addition to the pits; 148 to the underground are improving
the dynamic Casa Berardi

  • 28% increase in gold reserves       3D isometric view Casa Berardi Mine
                                                  1500 feet
                                                                                                              Mined out                                          Projection of
                                                                                                  4 g/t model Underground Resources                              Ore trends
  • Now 5 proposed open pits that                                                                     1 g/t model Pit Resources

    are growing in size                            WMCP Pit

  • Successful underground                                                        Principal Pit
    exploration is extending the
    reserve                                                                                                134 Pit
                                                                                                                            EMCP Pit
                                                   Lower Inter
  • High grade discovered in 148                     Zone              119 Zone                                             Extension
                                                                                                                                         EMCP Pit
    Zone (East mine) added earlier                                                      128 Zone
                                                                                                                                                                          160 Pit

    in mine plan                                                                                                          146 Zone
                                                         113 Zone
  • Excellent exploration potential                                                                                                                 152 Zone

    along 30 kilometers of the Casa                       118 Zone            123 Zone

    Berardi break                                                                                                             148 Zone                     159-160 Zone

  • 2019 Technical Report
    highlighted significant increases
    in mine life, has improved
    further since
NYSE: HL                                                                                                                                     RESPONSIBLE. SAFE. INNOVATIVE. l 14
Growth/Transformative Mines

NYSE: HL                                 RESPONSIBLE. SAFE. INNOVATIVE. l 15
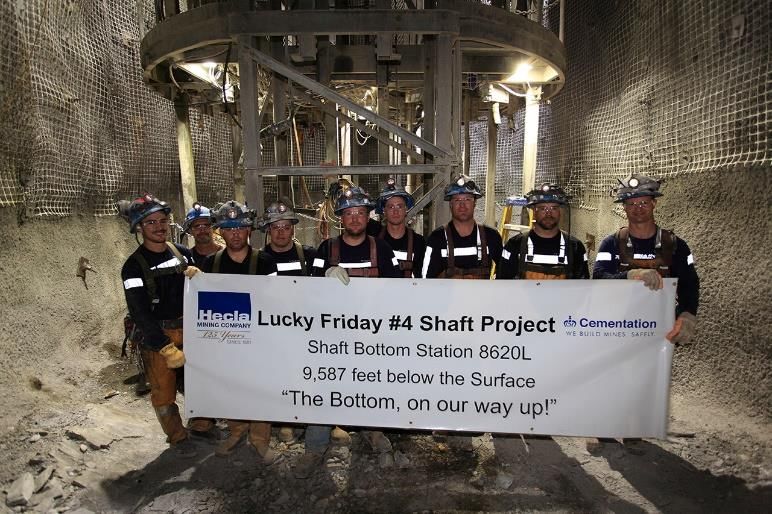
LUCKY FRIDAY HAS A LONG HISTORY OF INNOVATION

           History                Long-term Goals                Strike               Safety
First paste fill plant in US   Increase safety             Continue             CORESafety
                                                           negotiating          registered
First circular shaft in        Higher productivity:        Focus is on          AIFR below the
CDA District                   tons/employee vs industry   preparing the mine   national average
                                                           for the RVM and
                                                           production at the
                                                           higher prices
Completed #4 shaft             Increase throughput                              Sentinels of Safety
First underhand cut and
fill mine in U.S.
NYSE: HL                                                                                              RESPONSIBLE. SAFE. INNOVATIVE. l 16
LUCKY FRIDAY GRADE INCREASING AT DEPTH
Eventually expect 60% more annual silver production compared to historic production

NYSE: HL                                                                     RESPONSIBLE. SAFE. INNOVATIVE. l 17
CONTINUOUS MECHANICAL CUTTING IS COMING
Currently undergoing test mining in Sweden

                                Remote Vein Miner Fabrication Completed

NYSE: HL                                                                  RESPONSIBLE. SAFE. INNOVATIVE. l 18
NEVADA IS HECLA’S NEWEST ASSET
Why we invested in Nevada

• 110-square mile land position with
  three, one-ounce head grade mines.
• Hatter Graben, part of Hollister, that has
  1.4 oz head grades, the potential for a
  million-ounce orebody.
• Opportunity to improve Fire Creek
  operations to lower the cut-off grade
  and increase throughput.                     Hatter Graben
                                               Development

   Fire Creek Vein 76

NYSE: HL                                                       RESPONSIBLE. SAFE. INNOVATIVE. l 19
SAN SEBASTIAN
Just-in-time mining; looking to make it a long-life mine

    • Mined from 2001-2005, restarted in 2016 with 18-month life
    • Great return on $15 million of capital invested
       • Using leased mill and contract miners
    • Oxide production continues in 2020
       • El Toro vein has good potential to extend it further
    • Sulfide bulk sample progress is positive; final results expected by
      year end

NYSE: HL                                                                    RESPONSIBLE. SAFE. INNOVATIVE. l 20
SAN SEBASTIAN SULFIDES COULD EXTEND MINE LIFE
 Bulk sample on track; results by year end

                                             • Bulk sample test underway
                                             • Long-hole stoping testing
                                                 • Sills complete
                                                 • Long holes are exceeding design
                                             • Third-party mill testing of 24,000 tons
                                                 • Batch process every few weeks
                                                 • Results over the remainder of the
                                                    year
                                             • 1.2 million ton potential or five more
                                               years of mine life

NYSE: HL                                                     RESPONSIBLE. SAFE. INNOVATIVE. l 21
EL TORO OXIDE CONTINUES TO GROW
Intersection with HW Vein causes bulge; mining scenarios being evaluated

                                       EL TORO VEIN LONGITUDINAL SECTION
                                                   (Looking NE)

                                                 12.8 oz/ton silver     Cross-        28.1 oz/ton silver
                                                 0.06 oz/ton gold       Section       0.37 oz/ton gold
                                                                         ETV-                                $NSR
                                                   over 4.9 feet                        over 7.9 feet       VALUE
                                                                        ETHWV                              PER TON
                                                                                                            (5.9 FT
                                                                                                           DILUTED)

     PROGRAMMED DRILL HOLE                                            7.6 oz/ton silver
     DRILL HOLE ASSAYS PENDING                                        0.11 oz/ton gold
     DRILL HOLE INTERCEPT                                              over 11.2 feet
     FAULT
     $100 NSR + CUTOFF FOR OP MINING

• Growing high-grade, near surface oxide resource
• Intersection of El Toro and Hangingwall vein producing strong intersections, good widths
• Starting the mine planning and permitting process
NYSE: HL                                                                                                              RESPONSIBLE. SAFE. INNOVATIVE. l 22
Stabilized Financial Position

NYSE: HL                                   RESPONSIBLE. SAFE. INNOVATIVE. l 23
HECLA POSITIONED FOR REFINANCING HIGH YIELD NOTES
Expect 2H19 to have increased production, lower costs and higher free cash flow

           Expect more gold production in 2H19

           Expect similar silver production in 2H19

           Gold and silver prices are higher

           Stopped the outspend in Nevada

           Reduced capital, exploration and G&A by $25m in the second half

           Revolver repayment is a priority

           Objective is to be no more than 2.5 times Debt to EBITDA

NYSE: HL                                                                          RESPONSIBLE. SAFE. INNOVATIVE. l 24
Why Hecla is a Value Proposition?

NYSE: HL                                   RESPONSIBLE. SAFE. INNOVATIVE. l 25
MARKET IS UNDERVALUING GREENS CREEK & CASA BERARDI
Greens Creek and Casa Berardi worth more than market capitalization
                                                                                                                                                                      Greens Creek and
                                                                                                                                                                     Casa Berardi NAV5%
                                                                                                                                                                         per 43-101
                                                                  Analyst Average Valuation

                                       $385                                                                                                                               $1,540
                                                                $1,475

            $1,090

                                                                                          $(815)                     $660

    Greens Creek + Casa               Other**                Mining NAV           Net Debt & Corp Adj Discounted Total NAV                                     Greens Creek + Casa
          Berardi                                                                                     per Analyst Averages*                                         Berardi***
                                                                                                                                                                  Discounted Total
                                                                                                                                                                 NAV5% with 43-101
      Our Total Discounted NAV5% using 43-101 Estimates for Greens Creek and Casa Berardi is $1.5 Billion                                                           valuations is
                                                                                                                                                                 approximately $1.1
      • 68% higher than discounted NAV5% per analyst average
                                                                                                                                                                       Billion
      • 26% higher than current Market Cap of $880 million(1)

 (1) Market cap as of September 5, 2019
 *Analyst NAVs based on averages of the following banks: H.C. Wainwright, Canaccord-Genuity, CIBC, BMO, Scotiabank, RBC, Bank of America Merrill Lynch
 ** Other includes: Lucky Friday ($209 mm), San Sebastian ($27 million), Nevada ($57 million), Exploration/Other ($92 million)
 *** 5% discounted NAV’s from 43-101s filed on April 1, 2019. Greens Creek: $1 billion (at $1500 gold, $17.62 silver), Casa Berardi: $540 million ((at $1500 gold)
NYSE: HL                                                                                                                                        RESPONSIBLE. SAFE. INNOVATIVE. l 26
MOVING TO CREATING VALUE
Foundation is set, additional value creation expected

 Foundation is built on Greens Creek & Casa Berardi

 Other mines could be meaningful contributors

 Financial position has stabilized and expect to be reflected by year-end

 We feel market has oversold us over Nevada and refinancing risk

  Fundamental equity value just on proven and probable reserves at Greens
  Creek & Casa Berardi
  Additional reserves expected there and at our growth/transformational
  assets

NYSE: HL                                                           RESPONSIBLE. SAFE. INNOVATIVE. l 27
Other Supporting Information

NYSE: HL                                  RESPONSIBLE. SAFE. INNOVATIVE. l 28
STEPS TAKEN TO IMPROVE NEAR-TERM LIQUIDITY

           Reduced expenditures by $25 million (Capital, Exploration and G&A)

           Bought put option contracts to establish a floor for silver and gold
           prices through Q1 2020

           Worked with revolver syndicate of banks to relieve leverage covenants
           through the expected refinancing of the debt

           Continued limited production at Lucky Friday reduces cash usage

           Expect revolver to be fully repaid by year end

           Higher precious metals prices helping

NYSE: HL                                                                           RESPONSIBLE. SAFE. INNOVATIVE. l 29
LONGER TERM VIEW

 Are comfortable carrying some debt as part of capital structure
    • Reduces the need for large, dilutive equity issuances
    • Revenue comes from four metals, reduces risk
 Expect to refinance high yield debt by May 2020 (due May 2021)

 Reviewing other options including amortizing bank loan

 A long-term target of net debt/EBITDA of less than 2.5x

NYSE: HL                                                      RESPONSIBLE. SAFE. INNOVATIVE. l 30
NEVADA OPERATIONAL CHANGES
Taking action to reduce cost structure

                                                         Midas Mill
   •   Mining of available faces expected to
       continue at Fire Creek until mid-2020 and
       until Q3 2019 at Midas.
   •   Reduction of $25 million in expenditures in
       Capital, Exploration and G&A.
   •   25% reduction in personnel in Nevada
       completed.
   •   About $5 million of capital expenditures in H2.
   •   Progressed dewatering strategy at Fire
       Creek.
   •   Continued toll milling discussions.

NYSE: HL                                                              RESPONSIBLE. SAFE. INNOVATIVE. l 31
LEADING PRECIOUS METAL, LEAD AND ZINC PRODUCER WITH
DIVERSE ASSETS AND COMMODITY MIX
#1 Silver and #3 lead and zinc producer in the U.S.

                                                                                                                    Silver Production: 3.0 Moz
                                                                                                                    Cost of Sales: $61.7 M
                                                                                                                    Cash Costs, after by-product credits: $3.50/oz
                                                                                 16%                                Realized Price: $15.01/oz
                                                                                                      25%

                                                                         5%
                                                                                                                    Gold Production: 60.8 Koz
                                                                                                                    Cost of Sales: $92.7 M
                         Q2 2019 Margins                                                                            Cash Costs, after by-product credits: $1,151/oz
                                                                                                                    Realized Price: $1,322/oz
                      Silver Margin: $11.51/oz
                      Gold Margin: $171.00/oz
                                                                                                                    Lead Production: 5.5 Ktons
                                                                                                                    Realized Price: $0.84/lb
                                                                                       54%
                                                                                                                    Zinc Production: 13.3 Ktons
                                                                                                                    Realized Price: $1.17/lb
                                                                        Silver     Gold            Lead      Zinc

              Greens Creek                         Casa Berardi                         San Sebastian                       Nevada                                       Lucky Friday

                                                                                                                             5%                                          14%
           34%
                            41%                                                   41%
                                                                                                                                                                                       50%
                                                                                                       59%
                                                                                                                                                                      36%
            7%
                  18%                                                                                                          95%

            41% of Total Revenue                 34% of Total Revenue                  8% of Total Revenue            13% of Total Revenue                             4% of Total Revenue

NYSE: HL                                                                                                                                                    RESPONSIBLE. SAFE. INNOVATIVE. l 32
CAPITAL ALLOCATION PRIORITIES (AFTER DEBT SERVICE)
Strong cash flow from operations invested in discretionary projects

                     Investment in exploration, technology and innovation has generated robust double digit returns: Much higher than dividends, share buybacks,
                                                                                  debt repayment
             (in millions)                                          Total 3-year Discretionary Expenditures: $127.4 million

                       $140.9

                                           $(73.9)
                                                                 $(13.5)
                                                                                           $(12.0)                                                      $13.5
                                                                                                                      $(14.1)
                                                                                                                                     $(13.9)
                Free
                FreeCash
                       CashFlow Before
                              Flow       Exploration        Pre-development            Research &            Discretionary Capex   Dividends      Cash
                     Discretionary                                                                                                                 ExcessFlow  from
                                                                                                                                                         Cash Flow
                                                                                       Development                                               Operations - (Capex
                     Expenditures
                                                                                                                                                    + Dividends)

                         Robust 3-year free cash flow generation, with excess cash reinvested in the business as a first priority

NYSE: HL                                                                                                                                          RESPONSIBLE. SAFE. INNOVATIVE. l 33
RECORD OF GROWING RESERVES
Significant increases at much lower prices

                                                    Silver Reserves Growth                                                                                                   Gold Reserves Growth

                                                     120.0

                                                                                                                                                                                                                1.5                  2.8
                                                                                                        191.0                                                         2.0
                                                                                (76.7)

                                                                                                                        (millions of ounces)
             (millions of ounces)

                                    147.7

                                                                  133%***
                                                                                                                                                                                         (1.3)

                                                                                                                                                    0.7
                                                                                                                                                                                           685%***

                      2013 Beginning Reserves   Reserves Added,             Silver Produced,   Reserves, Replaced and                          2013 Beginning   Reserves Added,   Gold Produced, 2013-   Additions Through   Reserves, Replaced
                                                  2013-2018*                   2013-2018         Added 2013-2018                                 Reserves         2013-2018               2018             Acquisitions**        and Added
                                                                                                                                                                                                                                 2013-2018

                                    $ 26.5                                                             $ 14.5                                      $ 1400                                                                          $ 1200

                    Silver Price Used ($/oz)                                                                             Gold Price Used ($/oz)

NYSE: HL                                                                                                                                                                                                              RESPONSIBLE. SAFE. INNOVATIVE. l 34
THE MOST CONSERVATIVE SILVER PRICE ASSUMPTION IN THE INDUSTRY
Reserves are the basis for value creation

                                                                            Price Assumption is at the discretion of management
                                                                                                                                                                                                 HL Reserve
                                                                                                                                                                  $19.00              Year         Prices
                                                                                                                                                    $18.50
                                                                                                                         $18.00      $18.00                                           2012          $26.50
                                                                                                               $17.50
                                                                                                $17.00                                                                                2013          $20.00
                                                                  $16.00        $16.61
                                                     $16.00
                                                                                                                                                                                      2014          $17.25
Silver

                                        $15.50
                         $15.00
          $14.50                                                                                                                                                                      2015          $14.50
                                                                                                                                                                                      2016          $14.50
                                                                                                                                                                                      2017          $14.50
           Hecla        Fresnillo¹     Endeavour Agnico Eagle¹   Eldorado    3-year Trailing First Majestic    Coeur²    Silver     Goldcorp    Pan American     Fortuna¹
                                                                                                                                                                                      2018          $14.50
                                         Silver                                 Average                                 Standard

                                                                                                                                                                $1,300
                                                                                                                                                                                                 HL Reserve
                                                                               $1,240          $1,250         $1,250    $1,250     $1,250         $1,251                              Year         Prices
                                        $1,200       $1,200       $1,200                                                                                                              2012          $1,400
Gold

                                                                                                                                                                                      2013          $1,300
                         $1,150
                                                                                                                                                                                      2014          $1,225
         $1,100
                                                                                                                                                                                      2015          $1,100
                                                                                                                                                                                      2016          $1,200
         Fresnillo¹   Agnico Eagle¹     Hecla      Goldcorp      Eldorado     Endeavour        Silver         Coeur²    Fortuna¹    First      3-year Trailing Pan American           2017          $1,200
                                                                                Silver        Standard                             Majestic       Average                             2018          $1,200

                                     Represents High Yield Peer Issuers

NYSE: HL                                                                                                                                                                   RESPONSIBLE. SAFE. INNOVATIVE. l 35
CULTURE OF INNOVATION DRIVES PRODUCTIVITY IMPROVEMENTS
Technology and best practices to be leveraged across Klondex’ assets

           Autonomous Haulage in
                                                                                            Jumbo/Stope Drill
           Operation at Casa Berardi
                                                                                            Automation: Drilling During
           • 2- 24 hour trucks operation                                                    Shift Change
             drives cost savings
                                                                                            • Adds 15 meters/day
           • Increases utilization
                                                                                            • Increased drift stability
           • Increases safety
                                                                                            • Increased drilling accuracy
           • Expect ~$3mm per year in
                                                                                            • 2 automated drills in
             cost savings from 2 trucks
                                                                                              operation
                                                                                            • 1 stope drill

                                        Recovery Improvements at Greens Creek
                                                                                            Ventilation on Demand and
                                  80%                                                       Teleremote LHD
                                                                            78%
                                                                77%
                                                                                            • Ventilation system drives
             Silver Recovery %

                                  75%
                                                                                     77%      expected ~$1mm/year in cost
                                                                                              savings at Greens Creek
                                                     72%

                                                                                            • One operator can run up to 3
                                  70%      71%                                                machines from the same
                                                                                              station

                                  65%
                                           2013A      2014A         2015A   2016A   2017A
                                 Improvements driven by:
                                 • CO2 used to control PH in mill
                                 • Lead scalping process
                 Source: Company disclosures.

NYSE: HL                                                                                                                     RESPONSIBLE. SAFE. INNOVATIVE. l 36
SIGNIFICANT RETURNS ON INNOVATION INVESTMENTS
 Small investments can result in large returns: 2 case studies

     Greens Creek (ventilation on demand)                         Casa Berardi (automated haulage)

     •     Installing variable speed drives in ventilation fans   •   2 self-driving underground haulage vehicles
     •     Budget $307,000                                            instead of 5 manned vehicles
     •     Annual energy savings $196,000                         •   Capital investment was $3.5 M vs $5.5 M for
     •     IRR (7 yrs) 62%                                            traditional manned vehicles (includes rebate)
     •     NPV (7%) of 702,000                                    •   Operating costs per ton are reduced by more than
                                                                      50% ($2.58/tonne vs $5.15/tonne traditional)
                                                                  •   Expected to decline to $1.50/tonne over time

NYSE: HL                                                                                          RESPONSIBLE. SAFE. INNOVATIVE. l 37
SOLID RETURNS FROM DISCRETIONARY EXPENSES
Returns quantitative/foundations for safety and efficiency

  Discretionary Item                                                        Returns
     Recovery Improvements driven by PH control using CO2 & Lead scalping   Increased Silver recoveries 6% to 7% per year, has returned $50M cash to date and
     process - GC                                                           another estimated $200M is expected over the remaining reserve and resource life.

    Autonomous UG Haulage – CB (GC H1/18)                                   30% lower maintenance costs, totaling savings of $3m per year

     Ventilation on Demand – GC (CB H2/18, LF H2/19)                        Cost savings $23k per fan, expected 1-year payback

    Automated Stope Drilling – CB                                           Adds one hole/shift on average

    Automated Drill Jumbo – CB (GC H2/18)                                   Roughly 3% reduction in overbreak that can translate into similar development
                                                                            advance gain
     Tele-remote UG Mucking – GC (CB H1/10)                                 Proven as concept but limited so far in utilization for various reasons; new
                                                                            higher utilization target set

     UG Wi-Fi Communication Network – GC (CB, LF &SS H2/18)                 Significant and foundational, enabling step for future communications-based
                                                                            improvement including VOD and other automation

     Tablets in Daily UG – GC (CB H2/18, LF & SS H1/19)                     Provides convenient access to network data, eliminates written record input

     RFID Tracking - GC                                                     Improves safety; required for VOD and all levels of autonomous machine
                                                                            operation

NYSE: HL                                                                                                                 RESPONSIBLE. SAFE. INNOVATIVE. l 38
CULTURE OF INNOVATION DRIVES PRODUCTIVITY IMPROVEMENTS
Problem solving drives the innovation

                  Projects                          2014            2015                  2016                 2017                  2018                  2019                   2020      2021

Automated Stope Drilling
Casa Berardi                                                   Installed          In Operation

Automated Drill Jumbo                                                             Utilized 2 Drills     Add/Deploy 3rd drill              In Operation
Casa Berardi (Greens Creek H2/18)
Tele-Remote UG Mucking                                                            Acquired
                                                                                                        Mucker Commissioned               In Operation
Greens Creek (Casa Berardi H1/19)                                                 Mucker

Autonomous UG Haulage
                                                                                  Drift / Chutes Constructed        Truck(s) Commissioned                     In Operation
Casa Berardi, Greens Creek H1/18
Ventilation on Demand                                                                                                           Scope and
                                                                                                        Installed Phase 1                                In Operation
Greens Creek (Casa Berardi H2/18, Lucky Friday H2/19)                                                                           Install Ph. 2

Telemetry for UG Mobile Equipment                                                                       Install Phase 1       Install equipment
                                                                                                                                                         In Operation
Casa Berardi (Greens Creek H2/18)                                                                       Phase 2

Automated Hoisting
                                                                Installed                In Operation
Casa Berardi (Lucky Friday H1/19)
Ore Sorting
                                                                                                              Evaluating
San Sebastian (Casa Berardi H2/18)
Remote Vein Miner                                                                                           Evaluated /           Fabricate       Test/Ship/            In-mine
                                                                                  Specs Prepared                                                                                         In Operation
Lucky Friday                                                                                                Designed                              Re-assemble           Test

UG Wi-Fi Communication Network                   Installed                  In Operation
GC (CB, LF & SS H2/18)
Tablets in Daily UG
                                                 Installed                  In Operation
GC (CB H2/18, LF & SS H1/19)
RFID Tracking
                                                 Installed                  In Operation
Greens Creek

                                                             Executed       In Process        Operational        Evaluating
NYSE: HL                                                                                                                                                      RESPONSIBLE. SAFE. INNOVATIVE. l 39
ADUSTED EBITDA RECONCILLIATION TO GAAP

                                         Reconciliation of Net (Loss) Income (GAAP) to Adjusted EBITDA (non-GAAP)

Dollars in thousands (USD)                                                                                             Twelve Months Ended
                                                                                  31-Dec-13  31-Dec-14       31-Dec-15  31-Dec-16  31-Dec-17  31-Dec-18
Net (loss) income                                                                 $ (25,130) $   17,824      $ (94,738) $   61,569 $ (28,520) $ (26,563)

Plus: Interest expense, net of amount capitalized                                    21,689        26,775       25,389       21,796       38,012       40,944
Plus/(Less): Income taxes                                                            (9,795)       (5,240)      56,999       28,090       20,963       (6,701)
Plus: Depreciation, depletion and amortization                                       81,127       111,134      119,386      123,631      120,599      134,044
Plus: Exploration expense                                                            23,502        17,698       17,745       14,720       23,510       35,695
Plus: Pre-development expense                                                        14,148         1,969        4,213        3,137        5,448        4,887
Plus: Acquisition costs                                                              26,947             0        2,162            -           25       10,045
Plus: Suspension costs                                                               (1,401)            0             -           -       21,301       20,693
Less: Gain on dispostion of properties, plants, equipment and mineral interests                                    404         (147)      (6,042)      (2,793)
Plus: Stock-based compensation                                                         4,574        9,494        5,425        5,932        6,331        6,242
Plus: Provision for closed operations                                                  1,788       10,215       12,036        4,813        4,508        6,090
Plus/(Less): Foreign exchange (gain) loss                                             (2,959)     (11,535)     (24,178)       2,737        9,680      (10,310)
Plus/(Less): Loss (gain) on derivative contracts                                     (17,979)      (9,134)      10,520       (4,423)      18,063       (7,936)
Plus/(Less): Provisional price (loss) gain                                            16,955        2,277         (634)         918         (742)       3,803
Plus: Unrealized loss on investments                                                   2,639        3,224        3,333          177          247        2,816
Plus/(Less): Other                                                                      (859)        (286)        (468)        (507)      (1,526)         941

Adjusted EBITDA                                                                   $ 135,246     $ 174,415    $ 137,594    $ 265,138    $ 231,857    $ 211,897

NYSE: HL                                                                                                                  RESPONSIBLE. SAFE. INNOVATIVE. l 40
CASH COST AND AISC RECONCILIATION TO GAAP
2019 estimates
                                              Reconciliation of Cost of Sales and Other Direct Production Costs and Depreciation, Depletion and Amortization (GAAP) to
                                               Cash Cost, Before By-product Credits and Cash Cost, After By-product Credits (non-GAAP) and All-In Sustaining Costs,
                                                 Before By-product Credits, per Ounce and All-In Sustaining Costs, After By-product Credits, per Ounce (non-GAAP)
                           In thousands (except per ounce
                           amounts)                                                                                         Current Estimate for Twelve Months Ended December 31, 2019

                                                                                               Greens                 Lucky                San                                             Total                 Casa                                    Total
                                                                                               Creek                 Friday(2)           Sebastian             Corporate(3)                Silver               Berardi            Nevada                Gold
                           Cost of sales and other direct
                           production costs and depreciation,
                           depletion and amortization                                      $     201,000                                $      46,000                                 $    247,000          $ 210,000          $ 147,000           $ 357,000
                           Depreciation, depletion and
                           amortization                                                          (47,000)                                    (10,000)                                      (57,000 )            (77,000)           (68,000)            (145,000)
                           Treatment costs                                                         48,000                                       1,000                                        49,000                   —                   —                   —
                           Change in product inventory                                             (1,000)                                         —                                         (1,000 )              3,000                  —                3,000
                           Reclamation and other costs                                              4,000                                      (1,000)                                        3,000                4,500               5,000               9,500
                           Cash Cost, Before By-product
                           Credits (1)                                                           205,000                                       36,000                                      241,000              140,500             84,000             224,500
                           Reclamation and other costs                                              5,000                                          500                                        5,500               2,000              1,000                3,000
                           Exploration                                                              1,000                                        4,000                  2,500                 7,500               4,000              1,500                5,500
                           Sustaining capital                                                      45,000                                        4,500                  2,500                52,000              40,000             18,000               58,000
                           General and administrative                                                                                                                  35,000                35,000
                           AISC, Before By-product Credits                         (1)          256,000                                       45,000                                       341,000              186,500            104,500             291,000
                           By-product credits                                                  (186,000)                                     (19,000)                                     (205,000 )               (500)            (3,000)             (3,500)

                           Cash Cost, After By-product Credits                             $       19,000                               $      17,000                                 $      36,000         $ 140,000          $    81,000         $ 221,000
                           AISC, After By-product Credits                                  $       70,000                               $      26,000                                 $    136,000          $ 186,000          $ 101,500           $ 287,500

                           Divided by ounces produced                                                9,000                                       2,000                                       11,000                   146                   62                 208
                                 Cash Cost, Before By-product
                                 Credits, per Ounce                                        $         22.78                              $        18.00                                $        21.91        $         962      $       1,355       $       1,079
                                 By-product credits per ounce                                       (20.67)                                      (9.50)                                       (18.64 )                   (3)               (48)                (17)
                                 Cash Cost, After By-product
                                 Credits, per Ounce                                        $           2.11                             $          8.50                               $          3.27       $         959      $       1,307       $       1,062
                                 AISC, Before By-product Credits,
                                 per Ounce                                                 $         28.44                              $        22.50                                $        31.00        $      1,277       $       1,685       $       1,399
                                 By-product credits per ounce                                       (20.67)                                      (9.50)                                       (18.64 )                   (3)               (48)                (17)
                                 AISC, After By-product Credits,
                                 per Ounce                                                 $           7.77                             $        13.00                                $        12.36        $      1,274       $       1,637       $       1,382

1.    Includes all direct and indirect operating cash costs related directly to the physical activities of producing metals, including mining, processing and other plant costs, third-party refining and marketing expense, on-site general and administrative costs, royalties and
      mining production taxes, before by-product revenues earned from all metals other than the primary metal produced at each unit. AISC, Before By-product Credits also includes on-site exploration, reclamation, and sustaining capital costs.
2.    The unionized employees at Lucky Friday have been on strike since March 13, 2017, and production at Lucky Friday has been limited since that time. As a result, for the first quarter of 2018 Cash Cost, Before By-product Credits, Cash Cost, After By-product
      Credits, AISC, Before By-product Credits, and AISC, After By-product Credits are not presented for Lucky Friday, and costs related to the limited production at Lucky Friday are excluded from the calculation of Cash Cost, Before By-product Credits, Cash Cost,
      After By-product Credits, AISC, Before By-product Credits, and AISC, After By-product Credits for our combined silver operations.
3. AISC, Before By-product Credits for our consolidated silver properties includes corporate costs for general and administrative expense, exploration and sustaining capital.

NYSE: HL                                                                                                                                                                                                                               RESPONSIBLE. SAFE. INNOVATIVE. l 41
CASH COST AND AISC RECONCILIATION TO GAAP
SILVER OPERATIONS

                                Reconciliation of Cost of Sales and Other Direct Production Costs and Depreciation, Depletion and Amortization (GAAP) to
                              Cash Cost, Before By-product Credits and Cash Cost, After By-product Credits (non-GAAP) and All-In Sustaining Costs, Before
                                      By-product Credits, per Ounce and All-In Sustaining Costs, After By-product Credits, per Ounce (non-GAAP)

                                                      In thousands (except per ounce amounts)

                                                                                                                                                                                        Q2 2019                Q2 2018
                                                       Cost of sales and other direct production costs and
                                                       depreciation, depletion and amortization (GAAP)                                                                                $      61,744 $               60,562
                                                       Depreciation, depletion and amortization                                                                                             (13,120)               (13,102)
                                                       Treatment costs                                                                                                                       11,726                  9,652
                                                       Change in product inventory                                                                                                            3,746                    (70)
                                                       Reclamation and other costs                                                                                                           (1,355)                  (826)
                                                       Exclusion of Lucky Friday costs                                                                                                       (4,412)                  (399)
                                                                                                                   (1)
                                                       Cash Cost, Before By-product Credits                                                                                                  58,329                 55,817
                                                       Reclamation and other costs                                                                                                              861                    953
                                                       Exploration                                                                                                                            2,059                  3,546
                                                       Sustaining capital                                                                                                                     9,985                 16,380
                                                       General and administrative                                                                                                             8,918                  9,787
                                                       AISC, Before By-product Credits(1,2)                                                                                                  80,152                 86,483
                                                         Total By-product credits                                                                                                           (48,414)               (57,287)
                                                       Cash Cost, After By-product Credits, per Silver Ounce                                                                          $       9,915          $      (1,470)
                                                       AISC, After By-product Credits                                                                                                 $      31,738          $      29,196
                                                       Divided by ounces produced                                                                                                             2,836                  2,560
                                                         Cash Cost, Before By-product Credits, per Silver Ounce                                                                       $       20.57          $       21.80
                                                         By-product credits per Silver Ounce                                                                                                 (17.07)                (22.38)
                                                         Cash Cost, After By-product Credits, per Silver Ounce                                                                        $        3.50          $       (0.58)
                                                         AISC, Before By-product Credits, per Silver Ounce                                                                            $       28.26          $       33.78
                                                         By-products credit per Silver Ounce                                                                                                 (17.07)                (22.38)
                                                         AISC, After By-product Credits, per Silver Ounce                                                                             $       11.19          $       11.40

       1.   Includes all direct and indirect operating cash costs related directly to the physical activities of producing metals, including mining, processing and other plant costs, third-party refining and marketing expense, on-site general and
            administrative costs, royalties and mining production taxes, before by-product revenues earned from all metals other than the primary metal produced at each unit.
       2.   All-in sustaining costs, before by-product credits for our consolidated silver properties includes corporate costs for all general and administrative expenses and exploration and sustaining capital which support the operating properties.

NYSE: HL                                                                                                                                                                                                                        RESPONSIBLE. SAFE. INNOVATIVE. l 42
CASH COST AND AISC RECONCILIATION TO GAAP
GOLD OPERATIONS
                                       Reconciliation of Cost of Sales and Other Direct Production Costs and Depreciation, Depletion and Amortization (GAAP) to Cash Cost,
                                          Before By-product Credits and Cash Cost, After By-product Credits (non-GAAP) and All-In Sustaining Costs, Before By-product
                                                          Credits, per Ounce and All-In Sustaining Costs, After By-product Credits, per Ounce (non-GAAP)

                                                         In thousands (except per ounce amounts)

                                                                                                                                                                                    Q2 2019                   Q2 2018
                                                          Cost of sales and other direct production costs and
                                                          depreciation, depletion and amortization (GAAP)                                                                       $          92,671 $                     51,695
                                                          Depreciation, depletion and amortization                                                                                        (36,357)                     (18,715)
                                                          Treatment costs                                                                                                                     463                          559
                                                          Change in product inventory                                                                                                      (4,336)                         (78)
                                                          Reclamation and other costs                                                                                                      (1,013)                        (139)
                                                                                                                 (1
                                                          Cash Cost, Before By-product Credits )                                                                                            51,428                     33,322
                                                          Reclamation and other costs                                                                                                          505                        140
                                                          Exploration                                                                                                                        1,639                      1,330
                                                          Sustaining capital                                                                                                                21,984                      9,809
                                                          AISC, Before By-product Credits
                                                                                          (1,2)                                                                                             75,556                     44,601
                                                            Total By-product credits                                                                                                          (830)                      (201)
                                                          Cash Cost, After By-product Credits, per Gold Ounce                                                                   $           50,598        $            33,121
                                                          AISC, After By-product Credits                                                                                        $           74,726        $            44,400
                                                          Divided by ounces produced                                                                                                            44                         43
                                                            Cash Cost, Before By-product Credits, per Gold Ounce                                                                $            1,170        $               780
                                                            By-product credits per Gold Ounce                                                                                                  (19)                        (5)
                                                            Cash Cost, After By-product Credits, per Gold Ounce                                                                 $            1,151        $               775
                                                            AISC, Before By-product Credits, per Gold Ounce                                                                     $            1,719        $             1,044
                                                            By-product credits per Gold Ounce                                                                                                  (19)                        (5)
                                                            AISC, After By-product Credits, per Gold Ounce                                                                      $            1,700        $             1,039

  1.   Includes all direct and indirect operating cash costs related directly to the physical activities of producing metals, including mining, processing and other plant costs, third-party refining and marketing
       expense, on-site general and administrative costs, royalties and mining production taxes, before by-product revenues earned from all metals other than the primary metal produced at each unit.
  2.   All-in sustaining costs, before by-product credits for our consolidated silver properties includes corporate costs for all general and administrative expenses and exploration and sustaining capital which
       support the operating properties.
NYSE: HL                                                                                                                                                                                                                          RESPONSIBLE. SAFE. INNOVATIVE. l 43
CASH COST AND AISC RECONCILIATION TO GAAP
Greens Creek

                    Reconciliation of Cost of Sales and Other Direct Production Costs and Depreciation, Depletion and Amortization (GAAP) to
                     Cash Cost, Before By-product Credits and Cash Cost, After By-product Credits (non-GAAP) and All-In Sustaining Costs,
                       Before By-product Credits, per Ounce and All-In Sustaining Costs, After By-product Credits, per Ounce (non-GAAP)

                    In thousands (except per ounce amounts)

                                                                                                                                                2018               Q2 2018             Q2 2019                2019E
                    Cost of sales and other direct production costs and depreciation, depletion
                                                                                                                                          $       190,066         $     47,742        $     45,650        $    202,000
                    and amortization (GAAP)
                    Depreciation, depletion and amortization                                                                                       (46,511)            (11,813)            (10,850)            (47,000)
                    Treatment costs                                                                                                                 38,174               9,481              10,964              48,000
                    Change in product inventory                                                                                                      3,087                 321               4,577              (1,000)
                    Reclamation and other costs                                                                                                     (2,911)               (449)               (933)              3,000
                    Cash Cost, Before By-product Credits(1)                                                                                       181,905               45,282              49,408             205,000
                    Reclamation and other costs                                                                                                     3,397                  850                 738               5,000
                    Exploration                                                                                                                     3,151                  778                  79               1,000
                    Sustaining capital                                                                                                             46,864               14,183               8,665              45,000
                    AISC, Before By-product Credits
                                                     (1,2)                                                                                        235,317               61,093              58,890             256,000
                      Total By-product credits                                                                                                   (190,924)             (52,230)            (43,769)           (186,000)
                    Cash Cost, After By-product Credits                                                                                   $        (9,019)        $     (6,948)       $      5,639        $     19,000
                    AISC, After By-product Credits                                                                                        $        44,393         $      8,863        $     15,121        $     70,000
                    Divided by ounces produced                                                                                                      7,953                2,000               2,372               9,000
                      Cash Cost, Before By-product Credits, per Silver Ounce                                                              $         22.88         $      22.64        $      20.83        $      22.78
                      By-products credits per Silver Ounce                                                                                         (24.01)              (26.12)             (18.45)             (20.67)
                      Cash Cost, After By-product Credits, per Silver Ounce                                                               $         (1.13)        $      (3.48)       $       2.38        $       2.11
                      AISC, Before By-product Credits, per Silver Ounce                                                                   $           29.59       $       30.55       $       24.83       $        28.44
                      By-product credits per Silver Ounce                                                                                           (24.01)             (26.12)             (18.45)              (20.67)
                      AISC, After By-product Credits, per Silver Ounce                                                                    $             5.58      $         4.43      $         6.38      $         7.77

               1.     Includes all direct and indirect operating cash costs related directly to the physical activities of producing metals, including mining, processing and other plant costs, third-party refining and marketing
                      expense, on-site general and administrative costs, royalties and mining production taxes, before by-product revenues earned from all metals other than the primary metal produced at each unit.
               2.     All-in sustaining costs, before by-product credits for our consolidated silver properties includes corporate costs for all general and administrative expenses and exploration and sustaining capital which
                      support the operating properties.
NYSE: HL                                                                                                                                                                                                        RESPONSIBLE. SAFE. INNOVATIVE. l 44
CASH COST AND AISC RECONCILIATION TO GAAP
Casa Berardi

                        Reconciliation of Cost of Sales and Other Direct Production Costs and Depreciation, Depletion and Amortization (GAAP) to
                         Cash Cost, Before By-product Credits and Cash Cost, After By-product Credits (non-GAAP) and All-In Sustaining Costs,
                           Before By-product Credits, per Ounce and All-In Sustaining Costs, After By-product Credits, per Ounce (non-GAAP)
                    In thousands (except per ounce amounts)

                                                                                                                                         2018                   Q2 2018                  Q2 2019                   2019E
                    Cost of sales and other direct production costs and
                                                                                                                                  $        199,402          $         51,695         $         55,152         $       210,000
                    depreciation, depletion and amortization (GAAP)
                    Depreciation, depletion and amortization                                                                               (71,302)                  (18,715)                 (18,561)                (77,000)
                    Treatment costs                                                                                                          2,068                       559                      427                       -
                    Change in product inventory                                                                                              1,205                       (78)                  (2,367)                  3,000
                    Reclamation and other costs                                                                                               (558)                     (139)                    (128)                  4,500
                    Cash cost, before by-product credits(1)                                                                                130,815                    33,322                   34,523                 140,500
                    Reclamation and other costs                                                                                                558                       140                      127                   2,000
                    Exploration                                                                                                              4,277                     1,330                      941                   4,000
                    Sustaining capital                                                                                                       40,711                     9,809                    9,431                  40,000
                                                                    (1,2)
                    AISC, Before By-product Credits                                                                                        176,361                    44,601                   45,022                 186,500
                      Total By-products credits                                                                                               (597)                     (201)                     (91)                   (500)
                    Cash Cost, After By-product Credits                                                                           $        130,218 $                  33,121 $                 34,432 $               140,000
                    AISC, After By-product Credits                                                                                $        175,764          $         44,400         $         44,931         $       186,000
                    Divided by ounces produced                                                                                                    163                        43                       31                     146
                      Cash Cost, Before By-product Credits, per Gold Ounce                                                        $               804 $                    780 $                 1,104 $                     962
                      By-product credits per Gold Ounce                                                                           $                (4) $                    (5) $                   (3) $                     (3)
                      Cash Cost, After By-product Credits, per Gold Ounce                                                         $               800 $                    775 $                 1,101 $                     959
                      AISC, Before By-product Credits, per Gold Ounce                                                             $            1,084 $                  1,044 $                  1,440 $                  1,277
                      By-product credits per Gold Ounce                                                                           $               (4) $                    (5) $                    (3) $                    (3)
                      AISC, After By-product Credits, per Gold Ounce                                                              $            1,080 $                  1,039 $                  1,437 $                  1,274

               1.     Includes all direct and indirect operating cash costs related directly to the physical activities of producing metals, including mining, processing and other plant costs, third-party refining and marketing
                      expense, on-site general and administrative costs, royalties and mining production taxes, before by-product revenues earned from all metals other than the primary metal produced at each unit.
               2.     All-in sustaining costs, before by-product credits for our consolidated silver properties includes corporate costs for all general and administrative expenses and exploration and sustaining capital which
                      support the operating properties.
NYSE: HL                                                                                                                                                                                                        RESPONSIBLE. SAFE. INNOVATIVE. l 45
CASH COST AND AISC RECONCILIATION TO GAAP
Nevada Operations

             Reconciliation of Cost of Sales and Other Direct Production Costs and Depreciation, Depletion and Amortization (GAAP) to
              Cash Cost, Before By-product Credits and Cash Cost, After By-product Credits (non-GAAP) and All-In Sustaining Costs,
                Before By-product Credits, per Ounce and All-In Sustaining Costs, After By-product Credits, per Ounce (non-GAAP)

            In thousands (except per ounce amounts)

                                                                                                                                                 2018*                       Q2 2019                        2019E
            Cost of sales and other direct production costs and
                                                                                                                                          $              47,005        $               37,519        $            147,000
            depreciation, depletion and amortization (GAAP)
            Depreciation, depletion and amortization                                                                                                    (10,617)                     (17,796)                      (68,000)
            Treatment costs                                                                                                                                  90                           36                             -
            Change in product inventory                                                                                                                   7,138                       (1,969)                            -
            Reclamation and other costs                                                                                                                    (954)                        (885)                        5,000
                                                                     (1)
            Cash cost, before by-product credits                                                                                                         42,662                       16,905                        84,000
            Reclamation and other costs                                                                                                                     567                          378                         1,000
            Exploration                                                                                                                                   6,345                          698                         1,500
            Sustaining capital                                                                                                                           17,079                       12,553                        18,000
                                                             (1,2)
            AISC, Before By-product Credits                                                                                                              66,653                        30,534                     104,500
              Total By-products credits                                                                                                                  (2,512)                         (739)                     (3,000)
            Cash Cost, After By-product Credits                                                                                           $              40,150 $                      16,165 $                    81,000
            AISC, After By-product Credits                                                                                                $              64,141        $               29,795        $            101,500
            Divided by ounces produced                                                                                                                          33                           13                            62
                 Cash Cost, Before By-product Credits, per Gold Ounce                                                                     $                1,297 $                      1,332 $                       1,355
                 By-product credits per Gold Ounce                                                                                                           (76)                         (58)                          (48)
                 Cash Cost, After By-product Credits, per Gold Ounce                                                                      $                1,221 $                      1,474 $                       1,307
                 AISC, Before By-product Credits, per Gold Ounce                                                                          $                2,026 $                      2,405 $                       1,685
                 By-product credits per Gold Ounce                                                                                        $                  (76) $                       (58) $                        (48)
                 AISC, After By-product Credits, per Gold Ounce                                                                           $                1,950 $                      2,347 $                       1,637

            *Nevada properties acquired from Klondex Mines on July 20, 2018.
            1.    Includes all direct and indirect operating cash costs related directly to the physical activities of producing metals, including mining, processing and other plant costs, third-party refining and marketing
                  expense, on-site general and administrative costs, royalties and mining production taxes, before by-product revenues earned from all metals other than the primary metal produced at each unit.
            2.    All-in sustaining costs, before by-product credits for our consolidated silver properties includes corporate costs for all general and administrative expenses and exploration and sustaining capital which
                  support the operating properties.
NYSE: HL                                                                                                                                                                                                   RESPONSIBLE. SAFE. INNOVATIVE. l 46
CASH COST AND AISC RECONCILIATION TO GAAP
San Sebastian
                   Reconciliation of Cost of Sales and Other Direct Production Costs and Depreciation, Depletion and Amortization (GAAP)
                  to Cash Cost, Before By-product Credits and Cash Cost, After By-product Credits (non-GAAP) and All-In Sustaining Costs,
                      Before By-product Credits, per Ounce and All-In Sustaining Costs, After By-product Credits, per Ounce (non-GAAP)

                 In thousands (except per ounce amounts)
                                                                                                                                                      2018              Q2 2018             Q2 2019              2019E
                 Cost of sales and other direct production costs and depreciation, depletion and amortization
                 (GAAP)                                                                                                                          $       41,815 $             11,076 $            11,143 $ 46,000
                 Depreciation, depletion and amortization                                                                                                (4,602)              (1,107)             (1,848)  (9,000)
                 Treatment costs                                                                                                                            807                  116                 138    1,000
                 Change in product inventory                                                                                                              2,385                  769 $              (190)       -
                 Reclamation and other costs                                                                                                             (1,559)                (319)               (422)  (1,000)
                 Cash Cost, Before By-product Credits(1)                                                                                                 38,846               10,535               8,921   37,000
                 Reclamation and other costs                                                                                                                419                  103                 123      500
                 Exploration                                                                                                                              7,792                2,334               1,483    4,000
                 Sustaining capital                                                                                                                       1,947                1,680               1,308    3,500
                                                  (1,2)
                 AISC, Before By-product Credits                                                                                                         49,004               14,652              11,835   45,000
                   Total By-product credits                                                                                                             (19,100)              (5,057)             (4,645) (19,000)
                 Cash Cost, After By-product Credits, per Silver Ounce                                                                                   19,746                5,478               4,276   18,000
                 AISC, After By-product Credits                                                                                                          29,904                9,595               7,190   26,000
                 Divided by Ounces Produced                                                                                                               2,037                  560                 464    2,000
                   Cash Cost, Before By-product Credits, per Silver Ounce                                                                        $        19.07 $              18.81 $             19.23 $ 18.50
                   By-products credits per Silver Ounce                                                                                                   (9.38)               (9.03)             (10.01)   (9.50)
                   Cash Cost, After By-product Credits, per Silver Ounce                                                                                   9.69                 9.78                9.22     9.00
                   AISC, Before By-product Credits, per Silver Ounce                                                                             $         24.06 $             26.16 $              25.51 $          22.50
                   By-products credits per Silver Ounce                                                                                                    (9.38)              (9.03)              (10.01)           (9.50)
                   AISC, After By-product Credits, per Silver Ounce                                                                              $         14.68 $             17.13 $              15.50 $          13.00

            1.     Includes all direct and indirect operating cash costs related directly to the physical activities of producing metals, including mining, processing and other plant costs, third-party refining and marketing
                   expense, on-site general and administrative costs, royalties and mining production taxes, before by-product revenues earned from all metals other than the primary metal produced at each unit.
            2.     All-in sustaining costs, before by-product credits for our consolidated silver properties includes corporate costs for all general and administrative expenses and exploration and sustaining capital which
                   support the operating properties.
NYSE: HL                                                                                                                                                                                                     RESPONSIBLE. SAFE. INNOVATIVE. l 47
You can also read