Decision-Making Process in the Case of Insufficient Rail Capacity
←
→
Page content transcription
If your browser does not render page correctly, please read the page content below
sustainability

Article
Decision-Making Process in the Case of Insufficient
Rail Capacity
Anna Dolinayova * , Vladislav Zitricky                  and Lenka Cerna
 Faculty of Operation and Economics of Transport and Communications, University of Zilina,
 010 26 Žilina, Slovakia; vladislav.zitricky@fpedas.uniza.sk (V.Z.); lenka.cerna@fpedas.uniza.sk (L.C.)
 * Correspondence: anna.dolinayova@fpedas.uniza.sk; Tel.: +421-41-513-3424

 Received: 27 May 2020; Accepted: 16 June 2020; Published: 19 June 2020

 Abstract: One of the main priorities of transport policy in the EU is to take measures to support railway
 transport as an environmentally friendly transport mode. An interesting challenge for a railway
 transport operation is represented with cost items for its operation. This problem is exacerbated
 if transport flows are routed through a congested railway infrastructure. If some or all transport
 takes place on congested rail infrastructure, the carrier’s costs increase, which may ultimately lead to
 withdrawal from the market. The article deals with the impact of insufficient capacity on the rail
 carrier’s costs. We used a pre-cost calculation methodology to calculate the rail carrier’s additional
 costs due to the insufficient railway network capacity based on detailed calculation of train costs
 and proposed a methodology for carrier decision-making in case of insufficient rail infrastructure
 capacity. The case study showed that the use of a diversion track in case of insufficient planned rail
 line capacity may not be advantageous for carriers, even with a longer waiting time for capacity to
 be released. One of the ways to eliminate the negative effects of congested railway infrastructure is
 investment in the increase of its capacity.

 Keywords: rail infrastructure; insufficient capacity; shipping costs; decision-making process

1. Introduction
      Accessible, efficient, safe, and green transport is imperative to economic growth, social
development, and the environment [1]. Generally, the development process of the railway transport
system is determined by the market pull effects initiated by the economy and society and the market
push effects induced by technological progress [2]. Railways are expected to have a greater role in the
future to meet the growing demand for transport infrastructure services [3].
      An efficient and sustainable railway system depends on providing quality transport services.
If there is a problem with the rail service quality, rail transport performance can be reduced [4].
The quality and efficiency of a rail carrier’s services are affected by internal and external factor.
While the carriers completely affect internal factors, they cannot influence external factors, and
these can also have a significant impact on quality of services and profit. One of these factors is
the rail infrastructure’s capacity. Insufficient capacity normally occurs due to an accident caused
by a vehicle [5,6], infrastructures (such as an overhead conductor system [7]), accidents between
highway users and trains [8], or bad weather. Insufficient or congested capacity increases costs
and simultaneously reduces the quality of services provided, especially in terms of delivery time to
the customer.
      In the Directive 2012/34/EU insufficient capacity is defined as follows: “Where, after coordination
of the requested train paths and consultation with applicants, it is not possible to satisfy requests
for infrastructure capacity adequately, the infrastructure manager will immediately declare that the

Sustainability 2020, 12, 5023; doi:10.3390/su12125023                         www.mdpi.com/journal/sustainability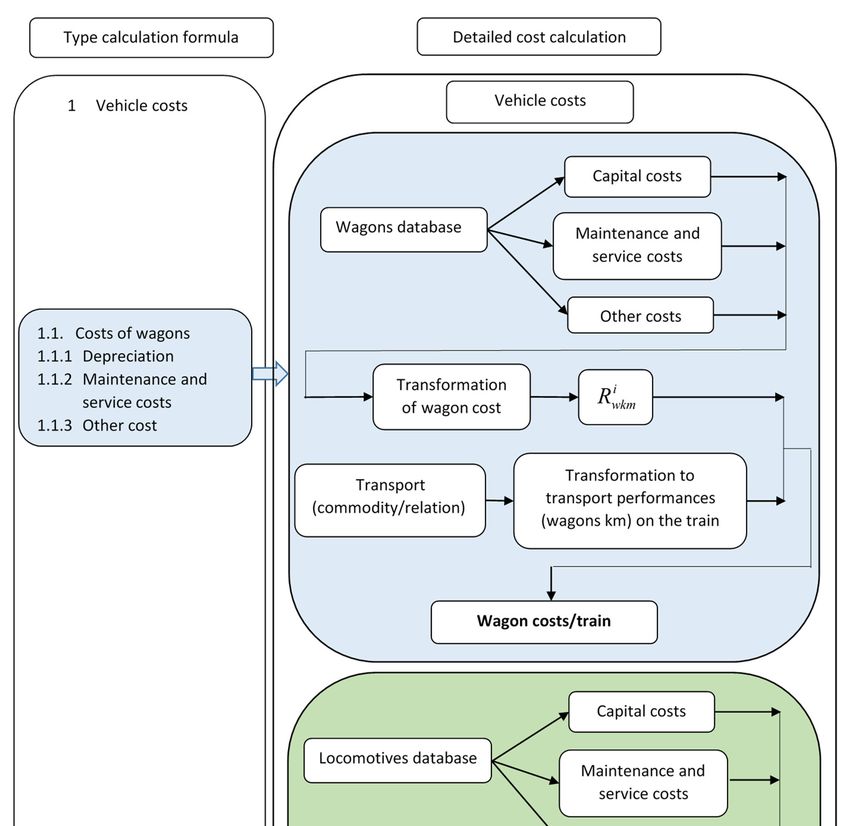
Sustainability 2020, 12, 5023                                                                          2 of 21

infrastructure section on which this has occurred is congested. This will also be done for infrastructure
which can be expected to suffer from insufficient capacity in the near future” [9].
     Independent Regulator’s Group (IRG)-Rail’s survey of congested infrastructure state that
“declaration of congestion appears to have different meanings in different countries. The occurrence
and implications of declaring congestion will be very different depending on a number of factors:

•     It has been interpreted how the provision that capacity requests should be adequately met.
•     To what extent the reasonable limits to modifying requests are defined and limit infrastructure
      manager’s freedom to allocate capacity.
•     How sections of congested infrastructure are delimited in time and space.
•     Whether congestion is declared in cases where temporary capacity restrictions are the cause of the
      capacity conflict owing to infrastructure works” [10].

       There are many articles regarding congestion on urban rail transit where authors deal with different
models to describe congestion, e.g., the Epidemiological Dynamics Model [11], Susceptible, Infected,
Recovered (SIR) Epidemic Model [12], and Hazard-Based Model [13]. There are only a few papers
which deal with congestion on suburban, regional, or other rail infrastructure. Some authors researched
rail congested infrastructure from the congested charges point of view [14,15]. Stojadinovic et al.
proposed the algorithm for decentralized capacity allocation as the result of a multidimensional
approach, which encompasses setting new relations between train operators and the infrastructure
manager and train timetable drafting and resolving conflicting requests [16]. Mlinaric and Pirnar
researched the reduction of the influence of slow runs and line closures to ensure a sufficient number
of rail routes for customers [17]. Therefore, in this paper, we will take into account insufficient rail
capacity, whereby we not only mean congested rail capacity but any insufficient capacity (e.g., due to
bad weather, accidents, etc.).
       Railway capacity is extremely dependent on infrastructure, traffic, and operating parameters [18].
The problem of rail infrastructure capacity was researched from several points of view. The authors
most often deal with optimizing railway infrastructure capacity [19–21] or investments in railway
infrastructure [22,23]. Authors defined rail line capacity as the maximum number of trains which
can run on the track within a given time period [24–26]. However, a specific unit (trains/hour or
trains/day) does not reflect the heterogeneity of train types [27], and real rail line capacity utilization
can be lower. Lizbetin et al. researched the operation characteristic of rail freight corridors and
their capacity consumption by the common rail operation—passenger and freight [28]. Masek et al.
dealt with the transport capacity of the train and railway track based on types of wagons used [29].
By using mathematical models in creating a timetable and planning other processes in rail transport,
the optimization of the railway capacity under heterogeneous traffic conditions can be achieved [30,31].
Train timetabling is the basis for track allocation, train routing (at stations), rolling stock scheduling,
and crew scheduling problems hence the extremely high importance and significance of optimizing
the train timetables [32].
       Rail capacity utilization affects rail infrastructure maintenance costs and therefore also
infrastructure access charges and rail carrier costs. Many authors deal with this problem from
different points of view. Odolinsky and Boysen estimated cost elasticities with respect to traffic that
may capture potential differences in maintenance costs with respect to line capacity utilization [33].
The electrification of equipment can increase the rail capacity and simultaneously decrease energy
consumption and energy costs [34]. Sternad et al. calculate marginal maintenance costs for regional
rail lines using an econometric cost function model [35]. Abramovic deals with systems for calculating
infrastructure charges [36]. Authors mainly researched the change of marginal maintenance costs for
rail infrastructure due to traffic, e.g., [37–40].
       We identified the research gap to estimate the cost of rail carriers with regard to rail infrastructure
capacity utilization. There are a few studies on the costs of road congestion, e.g., [41–44] and road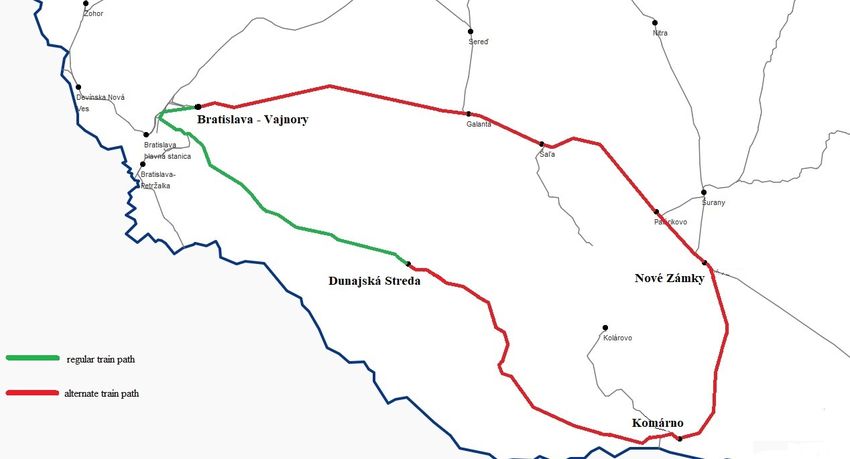
Sustainability 2020, 12, 5023 3 of 21
network costs [45–47]. Some authors deal with rail carrier costs more or less in detail, e.g., [48–51], but
nobody occupied themselves with the impact of insufficient rail capacity on carrier costs.
The aim of this paper is to estimate rail carrier costs related to insufficient rail infrastructure
capacity. We only took those costs into account that change with respect to insufficient capacity,
e.g., costs which depend directly or indirectly on transport time. Rail carriers very often make a
decision on whether to use the diversion track or wait for the capacity to be released. We proposed
a methodology to make this decision with respect to costs that change as a result of this decision.
Our proposed methodology was applied in Slovak Republic conditions for passenger and freight rail
transport. We chose two different planned rail lines, the first (for passenger transport) is the corridor
track in the first category, and the second (for freight transport) is the regional track. Both tracks
have a capacity utilization higher than 75% in some section, which can be considered insufficient
infrastructure capacity.
2. Materials and Methods
The study uses quantitative research based on the statistics of insufficient rail infrastructure
capacity in the selected countries and a pre-cost calculation methodology to calculate additional rail
carrier costs that are due to insufficient railway network capacity. The aim of analysis in this section is
to show that the issue of insufficient rail capacity exists in multiple countries, to a lesser or greater
extent, and that it is meaningful to address it.
In accordance with Directive 2012/34/EU, European countries usually described information
regarding congested rail capacity (such as definition, capacity analysis, priority criteria, process of
allocation in this capacity, etc.) in chapter 4 of the Network Statement. Rail infrastructure managers
can introduce higher access charges for congested infrastructure such as supplementary fees, fixed
charges, or other fees. In practice, some countries use higher access charges for congested infrastructure
(e.g., Austria—ÖBB-Infrastruktur AG, Czech Republic—Správa železnic), and some do not (e.g.,
Slovak Republic—Železnice Slovenskej republiky, Hungary—MAV Magyar Államvasutak Zártkörűen
Működő Részvénytársaság).
The methodology for the calculation of additional costs of railway carriers with respect to
insufficient capacity is based on these fundamental premises:
• Carriers utilize locomotives and wagons effectively.
• The roster of train drivers and train crews are managed effectively, along with minimization of
idle times [52].
• There exists an option for a short lease of locomotives and wagons.
• In case of insufficient railway infrastructure capacity, the decision-making process is based on
minimization of transportation costs.
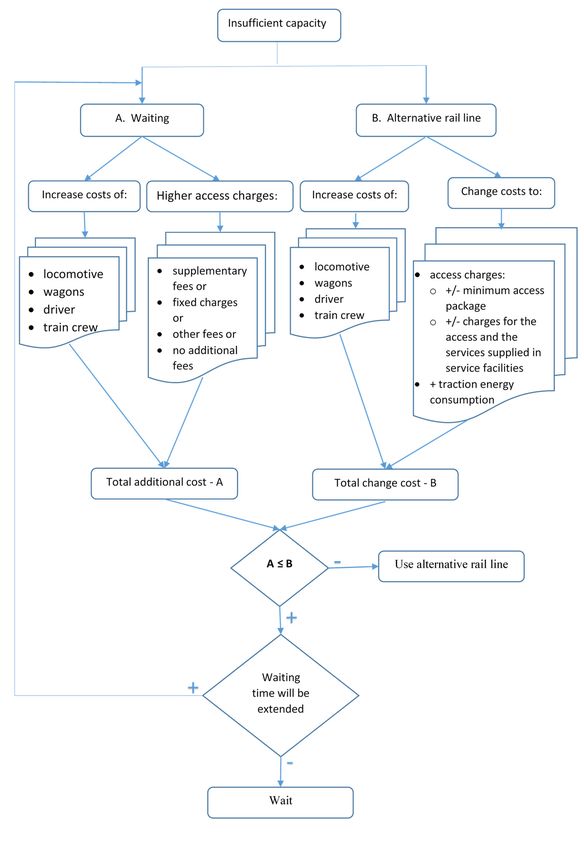
The carriers have two possibilities with respect to insufficient capacity: wait for sufficient capacity
(A) or use an alternative railway line if operating conditions allow it (B). Both options mean higher
shipping cost and reduced profit. Figure 1 describes the simple scheme regarding the decision-making
process based on the carrier’s additional costs associated with insufficient capacity.
As seen in Figure 1, the decision-making process in the case of insufficient rail capacity depends
on waiting time (we assume that the planned route (rail line) is cost-optimal). It changed the variable
and fixed costs.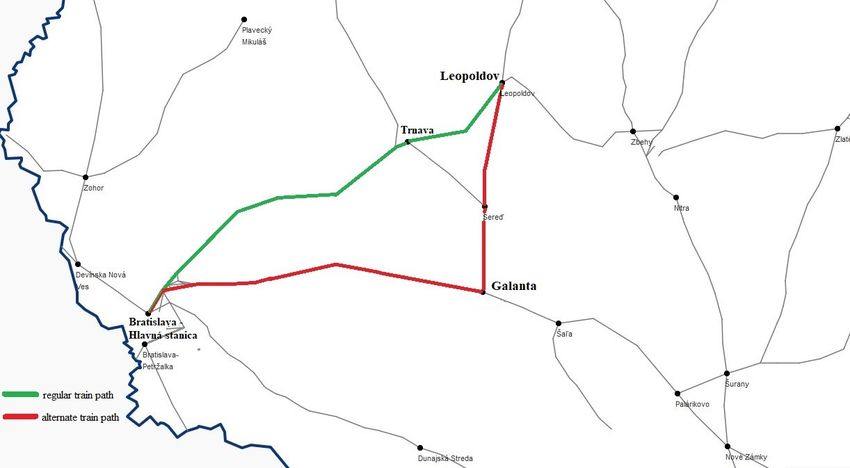
Sustainability 2020, 12, 5023                                                                       4 of 21
Sustainability 2020, 12, x FOR PEER REVIEW                                                         4 of 21

                    Figure 1. Decision-making process in the case of insufficient rail capacity.

                    Figure 1. Decision-making process in the case of insufficient rail capacity.

     As seen in Figure 1, the decision-making process in the case of insufficient rail capacity depends
on waiting time (we assume that the planned route (rail line) is cost-optimal). It changed the variable
and fixed costs.
     These additional costs are incurred in the case of waiting for sufficient capacity (A) and are as
follows:
•    Variable costs: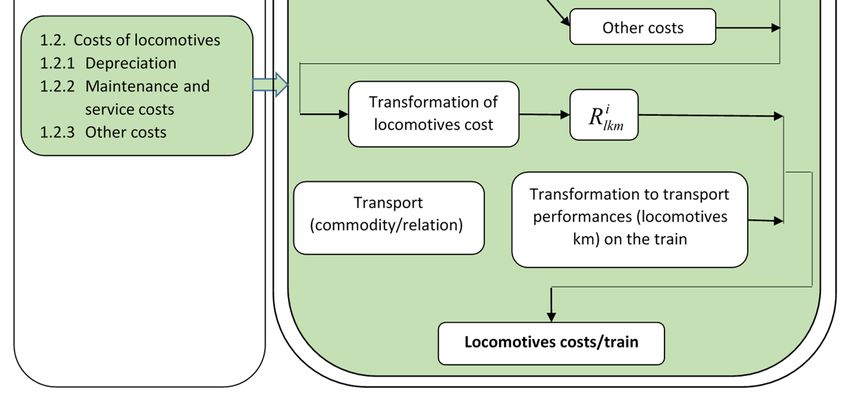
Sustainability 2020, 12, 5023                                                                             5 of 21

     These additional costs are incurred in the case of waiting for sufficient capacity (A) and are
as follows:

•     Variable costs:

      #        driver and train crew labor costs (in the case of recurring insufficient capacity this can
               result in more drivers and train crews),
      #        rail access charges in some countries (in the case of rail infrastructure managers declaring
               congested rail capacity on the rail line).
•     Fixed costs:

      #        regular repair and maintenance costs of locomotives and wagons, which is dependent
               on time,
      #        capital costs of locomotives and wagons (if the run of the locomotives and wagons is
               extended, there is less efficient use and the need for more locomotives and wagons),
      #        other fixed costs that cannot be allocated directly to the train.

      If carriers use the alternative rail line these costs can change (B) as follows:

•     Variable costs:

      #        driver and train crew labor costs (since the alternative rail line is usually longer or transport
               takes longer, these costs are higher),
      #        additional regular repair and maintenance costs of locomotive and wagons, which depend
               on transport performances,
      #        rail access charges of which there may be two cases: the rail infrastructure manager
               determines the alternative rail line (if the carrier uses a lower category rail line, the
               costs are lower or unchanged) or the carrier requires an alternative line due to their own
               technological needs (in which case, the costs can be higher or lower),
      #        traction energy consumption costs, which are usually higher since the technical parameters
               of alternative rail lines can be worse, e.g., climb of the track, frequent change of line speed,
               more frequent train stops, etc.
•     Fixed costs:

      #        regular repair and maintenance costs of locomotives and wagons, which depends on time
               (taking into account that an alternative line often means a longer time of transport),
      #        capital costs of locomotives and wagons (the same as in case A),
      #        other fixed costs that cannot be allocated directly to the train.

      The use of an alternative rail line depends on many technical and technological factors such as
electrification, maximum length of train, weight normative, axle load, etc.
      It is necessary to know transport costs for every technological process in detail to make a good
decision in the case of insufficient rail capacity. Cost calculation by type calculation method is not
enough, carriers must know the costs for every part of the transport technological process. Figure 2
describes the locomotive and wagon costs calculation method and gives a detailed cost calculation for
a train.
Sustainability 2020, 12, 5023 6 of 21
Sustainability 2020, 12, x FOR PEER REVIEW 6 of 21
Figure 2. Possibilities of calculating rail vehicle costs.
Figure 2. Possibilities of calculating rail vehicle costs.
A calculation method for cost calculation in rail freight transport as well as calculating variable
A calculation
costs depends method for cost
on multiplication calculation
performed in rail freight
transport outputtransport as well
(transport as calculating
performances), andvariable
rate of
costs depends on multiplication performed transport output (transport performances),
transport unit is described in our previous study [53]. In general, we can summarize rail vehicle and rate of
costs
transport unitfollowing
by using the is described in our previous study [53]. In general, we can summarize rail vehicle costs
equation:
by using the following equation:
n X m
n m
X
Tri ∗ D j ∗ (1 + γ) ∗ RRVkm
( )
CRV = (1)
CRV i==1 j=1 Tr i * D j * 1 + γ * RRVkm (1)
i =1 j =1
where:
where:
CRV : Crail
RV: vehicle costs.
rail vehicle costs.
Tri: train
Tri : train i. i.
Dj: distance
Dj : distance j. j.
γ: coefficient taking rail vehicles’ additional performance into account (e.g., drive to/from engine
house, engine shouting, wagons loading, etc.).Sustainability 2020, 12, 5023 7 of 21
γ: coefficient taking rail vehicles’ additional performance into account (e.g., drive to/from engine
house, engine shouting, wagons loading, etc.).
RRVkm : rail vehicle kilometer rate.
I: number of trains per time (usually one year).
j: number of relations per time (usually one year).
The rail vehicle kilometer rate is the ratio between rail vehicle costs and transport performances.
Rail vehicle costs must take all rail vehicle costs into account (maintenance and services costs,
depreciation costs, rail vehicle certification cost, etc.).
Costs using the rail infrastructure (rail infrastructure charges) cannot be generalized. Despite the
fact that every rail infrastructure manager uses the same basic fee principle for the minimum access
package (based on train km and gross ton km), many differences in the fee calculating method exist, as
well as in additional and ancillary services and others. Furthermore, some rail infrastructure managers
change the fees annually, and the system of charges or some part of charges also change. The principles
regarding allocation and charging for rail infrastructure are available in the document “Network
Statement”, which every rail infrastructure manager must publish on their website. The rail carriers
have to update every change in their calculation system. Below, we show the rail access charges for the
minimum access package in the Slovak republic and Austria as an example.
In Austria, the calculation method for track access charges within the minimum access package
per market segment is [54]:
TACH = trkm ∗ tr + gtkm ∗ gtk ± reduction/supplements (2)
where:
TACH: track access charges.
trkm: train kilometers.
tr: train-kilometer component per market segment.
gtkm: gross-ton kilometers.
gtk: gross-ton kilometer component per market segment.
In the Slovak Republic, we write the method for track access charges within the minimum access
package by [55]:
5
X 5
X 5
X 5
X
TACH = Li ∗ U1i + Li ∗ U2i + Li ∗ Q ∗ U3i ∗ ke ∗ 10−3 + Li ∗ Q ∗ U4 ∗ 10−3 (3)
i=1 i=1 i=1 i=1
where:
TACH: track access charges.
Li : total track length of the competent category between single transport points in kilometers.
U1i : maximum charges for ordering and allocating infrastructure capacity.
U2i : maximum charges for traffic management and organization.
U3i : maximum charges for ensuring railway infrastructure serviceability.
U4 : maximum charge for use of the electrical supply equipment for supply of traction current.
Q: total gross weight of the train.
ke : an index reflecting a train run with a motive power unit of engine traction on electrified lines in the
respective category. In case a train includes motive power unit engine traction on electrified lines, the
index is 1.2; in other cases, the index is 1.0.
Other items of variable cost (such as labor costs, traction fuel and energy costs, rail vehicle cost)
are described in detail in our previous study [56].Sustainability 2020, 12, 5023 8 of 21
Fixed costs calculation for the product (in our case a train) can be done using different methods,
from the simplest (e.g., absorbing costing or cost calculation by dividing) to the most complex method
(e.g., Activity Based Costing). The application of Activity Based Costing (ABC) methods is different
in every undertaking, and it must particularly take the undertaking’s process management into
account [56].
In the case of insufficient rail capacity, we can assume that they will only change fixed costs that
are directly related to the train running or waiting for rail capacity release, as described in Figure 1.
The rail vehicle’s fixed costs can be calculated directly to the train (time of shipping), taking them into
account in the rate. The calculation rate for locomotives is:
n
P m
P
ni ∗ Ps + n j ∗ Pm +Cc +Co
i=1 j=1
DA + Lls
RtL = P (4)
T
where:
RL : track access charges.
t: locomotive type.
DA : locomotive’s annual depreciation.
ni : number of regular services during the locomotive’s life span.
Ps : average price of regular locomotive service.
nj : number of regular maintenances during a locomotive’s life span.
Pm : average price of regular locomotive maintenance.
Cc : locomotive certification costs.
Co : other locomotive costs.
Lls : locomotive life span in years.
T: total annual working time.
By analogy, the rate per wagon can be calculated. Taking labor costs into account (driver and
train crew) can be done very easily as a ratio between total labor costs and total annual time.
The carrier must have a very good calculation and statistical system for using detailed cost
calculation for a train. Beside detailed cost monitoring, they have to log out every transport performance
for used wagons and locomotives, driver and train crew performance time, etc. per train in detail.
3. Congested Rail Network Capacity Analysis in the Selected Countries
We analyzed congested rail network capacity in the V4 countries: Germany, Austria, and Slovenia.
We selected these countries for comparison of the Slovak Republic with neighboring countries, including
a country that has approximately the same population density (Slovenia) and a country that is one of
the most developed in the EU (Germany).
3.1. Germany
DB Netz AG detects congested railway lines or railway lines that can be expected to suffer from
insufficient capacity in the near future pursuant to the administrative guideline by the Federal Railway
Authority and the Federal Network Agency on “congested railway lines”. The administrative guideline
is provided by the Federal Network Agency [57].Sustainability 2020, 12, 5023 9 of 21
Within the six months following a congestion declaration, DB Netz AG carries out a capacity
analysis in accordance with Section 58 Railway Regulation Act(ERegG) for lines declared congested.
Following this, DB Netz AG produces a draft plan for increasing capacity within a further three months,
with said plan to be submitted to the Federal Railway Authority and the Federal Network Agency
after consultation with the users pursuant to Section 59 ERegG. Congested rail lines are documented in
Table 1 [57].
Table 1. Congested rail lines, DB Netz AG.
No. Line Section
2200 Hamburg-Harburg – Hamburg Hbf
6100 Hamburg Hbf – Hamburg Rainweg
6107 Berlin Hbf (tief) – Berlin-Spandau Ost,
6132 Berlin Südkreuz – Großbeeren Süd,
6134 Berlin Hbf (tief) – Berlin Südkreuz,
6170 Berlin-Wedding Abzw. – Berlin-Gesundbrunnen
6171 Berlin-Wedding Abzw. – Berlin Südkreuz
2550 Aachen Hbf – Aachen West
2600 Stolberg Hbf – Aachen Hbf
3.2. Austria
In Austria, only one route section has been declared as congested in accordance with § 65c, Section 1
EisbG: Mödling–Wien Meidling [54]. The Austrian rail infrastructure manager uses supplementary
fees for congested infrastructure which are described in the chapter 6.1.1 of the Network Statement.
3.3. Slovenia
The Slovenian rail infrastructure manager declared Line 62 Prešnica branch—Koper to be congested.
Analysis of the available capacities on line section Divača–Koper are shown in Table 2 [58].
Table 2. Available capacity on line section Divača–Koper.
Line Section Utilised Capacity of Line (%)
Ljubljana–Kranj 74
20 Ljubljana–Jesenice
Kranj–Jesenice 91
60 Divača–Branching Prešnica Divača–Branching Prešnica 100
62 Branching Prešnica–Koper (Rail
Branching Prešnica–Koper 100
Freight Corridor (RFC) 5 RFC 6)
3.4. Hungary
The Hungarian rail infrastructure manager—MAV Magyar Államvasutak Zártkörűen Működő
Részvénytársaság—declared in the Network Statement, “There is no congested track section on the
open access railway network!” [59].
3.5. Poland
PKP Polskie Linie Kolejowe, the Polish rail infrastructure manager lists, in annex 5.3 of the
Network Statement List, lines with no available capacity or with limited capacity due to the time of
total break or restriction capacity. This lack of available capacity is related to the modernization of the
line or regular rail network maintenance. Table 3 shows some selected sections [60].Sustainability 2020, 12, 5023 10 of 21
Table 3. Lines with no available capacity or with limited capacity—Poland.
Total Break
Restriction of Capacity
No. Line No. Section [Suspended
[Single-Track Traffic]
Traffic]
Warszawa
5 3 Gołabki–O
˛ żarów to 30 April 2020
Mazowiecki
12 January 2020–11
16 8 Dobieszyn–Radom
March 2020
12 February 2020–3
20 15 Łódź Kaliska–Zgierz
December 2020
21 16 Zgierz–Ł˛eczyca from 1 July 2020
26 35 Ostroł˛eka–Chorzele from 16 March 2020
Kraków Główny–Kraków
33 91 complete timetable
Płaszów
Kraków Bonarka–Kraków to 17 September
41 94
Płaszów 2020
Wrocław
55 143 Nadodrze–Wrocław complete timetable
Mikołajów
Gdańsk Główny–Gdańsk
62 249 from 1 June 2020
Zaspa Towarowa
68 351 Wronki–Krzyż complete timetable
69 351 Krzyż–Dolice complete timetable
70 351 Kolin–Szczecin Dabie
˛ complete timetable
Gdańsk Zaspa
76 722 Towarowa–Gdańsk from 1 June 2020
Wiślany
3.6. Czech Republic
The Czech rail infrastructure manager Správa Železnic did not declare any track as congested, but
it published the planned temporary capacity limitation on their website. The insufficient rail capacity
can be observed in the main rail corridor, mainly in the section Pardubice–Praha and Bohumín–Ostrava.
3.7. Slovakia
ŽSR, the Slovak rail infrastructure manager did not declare any rail track as congested, but
insufficient capacity is considered to be a line with capacity utilization of more than 75%. Table 4
shows tracks where the carrying capacity is higher than 70% [61].
IRG-Rail realized a survey with concern to congested rail capacity in European countries. Table 5
shows the number of declarations of congested infrastructure in selected countries as reported by the
regulatory bodies in the IRG-Rail’s questionnaire [10].Sustainability 2020, 12, 5023 11 of 21
Table 4. Carrying capacity in the selected track–Slovak Republic.
Carrying Capacity Utilisation
Track Constraint Section Track No.
Even Direction Odd Direction
Humenné–Michal’any Humenné Strážske 191 75%
(Košice) Kysak–Plaveč Kysak–Prešov 188 70.70%
Poprad Tatry–Starý
TEŽ 183 77.80%
Smokovec
Starý
Smokovec–Štrbské TEŽ 183 76.30%
Pleso
Žilina–Rajec 126 90%
Červená Skala–Banská Brezno–Banská
172 74%
Bystrica Bystrica
Zvolen–B.
Zvolen–B. Bystrica 170 74.30%
Bystrica–Vrútky
Zvolen–Šahy 153 72.70%
Hronská
150 80.70%
Dúbrava–Levice
Zvolen–Palárikovo
(Bratislava) Levice–Úl’any nad
150 83%
Žitavou
Bratislava–D. Bratislava hl.
131 86.30%
Streda–Komárno st.–Bratislava N. Mesto
Bratislava hl.
Bratislava–Kúty 110 76.80% 72.94%
st.–Devínska N. Ves
Zohor–Kúty 110 68.30% 72.08%
Bratislava
137 75.30%
Petržalka–Kittsee AT
Žilina–Bratislava Trnava–Bratislava Rača 120 78.30% 73.90%
Table 5. Congested rail infrastructure in selected European countries.
Country 2014 2015 2016 2017 2018 2019
Austria 1 1 1 1 1 1
Czech Republic 0 0 0 0 0 0
Germany 1 1 1 1 1 0
Hungary 0 0 0 0 1 0
Italy 0 0 0 0 0 314 1
Lithuania 0 0 0 0 2 4
Netherlands 4 0 1 4 8 3
Norway 5 3 3 4 5 5
Poland 1 0 0 0 0 0
Romania 4 4 5 6 6 8
Slovakia 0 0 0 0 0 0
Sweden 5 6 4 6 19 12
United Kingdom 2 2 2 2 2 2
1In Italy, there had been no declaration of congestion until the regulatory body introduced a regulation on how to
calculate the degree of congestion of each major section and defined thresholds that when exceeded must lead to a
declaration of congestion, resulting in 314 macro-sections (not lines) being declared congested for the timetable of
2019 [10].Sustainability 2020, 12, 5023 12 of 21
Congested infrastructure declared by Directive 2012/34/EU in European countries does not reflect
insufficient capacity, which is much higher regarding the number of operational situations that occur
in practice. Therefore, we researched how insufficient rail capacity affects transport costs in Slovak
Republic conditions.
4. Results—Case Study in Slovakia
Insufficient capacity means additional costs for carriers. We modelled and calculated changed
costs for two situations in Slovakia. The first situation is for rail passenger transport (the planned
rail line is the rail corridor), and the second is for rail freight transport (the planned rail line is in the
regional rail track).
The methodology presented in Chapter 2 can be applied to other countries too. Unfortunately,
a relevant comparison of additional costs associated with the insufficient railway capacity among
countries is not possible with regard to different railway networks, different railway infrastructure
access charges, nor other costs (e.g., expenditures on wagons, locomotives, train drivers, etc.).
4.1. Rail Passenger Transport
We took the regular Express train (R 602) on the route Košice–Bratislava as an example. The problem
with insufficient capacity (as can be seen in the previous chapter) is in the track section Trnava–Bratislava.
In the case of insufficient capacity, the best rail track for a diversion rail line is the Leopoldov–Galanta
track. Figure 3 shows the planned and diversion rail lines on the scheme.
Sustainability 2020, 12, x FOR PEER REVIEW 12 of 21
Figure 3. Planned and diversion rail lines Leopoldov–Bratislava.
Figure 3. Planned and diversion rail lines Leopoldov–Bratislava.
We calculated changed
We calculated changed costs
costs for
for planned
planned train
train sequencing.
sequencing. Table
Table 66 shows
shows the
the input
input parameters
parameters
for the express train [62].
for the express train [62].
Table 6. Input parameters for Express train.
Train Sequencing Wagon/Locomotion Tare in Tons Capacity in Seats
Locomotive 383–Vectron 85 -
Wagon type Number
Ampeer 1 48 54
Aeer 1 48 50
WRRmeer 1 48 48
Wagon
Bdghmeer 1 43 47
Bpeer 1 43 64
Bmpeer 2 48 76
Bmz 3 50 66Sustainability 2020, 12, 5023 13 of 21
Table 6. Input parameters for Express train.
Train Sequencing Wagon/Locomotion Tare in Tons Capacity in Seats
Locomotive 383–Vectron 85 -
Wagon type Number
Ampeer 1 48 54
Aeer 1 48 50
Wagon WRRmeer 1 48 48
Bdghmeer 1 43 47
Bpeer 1 43 64
Bmpeer 2 48 76
Bmz 3 50 66
We only calculated costs that changed when carriers change rail track or are waiting for sufficient
capacity (described in chapter 2). We modelled cost rates according to available information regarding
leasing wagons and locomotion of incumbent rail passenger operators in the Slovak Republic and
information from the rail infrastructure manager’s annual report. All cost rates (with the exception of
rail infrastructure charges and energy costs) were recalculated for a minute to better the cost calculation
due to shipping time. We used €1.123/min. for locomotion, €0.15/min. for wagons, €0.333/min. for
drivers, and €0.283/min. for train crews. These rates were calculated using the principle described in
method 1 and 4. Energy consumption costs were calculated as multiplication specific traction energy
consumption, the price of the train’s traction energy, and gross ton kilometers (grtkm). The Railways of
the Slovak Republic (ZSR) rail infrastructure manager states the specific traction energy consumption
for passenger and rail trains in a document outlining the operating rules of the distribution system
operator by quarter, type of train, and type of electrification [63]. We used average specific traction
energy consumption 26.075 kWh per thousand grtkm and price €0.097/kWh recalculated by [64].
The maximum track access charges within a minimum access package is determined according
to Table 7 on the basis of the relevant line category, processed according to Decree no. 2/2018 on
determining the charges for access to railway infrastructure [65].
Table 7. Access charges (minimum access package in the Slovak Republic).
Maximum Charges Maximum Charge for
Maximum
for Ensuring the Use of Electrical
Maximum Charges for Ordering and Charges for Traffic
Serviceability of Supply Equipment
Allocating of Infrastructure Capacity Management and
Railway for Supply of Traction
Track Category Organization
Infrastructure Current
U1i in €/Train Kilometers without DPH U2i in €/Train U3i in €/Thousands of U4 in €/Thousands of
Kilometers Gross Ton Kilometers Gross Ton Kilometers
Train by Timetable Ad-Hoc Train
without DPH without DPH without DPH
1. 0.0691 0.1890 0.957 1.102 0.228
2. 0.0566 0.1575 0.927 1.048 0.228
3. 0.0487 0.1207 0.884 0.945 0.228
4. 0.0319 0.1112 0.774 0.779 0.228
5. 0.0272 0.0981 0.588 0.670 0.228
We used MS Excel for calculation change costs. In practice, software tools can be used (using
the principle and methods described in chapter 2), but for small businesses MS Excel is sufficient.
Table 8 shows the calculation of changed costs for the planned rail line (track Leopoldov–Bratislava)
and diversion rail line (Leopoldov–Galanta diversion rail line, 88.229 km) [66]. Both tracks have a
double electrified track (AC 25 kV 50 Hz) and are category 1 for access charges [55]. We used real time
transport for the planned rail line by timetable (43 min) and modelled transport time for the diversion
rail line. This meant that we modelled the Leopoldov–Galanta rail line by express freight train because
express passenger trains are not in the actual timetable and Galanta–Bratislava by express passenger
trains. The total time of transport for the diversion rail line is 73 min.Sustainability 2020, 12, 5023 14 of 21
Table 8. Comparison of costs on planned and diversion rail lines for passenger transport.
Costs in € Excluding VAT
Costs Item
Planned Rail Line Diversion Rail Line
U1 4.390 6.097
U2 63.336 87.964
Access charges
U3 42.564 59.115
U4 8.806 12.231
Energy 97.692 135.678
Driver 14.319 24.309
Train crew 36.507 61.977
Locomotion 48.289 81.979
Wagons 64.500 109.500
Total 380.403 579.850
The difference in cost between using planned rail lines and diversion rail lines is approximately
€199.4, excluding VAT, i.e., costs on the diversion rail line are higher by approximately 52.4%.
In practice, carriers must most often make a decision about using a diversion rail line in the case
of an accident on a planned rail line or delays of previous trains. In this case, the rail infrastructure
manager charges fees for the planned rail line. The decision depends on waiting time (see Figure 1).
We calculated changed cost due to the waiting time and energy consumption. Table 9 and Figure 4
show the results for our modelled situation.
Table 9. Costs for a planned rail line in the case of waiting for track release—rail passenger transport.
Changed Cost in € Excluding VAT
Waiting Time [min]
Driver Train Crew Locomotion Wagons
10 17.649 44.997 59.519 79.5
20 20.979 53.487 70.749 94.5
30 24.309 61.977 81.979 109.5
40 27.639 70.467 93.209 124.5
50 30.969 78.957 104.439 139.5
60 34.299 87.447 115.669 154.5
70 37.629 95.937 126.899 169.5
80 40.959 104.427 138.129 184.5
90 44.289 112.917 149.359 199.5
100 47.619 121.407 160.589 214.5
Energy consumption costs and track access charge costs are the same as in Table 8 for all
waiting times.
As seen in Figure 4, if the waiting time is higher than 40 min. it is better for carriers to use a
diversion rail line. The advantage of using the diversion rail line even with a short waiting time is due
to the short distance of the diversion rail line (the difference is only 24.7 km) and the diversion rail
line’s technical parameter is an electrified double track. The situation is completely different in the
case of regional lines, as seen in the next chapter.80 40.959 104.427 138.129 184.5
90 44.289 112.917 149.359 199.5
100 47.619 121.407 160.589 214.5
Energy
Sustainability consumption
2020, 12, 5023 costs and track access charge costs are the same as in Table 8 for all waiting
15 of 21
times.
800
700
Changed costs in € 600
500
400
300
200
100
0
0 5 10 15 20 25 30 35 40 45 50 55 60 65 70 75 80 85 90 95 100
Waiting time in min.
Cost - planned line Cost - diversion line
Figure
Figure 4.
4. Changed
Changed costs
costs due
due waiting
waiting time—rail
time—rail passenger
passenger transport.
transport.
4.2. Rail Freight
As seen in Transport
Figure 4, if the waiting time is higher than 40 min. it is better for carriers to use a
diversion railfreight
For rail line. The advantage
transport, of using
we choose thethe diversion
section rail line
Dunajská even with a short
Streda–Vajnory. waitingcapacity
The average time is
due to the short distance of the diversion rail line (the difference is only 24.7 km) and the
utilization is 64%, but the problem is a section of this track, Bratislava-Nové Mesto–Bratislava-Vajnory,diversion
rail
whereline’s
thetechnical
capacity parameter
utilizationisisan electrified
almost 80%, double
and thetrack.
otherThe situation
track sectionisiscompletely
problem atdifferent
peak timein
the case of regional lines, as seen in the next chapter.
where the capacity is not enough for rail passenger transport either. Track Komárno–Dunajská
Streda–Bratislava-Nové Mesto is a single non-electrified track. The track Bratislava-Nové
4.2. Rail Freight Transport
Mesto–Bratislava-Vajnory is part of the Bratislava rail junction and electrified (AC 25 kV, 50 Hz).
As seenFor inrailFigure
freight5,transport,
in the casewe
ofchoose the section
insufficient Dunajská
capacity, carriersStreda–Vajnory. Therail
can use diversion average capacity
line Dunajská
utilization is 64%, but the
Streda–Komárno–Nové problem is a section of this track, Bratislava-Nové Mesto–Bratislava-
Zámky–Bratislava-Vajnory.
Sustainability 2020, 12, x FOR PEER REVIEW 15 of 21
Vajnory, where the capacity utilization is almost 80%, and the other track section is problem at peak
time where the capacity is not enough for rail passenger transport either. Track Komárno–Dunajská
Streda–Bratislava-Nové Mesto is a single non-electrified track. The track Bratislava-Nové Mesto–
Bratislava-Vajnory is part of the Bratislava rail junction and electrified (AC 25 kV, 50 Hz). As seen in
Figure 5, in the case of insufficient capacity, carriers can use diversion rail line Dunajská Streda–
Komárno–Nové Zámky–Bratislava-Vajnory.
Figure
Figure5.5.Planned
Plannedand
anddiversion
diversionrail
railline
lineDunajská
DunajskáStreda–Bratislava-Vajnory.
Streda–Bratislava-Vajnory.
Table
Table 10
10 shows
shows the
the technical
technical parameter
parameter and
and track
track category
category for
for access
access charges
charges of
of the
the individual
individual
track section in the planned and diversion rail lines [66].
track section in the planned and diversion rail lines [66].
Table 10. Track parameter.
Distance Max. Length of Track
Track Section Electrified
[km] Freight Train [m] Category
Dunajská Streda–
40.567 Non 625 2Sustainability 2020, 12, 5023 16 of 21
Table 10. Track parameter.
Max. Length
Track Section Distance [km] Electrified of Freight Track Category
Train [m]
Dunajská Streda–Bratislava-Nové Mesto 40.567 Non 625 2
Planned track
Bratislava-Nové
9.475 AC 25 kV 50 Hz 690 1
Mesto–Bratislava-Vajnory
Dunajská Streda–Komárno 53.073 Non 625 2
Diversion track Komárno–Nové Zámky 28.266 AC 25 kV 50 Hz 620 1
Nové Zámky–Bratislava-Vajnory 81.353 AC 25 kV 50 Hz 700 1
We took a freight train with 22 wagons (type: Sggrss 80’) and locomotive (type: Siemens ER 20) in
this case study. The technical parameters of a Sggrss 80´ wagon are [67]:
• wagon length over buffers: 26.39 m,
• loading length: 2 × 12.22 m,
• wagon tare: 28.5 t,
• max. weight of loaded wagon: 106.5 t,
• max. axle load: 22.5 t.
The locomotive weight is 80.5 tons, and the length over buffers is 19.975 m. We considered 40 ton
loaded containers on the wagon (by study Vel Wagon) As a consequence it follows that the train’s total
length is 600.555 m, and gross tonnage is 1587.5 tons. The transport time was modelled by the running
speed of the Nex freight train on the relevant line section. Total time of transport on the planned rail
line is 58 min. and 127 min. on the diversion rail line.
We modelled cost rates analogous to rail passenger transport. We used €0.533/min. for locomotion,
€0.014/min. for wagons, €0.333/min. for drivers and €0.283/min. for train crews. Track access charges
are described in Table 7, whereas with electrified tracks we have increased U3i by using coefficient ke
at an index of 1.2 according to the Network Statement of ZSR. For calculation of energy consumption
cost we used specific energy consumption (0.6 L/thousand grtkm) and diesel price (€1.025/L) (average
annual price in the year 2019 excluding VAT) [68]. Table 11 shows the calculation results.
Table 11. Cost comparison on planned and diversion rail line—freight transport.
Costs in € Excluding VAT
Costs Item
Planned Rail Line Diversion Rail Line
U11 0.655 7.575
U12 2.296 3.004
U21 9.447 109.290
Access charges
U22 37.606 49.199
U31 19.891 230.124
U32 67.491 88.298
Energy 48.857 158.838
Driver 19.314 42.291
Locomotion 30.740 67.31
Wagons 17.864 39.116
Total 254.160 795.044
As seen in Table 11, cost differences between a planned rail line and a diversion rail line are
very high despite the fact that a large part of the diversion rail line is of a higher category. This is
caused by a much higher diversion rail line distance. The biggest difference is in the access charges
costs—€350.104—which is more than 64% of the total cost change. Therefore, we researched how to
change the costs due to waiting for released rail capacity analogically to rail passenger transport, e.g.,
costs of access charges in the diversion rail line are unchanged. Table 12 and Figure 6 present the
comparison of the changed costs related to waiting time.Sustainability 2020, 12, 5023 17 of 21
Table 12. Costs for a planned rail line in the case of waiting for track release—rail freight transport.
Changed Cost in € Excluding VAT
Waiting Time [min.]
Driver Locomotion Wagons
20 25.974 41.34 24.024
40 32.634 51.94 30.184
60 39.294 62.54 36.344
80 45.954 73.14 42.504
100 52.614 83.74 48.664
120 59.274 94.34 54.824
140 65.934 104.94 60.984
160 72.594 115.54 67.144
180 79.254 126.14 73.304
200 85.914 136.74 79.464
220 92.574 147.34 85.624
240 99.234 157.94 91.784
260 105.894 168.54 97.944
280 112.554 179.14 104.104
300 119.214 189.74 110.264
Sustainability 2020, 12, x FOR PEER REVIEW 17 of 21
700
600
Changed costs in €
500
400
300
200
100
0
0 20 40 60 80 100 120 140 160 180 200 220 240 260 280 300
Waiting time in min.
Cost - planned line Cost - diversion line
Figure 6.
Figure 6. Cost
Cost changes
changes due
due to
to waiting
waiting time—rail
time—rail freight
freight transport.
transport.
Thetook
We limitthe
waiting time with
same access regard
charge coststo costs inand
(€137.39) thisenergy
case is consumption
129.5 min. If the waiting
costs time
(€48.86) intoisaccount
higher,
it isusing
by betterTable
for carriers to waiting
11 for all use a diversion
times. line in this modelled situation. The waiting time depends on
the type of locomotive
The limit used,
waiting time withwagons,
regardand driver
to costs costs.
in this case is 129.5 min. If the waiting time is higher, it
is better for carriers to use a diversion line in this modelled situation. The waiting time depends on the
5. Discussion
type and Conclusions
of locomotive used, wagons, and driver costs.
In terms of the EU’s strategy, rail transport is a key transport sector for achieving sustainable
5. Discussion and Conclusions
mobility. In support of this aim, the European Commission has adopted reform measures in the form
In railway
of four terms ofpackages
the EU’saimed
strategy, rail transport
at increasing is a key transport
rail transport sector for
competitiveness achieving sustainable
in comparison with other
mobility.
transportIn support
modes. The ofmain
this aim, the European
objective Commission
of the measures has adopted
is gradually reform
opening the measures in the
rail transport form
market
of four railway packages aimed at increasing rail transport competitiveness in comparison
to the private sector. However, with new operators entering the market for rail freight and passenger with other
transport
transportmodes. The main
(open access objective
services), ofof
parts the measures
the railway is gradually opening
infrastructure the rail
(especially on transport
the main market
Europeanto
the private
railway sector. However,
corridors) with new
become congested onoperators
the railway entering
network.the Due
market for rail freight
to creating the trainand passenger
schedule and
transport (open
the priority access
of rail services),
passenger parts of the
transport, railway
there infrastructure
are significantly (especially
limited on the main
possibilities Europeana
for providing
railway
route incorridors) become congested
the train schedule accordingon to the
therailway
needs ofnetwork. Dueoperators.
rail freight to creatingTherefore,
the train schedule and
freight trains
have to wait until the railway infrastructure capacity is freed or use another route, which, however,
is usually insufficient in terms of weight norms and normative length. In such cases, carriers incur
higher costs, which may in turn reduce rail freight competitiveness.
Throughout our research, the exact cost and waiting time have not been calculated, but show
how insufficient capacity affects carrier costs and can lead to a reduction in rail transportSustainability 2020, 12, 5023 18 of 21
the priority of rail passenger transport, there are significantly limited possibilities for providing a route
in the train schedule according to the needs of rail freight operators. Therefore, freight trains have to
wait until the railway infrastructure capacity is freed or use another route, which, however, is usually
insufficient in terms of weight norms and normative length. In such cases, carriers incur higher costs,
which may in turn reduce rail freight competitiveness.
Throughout our research, the exact cost and waiting time have not been calculated, but show how
insufficient capacity affects carrier costs and can lead to a reduction in rail transport competitiveness
compared to other transport modes. Furthermore, our suggested methodology can be a very useful
management tool for effective decision-making in the case of insufficient rail network capacity that can
occur at any time, e.g., in the event of an accident on a planned rail track, unplanned track maintenance,
etc. The practical application of our proposed methodology requires a very good calculation and
statistical system that allows detailed cost calculation for a train.
This study is limited by premises introduced in Section 2. In fact, problems may arise with a
short lease of the fleet and with a lack of staff qualified in railway transport (train drivers and train
crews). These facts impact the carriers’ costs and increase an ineffective utilization of the rolling stock
significantly. Thus, future research will be focused on analyzing the insufficient railway infrastructure
capacity in other countries too and on studying the impact of increasing the railway infrastructure
capacity on increasing the performance of railway freight transport and open access services in railway
passenger transport as well as on studying the impact on the competitiveness of railway transport
when compared to other transport modes. Another object of the research may be the study of efficiency
of investments in congested railway infrastructure in light of social costs.
Currently, there is no problem with the rail infrastructure capacity in view of the coronavirus
pandemic (COVID-19). On the contrary, rail transport performances are declining. However, after the
pandemic, along with economy growth, transport performance will also grow. It is important that
transport demands are met by environmentally friendly transport modes. Rail transport is considered
to be the most environmentally friendly transport mode in the case of using electric traction, but carriers
(especially in the mode of open access services in passenger transport and services in freight transport)
will provide their services only if they are competitive with other transport modes. The productivity
of rail carriers and railway systems as a whole is constrained by the existing rail infrastructure [69].
Therefore, it is necessary to invest in railway infrastructure. New investments will not only increase
rail transport competitiveness but will also contribute to the European Green Deal.
Author Contributions: Conceptualization, A.D., V.Z., and L.C.; methodology, A.D.; data curation, V.Z. and L.C.;
investigation, A.D. and V.Z.; formal analysis, V.Z. and L.C.; writing—original draft preparation, A.D., V.Z., and
L.C.; visualization, A.D. and L.C.; project administration and funding acquisition, A.D. All authors have read and
agreed to the published version of the manuscript.
Funding: This paper is a partial output of the grant project VEGA 1/0379/20: Socio-economic aspects of rail
transport market services deregulation in the context of EU legal frameworks and sustainable mobility.
Conflicts of Interest: The authors declare no conflict of interest.
References
1. Thompson, B.; Obika, B. Advancing Applied Research in High Volume Transport in Low-Income Countries
in Africa and South Asia. Sustainability 2020, 12, 4088. [CrossRef]
2. Wangai, A.W.; Rohacs, D.; Boros, A. Supporting the Sustainable Development of Railway Transport in
Developing Countries. Sustainability 2020, 12, 3572. [CrossRef]
3. Quium, A.S.M. Transport Corridors for Wider Socio–Economic Development. Sustainability 2019, 11, 5248.
[CrossRef]
4. Jomnonkwao, S.; Champahom, T.; Ratanavaraha, V. Methodologies for Determining the Service Quality of
the Intercity Rail Service Based on Users’ Perceptions and Expectations in Thailand. Sustainability 2020, 12,
4259. [CrossRef]Sustainability 2020, 12, 5023 19 of 21
5. Iwnicki, S.; Spiryagin, M.; Cole, C.; McSweeney, T. Handbook of Railway Vehicle Dynamics, 2nd ed.; CRC Press,
Taylor & Francis Group: London, UK, 2019.
6. Pasha, J.; Dulebenets, M.A.; Abioye, O.F.; Kavoosi, M.; Moses, R.; Sobanjo, J.; Ozguven, E.E. A Comprehensive
Assessment of the Existing Accident and Hazard Prediction Models for the Highway-Rail Grade Crossings
in the State of Florida. Sustainability 2020, 12, 4291. [CrossRef]
7. Song, Y.; Ronnquist, A.; Navik, P.; Liu, Z. Contact Wire Irregularity Stochastics and Effect on High-speed
Railway Pantograph-Catenary Interactions. IEEE Trans. Instrum. Meas. 2020. [CrossRef]
8. Kavoosi, M.; Dulebenets, M.A.; Pasha, J.; Abioye, O.F.; Moses, R.; Sobanjo, J.; Ozguven, E.E. Development of
Algorithms for Effective Resource Allocation among Highway–Rail Grade Crossings: A Case Study for the
State of Florida. Energies 2020, 13, 1419. [CrossRef]
9. Directive 2012/34/EU of the European Parliament and of the Council of 21 November 2012 Establishing a Single
European Railway Area. Available online: https://eur-lex.europa.eu/legal-content/EN/TXT/PDF/?uri=CELEX:
32012L0034&from=en (accessed on 30 March 2020).
10. IRG-Rail. A Survey of Congested Infrastructure, Priority Criteria and Capacity Charges in Europe. Available
online: https://www.irg-rail.eu/irg/documents/position-papers/166,2019.html (accessed on 15 April 2020).
11. Shi, Z.; Zhang, N.; Zhu, L. Understanding the Propagation and Control Strategies of Congestion in Urban
Rail Transit Based on Epidemiological Dynamics Model. Information 2019, 10, 258. [CrossRef]
12. Zeng, Z.; Li, T.X. Analyzing Congestion Propagation on Urban Rail Transit Oversaturated Conditions:
A Framework Based on SIR Epidemic Model. Urb. Rail Transit 2018, 4, 130–140. [CrossRef]
13. Shi, Z.; Zhang, N.; Zhang, Y. Hazard-Based Model for Estimation of Congestion Duration in Urban Rail
Transit Considering Loss Minimization. Transp. Res. Rec. 2016, 2595, 78–87. [CrossRef]
14. Nash, C.; Crozet, Y.; Heike, L.; Nilson, J.E.; Smith, A. Track Access Charges: Reconciling Conflicting Objectives;
Project Report CERRE; Centre on Regulation in Europe: Brussels, Belgium, 2018; Available online: https:
//cerre.eu/publications/track-access-charges-reconciling-conflicting-objectives (accessed on 17 April 2020).
15. Nilsson, J.E. Towards a welfare enhancing process to manage railway infrastructure access. Transp. Res. Part
A 2002, 36, 419–436. [CrossRef]
16. Stojadinovic, N.; Boskovic, B.; Bugarinovic, M. Bridging the gap between infrastructure capacity allocation
and market-oriented railway: An algorithmic approach. Transport 2019, 34, 708–721. [CrossRef]
17. Mlinaric, T.J.; Pirnar, M. Optimizing track infrastructure availability. Promet-Traffic Transp. 2009, 21, 113–121.
[CrossRef]
18. Abril, M.; Barber, F.; Ingolotti, L.; Salido, M.A.; Tormos, P.; Lova, A. An assessment of railway capacity.
Transp. Res. Part E Logist. Transp. Rev. 2008, 44, 774–806. [CrossRef]
19. Meško, P.; Gašparík, J.; Lalinská, J. Railway capacity issues on slovak international corridors. In Transport
Means: Proceedings of the International Scientific Conference, Kaunas University of Technology: Juodkrante, Lithuania,
2017; pp. 436–441. Available online: https://www.scopus.com/record/display.uri?eid=2-s2.0-85045257522&
origin=resultslist&sort=plf-f&src=s&st1=Railway+capacity+issues+on+slovak+international+corridors&
st2=&sid=785c747af6e7094c7791ad823c97b4ed&sot=b&sdt=b&sl=72&s=TITLE-ABS-KEY%28Railway+
capacity+issues+on+slovak+international+corridors%29&relpos=0&citeCnt=1&searchTerm= (accessed on
18 June 2020).
20. Shen, Y.; Zhao, J. Capacity constrained accessibility of high-speed rail. Transportation 2017, 44, 395–422.
[CrossRef]
21. Zhao, L.; Zhao, Y.; Hu, Q.; Li, H.; Stoeter, J. Evaluation of consolidation center cargo capacity and locations
for China railway express. Transp. Res. Part E Logist. Transp. Rev. 2018, 117, 58–81. [CrossRef]
22. Reinhardt, L.B.; Pisinger, D.; Lusby, R. Railway capacity and expansion analysis using time discretized paths.
Flex. Serv. Manuf. J. 2018, 30, 712–739. [CrossRef]
23. Potti, P.; Marinov, M.; Sweeney, E. A Simulation Study on the Potential of Moving Urban Freight by a
Cross-City Railway Line. Sustainability 2019, 11, 6088. [CrossRef]
24. Kozan, E.; Burdett, R.L. Techniques for absolute capacity determination in railways. Transp. Res. Part B
Methodol. 2006, 40, 616–632.
25. Gasparik, J.; Abramovic, B.; Halas, M. New graphical approach to railway infrastructure capacity analysis.
Promet-Traffic Transp. 2015, 27, 283–290. [CrossRef]
26. Sun, Y.; Ji, L.; Zang, G.B. Analysis of carrying capacity on double track line and its interrelated effects. J. China
Railw. Soc. 2010, 23, 90–95.Sustainability 2020, 12, 5023 20 of 21
27. Lai, Y.-C.; Liu, Y.-H.; Lin, Y.-J. Standardization of capacity unit for headway-based rail capacity analysis.
Transp. Res. Part C Emerg. Technol. 2015, 57, 68–84. [CrossRef]
28. Lizbetin, J.; Ponicky, J.; Zitricky, V. The Throughput Capacity of Rail Freight Corridors on the Particular
Railways Network. Nase More 2016, 63, 161–169.
29. Masek, J.; Kendra, M. Camaj, J. Model of the Transport Capacity of the Train and Railway Track Based on
Used Types of Wagon. Transp. Means 2016, 2016, 584–588.
30. Azadi, M.A.A.; Jolai, F.; Nasiri, M.M. A multi-commodity network flow model for railway capacity
optimization in case of line blockage. Int. J. Rail Transp. 2019, 7, 297–320. [CrossRef]
31. Caballini, C.; Fioribello, S.; Sacone, S.; Siri, S. An MILP optimization problem for sizing port rail networks
and planning shunting operations in container terminals. IEEE Trans. Autom. Sci. Eng. 2016, 13, 1492–1503.
[CrossRef]
32. Li, X.; Yamamoto, T.; Yan, T.; Lu, L.; Ye, X. First Train Timetabling for Urban Rail Transit Networks with
Maximum Passenger Transfer Satisfaction. Sustainability 2020, 12, 4166. [CrossRef]
33. Odollinsky, K.; Boysen, H. Railway line capacity utilisation and its impact on maintenance costs. J. Rail
Transp. Plan. Manag. 2019, 9, 22–33. [CrossRef]
34. Iris, Ç.; Lam, J.S.L. A review of energy efficiency in ports: Operational strategies, technologies and energy
management systems. Renew. Sustain. Energy Rev. 2019, 112, 170–182. [CrossRef]
35. Sternad, M.; Jagric, T.; Rosi, B. Railway usage charges based on marginal maintenance costs. Proc. Inst. Civ.
Eng. Transp. 2018, 171, 3–10. [CrossRef]
36. Abramovic, B. Infrastructure Access Charges. In Sustainable Rail Transport. Lecture Notes in Mobility;
Marinov, M., Ed.; Springer: Cham, Switzerland, 2018; pp. 45–58.
37. Johanson, P.; Nilson, J.E. An economic analysis of track maintenance costs. Transp. Policy 2004, 11, 277–286.
[CrossRef]
38. Odolinsky, K.; Nilsson, J.-E. Estimating the marginal maintenance cost of rail infrastructure usage in Sweden;
does more data make a difference? Econ. Transp. 2017, 10, 8–17. [CrossRef]
39. Anderson, M.; Bjorklund, G.; Haraldsson, M. Marginal railway track renewal costs: A survival data approach.
Transp. Res. Part A-Policy Pract. 2016, 87, 68–77. [CrossRef]
40. Calvo, F.; de Ona, J.; Lopez, G.; Garach, L.; de Ona, R. Rail track costs management for efficient railway
charges. Proc. Inst. Civ. Eng. Transp. 2013, 166, 325–335. [CrossRef]
41. Zhang, J.; Pourazarm, S.; Cassandras, C.G.; Paschalidis, I.C. The price of anarchy in transportation networks
by estimating user cost functions from actual traffic data. In Proceedings of the IEEE 55th Conference on
Decision and Control (CDC), Las Vegas, NV, USA, 12–14 December 2016; pp. 789–794.
42. Christidis, P.; Rivas, J.N.I. Measuring Road Congestion. JRC Scientific and Policy Reports.
European Commission. Joint Research Centre. Institute for Perspective Technological Studies. 2012.
Available online: https://publications.jrc.ec.europa.eu/repository/bitstream/JRC69961/congestion%20report%
20final.pdf (accessed on 8 June 2020).
43. Verhoef, E.T.; Koh, A.; Shepherd, S. Pricing, capacity and long-run cost functions for first-best and second-best
network problems. Transp. Res. Series B Methodol. 2010, 44, 870–885. [CrossRef]
44. Gillen, D. Efficient Use and Provision of Transportation Infrastructure with Imperfect Pricing: Second
Best Rules. In The Full Costs and Benefits of Transportation Contributions to Theory, Method and Measurement;
Greene, D.L., Jones, D.W., Delucchi, M.A., Eds.; Springer: Berlin/Heidelberg, Germany, 1997; pp. 193–218.
45. Xia, C.Y. Construction and application of multivariate linear regression model on road cost. Appl. Mech.
Mater. 2014, 556, 807–811. [CrossRef]
46. Shi, F.; Wang, Y.-Z.; Xu, G.-M.; Li, M.-S. Traffic network equilibrium analysis considering bi-directional flow
effect on local road. China J. Highw. Transp. 2013, 26, 137–142.
47. Sodikov, J. Road cost models for prefeasibility studies in developing countries. J. Infrastruct. Syst. 2009, 15,
278–289. [CrossRef]
48. Baumgartner, J.P. Prices and Costs in the Railway Sector; LITEP (Laboratoire d’Intermodalitè des Transports Et
de Planification), Ecole Politechnique Federale de Lausanne: Lausanne, Switzerland, 2001.
49. Grosso, M. Intermodal Transport: A tool for the calculation of the cost function. In Proceedings of the 12th
SIET (Società Italiana degli Economisti dei Trasporti) National Conference, Rome, Italy, 17–18 June 2010.
50. Komsta, H.; Rybicka, I.; Bukova, B.; Brumercikova, E. The case study of the cargobeamer system use in rail
transport in Slovakia. Transp. Probl. 2018, 13, 143–149. [CrossRef]You can also read