Graph Neural Network-Based Anomaly Detection in Multivariate Time Series
←
→
Page content transcription
If your browser does not render page correctly, please read the page content below
PRELIMINARY VERSION: DO NOT CITE
                                              The AAAI Digital Library will contain the published
                                                   version some time after the conference

   Graph Neural Network-Based Anomaly Detection in Multivariate Time Series
                                                      Ailin Deng, Bryan Hooi
                                                 National University of Singapore
                                          ailin@comp.nus.edu.sg, bhooi@comp.nus.edu.sg

                           Abstract                                        allow them to diagnose and respond to the anomaly as
                                                                           quickly as possible.
  Given high-dimensional time series data (e.g., sensor data),
  how can we detect anomalous events, such as system faults                   Due to the inherent lack of labeled anomalies in his-
  and attacks? More challengingly, how can we do this in a                 torical data, and the unpredictable and highly varied na-
  way that captures complex inter-sensor relationships, and de-            ture of anomalies, the anomaly detection problem is typi-
  tects and explains anomalies which deviate from these rela-              cally treated as an unsupervised learning problem. In past
  tionships? Recently, deep learning approaches have enabled               years, many classical unsupervised approaches have been
  improvements in anomaly detection in high-dimensional                    developed, including linear model-based approaches (Shyu
  datasets; however, existing methods do not explicitly learn              et al. 2003), distance-based methods (Angiulli and Pizzuti
  the structure of existing relationships between variables, or            2002), and one-class methods based on support vector ma-
  use them to predict the expected behavior of time series. Our            chines (Schölkopf et al. 2001). However, such approaches
  approach combines a structure learning approach with graph
  neural networks, additionally using attention weights to pro-
                                                                           generally model inter-relationships between sensors in rela-
  vide explainability for the detected anomalies. Experiments              tively simple ways: for example, capturing only linear rela-
  on two real-world sensor datasets with ground truth anoma-               tionships, which is insufficient for complex, highly nonlin-
  lies show that our method detects anomalies more accurately              ear relationships in many real-world settings.
  than baseline approaches, accurately captures correlations be-              Recently, deep learning-based techniques have enabled
  tween sensors, and allows users to deduce the root cause of a            improvements in anomaly detection in high-dimensional
  detected anomaly.                                                        datasets. For instance, Autoencoders (AE) (Aggarwal 2015)
                                                                           are a popular approach for anomaly detection which uses
                     1    Introduction                                     reconstruction error as an outlier score. More recently, Gen-
                                                                           erative Adversarial Networks (GANs) (Li et al. 2019) and
With the rapid growth in interconnected devices and sensors                LSTM-based approaches (Qin et al. 2017) have also re-
in Cyber-Physical Systems (CPS) such as vehicles, smart                    ported promising performance for multivariate anomaly de-
buildings, industrial systems and data centres, there is an                tection. However, most methods do not explicitly learn
increasing need to monitor these devices to secure them                    which sensors are related to one another, thus facing difficul-
against attacks. This is particularly the case for critical in-            ties in modelling high-dimensional sensor data with many
frastructures such as power grids, water treatment plants,                 potential inter-relationships. This limits their ability to de-
transportation, and communication networks.                                tect and explain deviations from such relationships when
   Many such real-world systems involve large numbers of                   anomalous events occur.
interconnected sensors which generate substantial amounts
                                                                              How do we take full advantage of the complex rela-
of time series data. For instance, in a water treatment plant,
                                                                           tionships between sensors in multivariate time series? Re-
there can be numerous sensors measuring water level, flow
                                                                           cently, graph neural networks (GNNs) (Defferrard, Bresson,
rates, water quality, valve status, and so on, in each of their
                                                                           and Vandergheynst 2016) have shown success in modelling
many components. Data from these sensors can be related in
                                                                           graph-structured data. These include graph convolution net-
complex, nonlinear ways: for example, opening a valve re-
                                                                           works (GCNs) (Kipf and Welling 2016), graph attention net-
sults in changes in pressure and flow rate, leading to further
                                                                           works (GATs) (Veličković et al. 2017) and multi-relational
changes as automated mechanisms respond to the change.
                                                                           approaches (Schlichtkrull et al. 2018). However, applying
   As the complexity and dimensionality of such sensor data
                                                                           them to time series anomaly detection requires overcom-
grow, humans are increasingly less able to manually mon-
                                                                           ing two main challenges. Firstly, different sensors have very
itor this data. This necessitates automated anomaly detec-
                                                                           different behaviors: e.g. one may measure water pressure,
tion approaches which can rapidly detect anomalies in high-
                                                                           while another measures flow rate. However, typical GNNs
dimensional data, and explain them to human operators to
                                                                           use the same model parameters to model the behavior of
Copyright © 2021, Association for the Advancement of Artificial            each node. Secondly, in our setting, the graph edges (i.e. re-
Intelligence (www.aaai.org). All rights reserved.                          lationships between sensors) are initially unknown, and have
to be learned along with our model, while GNNs typically Multivariate Time Series Modelling These approaches
treat the graph as an input. generally model the behavior of a multivariate time series
Hence, in this work, we propose our novel Graph Devi- based on its past behavior. A comprehensive summary is
ation Network (GDN) approach, which learns a graph of given in (Blázquez-Garcı́a et al. 2020).
relationships between sensors, and detects deviations from Classical methods include auto-regressive models (Hauta-
these patterns. Our method involves four main components: maki, Karkkainen, and Franti 2004) and the auto-regressive
1) Sensor Embedding, which uses embedding vectors to integrated moving average (ARIMA) models (Zhang et al.
flexibly capture the unique characteristics of each sensor; 2012; Zhou et al. 2018), based on a linear model given
2) Graph Structure Learning learns the relationships be- the past values of the series. However, their linearity makes
tween pairs of sensors, and encodes them as edges in a them unable to model complex nonlinear characteristics in
graph; 3) Graph Attention-Based Forecasting learns to time series, which we are interested in.
predict the future behavior of a sensor based on an atten- To learn representations for nonlinear high-dimensional
tion function over its neighboring sensors in the graph; 4) time series and predict time series data, deep learning-
Graph Deviation Scoring identifies and explains deviations based time series methods have attracted interest. These
from the learned sensor relationships in the graph. techniques, such as Convolutional Neural Network (CNN)
To summarize, the main contributions of our work are: based models (Munir et al. 2018), Long Short Term Memory
(LSTM) (Filonov, Lavrentyev, and Vorontsov 2016; Hund-
• We propose GDN, a novel attention-based graph neural man et al. 2018; Park, Hoshi, and Kemp 2018) and Gen-
network approach which learns a graph of the dependence erative Adversarial Networks (GAN) models (Zhou et al.
relationships between sensors, and identifies and explains 2019; Li et al. 2019), have found success in practical time
deviations from these relationships. series tasks. However, they do not explicitly learn the re-
• We conduct experiments on two water treatment plant lationships between different time series. The relationships
datasets with ground truth anomalies. Our results demon- between sensors are meaningful for anomaly detection: for
strate that GDN detects anomalies more accurately than example, they can be used to diagnose anomalies by identi-
baseline approaches. fying deviations from these relationships.
Graph-based methods provide a way to model the re-
• We show using case studies that GDN provides an ex- lationships between sensors by representing the inter-
plainable model through its embeddings and its learned dependencies with edges. Such methods include probabilis-
graph. We show that it helps to explain an anomaly, based tic graphical models, which encode joint probability distri-
on the subgraph over which a deviation is detected, atten- butions, as described in (Bach and Jordan 2004; Tank, Foti,
tion weights, and by comparing the predicted and actual and Fox 2015). However, most existing methods are de-
behavior on these sensors. signed to handle stationary time series, and have difficulty
modelling more complex and highly non-stationary time se-
2 Related Work ries arising from sensor settings.
We first review methods for anomaly detection, and meth-
ods for multivariate time series data, including graph-based Graph Neural Networks In recent years, graph neural
approaches. Since our approach relies on graph neural net- networks (GNNs) have emerged as successful approaches
works, we summarize related work in this topic as well. for modelling complex patterns in graph-structured data. In
general, GNNs assume that the state of a node is influenced
by the states of its neighbors. Graph Convolution Networks
Anomaly Detection Anomaly detection aims to detect un- (GCNs) (Kipf and Welling 2016) model a node’s feature rep-
usual samples which deviate from the majority of the data. resentation by aggregating the representations of its one-step
Classical methods include density-based approaches (Bre- neighbors. Building on this approach, graph attention net-
unig et al. 2000), linear-model based approaches (Shyu et al. works (GATs) (Veličković et al. 2017) use an attention func-
2003), distance-based methods (Angiulli and Pizzuti 2002), tion to compute different weights for different neighbors
classification models (Schölkopf et al. 2001), detector en- during this aggregation. Related variants have shown suc-
sembles (Lazarevic and Kumar 2005) and many others. cess in time-dependent problems: for example, GNN-based
More recently, deep learning methods have achieved models can perform well in traffic prediction tasks (Yu,
improvements in anomaly detection in high-dimensional Yin, and Zhu 2017; Chen et al. 2019; Zheng et al. 2020).
datasets. These include approaches such as autoencoders Applications in recommendation systems (Lim et al. 2020;
(AE) (Aggarwal 2015), which use reconstruction error as an Schlichtkrull et al. 2018) verify the effectiveness of GNN to
anomaly score, and related variants such as variational au- model large-scale multi-relational data.
toencoders (VAEs) (Kingma and Welling 2013), which de- However, these approaches use the same model param-
velop a probabilistic approach, and autoencoders combining eters to model the behavior of each node, and hence face
with Gaussian mixture modelling (Zong et al. 2018). limitations in representing very different behaviors of dif-
However, our goal is to develop specific approaches for ferent sensors. Moreover, GNNs typically require the graph
multivariate time series data, explicitly capturing the graph structure as an input, whereas the graph structure is initially
of relationships between sensors. unknown in our setting, and needs to be learned from data.1. Sensor Embedding 3.3 Sensor Embedding
Input: In many sensor data settings, different sensors can have very
vi
N sensors ..
. N sensors different characteristics, and these characteristics can be re-
…
lated in complex ways. For example, imagine we have two
Time water tanks, each containing a sensor measuring the water
level in the tank, and a sensor measuring the water quality
2. Graph Structure Learning
in the tank. Then, it is plausible that the two water level sen-
Learned Relations sors would behave similarly, and the two water quality sen-
…
X1
3. Graph Attention-Based Forecasting sors would behave similarly. However, it is equally plausible
X3
X2 Attention-Based Features Forecast
that sensors within the same tank would exhibit strong cor-
Z1
relations. Hence, ideally, we would want to represent each
...
sensor in a flexible way that captures the different ‘factors’
Z2
underlying its behavior in a multidimensional way.
4. Graph Deviation Scoring Z3
Hence, we do this by introducing an embedding vector
Observation Prediction for each sensor, representing its characteristics:
vi ∈ Rd , for i ∈ {1, 2, · · · , N }
These embeddings are initialized randomly and then trained
Figure 1: Overview of our proposed framework. along with the rest of the model.
Similarity between these embeddings vi indicates simi-
larity of behaviors: hence, sensors with similar embedding
3 Proposed Framework values should have a high tendency to be related to one an-
other. In our model, these embeddings will be used in two
3.1 Problem Statement ways: 1) for structure learning, to determine which sensors
In this paper, our training data consists of sensor (i.e. mul- are related to one another, and 2) in our attention mecha-
tivariate time series) data from N sensorsh over Ttrain time i nism, to perform attention over neighbors in a way that al-
(1) (T ) lows heterogeneous effects for different types of sensors.
ticks: the sensor data is denoted strain = strain , · · · , straintrain ,
which is used to train our approach. In each time tick t, the 3.4 Graph Structure Learning
(t)
sensor values strain ∈ RN form an N dimensional vector rep- A major goal of our framework is to learn the relationships
resenting the values of our N sensors. Following the usual between sensors in the form of a graph structure. To do this,
unsupervised anomaly detection formulation, the training we will use a directed graph, whose nodes represent sen-
data is assumed to consist of only normal data. sors, and whose edges represent dependency relationships
Our goal is to detect anomalies in testing data, which between them. An edge from one sensor to another indicates
comes from the same N sensors but over a separate that the first sensor is used for modelling the behavior of the
h of Ttest timei ticks: the test data is denoted stest =
set second sensor. We use a directed graph because the depen-
(1) (T )
stest , · · · , stesttest . dency patterns between sensors need not be symmetric. We
The output of our algorithm is a set of Ttest binary labels use an adjacency matrix A to represent this directed graph,
indicating whether each test time tick is an anomaly or not, where Aij represents the presence of a directed edge from
i.e. a(t) ∈ {0, 1}, where a(t) = 1 indicates that time t is node i to node j.
anomalous. We design a flexible framework which can be applied ei-
ther to 1) the usual case where we have no prior information
3.2 Overview about the graph structure, or 2) the case where we have some
prior information about which edges are plausible (e.g. the
Our GDN method aims to learn relationships between sen- sensor system may be divided into parts, where sensors in
sors as a graph, and then identifies and explains deviations different parts have minimal interaction).
from the learned patterns. It involves four main components: This prior information can be flexibly represented as a set
1. Sensor Embedding: uses embedding vectors to capture of candidate relations Ci for each sensor i, i.e. the sensors
the unique characteristics of each sensor; it could be dependent on:
2. Graph Structure Learning: learns a graph structure rep- Ci ⊆ {1, 2, · · · , N } \ {i} (1)
resenting dependence relationships between sensors; In the case without prior information, the candidate relations
3. Graph Attention-Based Forecasting: forecasts future of sensor i is simply all sensors, other than itself.
values of each sensor based on a graph attention function To select the dependencies of sensor i among these can-
over its neighbors; didates, we compute the similarity between node i’s embed-
ding vector, and the embeddings of its candidates j ∈ Ci :
4. Graph Deviation Scoring: identifies deviations from the
vi > vj
learned relationships, and localizes and explains these de- eji = for j ∈ Ci (2)
viations. kvi k · kvj k
Figure 1 provides an overview of our framework. Aji = 1{j ∈ TopK({eki : k ∈ Ci })} (3)(t)
That is, we first compute eji , the normalized dot product be- feature Wxi , and a is a vector of learned coefficients for
tween the embedding vectors of sensor i, and the candidate the attention mechanism. We use LeakyReLU as the non-
relation j ∈ Ci . Then, we select the top k such normalized linear activation to compute the attention coefficient, and
dot products: here TopK denotes the indices of top-k val- normalize the attention coefficents using the softmax func-
ues among its input (i.e. the normalized dot products). The tion in Eq. (8).
value of k can be chosen by the user according to the desired
sparsity level. Next, we will define our graph attention-based Output Layer From the above feature extractor, we obtain
model which makes use of this learned adjacency matrix A. (t) (t)
representations for all N nodes, namely {z1 , · · · , zN }.
(t)
3.5 Graph Attention-Based Forecasting For each zi , we element-wise multiply (denoted ◦) it with
In order to provide useful explanations for anomalies, we the corresponding time series embedding vi , and use the re-
would like our model to tell us: sults across all nodes as the input of stacked fully-connected
layers with output dimensionality N , to predict the vector of
• Which sensors are deviating from normal behavior?
sensor values at time step t, i.e. s(t) :
• In what ways are they deviating from normal behavior? h i
(t) (t)
To achieve these goals, we use a forecasting-based ap- ŝ(t) = fθ v1 ◦ z1 , · · · , vN ◦ zN (9)
proach, where we forecast the expected behavior of each
sensor at each time based on the past. This allows the user to The model’s predicted output is denoted as ŝ(t) . We use
easily identify the sensors which deviate greatly from their the Mean Squared Error between the predicted output ŝ(t)
expected behavior. Moreover, the user can compare the ex- and the observed data, s(t) , as the loss function for mini-
pected and observed behavior of each sensor, to understand mization:
why the model regards a sensor as anomalous. 1
Ttrain
X 2
Thus, at time t, we define our model input x(t) ∈ RN ×w LMSE = ŝ(t) − s(t) (10)
based on a sliding window of size w over the historical time Ttrain − w t=w+1 2
series data (whether training or testing data):
h i 3.6 Graph Deviation Scoring
x(t) := s(t−w) , s(t−w+1) , · · · , s(t−1) (4) Given the learned relationships, we want to detect and ex-
plain anomalies which deviate from these relationships.
The target output that our model needs to predict is the sen- To do this, our model computes individual anomalousness
sor data at the current time tick, i.e. s(t) . scores for each sensor, and also combines them into a sin-
gle anomalousness score for each time tick, thus allowing
Feature Extractor To capture the relationships between the user to localize which sensors are anomalous, as we will
sensors, we introduce a graph attention-based feature extrac- show in our experiments.
tor to fuse a node’s information with its neighbors based on The anomalousness score compares the expected behavior
the learned graph structure. Unlike existing graph attention at time t to the observed behavior, computing an error value
mechanisms, our feature extractor incorporates the sensor Err at time t and sensor i:
embedding vectors vi , which characterize the different be- (t)
Erri (t) = |si − ŝi |
(t)
(11)
haviors of different types of sensors. To do this, we compute
node i’s aggregated representation zi as follows: As different sensors can have very different characteristics,
their deviation values may also have very different scales.
(t) (t)
X (t)
To prevent the deviations arising from any one sensor from
zi = ReLU αi,i Wxi + αi,j Wxj , (5) being overly dominant over the other sensors, we perform a
j∈N (i) robust normalization of the error values of each sensor:
(t) Erri (t) − µ
ei
where xi ∈ Rw is node i’s input feature, N (i) = ai (t) = , (12)
{j | Aji > 0} is the set of neighbors of node i obtained from σ
ei
d×w where µ ei and σei are the median and inter-quartile range
the learned adjacency matrix A, W ∈ R is a trainable
weight matrix which applies a shared linear transformation (IQR1 ) across time ticks of the Erri (t) values respectively.
to every node, and the attention coefficients αi,j are com- We use median and IQR instead of mean and standard devi-
puted as: ation as they are more robust against anomalies.
(t) (t)
Then, to compute the overall anomalousness at time tick
gi = vi ⊕ Wxi (6) t, we aggregate over sensors using the max function (we use
max as it is plausible for anomalies to affect only a small
(t) (t)
π (i, j) = LeakyReLU a> gi ⊕ gj (7) subset of sensors, or even a single sensor):
exp (π (i, j)) A (t) = max ai (t) (13)
αi,j = P , (8) i
k∈N (i)∪{i} exp (π (i, k))
1
(t)
IQR is defined as the difference between the 1st and 3rd quar-
where ⊕ denotes concatenation; thus gi concatenates the tiles of a distribution or set of values, and is a robust measure of the
sensor embedding vi and the corresponding transformed distribution’s spread.Finally, a time tick t is labelled as an anomaly if A(t) Datasets #Features #Train #Test Anomalies
exceeds a fixed threshold. While different approaches could
be employed to set the threshold such as extreme value the- SWaT 50 49668 44981 11.97%
ory (Siffer et al. 2017), to avoid introducing additional hy- WADI 112 104847 17270 5.99%
perparameters, we use in our experiments a simple approach
of setting the threshold as the max of A(t) over the valida- Table 1: Statistics of the two datasets used in experiments
tion data.
4 Experiments • PCA: Principal Component Analysis (Shyu et al. 2003)
finds a low-dimensional projection that captures most of
In this section, we conduct experiments to answer the fol-
the variance in the data. The anomaly score is the recon-
lowing research questions:
struction error of this projection.
• RQ1 (Accuracy): Does our method outperform baseline
methods in accuracy of anomaly detection in multivariate • KNN: K Nearest Neighbors uses each point’s distance
time series, based on ground truth labelled anomalies? to its kth nearest neighbor as an anomaly score (Angiulli
and Pizzuti 2002).
• RQ2 (Ablation): How do the various components of the
method contribute to its performance? • FB: A Feature Bagging detector is a meta-estimator that
fits a number of detectors on various sub-samples of the
• RQ3 (Interpretability of Model): How can we under-
dataset, then aggregates their scores (Lazarevic and Ku-
stand our model based on its embeddings and its learned
mar 2005).
graph structure?
• AE: Autoencoders consist of an encoder and decoder
• RQ4 (Localizing Anomalies): Can our method localize
which reconstruct data samples (Aggarwal 2015). It uses
anomalies and help users to identify the affected sensors,
the reconstruction error as the anomaly score.
as well as to understand how the anomaly deviates from
the expected behavior? • DAGMM: Deep Autoencoding Gaussian Model joints
deep Autoencoders and Gaussian Mixture Model to gen-
4.1 Datasets erate a low-dimensional representation and reconstruction
As real-world datasets with labeled ground-truth anomalies error for each observation (Zong et al. 2018).
are scarce, especially for large-scale plants and factories, • LSTM-VAE: LSTM-VAE (Park, Hoshi, and Kemp
we use two sensor datasets based on water treatment phys- 2018) replaces the feed-forward network in a VAE with
ical test-bed systems: SWaT and WADI, where operators LSTM to combine LSTM and VAE. It can measure re-
have simulated attack scenarios of real-world water treat- construction error with the anomaly score.
ment plants, recording these as the ground truth anomalies.
The Secure Water Treatment (SWaT) dataset comes from • MAD-GAN: A GAN model is trained on normal
a water treatment test-bed coordinated by Singapore’s Pub- data, and the LSTM-RNN discriminator along with
lic Utility Board (Mathur and Tippenhauer 2016). It rep- a reconstruction-based approach is used to compute
resents a small-scale version of a realistic modern Cyber- anomaly scores for each sample (Li et al. 2019).
Physical system, integrating digital and physical elements
4.3 Evaluation Metrics
to control and monitor system behaviors. Such systems are
increasingly used in critical areas, including power plants We use precision (Prec), recall (Rec) and F1-Score (F1)
and Internet of Things (IoT), which need to be guarded over the test dataset and its ground truth values to evalu-
against potential attacks from malicious attackers. As an ex- ate the performance of our method and baseline models:
tension of SWaT, Water Distribution (WADI) is a distribu- F1 = 2×Prec×Rec TP
Prec+Rec , where Prec = TP+FP and Rec = TP+FN ,
TP
tion system comprising a larger number of water distribution and TP, TN, FP, FN are the numbers of true positives, true
pipelines (Ahmed, Palleti, and Mathur 2017). Thus WADI negatives, false positives, and false negatives. Note that our
forms a more complete and realistic water treatment, storage datasets are unbalanced, which justifies the choice of these
and distribution network. The datasets contain two weeks of metrics, which are suitable for unbalanced data. To detect
data from normal operations, which are used as training data anomalies, we use the maximum anomaly score over the val-
for the respective models. A number of controlled, physical idation dataset to set the threshold. At test time, any time
attacks are conducted at different intervals in the following step with an anomaly score over the threshold will be re-
days, which correspond to the anomalies in the test set. garded as an anomaly.
Table 1 summarises the statistics of the two datasets. In or-
der to speed up training, the original data samples are down- 4.4 Experimental Setup
sampled to one measurement every 10 seconds by taking the We implement our method and its variants in Py-
median values. The resulting label is the most common label Torch (Paszke et al. 2017) version 1.5.1 with CUDA 10.2
during the 10 seconds. and PyTorch Geometric Library (Fey and Lenssen 2019)
version 1.5.0, and train them on a server with Intel(R)
4.2 Baselines Xeon(R) CPU E5-2690 v4 @ 2.60GHz and 4 NVIDIA RTX
We compare the performance of our proposed method with 2080Ti graphics cards. The models are trained using the
five popular anomaly detection methods, including: Adam optimizer with learning rate 1 × 10⁻³ and (β1 , β2 ) =SWaT WADI SWaT WADI
Method Prec Rec F1 Prec Rec F1 Method Prec Rec F1 Prec Rec F1
PCA 24.92 21.63 0.23 39.53 5.63 0.10 GDN 99.35 68.12 0.81 97.50 40.19 0.57
KNN 7.83 7.83 0.08 7.76 7.75 0.08
- T OP K 97.41 64.70 0.78 92.21 35.12 0.51
FB 10.17 10.17 0.10 8.60 8.60 0.09
- E MB 92.31 61.25 0.76 91.86 33.49 0.49
AE 72.63 52.63 0.61 34.35 34.35 0.34
- ATT 71.05 65.06 0.68 61.33 38.85 0.48
DAGMM 27.46 69.52 0.39 54.44 26.99 0.36
LSTM-VAE 96.24 59.91 0.74 87.79 14.45 0.25
MAD-GAN 98.97 63.74 0.77 41.44 33.92 0.37 Table 3: Anomaly detection accuracy in term of perci-
sion(%), recall(%), and F1-score of GDN and its variants.
GDN 99.35 68.12 0.81 97.50 40.19 0.57
Table 2: Anomaly detection accuracy in terms of preci-
sion(%), recall(%), and F1-score, on two datasets with
ground-truth labelled anomalies.
(0.9, 0.99). We train models for up to 50 epochs and use
early stopping with patience of 10. We use embedding vec-
2_FIC_101_C
2_FIC_101_CO
tors with length of 128(64), k with 30(15) and hidden lay-
O
2_FIC_201_CO
ers of 128(64) neurons for the WADI (SWaT) dataset, corre- 2_FIC_201_C
2_FIC_301_CO
sponding to their difference in input dimensionality. We set O ......
the sliding window size w as 5 for both datasets. 2_FIC_301_C
O
4.5 RQ1. Accuracy
In Table 2, we show the anomaly detection accuracy in terms
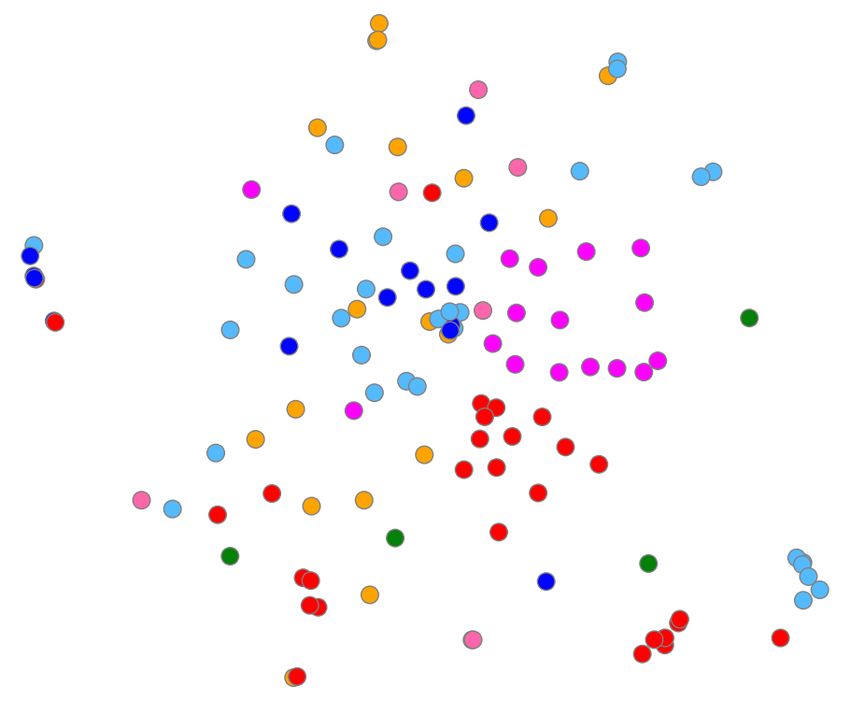
of precision, recall and F1-score, of our GDN method and Figure 2: A t-SNE plot of the sensor embeddings of our
the baselines, on the SWaT and WADI datasets. The results trained model on the WADI dataset. Node colors denote
show that GDN outperforms the baselines in both datasets, classes. Specifically, the dashed circled region shows local-
with high precision in both datasets of 0.99 on SWaT and ized clustering of 2 FIC x01 CO sensors. These sensors are
0.98 on WADI. In terms of F-measure, GDN outperforms the measuring similar indicators in WADI.
baselines on SWaT; on WADI, it has 54% higher F-measure
than the next best baseline. WADI is more unbalanced than
SWaT and has higher dimensionality than SWaT as shown in model in both datasets. This implies that the embedding
Table 1. Thus, our method shows effectiveness even in un- feature improves the learning of weight coefficients in the
balanced and high-dimensional attack scenarios, which are graph attention mechanism.
of high importance in real-world applications.
• Removing the attention mechanism degrades the model’s
4.6 RQ2. Ablation performance most in our experiments. Since sensors have
very different behaviors, treating all neighbors equally in-
To study the necessity of each component of our method, we troduces noise and misleads the model. This verifies the
gradually exclude the components to observe how the model importance of the graph attention mechanism.
performance degrades as a result. First, we study the impor-
tance of the learned graph by substituting it with a static These findings suggest that GDN’s use of a learned graph
complete graph. In a complete graph, each node is linked to structure, sensor embedding, and attention mechanisms all
all the other nodes. Second, to study the importance of the contribute to its accuracy, which provides an explanation for
sensor embeddings, we use an attention mechanism without its better performance over the baseline methods.
sensor embeddings: that is, gi = Wxi in Eq. (6). Finally,
we disable the attention mechanism, instead aggregating us- 4.7 RQ3. Interpretability of Model
ing equal weights assigned to all neighbors. The results are Interpretability via Sensor Embeddings To explain the
summarized in Table 3 and provide the following findings: learned model, we can visualize its sensor embedding vec-
tors, e.g. using t-SNE(Maaten and Hinton 2008), shown on
• Replacing the learned graph structure with a complete the WADI dataset in Figure 2. Similarity in this embedding
graph degrades performance in both datasets. The effect space indicate similarity between the sensors’ behaviors, so
on the WADI dataset is more obvious. This indicates that inspecting this plot allows the user to deduce groups of sen-
the graph structure learner enhances performance, espe- sors which behave in similar ways.
cially for large-scale datasets. To validate this, we color the nodes using 7 colors corre-
• The variant which removes the sensor embedding from sponding to 7 classes of sensors and actuators in WADI sys-
the attention mechanism underperforms the original tems, including 4 kinds of sensors: flow indication transmit-1_AIT_005_PV
1_MV_001_STATUS
1_FIT_001_PV
1_LT_001_PV
1_FIT_001_PV
1_MV_001_STATUS
Figure 3: Left: Force-directed graph layout with attention weights as edge weights, showing an attack in WADI. The red triangle
denotes the central sensor identified by our approach, with highest anomaly score. Red circles indicate nodes with edge weights
larger than 0.1 to the central node. Right: Comparing expected and observed data helps to explain the anomaly. The attack
period is shaded in red.
ters, pressure meters, analyser indication transmitters, tank highest anomaly score, as indicated by the red triangle in
level meters; and 3 types of actuators: transfer pumps, valves Figure 3 (left). The large deviation at this sensor indicates
and tank level switches. The representation exhibits local- that 1 MV 001 STATUS could be the attacked sensor, or
ized clustering in the projected 2D space, which verifies closely related to the attacked sensor.
the effectiveness of the learned feature representations to re- GDN indicates (in red circles) the sensors with highest at-
flect the localized sensors’ or actuators’ behavior similarity. tention weights to the deviating sensor. Indeed, these neigh-
Moreover, we observe a group of sensors forming a local- bors are closely related sensors: the 1 FIT 001 PV neigh-
ized cluster, shown in the dashed circled region. Inspecting bor is normally highly correlated with 1 MV 001 STATUS,
the data, we find that these sensors measure similar indi- as the latter shows the valve status for a valve which con-
cators in water tanks that perform similar functions in the trols the flow measured by the former. However, the at-
WADI water distribution network, explaining the similarity tack caused a deviation from this relationship, as the at-
between these sensors. tack gave false readings only to 1 FIT 001 PV. GDN fur-
ther allows understanding of this anomaly by comparing the
Interpretability via Graph Edges and Attention Weights predicted and observed sensor values in Figure 3 (right):
Edges in our learned graph provide interpretability by in- for 1 MV 001 STATUS, our model predicted an increase (as
dicating which sensors are related to one another. More- 1 FIT 001 PV increased, and our model has learned that the
over, the attention weights further indicate the importance of sensors increase together). Due to the attack, however, no
each of a node’s neighbors in modelling the node’s behav- change was observed in 1 MV 001 STATUS, leading to a
ior. Figure 3 (left) shows an example of this learned graph on large error which was detected as an anomaly by GDN.
the WADI dataset. The following subsection further shows a In summary: 1) our model’s individual anomaly scores
case study of using this graph to localize and understand an help to localize anomalies; 2) its attention weights help to
anomaly. find closely related sensors; 3) its predictions of expected
behavior of each sensor allows us to understand how anoma-
4.8 RQ4. Localizing Anomalies lies deviate from expectations.
How well can our model help users to localize and under-
stand an anomaly? Figure 3 (left) shows the learned graph 5 Conclusion
of sensors, with edges weighted by their attention weights, In this work, we proposed our Graph Deviation Network
and plotted using a force-directed layout(Kobourov 2012). (GDN) approach, which learns a graph of relationships be-
We conduct a case study involving an anomaly with tween sensors, and detects deviations from these patterns,
a known cause: as recorded in the documentation of the while incorporating sensor embeddings. Experiments on two
WADI dataset, this anomaly arises from a flow sensor, real-world sensor datasets showed that GDN outperformed
1 FIT 001 PV, being attacked via false readings. These false baselines in accuracy, provides an interpretable model, and
readings are within the normal range of this sensor, so de- helps users to localize and understand anomalies. Future
tecting this anomaly is nontrivial. work can consider additional architectures, hyperparameter
During this attack period, GDN identifies selection, and online training methods, to further improve
1 MV 001 STATUS as the deviating sensor with the the practicality of the approach.Acknowledgements Kipf, T. N.; and Welling, M. 2016. Semi-supervised classi-
fication with graph convolutional networks. arXiv preprint
This work was supported in part by NUS ODPRT Grant
arXiv:1609.02907 .
R252-000-A81-133.
Kobourov, S. G. 2012. Spring embedders and force directed
References graph drawing algorithms. arXiv preprint arXiv:1201.3011
.
Aggarwal, C. C. 2015. Outlier analysis. In Data mining,
237–263. Springer. Lazarevic, A.; and Kumar, V. 2005. Feature bagging for out-
lier detection. In Proceedings of the eleventh ACM SIGKDD
Ahmed, C. M.; Palleti, V. R.; and Mathur, A. P. 2017. WADI: international conference on Knowledge discovery in data
a water distribution testbed for research in the design of se- mining, 157–166.
cure cyber physical systems. In Proceedings of the 3rd In-
Li, D.; Chen, D.; Jin, B.; Shi, L.; Goh, J.; and Ng, S.-K.
ternational Workshop on Cyber-Physical Systems for Smart
2019. MAD-GAN: Multivariate anomaly detection for time
Water Networks, 25–28.
series data with generative adversarial networks. In Interna-
Angiulli, F.; and Pizzuti, C. 2002. Fast outlier detection tional Conference on Artificial Neural Networks, 703–716.
in high dimensional spaces. In European conference on Springer.
principles of data mining and knowledge discovery, 15–27. Lim, N.; Hooi, B.; Ng, S.-K.; Wang, X.; Goh, Y. L.;
Springer. Weng, R.; and Varadarajan, J. 2020. STP-UDGAT: Spatial-
Bach, F. R.; and Jordan, M. I. 2004. Learning graphical Temporal-Preference User Dimensional Graph Attention
models for stationary time series. IEEE transactions on sig- Network for Next POI Recommendation. In Proceedings
nal processing 52(8): 2189–2199. of the 29th ACM International Conference on Information
& Knowledge Management, 845–854.
Blázquez-Garcı́a, A.; Conde, A.; Mori, U.; and Lozano, J. A.
2020. A review on outlier/anomaly detection in time series Maaten, L. v. d.; and Hinton, G. 2008. Visualizing data using
data. arXiv preprint arXiv:2002.04236 . t-SNE. Journal of machine learning research 9(Nov): 2579–
2605.
Breunig, M. M.; Kriegel, H.-P.; Ng, R. T.; and Sander, J.
2000. LOF: identifying density-based local outliers. In Pro- Mathur, A. P.; and Tippenhauer, N. O. 2016. SWaT: a water
ceedings of the 2000 ACM SIGMOD international confer- treatment testbed for research and training on ICS security.
ence on Management of data, 93–104. In 2016 International Workshop on Cyber-physical Systems
for Smart Water Networks (CySWater), 31–36. IEEE.
Chen, W.; Chen, L.; Xie, Y.; Cao, W.; Gao, Y.; and Feng,
X. 2019. Multi-range attentive bicomponent graph con- Munir, M.; Siddiqui, S. A.; Dengel, A.; and Ahmed, S.
volutional network for traffic forecasting. arXiv preprint 2018. DeepAnT: A deep learning approach for unsupervised
arXiv:1911.12093 . anomaly detection in time series. IEEE Access 7: 1991–
2005.
Defferrard, M.; Bresson, X.; and Vandergheynst, P. 2016.
Park, D.; Hoshi, Y.; and Kemp, C. C. 2018. A multimodal
Convolutional neural networks on graphs with fast localized
anomaly detector for robot-assisted feeding using an lstm-
spectral filtering. In Advances in neural information pro-
based variational autoencoder. IEEE Robotics and Automa-
cessing systems, 3844–3852.
tion Letters 3(3): 1544–1551.
Fey, M.; and Lenssen, J. E. 2019. Fast Graph Representation Paszke, A.; Gross, S.; Chintala, S.; Chanan, G.; Yang, E.;
Learning with PyTorch Geometric. In ICLR Workshop on DeVito, Z.; Lin, Z.; Desmaison, A.; Antiga, L.; and Lerer,
Representation Learning on Graphs and Manifolds. A. 2017. Automatic differentiation in PyTorch. In NIPS-W.
Filonov, P.; Lavrentyev, A.; and Vorontsov, A. 2016. Mul- Qin, Y.; Song, D.; Chen, H.; Cheng, W.; Jiang, G.; and
tivariate industrial time series with cyber-attack simulation: Cottrell, G. 2017. A dual-stage attention-based recurrent
Fault detection using an lstm-based predictive data model. neural network for time series prediction. arXiv preprint
arXiv preprint arXiv:1612.06676 . arXiv:1704.02971 .
Hautamaki, V.; Karkkainen, I.; and Franti, P. 2004. Outlier Schlichtkrull, M.; Kipf, T. N.; Bloem, P.; Van Den Berg, R.;
detection using k-nearest neighbour graph. In Proceedings Titov, I.; and Welling, M. 2018. Modeling relational data
of the 17th International Conference on Pattern Recogni- with graph convolutional networks. In European Semantic
tion, 2004. ICPR 2004., volume 3, 430–433. IEEE. Web Conference, 593–607. Springer.
Hundman, K.; Constantinou, V.; Laporte, C.; Colwell, I.; and Schölkopf, B.; Platt, J. C.; Shawe-Taylor, J.; Smola, A. J.;
Soderstrom, T. 2018. Detecting spacecraft anomalies using and Williamson, R. C. 2001. Estimating the support of a
lstms and nonparametric dynamic thresholding. In Proceed- high-dimensional distribution. Neural computation 13(7):
ings of the 24th ACM SIGKDD international conference on 1443–1471.
knowledge discovery & data mining, 387–395.
Shyu, M.-L.; Chen, S.-C.; Sarinnapakorn, K.; and Chang,
Kingma, D. P.; and Welling, M. 2013. Auto-encoding varia- L. 2003. A novel anomaly detection scheme based on
tional bayes. arXiv preprint arXiv:1312.6114 . principal component classifier. Technical report, MIAMIUNIV CORAL GABLES FL DEPT OF ELECTRICAL AND COMPUTER ENGINEERING. Siffer, A.; Fouque, P.-A.; Termier, A.; and Largouet, C. 2017. Anomaly detection in streams with extreme value theory. In Proceedings of the 23rd ACM SIGKDD Interna- tional Conference on Knowledge Discovery and Data Min- ing, 1067–1075. Tank, A.; Foti, N.; and Fox, E. 2015. Bayesian struc- ture learning for stationary time series. arXiv preprint arXiv:1505.03131 . Veličković, P.; Cucurull, G.; Casanova, A.; Romero, A.; Lio, P.; and Bengio, Y. 2017. Graph attention networks. arXiv preprint arXiv:1710.10903 . Yu, B.; Yin, H.; and Zhu, Z. 2017. Spatio-temporal graph convolutional networks: A deep learning framework for traf- fic forecasting. arXiv preprint arXiv:1709.04875 . Zhang, Y.; Hamm, N. A.; Meratnia, N.; Stein, A.; Van De Voort, M.; and Havinga, P. J. 2012. Statistics-based out- lier detection for wireless sensor networks. International Journal of Geographical Information Science 26(8): 1373– 1392. Zheng, C.; Fan, X.; Wang, C.; and Qi, J. 2020. Gman: A graph multi-attention network for traffic prediction. In Pro- ceedings of the AAAI Conference on Artificial Intelligence, volume 34, 1234–1241. Zhou, B.; Liu, S.; Hooi, B.; Cheng, X.; and Ye, J. 2019. BeatGAN: Anomalous Rhythm Detection using Adversar- ially Generated Time Series. In IJCAI, 4433–4439. Zhou, Y.; Qin, R.; Xu, H.; Sadiq, S.; and Yu, Y. 2018. A data quality control method for seafloor observatories: the application of observed time series data in the East China Sea. Sensors 18(8): 2628. Zong, B.; Song, Q.; Min, M. R.; Cheng, W.; Lumezanu, C.; Cho, D.; and Chen, H. 2018. Deep autoencoding gaussian mixture model for unsupervised anomaly detection. In In- ternational Conference on Learning Representations.
You can also read