Regional Insights February 2021 - Electricity North West
←
→
Page content transcription
If your browser does not render page correctly, please read the page content below
Regional Insights February 2021
About us

    Electricity North West is one of 14 electricity
    distribution network operators (DNOs) in Great
    Britain. We are responsible for maintaining and
    upgrading 56,000km of network and nearly
    500 major substations across the region. We
    supply electricity to the diverse communities in
    the North West of England which extends from
    Macclesfield all the way up to Carlisle.

    We are regulated by the Office of Gas and Electricity Markets
    (Ofgem) who provide DNOs with their licence to operate and
    decide what’s fair for us to charge our customers for each price
    control period.
    Our current price control began in 2015 and runs to 2023 and
    is referred to as RIIO-ED1. This stands for Revenue = Incentives
    + Innovation + Outputs, Electricity Distribution 1. Under this
    framework, the price we can charge our customers is fixed
    until the next price control, RIIO-ED2, which will run from 2023
    until 2028.
    Work is already underway to set the framework for RIIO-ED2,
    which will apply to all electricity distribution network companies.
    The framework will determine what RIIO-ED2, which begins on
    1 April 2023, looks like.
    RIIO-ED2 will see significant change in the way electricity is
    generated, consumed and stored, driving innovation across
    the whole energy system both now and into the future. This
    will include an important transition in our role, from DNO to
    distribution system operation (DSO).
    The transition to DSO is not one activity but rather the delivery
    and co-ordination of a range of functions. Our DSO transition
    plan, which is currently in development, will cover the three
    broad roles of planning and network development, network
    operation and market development.

2     Regional Insights February 2021
Contents

1 WELCOME		                                                                      4

2 INTRODUCTION                                                                   5
    Planning our future network                                                  5
    Document structure                                                           5

3 METHODOLOGY                                                                     6
   Assessment of network capacity                                                 7
   Network analysis – demand                                                      8
   Network analysis – generation                                                  8
   Intervention optioneering                                                      9
   Investment assessment and decision-making                                     10

4 REGIONAL INSIGHT RESULTS                                                       11
    Grid supply point insights                                                   11

5 GRID SUPPLY POINT RESULTS                                                      13

6 GET IN TOUCH                                                                   51

                                               Regional Insights February 2021    3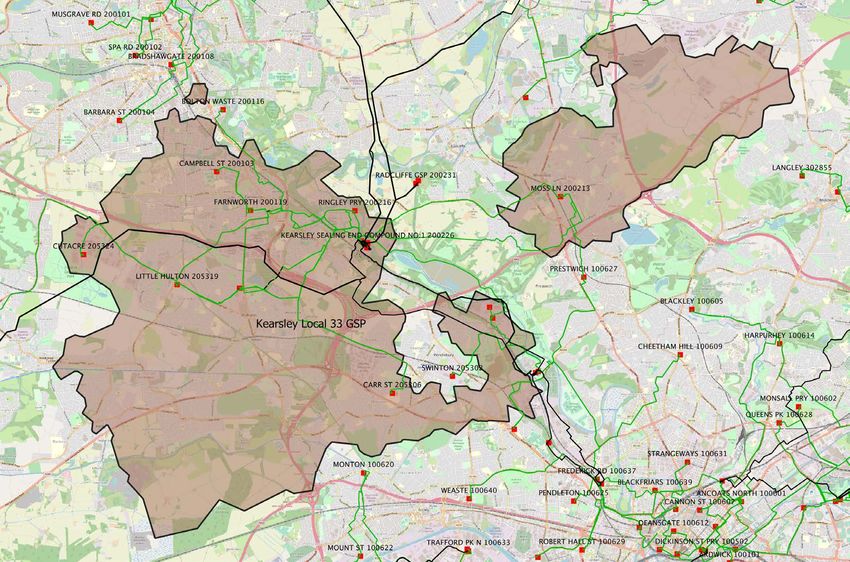
1 Welcome

Welcome to our Regional Insights document, in which                           Our analysis shows that in many cases our existing infrastructure can
we report on the impact of our 2020 Distribution Future                       accommodate our customers’ long-term future requirements, even
                                                                              for net zero compliant scenarios. However, additional capacity will
Electricity Scenarios (DFES) forecasts on our network in
                                                                              be required in some parts of the network to meet the challenge. By
the near term, and share our view of the long-term future                     considering all DFES scenarios we will ensure that interventions are
to 2050.                                                                      carried out timely and efficiently to satisfy our customers’ needs.
We are continuing to maintain a reliable supply of electricity during the     This Regional Insights report is part of a suite of documents which
ongoing global pandemic, which has brought widespread disruption              provide data for a range of time periods to support our customers
for our customers and changed their electricity requirements. As              and stakeholders with their development plans. Our Heatmap
the region’s DNO, we will play an important role in helping our               Tool provides information about the ability to accommodate
region to ‘build back better‘, supporting government plans for a              additional connections on the present network, including accepted
green recovery, while continuing to work even harder to support the           connections. It is complemented by the Embedded Capacity
communities we serve. One of the critical lessons learned in 2020             Register which lists generation and storage resources (≥1MW) that
is that things can change. Uncertainty around the prospective scale           are connected, or accepted to connect, to our distribution network.
and timings of changes in electricity use has been highlighted by             Our Long Term Development Statement (LTDS) provides more
societal step changes in working practices, the use of transport and          detailed ratings of network components and forecast loadings for
the continuing transition to a net zero carbon future.                        the following five years. Our DFES provides forecasts up to 2050,
The alternative future forecasts presented in our recently published          which are considered in this Regional Insights document, although
DFES report allow us to prepare for a range of eventualities and              it focuses more on the next ten years. A new licence condition will
provide stakeholders with an overview of the electricity distribution         see all DNOs publish a Network Development Plan in 2022 which will
roadmap to 2050. In the past, overall electricity demand did not              likely include some similar information to this report to highlight where
change very quickly, so the studies underpinning the planning of              there is network capacity and when network constraints may occur in
our network were more assured. However, the significant growth of             the next five to ten years.
solar photovoltaics (PV) in the last decade and the large uptake of           We hope you find this document to be a useful insight into the future
electric vehicles anticipated in the 2020s will lead to the use of more       operation of our network and our analysis, which is informing part
complex techniques and render the sharing of our network capacity             of the network investments for our RIIO-ED2 business plan (2023-
assessments with stakeholders even more important.                            2028). If you have any comments or feedback, please contact us.
In this Regional Insights document, we explain what the DFES
demand and generation forecasts mean in terms of network capacity,
and signpost where there could be future network constraints as the
region strives to meet net zero carbon targets. We provide detailed
analysis and a high-level commentary for the parts of the network
supplied by each of our grid supply points which provide connections
from our network to the transmission network. We also examine how
the use of flexible services between now and 2030 could help ensure
the evolution to net zero carbon is a smooth one. Our review then
continues to 2050 and considers the ongoing impact of the transition.

REGIONAL INSIGHTS AND OTHER PLANNING DOCUMENTS

 Connection
 data reports
                                                                                                                                         Steve Cox
                    Embedded                           Distribution Future                                         Engineering and technical director
                  Capacity Register                   Electricity Scenarios

 Network
 capacity
 reports
                     Heat maps           Long Term         Regional
                                        Development      Insights/NDP
                                         Statement

                      2021                                       2050

4     Regional Insights February 2021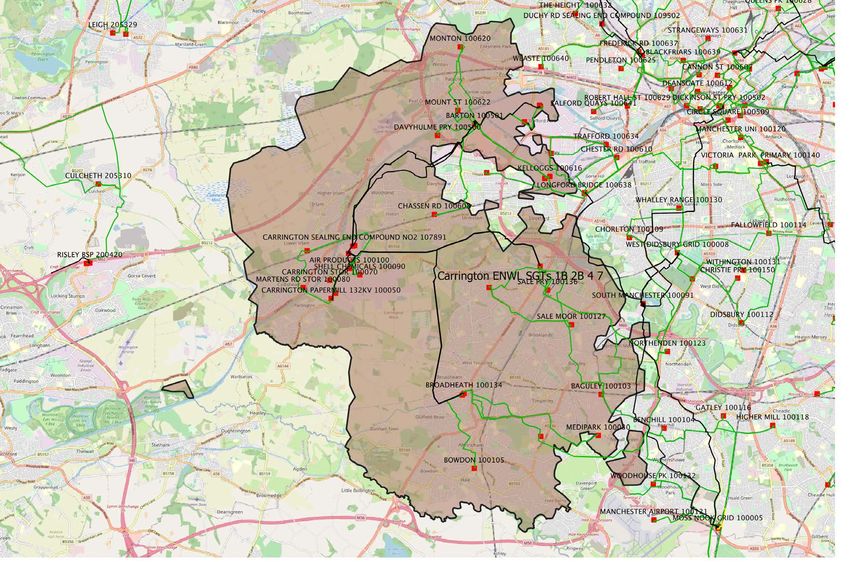
2 Introduction

Planning our future network                                                 We indicate parts of the distribution system most likely to be suited
                                                                            to new connections in the future. We also highlight the parts of
As the DNO for the North West of England, we are responsible for            the network where reinforcement may be required to make new
the affordable development of a safe and reliable electricity network       connections and where we are more likely to require flexible services
which must continue to meet our customers’ needs as they transition         or encourage energy efficiencies.
to a net zero carbon future.
                                                                            While this Regional Insights document intends to focus on
We have a dual role to play in this transition. Firstly, we will act as a   the capabilities of our network to 2030 and beyond to 2050, it
role model for our customers by reducing our own operational carbon         accompanies other publications on our website which summarise the
footprint, having committed to a challenging company target. Our            capacity available today. Customers looking to make a connection
ambition is to drive down our emissions from heating and transport          in the area find our LTDS and Heatmap Tool useful sources of
and become net zero by 2038.                                                information in advance of making a connection application. The
Secondly, we have a responsibility to support the ambitions of our          Heatmap Tool is updated monthly to provide the latest view of
stakeholders such as the local authorities in our region who have           capacity in the area.
committed to achieving net zero in advance of the 2050 national             We have previously provided a long-term view of our network’s
target.                                                                     capability to accommodate forecast demand and generation in
                                                                            the Regional Insights section of our first DFES in 2018. The update
                                                                            presented here is part of our commitment to share more information
                                                                            to empower our stakeholders. We will continue to improve and
Our network must evolve to meet the                                         develop our publications, taking into account wider industry work,
challenge as our customers’ requirements                                    which is further shaping network capacity and investment reporting.
                                                                            We will publish our first Network Development Plan in 2022 and will
change to meet their net zero ambitions.                                    look to develop the content of our LTDS following the outcome of
                                                                            Ofgem’s review.

                                                                            Document structure
One of the changes we are seeing as part of the transition to net zero
carbon is the connection of more local embedded generation and              This document comprises three further main sections:
flexibility, which are vital if we are to reduce our emissions. We are      • Section 3 outlines the methodology we use to evaluate future
also accommodating more electric vehicles to decarbonise transport             network capabilities and how we develop plans for our future
and more heat pumps to decarbonise heating in the UK. We have                  network where the need for additional capacity has been identified.
developed a range of scenarios to capture the uncertainty of how
quickly these changes may occur.                                            • Section 4 introduces the individual GSP insights, including an
                                                                               overview of our network and the possibility of intervention latitude.
The Regional Insights document presents the results of our review
of what our 2020 DFES forecasts mean for our whole network, with            • Section 5 provides detailed analysis and a high level commentary
focus on specific areas of the network where potential future issues           for each of our grid supply points and the areas they serve. We also
have been identified.                                                          highlight the potential impact of the various scenarios up to 2050
                                                                               to provide early warning of future network availability and potential
We have carried out detailed analysis in accordance with our normal            constraints.
network evaluation practices and the results are summarised in a
high-level commentary for the networks served by each grid supply
point.
The ability of our existing networks to accommodate predicted
new demand and generator connections is established for all the
scenarios. Where we have identified that there may be inadequate
capacity on our existing network, we have included details to
summarise the requirement and potential action.
These could range from purchasing flexible demand and generation
services to investing in new assets to ensure capacity is available
until 2030 and beyond. Our forecasts for the uptake of low carbon
technologies are an important input to our assessments as these
inform well justified investments for inclusion in our RIIO-ED2
business plan which will be submitted to Ofgem in summer 2021.
This Regional Insights document provides valuable insight for local
stakeholders by presenting our evaluations of the forecast growth
of demand and generation in specific areas of our 132kV, 33kV and
11/6.6kV networks.

                                                                                                                  Regional Insights February 2021      5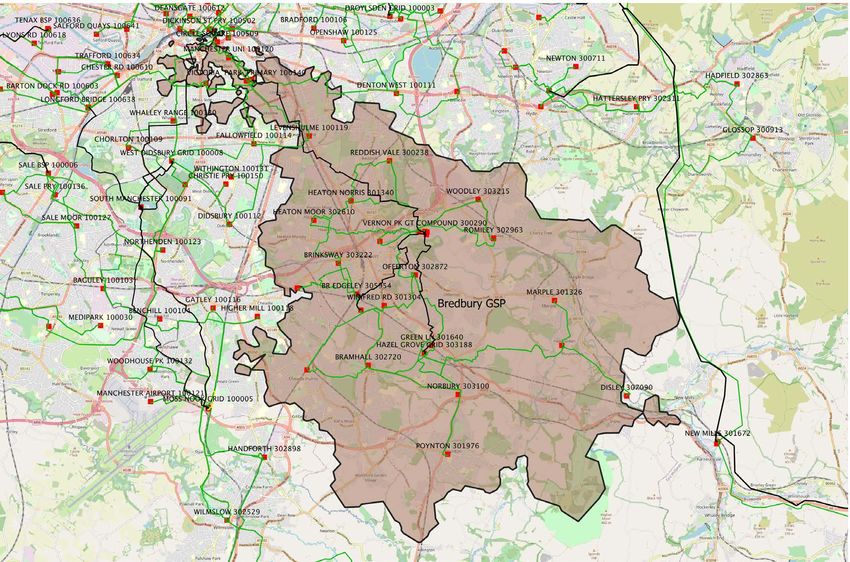
3 Methodology

                                                NETWORK INTERVENTION PATHWAY

     Regional                                                  Identify
                                                                                             Network                    Selection and
      energy                           DFES                    network
                                                                                             options                   implementation
    master plans                                            capacity needs

                                                                        Regional Insights

The way we plan and develop our network has evolved                            OUR DISTRIBUTION FUTURE ELECTRICITY
to meet our customers’ changing needs and in response                                     SCENARIOS 2020
to their increasing ambitions. Distributed generation
                                                                       Steady Progression (SP)
and the uptake of electric vehicles and heat pumps are
                                                                       Slow decarbonisation
expected to increase, but we cannot be sure of the rate                Not meeting net zero targets
of change. This uncertainty is factored into our planning              Limited efficiencies
by considering the impact of the range of forecasts from
our DFES. We use detailed network studies to identify                  System Transformation (ST)
the network needs corresponding to each scenario and                   Hydrogen helps to meet net zero beyond 2040
identify network development options. The optimum plan                 Limited efficiencies
is then selected based on rigorous whole life cost-benefit
analysis before implementation.
We continue to share more information on this process and our          Central Outlook (CO)
results to address the need for greater transparency across our        Average assumptions across the other scenarios
industry. This data helps to empower our stakeholders and support
their net zero carbon ambitions.
                                                                       Consumer Transformation (CT)
                                                                       Electrification of transport and heating help to meet net zero
                                                                       High uptake of renewable distributed generation
We consider alternative credible future                                High efficiencies

pathways in our DFES scenarios to allow                                Leading the Way (LW)
us to understand and address the evolving                              Net zero before 2050
                                                                       Early electrification of transport and heating
needs of our customers.
                                                                      Our Steady Progression, System Transformation, Consumer
                                                                      Transformation and Leading the Way scenarios have been defined
DFES                                                                  using the same high-level assumptions adopted by the rest of the
Forecasts are an essential first step on the journey to identifying   industry to provide a consistent approach for our stakeholders.
network investment. Our 2020 DFES presents five scenarios, each       Central Outlook is an additional scenario that, as in our previous
driven by varying societal change and speed of decarbonisation.       two DFES publications, considers central assumptions relevant
Each scenario describes an alternative roadmap and together they      to our region. Our DFES document explains how our scenarios
define uncertainty in the range of outcomes. Four of the scenarios    are defined and what each of them means in terms of numbers of
meet the UK net zero carbon target whereas the Steady Progression     electric vehicles, heat pumps, distributed generation capacity and the
scenario assumes only small-scale decarbonisation.                    associated demand for electricity.

6    Regional Insights February 2021
3 Methodology

Our scenarios utilise our unique bottom-up modelling methodology          This continuous two-way process with stakeholders allows our
developed as part of our ATLAS project. We create very specific           Regional Insights work to be stakeholder-focused for the period up
forecasts for the small areas corresponding to our distribution           to 2030 and cover a longer range. This is in comparison to our LTDS
substations and combine them, taking into account the diversity           and heatmaps which concentrate on a shorter period, and therefore
between individual components to create the forecasts for the             come with a greater degree of certainty than the network capacity
upstream substations that supply them. These well-informed                needs presented in this Regional Insights document.
forecasts for each of our bulk supply points and primary substations
                                                                          As well as an increase in demand and generation, the uptake of low
provide the detailed assessments which underpin our network
                                                                          carbon technologies will lead to changes in the time of day and time
development plans.
                                                                          of year when customers use electricity, creating more uncertainty in
As explained in our DFES document, our continuous cycle of                our forecasts. To meet these different challenges, we must plan our
engagement with our stakeholders gives us tangible insights into their    network to be agile and flexible, while continuing to be reliable.
requirements which are incorporated into our forecasts to ensure our
                                                                          Our forecasts are being used to help shape development plans for
network investment is targeted at the right areas at the right time.
                                                                          our ED2 submission to Ofgem which includes our reinforcement
Our use of regional energy master plans and stakeholder-informed
                                                                          requirements for 2023-2028. The level of investment requested, and
forecasts help us to identify network limitations to determine a robust
                                                                          finally determined by Ofgem, will allow us to invest in a timely and
and well justified investment plan for tackling likely constraints.
                                                                          efficient manner to meet our customers’ needs and further facilitate
                                                                          the transition to net zero.
                 OUR CYCLE OF ENGAGEMENT

                                                                          Assessment of network capacity
                        Stakeholders share
                            their plans                                   Our Central Outlook scenario aims to provide an average set of
                                                                          assumptions to minimise risk and to ensure that a measured and
                                                                          considered approach is taken to forecast future demand and
                                                                          generation. Initial views of our network’s future capability are gained
                                                                          from investigations based on the Central Outlook scenario, while our
                                                                          understanding of sensitivities is gained from examining all net zero
                                           DNO creates demand
   Stakeholders create                                                    scenarios since our region has demonstrated strong commitment to
                                           forecasts taking into
   well informed plans                                                    this target.
                                           account future plans
                                                                          The capabilities of our network are assessed using bespoke analysis
                                                                          of forecast active and reactive power flows applied to comprehensive
                                                                          models of our 132kV and 33kV networks, including representation
                                                                          of 33kV/HV substations. We also examine true demand forecasts to
                         DNO provides help                                ensure that our network can continue to operate satisfactorily when
                         and advice based                                 local distributed generation is not exporting (when the wind is not
                           on forecasts                                   blowing, or solar PV is not generating).
                                                                          We ensure that all our assessments satisfy industry standards, are
Decarbonisation plans and other planned developments from                 consistent, repeatable and auditable by complying with the rigorous
local authorities and customers are often the anchor in an area           policies that govern our network design. Studies include:
earmarked for revitalisation and can trigger significant associated       • Consideration of equipment capacity reflecting seasonal and cyclic
local redevelopment. We are more confident that plans will materialise       variations
when local government supports revitalisation plans based on
economic and environmental benefits. Such justification means that        • Diversity of existing and new load components
we can reflect these needs in our forecasts and plan with greater         • Planned work including assets being replaced due to health
confidence.                                                                  deterioration
                                                                          • The flexibility to switch networks to transfer load.
                                                                          Study results are reviewed to check that equipment is operating
Our scenarios are tailored specifically to                                within its rating and that network parameters will remain within
the North West by using regional data                                     required limits for safe and stable network operation. We carry out
                                                                          further investigations when deficits are identified. Characteristics
combined with extensive stakeholder                                       of the deviation are defined as a first step towards establishing
                                                                          appropriate interventions, including the extent and duration of flexible
engagement.                                                               service solutions.

                                                                                                                  Regional Insights February 2021   7
3 Methodology

                                                          NETWORK ANALYSIS

        Assess capacity                          Network loading
                                                                                         Contingency analysis
        versus forecasts                       further investigated

                                                                                                                                           Network compliance
    Compare forecasts for                             Detailed                              Security of supply
    each scenario to 2050                         seasonal studies                            assessments

Our analysis looks to the long term to provide foresight of future      Network analysis – generation
needs so that we can plan efficiently. We need to plan proactively
rather than react to issues when they occur because of the time         Our Embedded Capacity Register shows a wide variety of technology
required to construct new assets and arrange commercial solutions.      types and over 2.5GW of generation already connected to our
                                                                        network with a further 1.9GW accepted to connect. We have seen
                                                                        the connection of tens of thousands of generators over the past
                                                                        ten years. This is partly due to several government incentives such
Our detailed analysis allows us to                                      as the feed-in tariff which encouraged the uptake of low carbon
                                                                        technologies by paying for electricity generated and exported back
accommodate many of our customers’ low                                  to the network. More recently, the need for balancing services to
                                                                        support National Grid has resulted in the significant uptake of storage
carbon connections and maximise the use                                 facilities designed to address peak lopping, and generation shortfall
                                                                        or to provide a fast frequency response to maintain system stability.
of our existing network.
                                                                        Although renewable generation helps us to move away from large
                                                                        fossil-fuelled generators, its rapid growth is not without its challenges.
                                                                        We need to carry out comprehensive assessments to assess the
Network analysis – demand                                               growing impact of generation connections.

Our first step to meet the challenge of the expected increase in
demand is to compare the forecasts created for each scenario up
to 2050, with capacity values based on rating values for circuits,      Increased demand from the
primary substations, bulk supply point transformers and substation
equipment. We then explore any potential issues through detailed        decarbonisation of transport and heating
seasonal load flow studies. These studies allow us to check that
power flows are within equipment thermal ratings, voltages are within   will trigger reinforcement in several areas of
statutory limits and that other parameters, such as voltage step
changes, comply with standards. Contingency analysis is undertaken
                                                                        our network, starting in ED2 and continuing
with single and double outages being reviewed in accordance with        beyond 2030.
internal codes of practice and the security of supply Engineering
Recommendation P2.
Although we estimate the capacity of grid supply point substations at
the boundary of the distribution and transmission networks, detailed
assessments are undertaken by the transmission network owner
who considers the whole complexity of the network.

8    Regional Insights February 2021
3 Methodology

                                                      INTERVENTION OPTIONEERING

                        Alternative network interventions

                                                                                                                    Real Options Cost
                                                                                                                    Benefit Analysis

      Additional               Uprated                 Network               Operational
       assets                 equipment             rearrangement            management
                                                                                                                  Investment decision

The increase in generation connected to the network has also
created the relatively new phenomenon of widespread reverse power
flows. This occurs when generation exceeds local demand, for               To increase generation on the network we
example during the night when demand is low. Our studies consider
the terms of generator connection contracts since many are based           are working with National Grid to develop
on being connected only when the network is operating normally,
with generation constrained when operating abnormally.
                                                                           regional development plans to facilitate
Voltage stability and short circuit studies are a key factor in our        further connections in areas already rich in
assessments of our network’s ability to accommodate forecast
generation. Future fault levels are simulated using assumptions for
                                                                           generation.
the different types of generation in our forecasts. The results are then
judged by comparing calculated fault levels with switchgear, cable
and overhead line circuit ratings. Where the increase in generation
causes these levels to be exceeded, an intervention is triggered.          Intervention optioneering
Working with National Grid ESO, we have implemented the Appendix           Options for accommodating additional customer requirements
G process at all grid supply points to give our customers a better         beyond our present extensive capabilities include making better use
indication of the transmission network’s ability to accommodate            of our existing network, improving or extending it.
additional generator connections to our distribution network. The          The traditional approach to increasing network capacity has been to
Appendix G process provides a regularly updated view of the                deploy more equipment. Asset options typically include:
generation headroom available on the transmission network, speeds
up checking for constraints and helps assess the impact of increased       • Installing additional assets
activity on the transmission network.                                      • Replacing transformers and cables with larger types with greater
                                                                              ratings
                                                                           • Transferring circuits from a constrained part of the network to
                                                                              somewhere with sufficient available capacity
                                                                           • Operational management.

                                                                                                                 Regional Insights February 2021   9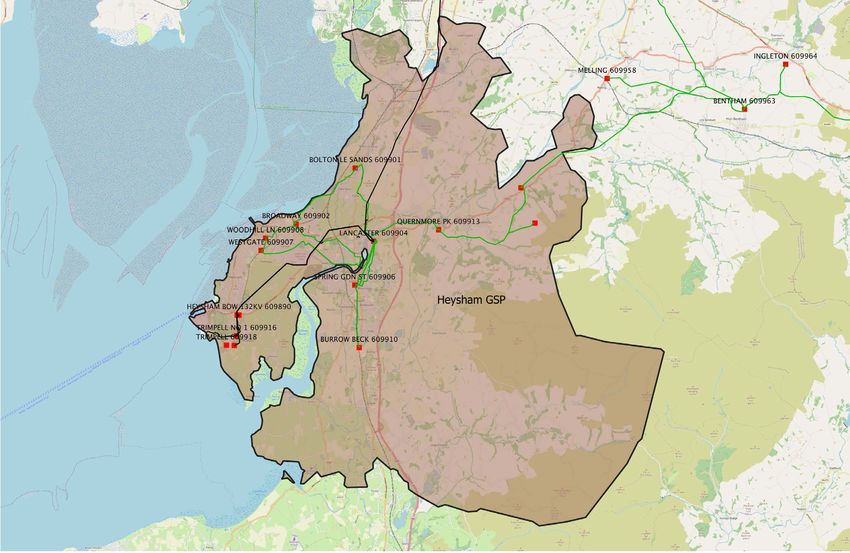
3 Methodology

Network loads are effectively managed by switching which                Investment assessment and decision-making
allows us to reconfigure the network and operate alternative
supply arrangements. We develop this flexibility by considering         Implementation is only planned when there is a well justified
the geographical locations of circuits. Overloads are addressed         requirement.
by interconnecting neighbouring networks, enabling us to share
capacity.
Operational management to reconfigure a network before switching        We compare alternative investment
is a common way of avoiding the potential exceedance of switchgear
short circuit ratings. A transformer may be switched out, or a bus      strategies using economic assessments
section opened, to reduce fault level before a switch is closed.
                                                                        which reflect future uncertainty.
Our innovation work and adoption of technology means that we now
have a variety of solutions which maximise the use of our existing
network to help overcome network constraints. We can now secure
additional capacity and headroom for new connections by using           Our selection of the most appropriate option for efficient network
active solutions that may offer greater value for money. Our new        development is assured by considering all scenarios in our Real
network management system provides localised control which              Options Cost Benefit Analysis (ROCBA) tool which can carry out risk
enables us to increase our use of flexible services and manage          and cost assessments. This sophisticated decision-making process
our network better. Flexible services is the term used for paying a     ensures that we roll-out targeted interventions, without over-investing
customer/provider to reduce their electricity consumption or increase   or installing stranded assets. It also ensures that capacity is available
generation on request, to resolve a network constraint. For example,    for matching national and local policy ambitions for achieving net zero
we may ask service providers to reduce their demand at predictable      carbon.
times of maximum demand, to avoid overloading one of our circuits.
                                                                        The use of ROCBA ensures that the solutions we implement give
                                                                        the best value for money for our customers by considering flexible
                                                                        solutions first and evaluating them against asset options. The output
With the rollout of our new network                                     from ROCBA demonstrates which option is the best over the lifetime
                                                                        of the investment. For example, it may determine that it is more
management system, we will be in a strong                               financially beneficial to:

position to offer a wide range of flexible                              • Purchase flexible services for two years then install a larger asset,
                                                                           or
services during the ED2 period and beyond.                              • Install an asset that is larger than required now, rather than install a
                                                                           smaller asset and replace again it in ten years’ time.
                                                                        When options are developed to solve identified needs, they are
                                                                        often tested against our stakeholders’ requirements. Feedback
                                                                        from regular stakeholder reviews is used to refine our proposals
                                                                        throughout the life of the project.

10   Regional Insights February 2021
4 Regional insight results
Grid supply point insights
EXAMPLE NETWORK
Transmission
Distribution network
network
Grid supply 132kV Bulk supply 33kV Primary 11kV or
point point substations 6.6kV
substations substations typically,
typically, typically, 33/11kV
400/132kV 132/33kV
GRID SUPPLY POINT AND SUPPLY POINT LIST
Grid supply point Voltage Electricity North West network area Page number
Bredbury 132kV South Peak 13
Carrington 132kV Manchester 15
Harker & Hutton 132kV Cumbria 17
Heysham 132kV Cumbria 20
Kearsley & Kearsley Local 132kV Manchester/Lancashire 22 / 25
Macclesfield 275kV South Peak 27
Padiham 132kV Lancashire 29
Penwortham East and West 132kV Lancashire 31 / 33
Rochdale 132kV Lancashire 35
South Manchester 132kV Manchester 37
Stalybridge 132kV Manchester/South Peak 40
Stanah 132kV Lancashire 33
Washway Farm & Kirkby 132kV Lancashire 43
Whitegate 132kV Manchester 45
Bold (bulk supply point)* 33kV Lancashire/Manchester 47
Risley (primary substation)* 11kV Lancashire 50
*Supplied from the SP Manweb network
Regional Insights February 2021 114 Regional insight results
Our network analysis results are presented in groups corresponding It should be kept in mind that although we are quite certain of the
to the 14 grid supply point/groups where our distribution network future need for capacity and the network development options
interfaces with the transmission network. We have also included two presented in Section 5 of this document, there is some latitude on
further areas where supply reaches our network via the SP Manweb when network capacity interventions may be required.
area. Splitting down the network in this way provides understanding
In some areas one single solution may resolve the need for
on a local level. It allows the combined capability to be considered by
interventions at several sites. In other cases numerous issues at a
grouping substations with capacities that may be shared most easily
single site may be resolved by just one intervention at that site.
by creating interconnections or making transfers.
The timing of triggers for investments may vary, depending on the
Results in the following sections are presented for bulk supply points,
rate of change in stakeholder requirements influenced by regional
primary substations and associated networks as illustrated in the
and national policies.
example network on the previous page.
Intervention at a specific site may be required in a different year
The map below shows grid supply points, supply points and our
depending on the rate at which customers’ needs change. A slower
132kV network, which extends from Harker at Carlisle in the north to
uptake of low carbon technologies driven by more relaxed policies
Bredbury in Stockport in the south.
could alter the timing of an intervention, which might be postponed
for several years, or may not be triggered at all if uptakes are low, as
ELECTRICITY NORTH WEST NETWORK predicted in the Steady Progression scenario.
SHOWING GRID SUPPLY POINTS
EXAMPLE OF THE IMPACT OF DIFFERENT
SCENARIOS ON INTERVENTION REQUIREMENT
Harker Intervention 2022 2024 2026 2028 2030
Steady
Progression
System
Transformation *
Central
Outlook *
Consumer
Transformation *
Leading
Hutton
the Way *
The following pages cover asset-based interventions for each
Heysham Electricity North West grid supply point in alphabetical order, at
primary substation and bulk supply point level. These are covered
in detail up to 2030, and then at a high level up to 2050. The
Stanah interventions identified up to 2030 can be considered a worst case
Padiham
view; flexibility options will always be considered and explored as
Penwortham West standard practice, to determine if they can meet the requirement
Penwortham East
before progressing with any asset-based proposal.
Rochdale The graphs provided in the following section show peak demand and
Kearsley & Kearsley Local Whitegate
generation capacity requirements which are based on our detailed
Stalybridge forecasting methodology. As with any forecast there are many
Carrington
Bold
Bredbury
factors which can change over time and influence these figures.
Risley South
Manchester Any intervention decision is made based on the observed network
conditions and the connections pipeline in place at that time, which
Macclesfield could change the forecast figures significantly.
12 Regional Insights February 20215 Grid supply point results
Bredbury GSP
Summary
Bredbury grid supply point
(GSP) is a 275/132kV
substation which supplies
approximately 178,000
customers across the south
Peak and south Manchester
region. The substation
comprises three 240MVA
transformers supplied from
National Grid’s 275kV network.
Peak demand on the GSP is
currently 273MVA, supplied via
four bulk supply points (BSPs)
and 23 primary substations.
Accommodating demand and generation forecasts PRIMARY SUBSTATIONS
to 2030
2
Based on the Central Outlook forecasts up to 2030, the existing
network capacity is sufficient to accommodate demand and Intervention required
generation growth at the majority of sites.
Intervention not required
Only two interventions may be required, both at primary substation 21
level: one driven by generation and the second due to demand
growth in Manchester.
Site name Description 2030 need Asset-based solution
Primary substations
33/11kV substation The existing operational approach for managing
Local 33kV switchboard 11kV make fault levels is less suitable as generation Replace 11kV switchboard or
Woodley
2 x 23MVA transformers connections increase in the area and the network reconfiguration/innovation
11 panel, 11kV switchboard switchgear will need to be enhanced or upgraded
Establish new primary substation
New 33/6.6kV substation to support high load growth
New developments and capacity shortage at Moss
Southern Gateway 2 x 23MVA transformers south of Manchester city centre
Side and Victoria Park primary substations
6.6kV switchboard on the Oxford Road corridor and
Manchester Science Park
Regional Insights February 2021 135 Grid supply point results
Demand and generation forecasts by scenario (2030-2040-2050)
Each scenario forecasts an increase in demand and generation, with the largest increases occurring in the Consumer Transformation and
Leading the Way scenarios. The forecasts show both non-inverter-based and inverter-based generation increasing from 2030-2050, the
exception being the Steady Progression scenario which shows only a small increase.
BREDBURY GSP
700
600
500
400
Generation (MW)
Demand (MVA)
300
200
100
2030
2030
2030
2030
2030
2040
2050
2040
2050
2040
2050
2040
2050
2040
2050
0
50
100
150
System Steady Leading Consumer Central
Transformation Progression the Way Transformation Outlook
Load-based interventions by scenario (2030-2040-2050)
By 2050, the Central Outlook forecast indicates half the BSPs and primary substations will exceed existing capacity with an additional 70MVA of
primary capacity required. Longsight and Vernon Park BSPs and associated primary substations such as Portwood, Heaton Moor, Levenshulme
and Longsight are forecast to exceed existing capacity before 2040, driven by load growth in south east Manchester and Stockport.
The Leading the Way and Consumer Transformation scenarios show the greatest number of interventions required. By 2050, the forecasts for
these scenarios indicate 75% of the BSPs and 70% of the primary substations will be overloaded with an additional 200MVA of primary capacity
required.
We see here, as we do for many other GSPs, that the number of interventions increases dramatically by 2040. indicating that there are tipping
points between 2030 and 2040 for all scenarios. This means that the need for network capacity in the regulatory period commencing in 2028
will need to be carefully considered along with the deliverability of a large volume of network interventions.
24
Total no. of BSP and primary substation interventions
20
16
12
8
4
2030
2030
2030
2030
2030
2040
2050
2040
2050
2040
2050
2040
2050
2040
2050
0
System Steady Leading Consumer Central
Transformation Progression the Way Transformation Outlook
14 Regional Insights February 20215 Grid supply point results
Carrington GSP
Summary
Carrington GSP is a
400/275/132kV substation
shared with SP Manweb. The
substation comprises a total
of five super grid transformers
(SGTs). SGTs 2B, 4 and 7
supply our network and SGTs
1B and 2A operate split,
supplying SP Manweb. The
Electricity North West section
supplies approximately 110,000
customers across the west
and south Manchester region
and comprises two 180MVA
transformers supplied from
National Grid’s 275kV network
and one 240MVA SGT supplied
from the 400kV network. Peak
demand is currently 234MVA,
supplied via four BSPs and 17
primary substations.
Accommodating demand and generation forecasts PRIMARY SUBSTATIONS
to 2030
Based on the Central Outlook forecasts up to 2030, the existing 3
network capacity is sufficient to accommodate demand and Intervention required
generation growth at the majority of sites.
Intervention not required
Intervention may be required to accommodate the forecast demand 14
and generation at three potential sites fed by Carrington GSP: one
primary substation driven by demand and two driven by generation.
Site name Description 2030 need Asset-based solution
Primary substations
33/11kV substation Uprate existing transformers/
Existing firm capacity forecast to be exceeded in
Baguley 2 x 23MVA transformers, switchgear or network
2027
11 panel, 11kV switchboard reconfiguration/innovation
The existing operational approach for managing
33/6.6kV substation
33kV make fault levels is less suitable as generation Replace 33kV switchboard or
Monton 2 x 23MVA transformers, 6 panel
connections increase in the area and the switchgear network reconfiguration/innovation
33kV switchboard
will need to be enhanced or upgraded
The existing operational approach for managing
33/6.6kV substation
Trafford Park 6.6kV make fault levels is less suitable as generation Replace 6.6kV switchboard or
2 x 14MVA transformers, 11 panel
North connections increase in the area and the switchgear network reconfiguration/innovation
6.6kV switchboard
will need to be enhanced or upgraded
Regional Insights February 2021 155 Grid supply point results
Demand and generation forecasts by scenario (2030-2040-2050)
Each scenario forecasts an increase in demand with the largest increases occurring in the Consumer Transformation and Leading the
Way scenarios. The high level of generation in 2030 for all the scenarios is attributed to the large-scale, non-inverter-based generation still
connected to the network. The subsequent decommissioning of this synchronous generation, which is expected to reach end of life by 2050,
results in the forecast reduction in generation.
CARRINGTON GSP
600
500
400
Generation (MW)
Demand (MVA)
300
200
100
2030
2030
2030
2030
2030
2040
2050
2040
2050
2040
2050
2040
2050
2040
2050
0
50
100
150
System Steady Leading Consumer Central
Transformation Progression the Way Transformation Outlook
Load-based interventions by scenario (2030-2040-2050)
By 2050, the Central Outlook forecast indicates that 25% of the BSPs and 47% of the primary substations will exceed existing capacity with
an additional 31MVA of primary capacity required. Sale BSP is the only one expected to exceed its existing firm capacity by 2040. Baguley
primary substation is forecast to exceed its existing capacity first in 2028, followed by Sale Moor and Chassen Road in 2031.
Most of the primary substations supplied from Carrington GSP are forecast to exceed their existing firm capacity within the 2030-2040 period.
This is to be expected as portions of the network are supplying large urban areas close to Manchester.
The Leading the Way and Consumer Transformation scenarios show the greatest number of interventions required. By 2050, the forecasts for
these scenarios indicate that 50% of the BSPs and 71% of the primary substations will be overloaded with an additional 138MVA of primary
capacity required.
16
Total no. of BSP and primary substation interventions
12
8
4
2030
2030
2030
2030
2030
2040
2050
2040
2050
2040
2050
2040
2050
2040
2050
0
System Steady Leading Consumer Central
Transformation Progression the Way Transformation Outlook
16 Regional Insights February 20215 Grid supply point results
Harker and Hutton GSP
Summary
Harker SGTs 1, 2, 3A, 4/Hutton
Group supplies approximately
235,000 customers across
north and south Cumbria. The
supply is taken from Harker
and Hutton GSPs. Harker GSP
takes its supply from National
Grid via a 240MVA 275kV SGT
and four 120MVA 275kV SGTs.
Hutton GSP takes its supply
from National Grid via two
240MVA 400kV SGTs.
Together the GSPs supply
the Cumbria ring consisting
of two 132kV switching
stations, ten BSPs and 93
primary substations. There is
significant generation on the
network including several large
windfarms and CHP sites.
Peak demand is currently
551MVA.
Due to the significant levels of generation in this area there is currently
BULK SUPPLY POINTS PRIMARY SUBSTATIONS
a National Grid scheme in flight to uprate the SGTs at Harker from
120MVA units to 240MVA units. Additionally, the 132kV switchboard 4
is to be replaced as part of this scheme with an indoor GIS solution 2
which is due to be completed in 2026.
Accommodating demand and generation forecasts 8 89
up to 2030
Based on the Central Outlook forecasts up to 2030, existing network Intervention required Intervention not required
capacity is sufficient to accommodate demand and generation
growth at the majority of sites.
Intervention may be required to accommodate forecast demand and
generation at six sites fed by Harker/Hutton GSP: two BSPs and four
primary substations, all of which are driven by generation.
Regional Insights February 2021 175 Grid supply point results
Site name Description 2030 need Asset-based solution
Bulk supply points
The existing operational approach for managing
132/33kV substation
33kV make fault levels is less suitable as generation Replace 33kV switchboard or
Carlisle 2 x 90MVA transformers,
connections increase in the area and the switchgear network reconfiguration/innovation
21 panel, 33kV switchboard
will need to be enhanced or upgraded
The existing operational approach for managing
132/33kV substation
33kV make fault levels is less suitable as generation Replace 33kV switchboard or
Stainburn 2 x 90MVA transformers,
connections increase in the area and the switchgear network reconfiguration/innovation
14 panel, 33kV switchboard
will need to be enhanced or upgraded
Site name Description 2030 need Asset-based solution
Primary substations
The existing operational approach for managing
33/11kV substation
11kV make fault levels is less suitable as generation Replace 11kV switchboard or
Bowaters 3 x 23MVA transformers,
connections increase in the area and the switchgear network reconfiguration/innovation
10 panel, 11kV switchboard
will need to be enhanced or upgraded
The existing operational approach for managing
33/11kV substation
33kV make fault levels is less suitable as generation Replace 33kV switchboard or
Fusehill 2 x 23MVA transformers,
connections increase in the area and the switchgear network reconfiguration/innovation
5 panel, 33kV switchboard
will need to be enhanced or upgraded
The existing operational approach for managing
33/11kV substation
11kV make fault levels is less suitable as generation Replace 11kV switchboard or
HDA No 1 1 x 23MVA transformer,
connections increase in the area and the switchgear network reconfiguration/innovation
8 panel, 11kV switchboard
will need to be enhanced or upgraded
The existing operational approach for managing
33/11kV substation
11kV make fault levels is less suitable as generation Replace 11kV switchboard or
Leyland National 2 x 23MVA transformers,
connections increase in the area and the switchgear network reconfiguration/innovation
9 panel, 11kV switchboard
will need to be enhanced or upgraded
18 Regional Insights February 20215 Grid supply point results
Demand and generation forecasts by scenario (2030-2040-2050)
Each scenario forecasts an increase in demand with the largest increases occurring in the Consumer Transformation and Leading the Way
scenarios. Similarly, the generation forecast for the Leading the Way scenario in 2050 has the largest increase, driven by a large amount of
both non-inverter based and inverter-based generation connecting to the network.
HARKER/HUTTON GSP
1000
800
600
400
Generation (MW)
Demand (MVA)
200
2030
2030
2030
2030
2030
2040
2050
2040
2050
2040
2050
2040
2050
2040
2050
0
200
400
600
800
System Steady Leading Consumer Central
Transformation Progression the Way Transformation Outlook
Load-based interventions by scenario (2030-2040-2050)
The number of load-based interventions up to 2050 is shown below. As time goes by the number of interventions increases. This is to be
expected as demand on the network grows.
By 2050, the Central Outlook forecast indicates that 20% of the BSPs and 44% of the primary substations will exceed existing capacity with
an additional 74MVA of primary capacity required. Carlisle and Kendal BSPs are expected to exceed their existing firm capacity between 2030
and 2040.
The Leading the Way and Consumer Transformation scenarios show the greatest number of interventions required. By 2050, the forecasts for
these scenarios indicate that 30% of the BSPs and 61% of the primary substations will be overloaded with an additional 253MVA of primary
capacity required.
45
Total no. of BSP and primary substation interventions
40
35
30
25
20
15
10
2030
2030
2030
2030
2030
2040
2050
2040
2050
2040
2050
2040
2050
2040
2050
5
0
System Steady Leading Consumer Central
Transformation Progression the Way Transformation Outlook
Regional Insights February 2021 195 Grid supply point results
Heysham GSP
Summary
Accommodating demand and generation forecasts Heysham GSP is a 400/132kV substation which supplies
up to 2030 approximately 50,000 customers across north Lancashire
and south Cumbria. The substation comprises three 240MVA
Based on the Central Outlook forecasts up to 2030, existing network transformers supplied from National Grid’s 400kV network. Peak
capacity is sufficient to accommodate demand and generation demand on the GSP is currently only 113MVA supplied via two
growth. No interventions are envisaged at primary or BSP level. BSPs and nine primary substations. However, there are several
large offshore windfarms connected at Heysham and therefore
export is a greater constraint than import.
The significant levels of renewable energy sources already
connected in this area have matched the available transmission
capacity, meaning that intervention on the transmission network
is necessary to accommodate additional generation on the
distribution network. Working with National Grid ESO we
have developed a regional development plan (RDP) to secure
additional transmission capacity using existing assets, rather
than build an additional SGT. This option aims to connect
generation into the existing active network management
system already in place at Heysham, and then constrain export
from generators in the rare event of the loss of an SGT on the
transmission network.
20 Regional Insights February 20215 Grid supply point results
Demand and generation forecasts by scenario (2030-2040-2050)
Overall each scenario shows an increase in demand with the Consumer Transformation scenario showing the highest increase. Generation is
highest in the Leading the Way scenario but overall there is only a relatively small increase in each of the scenarios.
HEYSHAM GSP
250
200
150
Generation (MW)
Demand (MVA)
100
50
2030
2030
2030
2030
2030
2040
2050
2040
2050
2040
2050
2040
2050
2040
2050
0
20
40
60
System Steady Leading Consumer Central
Transformation Progression the Way Transformation Outlook
Load-based interventions by scenario (2030-2040-2050)
The number of load-based interventions up to 2050 is shown below. The forecasts predict that there is sufficient capacity available at all
primary substations and BSPs in the area up to 2030, with interventions required only in the period 2030-2040.
By 2050, the Central Outlook forecast indicates that half the BSPs and primary substations will exceed existing capacity with an additional
15MVA of primary capacity required. Lancaster BSP is forecast to exceed its existing firm capacity in 2037. From a primary perspective,
Westgate is expected to exceed its existing firm capacity in 2033 followed by Bolton-le-Sands and Woodhill Lane in 2038.
Demand is most concentrated where the network supplies the large urban areas of Lancaster and Morecambe.
The Leading the Way and Consumer Transformation scenarios show the greatest number of interventions required. By 2050, the forecasts for
these scenarios indicate that 50% of the BSPs and 70% of the primary substations will be overloaded with an additional 56MVA of primary
capacity required.
10
Total no. of BSP and primary substation interventions
8
6
4
2
2030
2030
2040
2050
2040
2050
2040
2050
2040
2050
2040
2050
2030
2030
2030
0
System Steady Leading Consumer Central
Transformation Progression the Way Transformation Outlook
Regional Insights February 2021 215 Grid supply point results
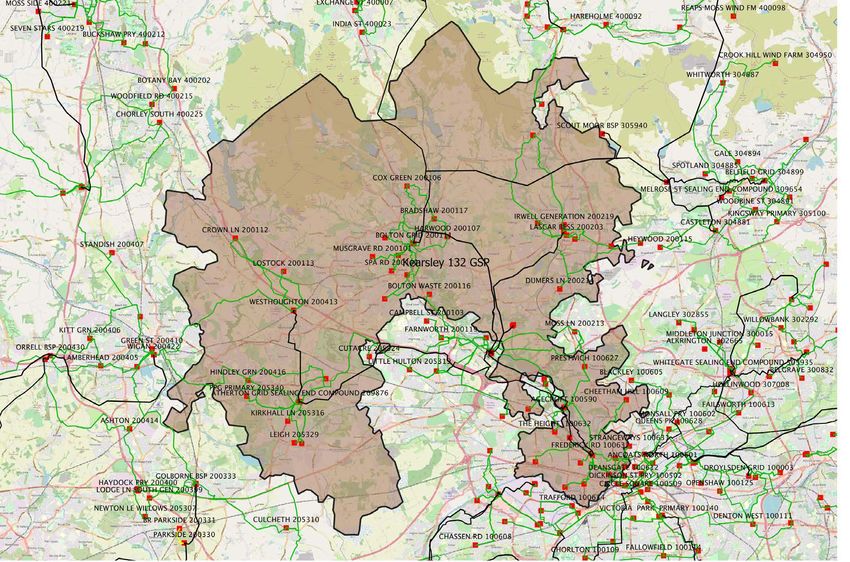
Kearsley GSP
Summary
Kearsley GSP is a 275/132kV
substation which supplies
approximately 322,000
customers across south
Lancashire and north
Manchester. The substation
comprises four 240MVA
transformers supplied from
National Grid’s 275kV network.
Peak demand on the GSP is
currently 490MVA, supplied via
seven BSPs and 35 primary
substations.
Accommodating demand and generation forecasts BULK SUPPLY POINTS PRIMARY SUBSTATIONS
up to 2030
Based on the Central Outlook forecasts up to 2030, existing network 5
capacity is sufficient to accommodate the demand and generation 3
growth at the majority of sites. 4
Intervention may be required to accommodate the forecast demand 30
and generation at eight sites fed by Kearsley GSP: three BSPs, two
of which are driven by generation and one by demand; and five Intervention required Intervention not required
primary substations, four of which are driven by generation and one
by demand.
22 Regional Insights February 20215 Grid supply point results
Site name Description 2030 need Asset-based solution
Bulk supply points
The existing operational approach for managing
132/33kV substation
33kV make fault levels is less suitable as generation Replace 33kV switchboard or
Bolton 2 x 90MVA, 1 x 60MVA transformers,
connections increase in the area and the switchgear network reconfiguration/innovation
23 panel, 33kV switchboard
will need to be enhanced or upgraded
The existing operational approach for managing
132/33kV substation
33kV make fault levels is less suitable as generation Replace 33kV switchboard or
Bury 2 x 90MVA transformers,
connections increase in the area and the switchgear network reconfiguration/innovation
12 panel, 33kV switchboard
will need to be enhanced or upgraded
Replace existing transformers
132/33kV substation Existing firm capacity forecast to be exceeded by
Frederick Road with 90MVA units and uprate
3 x 60MVA transformers 2024 due to large scale demand in Manchester
approximately 9km of overhead line
Site name Description 2030 need Asset-based solution
Primary substations
Overlay existing 33kV supply cable
33/6.6kV substation
Existing firm capacity forecast to be exceeded by between Frederick Road BSP and
Blackfriars 2 x 23MVA transformers,
2024 due to large scale demand in Manchester Blackfriars primary substation
6 panel, 33kV switchboard
which is limiting the capacity
The existing operational approach for managing
33/6.6kV substation
33kV make fault levels is less suitable as generation Replace 33kV switchboard or
Heap Bridge 2 x 14MVA transformers,
connections increase in the area and the switchgear network reconfiguration/innovation
6 panel, 33kV switchboard
will need to be enhanced or upgraded
The existing operational approach for managing
33/6.6kV substation
33kV make fault levels is less suitable as generation Replace 33kV switchboard or
Trinity 3 x 23MVA transformers,
connections increase in the area and the switchgear network reconfiguration/innovation
24 panel, 6.6kV switchboard
will need to be enhanced or upgraded
The existing operational approach for managing
33/11kV substation
11kV make fault levels is less suitable as generation Replace 11kV switchboard or
Westhoughton 2 x 23MVA transformers,
connections increase in the area and the switchgear network reconfiguration/innovation
6 panel, 33kV switchboard
will need to be enhanced or upgraded
The existing operational approach for managing
33/11kV substation
33kV make fault levels is less suitable as generation Replace 33kV switchboard or
Woolfold 2 x 23MVA transformers,
connections increase in the area and the switchgear network reconfiguration/innovation
13 panel, 11kV switchboard
will need to be enhanced or upgraded
Regional Insights February 2021 235 Grid supply point results
Demand and generation forecasts by scenario (2030-2040-2050)
Each scenario forecasts an increase in demand with the largest increases occurring in the Consumer Transformation and Leading the Way
scenarios. Similarly, the generation forecast for the Leading the Way scenario in 2050 has the largest increase, driven by a large amount
of inverter-based generation connecting to the network. The high level of generation in 2030 for all the scenarios, except Leading the Way,
is attributed to the large-scale, non-inverter-based generation still connected to the network. The subsequent de-commissioning of this
generation results in the forecast reduction in generation by 2050.
KEARSLEY GSP
1300
1100
900
Demand (MVA)
700
Generation (MW)
500
300
2030
2030
2030
2030
2030
2040
2050
2040
2050
2040
2050
2040
2050
2040
2050
100
50
100
150
System Steady Leading Consumer Central
Transformation Progression the Way Transformation Outlook
Load-based interventions by scenario (2030-2040-2050)
The number of load-based interventions up to 2050 increases over time as the load grows.
By 2050, the Central Outlook forecast indicates that 71% of the BSPs and 57% of the primary substations will exceed existing capacity with an
additional 76MVA of primary capacity required. The demand on Atherton BSP is expected to exceed existing firm capacity in 2032 followed by
Bolton BSP in 2033. At primary level Atherton Town Centre and Harwood are forecast to exceed existing capacity in 2031.
The Leading the Way and Consumer Transformation scenarios show the greatest number of interventions required. By 2050, the forecasts for
these scenarios indicate that all the BSPs and 83% of primary substations will be overloaded with an additional 350MVA of primary capacity
required, driven by significant demand growth in the Greater Manchester area, from Salford out to Bolton and Atherton.
40
Total no. of BSP and primary substation interventions
35
30
25
20
15
10
2030
2030
2030
2030
2030
5
2040
2050
2040
2050
2040
2050
2040
2050
2040
2050
0
System Steady Leading Consumer Central
Transformation Progression the Way Transformation Outlook
24 Regional Insights February 20215 Grid supply point results
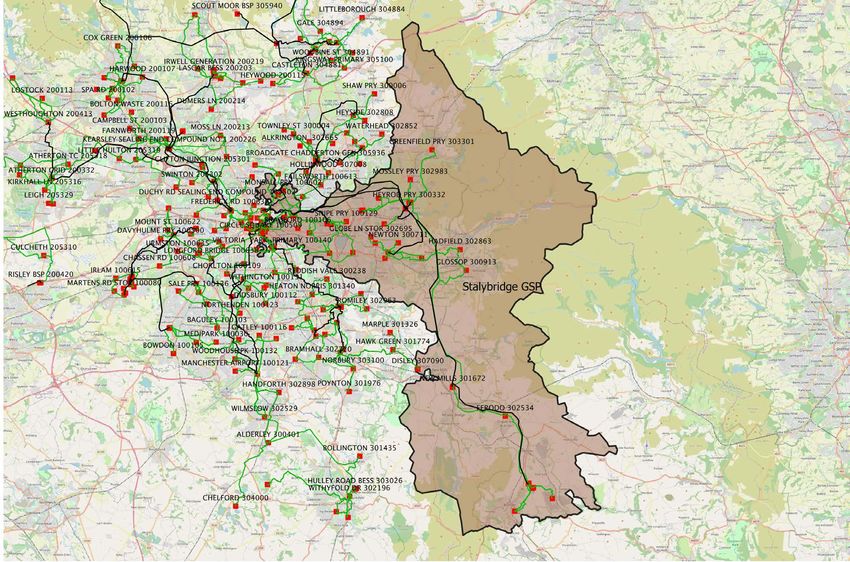
Kearsley Local GSP
Summary
Kearsley Local GSP is a
275/33kV substation which
supplies approximately 50,000
customers across south
Lancashire. The substation
comprises two 120MVA
transformers supplied from
National Grid’s 275kV network.
Peak demand on the GSP is
currently 103MVA, supplied via
11 primary substations.
Accommodating demand and generation forecasts PRIMARY SUBSTATIONS
to 2030
1
Based on the Central Outlook forecasts up to 2030, existing network
capacity is sufficient to accommodate demand and generation Intervention required
growth at the majority of sites.
Intervention not required
10
Only one intervention may be required at primary level, driven by
demand in Little Hulton.
Site name Description 2030 need Asset-based solution
Primary substations
Overlay approximately 5.5km of 33kV
33/11kV substation
Demand forecast to exceed cable between Kearsley Local GSP
Little Hulton 2 x 14MVA transformers,
existing firm capacity in 2027 and Little Hulton primary substation to
11kV switchboard
increase firm capacity
Regional Insights February 2021 255 Grid supply point results
Demand and generation forecasts by scenario (2030-2040-2050)
Each scenario forecasts an increase in demand and generation, with the largest increases occurring in the Consumer Transformation and
Leading the Way scenarios. The forecasts show both non-inverter based and inverter-based generation increasing from 2030-2050.
KEARSLEY LOCAL GSP
300
250
200
Generation (MW)
Demand (MVA)
150
100
50
2030
2030
2030
2030
2030
2040
2050
2040
2050
2040
2050
2040
2050
2040
2050
0
20
40
60
80
System Steady Leading Consumer Central
Transformation Progression the Way Transformation Outlook
Load-based interventions by scenario (2030-2040-2050)
The number of load-based interventions up to 2050 is shown below.
By 2050, the Central Outlook forecast indicates 40% of the primary substations will exceed existing capacity with an additional 25MVA of
primary capacity required. The primary substations forecast to be overloaded will all be exceeded by 2041; these include Carr Street, Hill Top,
Little Hulton and Moss Lane.
The Leading the Way and Consumer Transformation scenarios show the greatest number of interventions required. By 2050, the forecasts for
these scenarios indicate that 80% of the primary substations will be overloaded with an additional 93MVA of primary capacity required.
8
Total no. of BSP and primary substation interventions
7
6
5
4
3
2
2030
2030
2030
2030
1
2030
2040
2050
2040
2050
2040
2050
2040
2050
2040
2050
0
System Steady Leading Consumer Central
Transformation Progression the Way Transformation Outlook
26 Regional Insights February 2021You can also read


