Dublin and Dun Laoghaire Education and Training Board Youth and Sport Development Service Youth Work Plan 2018-2021 - ddletb
←
→
Page content transcription
If your browser does not render page correctly, please read the page content below
Dublin and Dun Laoghaire Education
and Training Board
Youth and Sport Development Service
Youth Work Plan
2018-2021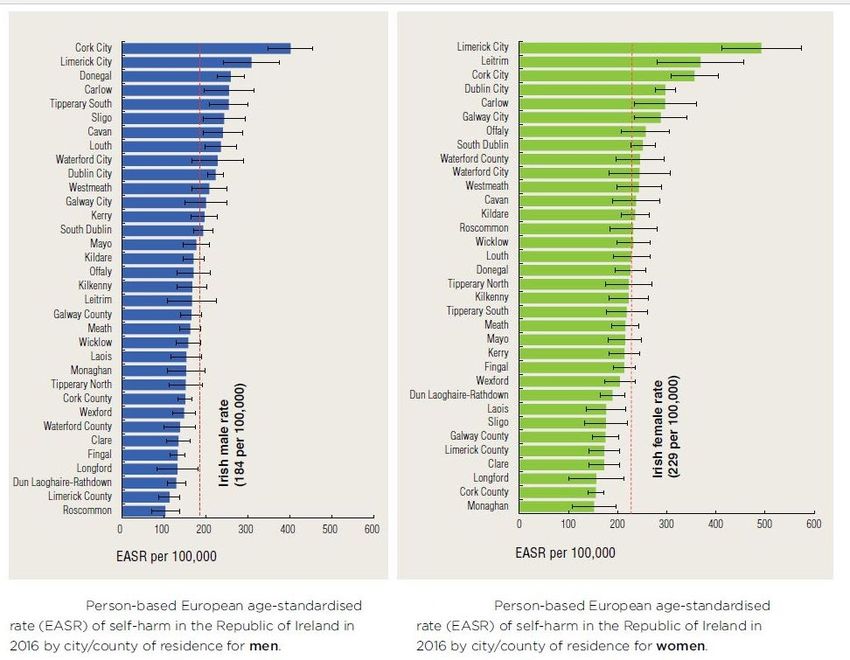
1. Introduction

DDLETB Youth and Sport Development Service

DDLETB Youth and Sport Development Service aims to provide a wide range of supports
that enable the delivery and co-ordination of high quality educational, sporting,
recreational and developmental programmes, projects and services to disadvantaged
young people. This is done in partnership with local communities, voluntary groups and
voluntary youth organisations such as Crosscare, Foróige and YMCA.

DDLETB has recently produced a Statement of Strategy 2017-2021 and our mission is to
provide a wide range of education and training programmes, services and supports to
children, young people and adults across the DDLETB region. We put the young people
and the learner at the heart of everything we do. We believe that lifelong learning is key to
personal development and wellbeing, social inclusion and economic prosperity. Our
operational values in providing our services are

   •   Equality- fairness respect & inclusion to all young people and learners
   •   Collaboration – partnerships with local communities, voluntary groups, Youth
       Organisations
   •   Innovation - responding to identified needs of young people
   •   Professionalism – Highest standard of service provision
   •   Integrity in all aspects of our service delivery

http://www.ddletb.ie/Util/Publications/Education-Plans/DDLETB-Statement-of-Strategy.aspx

DDLETB has a legislative responsibility to support the provision, co-ordination and
administration of youth work services under the Education and Training Board Act 2013.

How do we define Youth Work?

   •   Youth Work is defined as a planned programme of education designed for the
       purpose of aiding and enhancing the personal and social development of young
       persons through their voluntary participation.

   •   Youth work is primarily focused on young people aged 10 to 24 years.

   •   The youth sector provides a wide range of services and programmes involving non-
       formal education and learning, advocacy, mentoring, specialist support, and
       information and advice.

   •   Activities include youth clubs; uniformed organisations/groups; recreational,
       artistic and cultural programmes; youth information centres; street/outreach work;
       issue-based activities; and intercultural and international awareness activities and
       exchanges.

                                                                                -2-|Page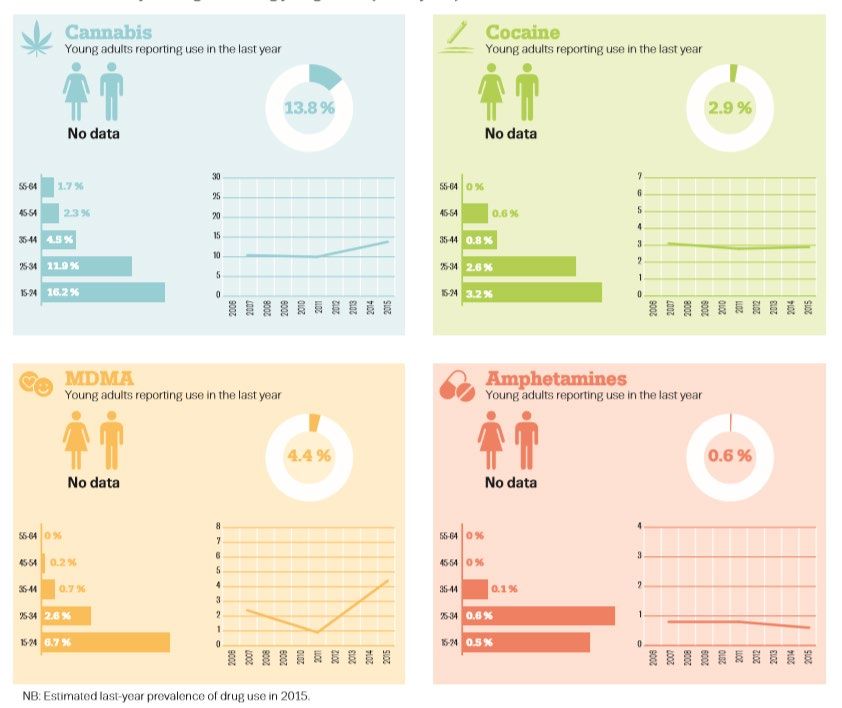
Youth Work achieves a range of outcomes for young people for example communication
skills, confidence and building relationships through activities combining enjoyment
challenge and learning

The National Policy Framework for Children and Young People 2014-2020, Better
Outcomes, Brighter Futures is the first overarching national policy framework for children
and young people, aged 0-24 years, developed and led by the Minister for Children and
Youth Affairs on behalf of the Government.

DDLETB Youth and Sport Development Service embraces the vision as set out in Better
Outcomes Brighter Futures which is:

“Our vision is to make Ireland the best small country in the world in which to grow up and
raise a family, and where the rights of all children and young people are respected,
protected and fulfilled; where their voices are heard and where they are supported to realise
their maximum potential now and in the future.” (DCYA, 2014a, p.22)

The overall aim of the DDLETB Youth Work Plan Consultation was to identify priority
actions for DDLETB Youth Work Provision 2018-2021 and provided an opportunity for us
to identify key themes, areas of work and outcomes for young people.

Consultations were held with local youth services, youth workers and young people for the
purpose of formulating this youth work development plan. Sessions were structured to
facilitate a reflective process for youth workers and youth services and to create an
opportunity for discussion and networking.

                                                                               -3-|Page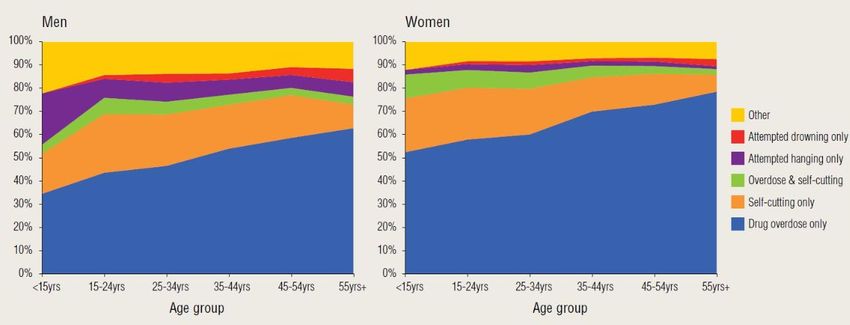
2: Sociodemographic Profile

Figure 1MAP of DDLETB AREA

Dublin & Dun Laoghaire Educational Training Board (DDLETB) was established in 2013
when Dun Laoghaire VEC was amalgamated with County Dublin VEC. This new DDLETB
services a growing diverse population of some 800,000, living in over 270,000 homes in
mountain, rural, suburban and urban communities stretching in the north from the far side
of Balbriggan to the outskirts of Bray in the south stretching some 66 km.

DDLETB area corresponds to the boundaries of three Local Authority Areas, Fingal, South
Dublin and Dun Laoghaire and Rathdown.

The individual local authorities are among the largest in the country and range in
population size from 290,000 in Fingal followed by South County Dublin with a population
over 280,000 and Dun Laoghaire Rathdown with a population of over 210,000.

                                                                            -4-|Page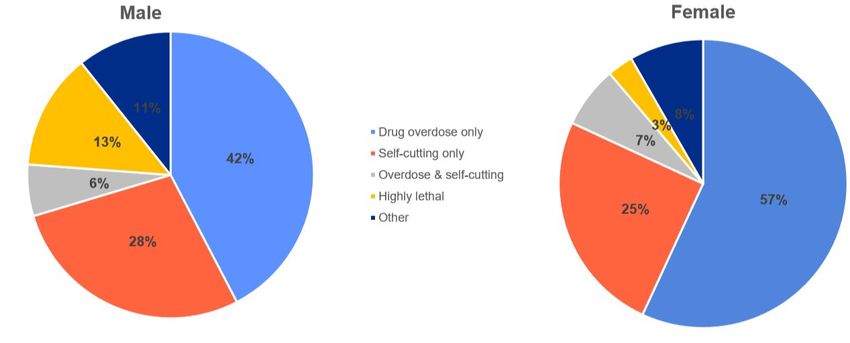
Figure 2 Population change by census 2006-2016 CSO

All three Local Authority areas display significant population growth since the 2006
Census with Fingal experiencing the greatest growth at 23%.

This growth in population in reflected in the age profile of the communities where 35% of
the total population in the DDLETB are under 25 years of age (275,000) and 45% of those
are under 10 years.

Figure 3 Population under 25 years various

       Age %       State          DDLETB             Dún          Fingal   South
                                                     Laoghaire-            Dublin
                                                     Rathdown
              4761865 792805                         218018       296020   278767
      18-24 392502       67691                       22057        22505    23129
      %       8          9                           10           8        8
      10 to 503426       83304                       20240        32456    30608
      17
      %       11         11                          9            11       11
Table 1 Population by number and %

                                                                                -5-|Page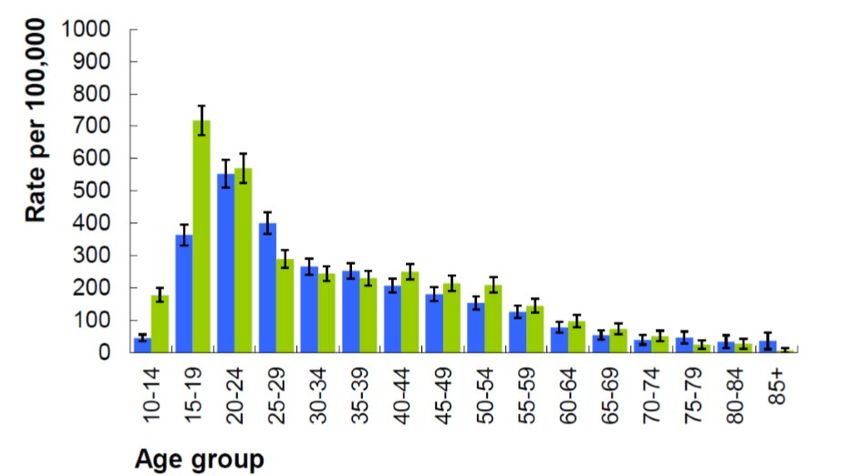
% of National 0 to 24 year olds by Ethnic and Cultural background that live in DDLETB
Whit     Whit     Any         Black      Black    or     Asian      Asian or       Other     Not
e        e        other       or         Black Irish     or         Asian          including stated
Irish    Irish    White       Black      - any other     Asian      Irish   -      mixed
         Trav     backgr      Irish -    Black           Irish -    any other      backgroun
         eller    ound        Africa     backgroun       Chines     Asian          d
                              n          d               e          backgrou
                                                                    nd
15.8     13       20.4        37.5       23.2            30.8       32.3           24.5      19

The Cultural and Ethnic background of the 0-24 years olds in DDLETB is the most diverse
in the country where almost 16% of all 0-24 years in the country live and where you look at
cultural and ethnic background you have 37% of all Black or Black Irish African and 30% of
all Asian or Asian Irish Chinese living in the area.

The chart below shows the distribution of 0-24 year olds in DDLETB by Local Authority
area and there are significant regional variations.

                                                                                          -6-|Page
General Health

Figure 4General Health Total Population CSO 2016

The general health levels in DDLETB area is higher in the overall DDLETB area and also in
each of its sub areas. The healthiest area is Dun Laoghaire Rathdown where 66% of the
population regard their health as” Very Good

Figure 5 General Health by age group CSO 2016

                                                                            -7-|Page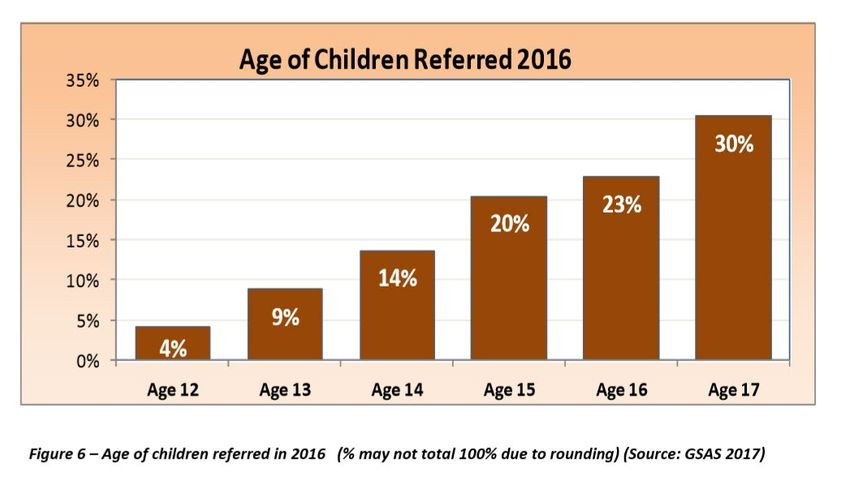
The perception of health by respondents in DDLETB is slightly higher that the national
score and as young people pass through adolescents into adulthood their perception of
the health as very good decreases from 84 to 71 nationally while in DDLETB area from 85
to 75
Disability. The Census 2016 reports that nationally 9% of 10-24 age cohort have a
disability while overall the 10-24 age group make up 19% of the total population.

In numeric terms some 121003 people aged between 10-24 have a disability

                                                                           -8-|Page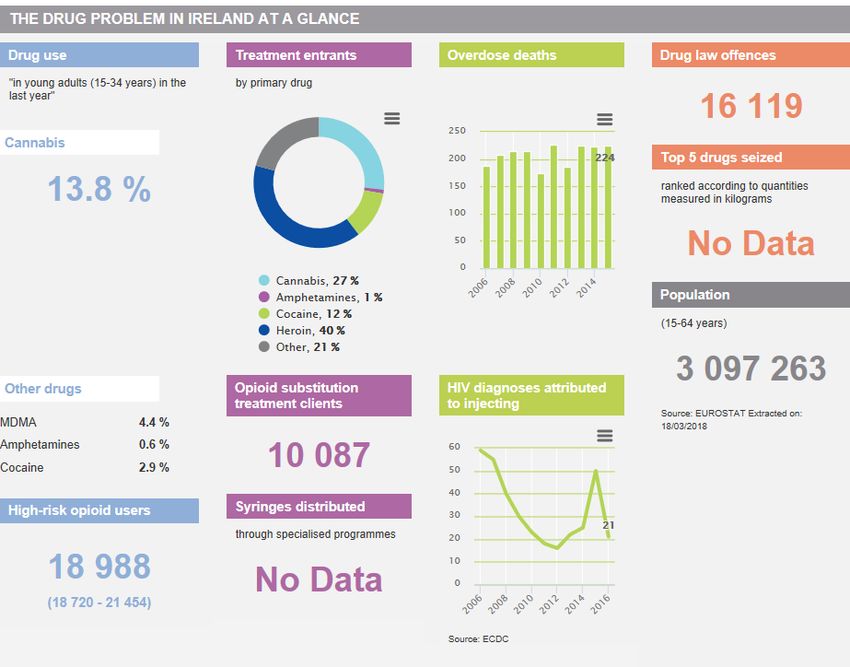
There are almost 18,000 young people in DDLETB area that have a disability that is evenly
distributed across the age groups and by location.

                                                                            -9-|Page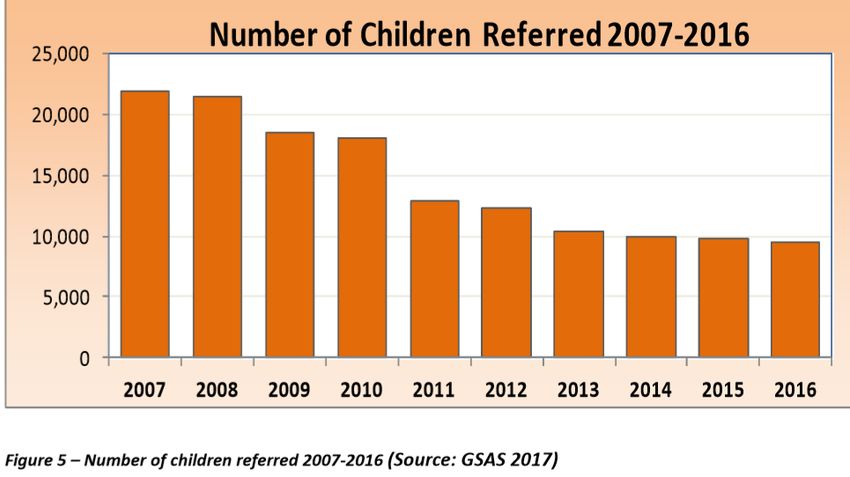
Nature of Disability

The following tables shows that 28% of 10-14year olds (1800) in the DDLETB area and
26% of 15-19 year olds (1580) have “difficulty in participating in other activities” and 25%
of 10-14 and 31% of 15-19 year olds (1885) have a difficulty in attending school which
indicate significant amount of isolation from peers and a social network outside of their
immediate family.

          %                      Difficulty     in   Difficulty       in     Difficulty         in
                                 going     outside   working          or     participating      in
                                 home alone          attending               other activities
                                                     school/college
          10 - 14 years          22                  25                      28
          15- 19 years           19                  31                      26
          20 - 24 years          17                  31                      23

          %             A condition that    An              Difficulty  in     Psychological or
                        substantially       intellectual    learning,          emotional
                        limits one or       disability      remembering        condition
                        more        basic                   or
                        physical                            concentrating
                        activities
          10 - 14 11                        29              59                 21
          15-     11                        26              51                 27
          19yrs
          20 - 24 12                        21              37                 32
          yrs

Suicide and Self Harm

Poverty, depression, social exclusion, isolation and alcohol or drug abuse are among the
most frequent reasons why people take their own lives. Men are four times more likely to
kill themselves than women. And, within the Traveller community, the male suicide rate is
seven times higher than in the general population. These dreadful figures have remained
relatively stable.

In Ireland the rate of suicide have decreased between the census of 2011 and 2016 from
12.1(9554) to 8.5 (399) per 100,000, National Suicide Research Foundation

                                                                                            - 10 - | P a g e
There is a marked difference in suicide figures in Ireland by gender and to a lesser extent
buy age group. Young males between 20—24 years have a suicide rate of 30 per 100,000
compared to females in the same age cohort of 4.5 per 100,000
- 11 - | P a g e2017 Number of suicides Suicide rate3 all persons
Area of residence Total Male Female 2017 2016 2012
STATE 392 312 80 8.2 8.4 11.8
DDLETB 28 19 9
South Dublin 11 7 4 4.9 3.1 5.6
Fingal 11 8 3 3.7 2.7 6.2
Dun Laoghaire 6 4 2 2.1 0.5 7.8
Rathdown
Looking at figures in the EU Ireland suicide Rate of 10 per 100,000 is well below the
average and in line with the Netherlands Germany and Norway but ahead of the UK and
Spain however whey you look at rate for suicide among 15-19 years Ireland moves
significantly up the table .
Suicide rate per 100,000 for males and females aged 15 - 19 years, 2013
The table below outlines the total percentage of suicide that is made up by children and
young people. Males are two and half times more likely to commit suicide in the 15 -24
age bracket and almost five time more likely in the 25- 34 age bracket than females.
Suicide Total Total
Age 5-14 15-24 25-34
Cohorts
Totals 392 1.0 15.3 18.6
Male 0.5 10.7 15.3
Female 0.5 4.6 3.3
Deaths registered classified by cause and age-group, 2017
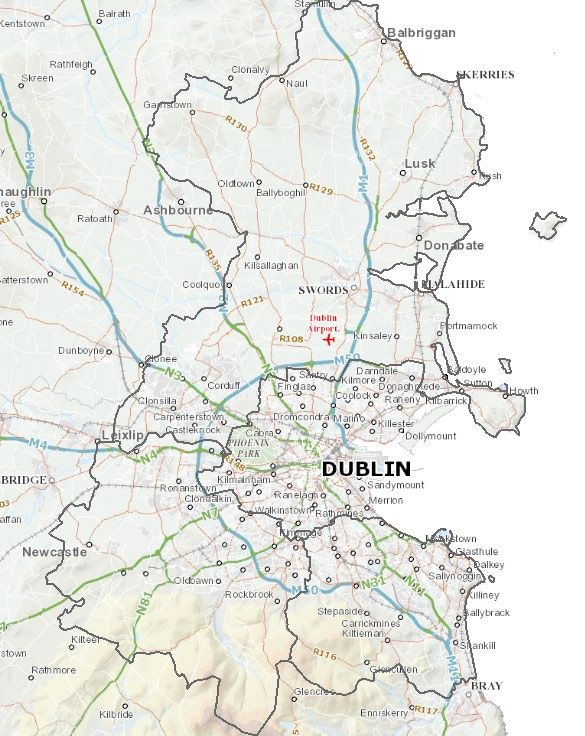
- 12 - | P a g eSelf-Harm
The age-standardised rate of individuals presenting to hospital in the Republic of Ireland
following self-harm in 2016 was 206 per 100,000. There is a clear pattern in the incidence
of self-harm when examined by age and gender. The rate was highest among the young
women. At 763 per 100,000, the peak rate for women is in the 15-19 year-olds age
bracket.
This rate implies that one in every 131 girls in this age group presented to hospital in 2016
as a consequence of self-harm. The peak rate for men was 516 per 100,000 among 20-24
year-olds or one in every 194 men.
Table 2
Self Harm by age and gender 2016 National Suicide Research Foundation
The Local Authority areas of Dun Laoghaire Rathdown and Fingal are below the average for
males while South Dublin is slightly above the average and this mirrors the rates for
females with South Dublin females slightly above the average.
Given the levels of population in the DDLETB area, numerically the DDLETB area indicates
significant levels of self-harm among young people.
- 13 - | P a g eThe use of drugs is by far the preferred method of self-harm at a 40% for young men and
55% for young women in the 15-19 year age cohort increasing by age to 60% for men over
50 years and 75% for women. Self-cutting is the next type self of self-harm with up to
20% of males and over 25% of female using this method of self-harm. Attempted hanging
is almost exclusively a male method and primarily a method used by the younger cohort of
under 24 year old. .
Table 3 Method of Self Harm among 10-17 years old 2015
- 14 - | P a g eThe numbers below are a “crude” indication of potential at risk young people in the
DDLETB area based on national figures.
Self-Harm 10 years to 15 15 years to 19 19years to 24
M F M F M F
National 50 150 375 750 530 600
Total DDLETB 32311 31308 20383 19494 23981 23518
At Risk * 16 47 76 146 127 141
Table 4 Self Harm Statistics National Source National Suicide Research Foundation 2016
*Crude self-harm rates are calculated by dividing the number of persons who engaged in self-harm (n) by the relevant
population figure (p) and multiplying the result by 100,000 it’s very difficult to interpret meaningful differences between
regions or sub-groups when small numbers are involved, or to distinguish ‘real’ changes in rates year on year.
Source National Suicide Research Foundation
Carers
In the CSO Census 2016 there were over 12,000 young people aged between 10 and 24
years who are carers. Young carers are children or young people under the age of 24, who
care or help to care for somebody in their family with an illness, a disability, a mental
health issue or who has an alcohol or other drug problem.
Young carers, care for a parent, a sibling, a grandparent, or even other relatives and their
role includes cleaning and cooking, helping cared for person to get around the house, help
with medicines, keep them safe, shower or dress them .
- 15 - | P a g eFigure 6 Youth Carers based on CSO figures 2016
The hours spent by carers on a weekly basis was calculated in the 2016 Census and have
been adjusted below to enumerate young carers in the DDLETB area below and hours
spent.
Dún Laoghaire- Fingal South DDLETB
Rathdown Dublin
Numbers 503 620 621 1744
Hours 32 37.6 40.7 36.8
Table 5 Number of carers aged between 10-24 years
Half of the carers are aged between 10 and 19 years of age
Lesbian Gay and Bi-Sexual (LBG)
A figure of 10 per cent for the proportion of homosexuals in the general population has
persisted as a widely accepted guesstimate. This number made its way into the public
consciousness on foot of the Kinsey reports based on research carried in the US in the late
1940s and early 1950s, in spite of Kinsey’s methodology being strongly criticised
generally it was also criticised for over-representing the gay and lesbian population.
More recent research suggests a lower %;
• In the UK, a benchmark study by its Office for National Statistics estimated that
just 1.5 per cent of people were gay, lesbian or bisexual.
• In Australia a national sample put the figure at 3 per cent;
• In the US the most widely cited national poll in recent years indicates that
homosexuality rates are 3.5 per cent.
• In Ireland the Irish Times/Ipsos MRBI Family Values poll (2015) asked people to
describe their sexuality, one in 25 – or 4 per cent – of respondents described
themselves as gay, lesbian or bisexual
- 16 - | P a g eLGBT Ireland Report found that two-thirds of non-LGBTI youths have witnessed bullying of
LGBTI students in their schools, and that 48% of LGBTI people have personally
experienced anti-LGBTI bullying in school. 24% of LGBTI students either missed or
skipped school due to negative LGBTI treatment, with approximately 5% quitting school
before completion. The report also highlighted a correlation between LGBTI students who
experience bullying in school and higher levels of depression, anxiety, stress, alcohol use,
self-harm and suicide. The figure for bullying and harassment reported in third level
environments is lower, at 15% of LGBTI students, and approximately 6% consider leaving
college as a result of their experience of bullying and harassment.
Compared to the My World National Youth Mental Health Study (2012), LGBTI young
people in the LGBT Ireland Report (2016) had:
• 2 times the level of self-harm
• 3 times the level of attempted suicide
• 4 times the level of severe/extremely severe stress, anxiety and depression
Drugs and Young People
The Minister for Health has overall responsibility for Ireland’s national drug strategy and is
supported by a Minister of State with responsibility for Health Promotion and the National
Drugs Strategy. The National Oversight Committee includes representatives from the
statutory, community and voluntary sectors and benefits from the expertise of both a
clinical and an academic representative. It is supported by a standing subcommittee
chaired by a senior official at the Department of Health. It supports the implementation of
the strategy, as well as promoting coordination between national, regional and local levels.
The Drugs Policy Unit at the Department of Health is responsible for providing objective
and informed analysis and advice to the National Oversight Committee. At a sub-national
level, local and regional Drug and Alcohol Task Forces are responsible for strategic and
operational coordination in the implementation of the strategy. The Health Research Board
manages statistics and research for the National Oversight Committee.
- 17 - | P a g ePrevalence and trends
The available data suggest that drug use has become more common among the adult
general population aged 15-64 years in Ireland over recent years. Fewer than 2 in 10
adults reported use of any illicit drug during their lifetime in 2002-03, but this figure
increased to approximately 3 in 10 in 2014-15. Similarly, “last year” and “last month”
prevalence of use of any illicit drug has increased since the 2011 survey.
The most recent survey, in 2014-15, confirms that cannabis remains the most commonly
used illicit drug, followed by MDMA/ecstasy and cocaine. Illicit drug use is more common
among males and younger age groups. Among young adults (aged 1534 years), the
prevalence of last year cannabis use was stable between the 2006-07 and 2010‑11
surveys, but it was found to have increased in the most recent study. Reported last year
use of MDMA decreased between 2006-2007 and 2010-11 but increased substantially in
2014-15; however, cocaine use has remained stable. In 2014-15, the reported prevalence
of lifetime use of new psychoactive substance (NPS) among the adult general population
aged 15-64 years was approximately 4 %. In contrast to trends observed for other illicit
substances, data from the 2014-15 study demonstrate that the prevalence of NPS use in
the Irish general population has decreased since the 2010-11 survey. Among young
adults, last year prevalence decreased from 6.7 % in 2010-11 to 1.6 % in 2014-15.
Table 6 Drugs Ireland 2018 EMDDA
- 18 - | P a g eSource European Monitoring Centre for Drugs and Drug Addiction, Ireland, Country Drug
Report 2018
* MDMA is a synthetic drug that acts as a stimulant and hallucinogen e.g. Ecstasy
The chart above is based on the prevalence rates identified in the EMCDDA report
Cannabis is by far the drug type most used by the 1-25 age group/
- 19 - | P a g eDrug Type Use State DDLETB Fingal South Dún
in ETB County Laoghaire-
last Dublin Rathdown
year
Age Group 15- % 576452 97466 33507 34147 29812
24
Cannabis 16.2 93385 15789 5428 5532 4830
Cocaine 3.2 18446 3119 1072 1093 954
MDMA* 6.7 38622 6530 2245 2288 1997
Amphetamines 0.5 2882 487 168 171 149
Table 7 Drug used in the last year
Differences by population groups; when individual population groups were compared to all
other children, Traveller children, immigrant children and children with a disability and/or
chronic illness were more likely to have taken cannabis in their lifetime
Of the 4256 overdose discharges recorded in hospitals in Ireland in 2014, approximately
16 % involved narcotic or hallucinogenic drugs. In the majority of these cases (524),
opiates had been used, followed by cocaine (103 cases) and cannabis (57 cases).
The drug-induced mortality rate among adults (aged 15-64 years) was 71 deaths per
million in 2014 , which is more than three times the most recent European average of 20.3
deaths per million.
- 20 - | P a g eCrime
For the purpose of criminal law in Ireland a child is anyone under 18 years of age. As
children are deemed vulnerable due to their age and level of maturity, the law has provided
special provisions which protect the personal rights of child suspects while they are being
detained in Garda stations.
Previous academic research conducted in the Children Court illustrated the key
characteristics of many young offenders in the Irish criminal justice system. Children
appearing before the Court were predominantly male (90%), lived in specific
disadvantaged areas (81%) and did not live with both parents (71%). The majority of
accused (86%) had no engagement with mainstream education. The presence of minority
communities was significant. Of the young people studied 22.5% were from the Traveller
or ethnic community. The most common offences were public order, petty theft offences
and road traffic offences.
In 2014, the Courts Service reported that court orders were made in respect of 4,877
offences committed by children. This was a reduction of 9% from 2013. The most common
offences were larceny and public order offences with 50% of all offences having been
struck out or taken into consideration.
The Children Act 2001 formally established Ireland’s Juvenile Diversion Programme. The
aim of this programme is to prevent young offenders in Ireland from entering into the full
criminal justice system by offering them a second chance. The intended outcome of the
Programme is to divert young people from committing further offences. Where a young
person comes to the notice of the Garda Síochána because of their criminal activity, they
may be dealt with through the Diversion Programme.
The Diversion Programme facilitates young people who are under 17 years of age but
can be extended to those under 18 years of age. Over the five-year period 2010–2014,
the number of children referred to the Garda Diversion Programme decreased by 44.5%.
- 21 - | P a g eOf the 2016 referral group 73% were aged between 15 and 17 years of age.
The following tables are based on the overall level of offences in 2016 by Garda Station
and the proportion of those offences that were committed by under 18 year olds.
There are 7 types of offences broken down by stations across the DDLETB area illustrating
the first table focuses on the most common offences, the most frequent is burglary of
which there are over 500 offences in Blanchardstown, and Dundrum with Tallaght and
Dun Laoghaire Garda stations having under 400 and just over 400 respectively.
Balbriggan Ronanstown have the lowest levels of burglary in the DDLETB area.
Theft, the second highest form of offence is lead out again by Blanchardstown and
followed by Tallaght and Dundrum. Damage to property is significantly higher in Tallaght
than the second station Blanchardstown 300 to 200 offences.
The Offence type in the right column in the table below goes some way to explain the type
of offences for example 625 of all Weapons and Explosive Offences for under 18 refer to
fireworks and 15% for possession of a firearm.
Offence Type and volume of offences for under 18s
Theft and related offences2
23% shoplifting, 49% stealing a car, 39% stealing a
bike
Burglary and related offences1
21% aggravated burglary
Public order and other social code offences1
39% trespass
Attempts/threats to murder, assaults,
20% minor assault, 21% resisting arrest, 19%
harassments and related offences1
assault causing harm
Dangerous or negligent acts1
46% of these are made up "endangering Traffic
Offences
Robbery, extortion and hijacking offences1
49% robbery from the person
Weapons and Explosives Offences
62% of these are for Fireworks, 17% for possession
of a non-firearm offensive weapon and 15% for
possession of a firearm
- 22 - | P a g eThe second group of offences are assault, drugs and weapons and explosives. Tallaght
and Blanchardstown are the stand out station for assaults and Drug Offences although
relatively small in numbers are focussed in the Tallaght and Ronanstown stations
• Young adults aged 18-24 are disproportionately represented in the prison
population: 29% of prison population compared with 9% of general population;
- 23 - | P a g e• Young adults aged 18-24s have highest rates of reoffending on release from prison
(68% compared with 53%)
Committed to prison 2017
State Dublin Dublin
Total Pop 7484 2490 33%
18 to 24 1714 570 29%
CHILDREN AND YOUNG PEOPLE IN CARE
The number of children in the care of Tusla, the Child and Family Agency increased in
2016 by approximately 9% on the 2015 figures. In 2016, local offices received 47,399
child protection and welfare referrals – an average of 130 a day. This figure equates to
about four for every 100 children under 18 years living in Ireland (Census 2016). More
than one referral can be received in relation to a child and as a result the number of
children involved is likely to be fewer than the number of referrals. The most common
source of referrals in 2016 was An Garda Síochána, accounting for one in four (25%;
11,776)
Figure 7 Source of referrals to Child Protection and Welfare Services 2016 Source Tusla Quarterly data returns
Sixty per cent (28,312) of referrals for 2016 were for welfare concerns, while the
remaining 40% (19,087) were for child protection concerns, where there were grounds to
believe that there was a risk of physical, sexual or emotional abuse or neglect.
The most common type of abuse reported is emotional abuse accounting for more than
one in three (36%; 6,871) child protection referrals in 2016. This was followed neglect
accounting for one in four (25%; 4,724) referrals and physical abuse accounting for just
under one in four (23%; 4,450) referrals. Sexual abuse was the least common type of
abuse reported, comprising 16% (3,042) of referrals.
- 24 - | P a g eThe number of referrals varies widely across the 17 areas and ranged from 5,908 in the
Cork area to 771 in the Sligo/Leitrim/West Cavan area. The rate of referrals per 1,000
population under 18 years ranged from 68 per 1,000 population in the Midlands area to 22
per 1,000 population in the Donegal area.
Table 8 Number and rate of referrals by area 2016
) Dublin Dublin Dublin Dublin Dublin Dublin National Dublin
Total South South South City North Total as a %
Central East West North Of
Wicklow Kildare National
West
Wicklow
Physical Abuse 1,652 276 158 282 237 699 4,942 33
Emotional Abuse 2,030 509 214 75 167 1,065 7,615 27
Sexual Abuse 720 122 81 134 102 281 3,170 23
Neglect 1,691 549 140 153 259 590 4,810 35
Total 6,093 1,456 593 644 765 2,635 20,537 30
Tusla Performance and Activity Data 2017: Referrals and Assessments : Child Protection(Abuse
- 25 - | P a g eThe Tusla administrative boundaries do not correspond with the administrative boundaries
of the Local Authorities or ETBs however it can be asserted that;
• Dublin North does coincide with Fingal however it also includes high population
areas of Darndale, Raheny Donaghmede, Kilmore and Coolock.
• Dublin South East Wicklow corresponds with Dun Laoghaire Rathdown.
• Dublin South Central includes Clondalkin, Ronanstown and part of Tallaght
• Dublin South West includes Kilmananagh, Jobstown, Oldbawn and Firhouse
Age Group Number %
0-4 years incl. unborn 430 34%
babies
5 – 9 years 376 30%
10 to 14Years 331 26%
15-17 135 11%
Total 1,272 100%
Children listed as active by age, Dec 2016
• 33% of Active cases are young people between 10 -17 years
• 59% of children in care are aged between 10 - 17 year
• At the end of December 2016, there were 1,880 young adults (all ages 18 years
upwards) in receipt of aftercare services; 45 (2%) more than 2015 (n=1,835).
• In terms of the 18-22 years old cohort in receipt of aftercare services (n=1,806)
27% (n=485) moved to living independently while 46% (46%; 837), almost one in
two, remained living with their carers, implying that they continue to experience
caring relationships and stable living arrangements
• There are between 4000 and 5000 referrals and assessments to Tusla in the
DDLETB area and of these it is reasonable to guesstimate that 1700 of these
children and young people are aged between 10 and 17 years.
- 26 - | P a g eDefinitionofAbuse
Neglect occurs when a child does not receive adequate care or
supervision to the extent that the child is harmed physically or
developmentally. It is generally defined in terms of an omission of care,
where a child’s health, development or welfare is impaired by being
deprived of food, clothing, warmth, hygiene, medical care, intellectual
stimulation or supervision and safety. Neglect is associated with poverty
but not necessarily caused by it. It is strongly linked to parental substance
misuse, domestic violence, and parental mental illness and disability.
Emotional abuse is the systematic emotional or psychological ill-
treatment of a child as part of the overall relationship between a caregiver
and a child. Once-off and occasional difficulties between a parent/carer
and child are not considered emotional abuse. Abuse occurs when a
child’s basic need for attention, affection, approval, consistency and
security are not met, due to incapacity or indifference from their parent or
caregiver.
Physical abuse is when someone deliberately hurts a child physically or
puts them at risk of being physically hurt. It may occur as a single incident
or as a pattern of incidents. A reasonable concern exists where the child’s
health and/ or development is, may be, or has been damaged as a result
of suspected physical abuse.
Sexual abuse occurs when a child is used by another person for his or
her gratification or arousal, or for that of others. It includes the child being
involved in sexual acts (masturbation, fondling, oral or penetrative sex) or
exposing the child to sexual activity directly or through pornography.
Tusla
Social Welfare
The social welfare system in Ireland is divided into three main types of
payments. These are:
• Social insurance payments; these payments are based on employment
contributions.
• Means-tested payments; are designed for recipients who don’t have
enough social insurance contributions.
• Universal payments; are paid regardless of social insurance contributions
and are not means tested.
- 27 - | P a g eThe following tables show the extent of the entitlement to some of the family
support welfare payments made nationally and within the DDLETB area.
Social Welfare State DDLETB %
Child Benefit 624670 93877 15
CB Children 1197866 184603 15
Back to School 151579 21771 14
FIS 57745 7565 13
Source Annual Social Welfare Services Statistical Report 2017
Child Benefit is a universal payment payable to the parents or guardians of children
under 16 years of age or up to 18 years of age if they are in full-time education, full-
time training or have a disability and cannot support themselves.
The Back to Education Allowance (BETA) can support people getting a social welfare
payment to access second-level and third-level education and limited post-graduate
courses. The Back to Education Allowance is paid for the duration of course and you
must be over 21 and in receipt of Social Welfare payment.
Family Income Supplement (FIS) now known as the Working Family Payment (WFP) is a
weekly tax-free payment available to employees on low pay with dependent children.
13% of the National Family Incomes Supplement is expended in the DDLETB area.
Back to Female Male Total Dublin DDELTB
education
Under 24 1119 1302 2421 581 372
Total 4963 5953 10916 2620
%Under 24 23 22 22 24
Source Annual Social Welfare Services Statistical Report 2017
The table above shows that there were 93877 recipients of Child Benefit payments in
DDLTB during 2017 for 184603 children. A total of 7565 families in the DDLETB area earn
so little in full time employment that receive Family Income Supplement (FIS) in 2017
approximately 13% of the national number of recipients There were 21771 recipients of
the Back to School Clothing and Footwear Allowance which is an indicator of Low Income
Households. Households are eligible for this payment if they are already in receipt of
another Social Welfare benefit payment or taking part in a Labour Market Activation
Programme/Adult Education.
The Community Employment (CE) programme is designed to help people who are long-
term unemployed (or otherwise disadvantaged) to get back to work by offering part-
time and temporary placements in jobs based within local communities. To receive CE a
person must be over 21 years of age and in receipt of social welfare allowance for over
12 months.
- 28 - | P a g eCommunity Female Male Total Dublin DDLETB
Employment
Under 24 576 442 1018 216 138
Total 9200 12632 21832 4623 2959
% Under 24 6 3 5 21 14
Source Annual Social Welfare Services Statistical Report 2017
Poverty
The first national anti-poverty strategy was introduced in the late 199’s in Ireland and
recognised that economic growth alone will not address the structural issues that
underpin and perpetuate poverty in Ireland. A number of indicators to measure the nature
and extent of poverty and at risk groups across all aspects of society were generated in
Ireland drawing on similar indicators across the EU.
In the early 1990s, 34 % of the population lived below the poverty line. The next worst
performer was Spain at 21 %, followed by the Netherlands. In 2016, the rate of relative
income poverty was 16.5 % in Ireland. In numeric terms the number of people living in
poverty decreased from 1.4 m (total pop 3.7m) to the current figure of 800,000 (total pop
4.7m) people living in poverty.
The Survey on Income and Living Conditions (SILC) in Ireland is a household survey that
addresses poverty covering a broad range of issues. It is the official source of data on
household and individual income and provides a number of key national poverty
indicators, such as the “at risk of poverty” rate, the “consistent poverty” rate and rates of
enforced deprivation.
Deprivation Rate
Households that are excluded and marginalised from consuming goods and services which
are considered the norm for other people in society, due to an inability to afford them, are
considered to be deprived. The identification of the marginalised or deprived is currently
achieved on the basis of a set of eleven basic deprivation indicators;
1. Two pairs of strong shoes
2. A warm waterproof overcoat
3. Buy new not second hand clothes
4. Eat meat, chicken, fish or a vegetarian equivalent every second day
5. Have a roast joint or its equivalent once a week
6. Had to go without heating during the last year through lack of money
7. Keep the home adequately warm
8. Buy presents for family or friends at least once a year
9. Replace any worn out furniture
10. Have family or friends for a drink or meal once a month
11. Have a morning, afternoon or evening out in the last fortnight for
entertainment.
- 29 - | P a g e“At Risk of Poverty” is population with an equivalent income below a given percentage
(usually 60%) of the national median income.
In 2016, the ‘at risk of poverty’ rate was 16.5% compared to 16.9% in 2015.
The analysis by socio-demographic characteristics showed that those most at risk of
poverty in 2016 were those living in households where there was no person at work
(42.1%) and those individuals who were unemployed (41.9%). The ‘at risk of poverty’ rate
for households with one adult and one or more children aged under 18 was 40.2%
An individual is defined as being in ‘consistent poverty’ if they are Identified as being at
risk of poverty and Living in a household deprived of two or more of the eleven basic
deprivation items listed above
In 2014, 11.2% of children experienced consistent poverty. The consistent poverty rate in
2016 was 8.3%
Further analysis of consistent poverty rates by household composition shows that
individuals living in households where there was one adult and one or more children aged
under 18 had the highest consistent poverty rate at 24.6%. The consistent poverty rate
was lowest for individuals living in households where there were two adults, at least one of
whom was aged 65 or over and where there were no children (1.7%).
Deprivation Index
The following charts are based on the Deprivation Score for the DDLETB .The Deprivation
Score index provides a method of measuring the relative affluence or disadvantage of a
particular geographical areas using data compiled from various censuses.
The score is given to the area based on a national average of zero and ranging from most
disadvantaged (--40) to most affluent (+40).
The particular measures that make up the overall score include the following categories:
Population Change
Age Dependency Ratio
Single Parent Ratio
Primary Education Only
Third Level Education
Unemployment Rate (male and female)
Proportion living in Local Authority Rented Housing
- 30 - | P a g eFigure 8 Deprivation Index score by Local Authority
The Deprivation Index Score for the three Local Authorities tells a mixed story. South
County has experienced a moderate decline on its zero score, Fingal also displays a
deteriorating score albeit in the positive realm of 5-6 score. Dun Laoghaire/Rathdown is
the only area that has shown an improvement in the last decade although it has
experienced a downturn of one point between 2011 and 2016.
This deprivation spread in the DDLETB service area is most graphically demonstrated in
the graph below display the EDs with the Highest and Lowest scores aligned showing a
difference some 36% .
Figure 9 DS score range in DDLETB area
Looking at a range of 36%
Total Negative Positive
EDs DS DS
ED DDLETB 160 37 123
Dun 68 6 62
Laoghaire
Fingal 39 7 32
Dublin 53 24 29
South
Table 9 DDLETB Deprivation by ED
- 31 - | P a g eSlightly over 21% of all EDs in the DDLETB service area have a negative Deprivation Score
covering a population of 192,00 or 24% of the National population .
Total Eds Negative Population
DS
Ed DDLETB 160 21% 192,079
Dun 68 9% 17,408
Laoghaire
Fingal 39 18% 49,445
Dublin 53 45% 125,226
South
Small Areas are designed as the lowest level of geography for the compilation of statistics
in line with data protection guidelines and typically contain between 50 and 200 dwellings.
EDs Electoral Divisions are the smallest legally defined administrative areas in the state.
Small Areas Population statistics (SAPs) SAP
Total Negative Positive
SAP DS DS
SAP 2604 710 1894
DDLETB
Dun 747 84 663
Laoghaire
Fingal 934 202 732
Dublin 926 424 502
South
Table 10 DDLETB Deprivation by SAP
Total Negative Population
SAP DS
SAP 2604 27% 213,130
DDLETB
Dun 747 11% 25,162
Laoghaire
Fingal 934 22% 62,090
Dublin 926 46% 125,878
South
- 32 - | P a g eAbout 30% of poor households in Dun Laoghaire Rathdown are hidden in the ED data it is
only when the ED data is opened into SAP data sets that an additional 8350 people are
found to be living in areas below the national average. Similarly for Fingal almost 12,000
additional persons are shown to live in areas below the national average where as in Dublin
South the number of household in below average areas is so extensive that the Eds data
and the SAPs data are aligned.
There are an additional 140 SAPS in the DETB area that are on or slightly above the Zero
score which bring the number of negative or slightly above zero to 33% of all SAP in the
DLETB Service area.
The following graphs look at some of the individual elements that make up the overall
Deprivation Scores, Lone Parent Households, School Retention, Unemployment Levels and
Housing Tenure.
Lone Parent Households
Figure 10 % of Lone Parent Households by Local Authority 2016 CSO
Lone Parent households represent one of the most exposed groups to persistent poverty
in Ireland, 1 in 4 families in South County Dublin is a Lone Parent Household and in Fingal
it is almost 1in 5 whereas Dun Laoaghire/Rathdown has the lowest rate of 1 in 6/7 families
is a lone parent household.
- 33 - | P a g eUnemployment
Figure 11 Unemployment Level by LA by Gender by Census year
The unemployment figures above are broken down by gender and it is clear that the level
of unemployment in Dun Laoghaire and Rathdown is below the national average for Males
and Females (National figure was 9.1% for Males and 7.9% June 2016 COS) and higher in
both Fingal and South Dublin.
Housing Tenure
Figure 12 % by Local Authority Area by Tenure Type
- 34 - | P a g eSlightly over a third of houses 36.5% in the DDLETB area are owned outright and a further
31% are owned with a mortgage and 25% are rented. 18% of rented houses are provided
by the private landlords and the supply of social houses that used to provide the majority
of rented accommodation has continued to decrease its’ share of the sector with private
rented increasing.
These figures reflect the national trend in housing tenure, moving from a country with one
of the highest levels home ownership levels in Europe to one reflecting the European norm
of a mixed type of tenure.
Nationally number of owner occupied households fell between 2011 and 2016 from 69.7%
to 67.6%, a rate last seen in 1971. The rate in rural areas fell from 84% in 2011 to 82% in
2016 while the percentage of urban homes owned (outright or with a loan) has fallen from
61.6% to 59.2% in 2016.
The age of renters nationally has increased, in 2016 it was 35 years after that they tend to
become house owners it was, 32 years in 2011, 28 years in 2006, 27 years 2002 and 26
years in 1991.
The growth is the number of households dependent on the private rented sector for
housing is to a large extent missed in the Deprivation Score (it only takes account of
households living in Local Authority Housing), since few LA social housing units have been
built in the last 15 years there are significant numbers of families living in private renter
sector housing and the ever increasing levels of rent far out stripping wages is leaving
families and children in an ever increasing risk of poverty. These pockets of poverty are
not measured and are located in all the LA areas but most prevalent in Fingal.
Educational attainment/Profile
There are over 100 second level schools servicing the three Local Authority areas in the
DDLETB
Local Authority Secondary Vocational Community Comprehensive Grand
Total
Dun Laoghaire 26 4 1 31
Rathdown
DLR Pupils 12,329 1,512 848 14,689
Fingal County Council 14 12 6 32
FCC Pupils 7,392 8,556 5,610 21,558
South Dublin CC 15 15 8 38
SDCC Pupils 8,740 7,062 5,814 21,616
DDLETB Area 55 27 18 1 101
DDLETB Total 28,461 15,618 12,936 848 57,863
Table 11 School Type and No: of Pupils by Local Authority Area CSO DES Data
- 35 - | P a g eFigure 13Number of Second Levels Students by Local Authority
Fingal and South County each have over 21000 second levels students and Dun Laoghaire
is 25% smaller with 15000 second level students.
All three areas have experienced improved progression to third level over the last 10 years
with Dun Laoghaire and Rathdown enjoying the highest progression rate of about 58%.
South County has also improved however they lag substantially behind the National
Average at a progression rate of 36%
Secondary Vocational Community Comprehensive Grand
Total
National Schools Total 374 241 82 14 711
National Pupils Total 194879 97741 51831 7806 352257
DDLETB % of National 14.6 16.0 25.0 10.9 16.4
Total Pupils
DDLETB % of National 14.7 11.2 22.0 7.1 14.2
Schools
Source CSO DES Data Schools and Students
One in six pupils in Ireland live in the DDLETB region.
Secondary Vocational Schools Community & Total
Comprehensive
Totals 28,461 15,618 13,786 57,865
LC Retention 92.7 88.33 90.57 91.21
Table 12 Leaving Certificate Retention by school type, Local Authority and %LC Retention 2017
DDLETB in the 2017 Leaving Certificate had retention level of 91.2% compared to the
National retention rate of 90.2%82.
- 36 - | P a g eFigure 14 5 Retention by Local Authority Area Source CSO DES
Figure 15 Proportion of population with 3rd Level Education by Local Authority Area
This progression from second level to third level is reflected in the increasing number of
the population with third level qualifications, among the three local authority area Dun
Laoghaire Rathdown out performs the other two areas significantly but none the less
Fingal and South Dublin show an increase between 2006 and 2016.
Secondary Vocational Community and Total
DDLETB 26383 13795 12486 52665
ESLs 2,078 1,823 1,300 5,200
ESL % 8 13 10 10
Table 13 School type, local authority and ESLs
- 37 - | P a g eFinally, an analysis of the nationality make-up of the school children in the DDLETB area.
Nationality Group 2015/2016 %
Irish 124,834 85.4
British 1,204 0.8
Another State in the EU 15 1,935 1.3
Another State in the EU 13* 7,714 5.3
Another State in Europe other than the EU 1,027 0.7
USA or Canada 734 0.5
Latin or Southern America 234 0.2
Asia 4,028 2.8
Africa 3,711 2.5
Australasia or Oceania 191 0.1
Unknown 639 0.4
Total DDLETB 146,251 100.0
Table 14 Retention levels by Local Authority Area DES/CSO
Immigrant population internationally tend to settle in cities where there is employment and
Ireland is no different with over 30% of people with a Black or Asian background living in
the DDLETB area as against 15% of the white Irish.
Figure 16 National Population by Ethnic background by Local Authority Area
- 38 - | P a g eDun Laoghaire is the least ethnically diverse areas among the three local Authorities.
Irish Travellers Living in Private Households
2011 to 2016 (Number) and % Change
Irish Travellers 2011 2016 %
State 28498 30058 5.47
DDELTB 3501 3459 -1.20
Dún Laoghaire-Rathdown 383 394 2.87
Fingal 1325 1288 -2.79
South Dublin 2176 2171 -0.23
Table 15 Irish Travellers living in Private households 2011-2016 (number) and % change CSO 2016
Key findings from Socio Demographic Profile
• DDLETB reported a slightly higher percentage (of the overall population) of
Children and Young People aged 0-24 years (34.6%) compared to the State (33.2%)
in 2016.
• DDLETB has the greatest number of children and young people within it’s boundary
with some 274,206 or just under 34% of the national 0-24 years olds.
• DDLETB reported a slightly higher proportion of young people (of the overall
population) aged 18 - 24 years (9%) compared to the State (8%) in 2016.
• The percentage of children and young people who are not “white Irish” by ethnicity
or cultural background is higher for DDLETB (25.3%) compared to the State (18.3%)
in 2016.
• The Irish Traveller population has decreased in the DDLETB by 1.2% while it has
increased nationally by 5.5% between 2011 and 2016
• 7.8% of all travellers under 24 years live in the DDLETB area
• 17% of DDLETB population is made of non-Irish nationals.
• 37% of all Black or Black Irish 0-24 year olds live in the DDLETB area
• 31% of all Asian or Irish Chinese 0-24year olds live in the DDLETB area.
• DDLETB reported a higher level of Very Good health among 19- 24 years olds at
75% compared to the national average of 71%
- 39 - | P a g e• 12% of all suicides in 2017 took place in the greater Dublin area and 60% of those
occurred in the DDLETB area.
• Dun Laoghaire Rathdown has the lowest suicide rate per local authority in Ireland
at 2.1 per 100,000
• DDLETB has a slightly lower level of disability among its 10-24 years olds at 12%
as opposed to the 13.5% nationally
• DDLETB reported a higher percentage of children living in a lone-parent household
(27%) compared to the State (18.3%) in 2016.
• 28% of lone parent families in the State reside in the DDLETB area
• DDLETB reported the highest number of Young Carers (10-24years) in the
country at 1744
• One in six pupils in Ireland live in the DDLETB region.
• The average percentage of primary school children absent from school for 20 days
or more in the school year 2015/16 was higher in Dublin (16.5) compared to the
State (12.3).
• The average percentage of post-primary school children absent from school for 20
days or more in the school year 2015/16 was higher in Dublin (15.6) compared to
the State (14.9).
• The DDLETB in the 2016/17 Leaving Certificate had retention level of 91.2%
compared to the National retention rate of 90.2%.
• DDLETB Area reported slightly higher percentages of families with children by size
of family with 4 children (24%) and 5 or more children (11%) compared to the State
(22% and 11%).
• Tusla 27 % of national referrals (Child Protection and Child Welfare concern)
received in 2017 came from Dublin
• In 2016, DDLETB reported a slightly higher rate of Absolute Deprivation (-4.12)
compared to the State (-3.6) according to the Pobal HP Deprivation Index. (Fingal
+1, Dun Laoghaire& Rathdown +6, South Dublin -4)
The full social demographic profile is included in Appendix 1 of this document
- 40 - | P a g e- 41 - | P a g e
3: Existing youth work provision

Projects used in Youth Development Plan
Project Project Title                                  Organisation Name                     Promoter    Promoter type   Funding
ID                                                                                                                       Line
BLA01    EARLY SCHOOL LEAVERS PROGRAMME                Blanchardstown Youth Service ESLs     Foroige     National        DES
                                                       Foroige                                           Organisation
BLA02    Blanchardstown Youth Service                  Blanchardstown    Youth     Service   Foroige     National        SPY
                                                       Foroige                                           Organisation
BLA04    Blakestown Youth Project                      Blakestown Resource Centre Foroige    Foroige     National        Round II
                                                                                                         Organisation
BLA05    Computer Clubhouse                            Blanchardstown    Youth    Service    Foroige     National        SPY
                                                       Clubhouse Foroige                                 Organisation
BLA06    Huntstown Community Youth project             Huntstown     Community     Centre    Foroige     National        Round II
                                                       Foroige                                           Organisation
BLA07    Mulhuddart Community Youth Project            Mulhuddart Community Building         Foroige     National        Round II
         Outreach                                      Committee Foroige                                 Organisation
BLA08    Mulhuddart Community Youth Project            Mulhuddart Community Building         Foroige     National        Round l
                                                       Committee Foroige                                 Organisation
BLA09    OASIS Potential Early School Leavers BYS      Blanchardstown    Youth    Service    Foroige     National        Round l
                                                       Foroige                                           Organisation
BLA10    Blanchardstown Drug Prevention                Blanchardstown Youth Service Drug     Foroige     National        Interim
                                                       Prev. Foroige                                     Organisation
BLA11    Blanchardstown PEER Drug         Prevention   Blanchardstown Youth Service PEER     Foroige     National        DTF M
         Education Project                             Foroige                                           Organisation
BLA12    Barnardos Oasis Project                       Barnardos                             Barnardos   National        Round l
                                                                                                         Organisation
BLA13    Corduff Community Youth Project               Corduff Community Youth Project       Foroige     National        Round II
                                                       Foroige                                           Organisation
BLA14    Tyrrellstown Youth Service                    Tyrrellstown Youth Service Foroige    Foroige     National        Round II
                                                                                                         Organisation

                                                                                                                          42 | P a g e
BLA15 Youth Sports Officer DDLETB DDLETB ETB Round II
TAL33 DDLETB Killinarden DDLETB DDLETB ETB Other
CLL01 Clondalkin Youth Service Bawnogue Clondalkin youth service Bawnogue CROSSCARE Regional Round II
CROSSCARE
CLL02 Clondalkin Youth Service - Deansrath Clondalkin Youth Service CROSSCARE Regional Round l
CROSSCARE
CLL03 KNOCKMITTEN CLONDALKIN YOUTH KNOCKMITTEN CLONDALKIN YOUTH CROSSCARE Regional Round II
SERVICE SERVICE CROSSCARE
CLL04 School Drugs Worker Clondalkin Youth Information Centre Clondalkin DTF Development Interim
Company
CLL05 Clondalkin Youth Information Centre Clondalkin Youth Service CROSSCARE Regional Youth Info
CROSSCARE Centre
CLL06 Ronanstown Evening Programme Co-Ordinator of Disadvantaged Youth CROSSCARE Regional Interim
Services CROSSCARE
CLL07 Neilstown Ronanstown Youth Service CROSSCARE Regional Round II
CROSCARE
CLL08 Quarryvale (YPFSF R1) Ronanstown Youth Service CROSSCARE Regional Round l
CROSCARE
CLL09 Quarryvale (YPFSF R2) Ronanstown Youth Service CROSSCARE Regional Round II
CROSCARE
CLL10 Lucan Youth Service Lucan North Kildare Youth Service CROSSCARE Regional SPY
COSSCARE
CLL11 Clondalkin Youth Service Clondalkin Youth Service CROSSCARE Regional SPY
CROSSCARE
CLL12 Ronanstown Youth Service Ronanstown Youth Service CROSSCARE Regional SPY
CROSSCARE
CLL13 CASP Ronanstown Youth Service CROSSCARE Regional Round l
CROSSCARE
CLL14 Ronanstown Youth Workers Ronanstown Youth Service CROSSCARE Regional Round l
CROSSCARE
CLL15 Teen Counselling Clondalkin (Bawnogue Crosscare Teen Counselling CROSSCARE Regional Round l
Branch) Clondalkin
43 | P a g eCLL16 Clondalkin Travellers Development Group Clondalkin Travellers Development Clondalkin Independent DTF M
Group Travellers
Development
Group
CLL17 Clondalkin Evening Programme - Clondalkin Clondalkin Youth Service CROSSCARE Regional Interim
Youth Services CROSSCARE
CLL18 Development Worker CPLN Area Partnership CPLN Area Development Round l
Partnership Company
CLL19 Knockmitten Youth & Community Knockmitten YouthCommunity Knockmitten Independent Round II
Centre/Association Centre YouthCommunity
Centre
CLL20 Carline Learning Carline Learning Centre Carline Independent Interim
CLL21 Quarryvale Community & Leisure Centre Quarryvale Community & Leisure SDCC Local Authority Round II
Centre
SDCC
CLL22 Collinstown Park Sports Complex Collinstown Park Sports Complex DDLETB ETB Other
DDLETB
CLL23 Youth Sports Officers Youth Sports Officers DDLETB DDLETB ETB Round II
CLL24 DDLETB Palmerstown DDLETB CC DDLETB ETB
DLR29 DDLETB ALP DDLETB Youth Service DDLETB ETB Round II
TAL32 DDLETB ALP Brookefield DDLETB ALP Youth Service DDLETB ETB Round II
NCD 11 DDLETB ALP Balbriggan DDLETB ALP Balbriggan DDLETB ETB Round II
NCD10 DDLETB ALP Swords DDLETB ALP Swords DDLETB ETB Round II
DLR01 Drug Educaton & Prevention Officer Dun Laoghaire Community Trainining Dun Laoghaire ETB/Community DTF M
Centre Ltd Community
Training Centre
DLR03 Central Dun Laoghaire Dun Laoghaire Youth Service - CROSSCARE Regional Round II
CROSSCARE
DLR04 Cois Cairn Youth Project Dun Laoghaire Youth Service - CROSSCARE Regional Round II
CROSSCARE
44 | P a g eDLR05 Loughlinstown Ballybrack Youth Project Loughlinstown Ballybrack Youth CROSSCARE Regional SPY
Project -CROSSCARE
DLR06 Loughlinstown Youth Project Loughlinstown Youth Project - CROSSCARE Regional SPY
CROSSCARE
DLR07 YP1 Sallynoggin youth project Sallynoggin youth project - CROSSCARE Regional Round l
CROSSCARE
DLR08 Cuala Sports and Social Integration Project Cuala Gaa Club Cuala Gaa club National Sports Round l
Organisation
DLR09 Southside Travellers Action Group - Southside Travellers Action Group Southside Regional Round II
Traveller Youth Service Limited Travellers Action
Group Limited
DLR10 Dun Laoghaire YIC Dun Laoghaire Youth ServiceYIC - CROSSCARE Regional Youth Info
CROSSCARE Centre
DLR12 Youth Arts Access Dun Laoghaire Youth Service ARTS - CROSSCARE Regional SPY
CROSSCARE
DLR13 Dun Laoghaire Town/Mountwood/Fitzgerald Dun Laoghaire Youth Service - CROSSCARE Regional SPY
Park CROSSCARE
DLR14 YP2 - Sallynoggin Youth Project Sallynoggin Youth Project - CROSSCARE Regional Round II
CROSSCARE
DLR15 YP1 - Loughlinstown Youth Project Loughlinstown Youth Project - CROSSCARE Regional Round l
CROSSCARE
DLR17 Parents Making Children Aware CROSSCARE UNKNOWN Regional DES
DLR18 Prevention through Education Southside Travellers Action Group Southside Regional Round l
Limited Travellers Action
Group Limited
DLR21 Dun Laoghaire Outdoor Learning Dun Laoghaire Youth ServiceOutdoor CROSSCARE Regional SPY
Programme Learning -CROSSCARE
DLR22 Co ordination and support Dun Laoghaire Youth Service - CROSSCARE Regional SPY
CROSSCARE
DLR24 Southside Training Network Southside Training Network Group Southside Independent Interim
Limited Training Network
DLR26 Long Standing Project 3 Team Leader Dun Laoghaire Youth Service - CROSSCARE Regional SPY
CROSSCARE
45 | P a g eDLR27 Alternative High CROSSCARE CROSSCARE Regional DTF M
DLR28 Minibus Project CROSSCARE CROSSCARE Regional Round II
KWSD01 Drug Prevention & Education Initiative Foroige - Tallaght Foroige National RDTF
(SW1) Organisation
NCD01 The ARK Project - Balbriggan Youth Service Balbriggan Youth Development Foroige National SPY
Foroige Organisation
NCD02 Swords / Baldoyle Youth Service Swords Youth Service CROSSCARE CROSSCARE Regional SPY
NCD03 Remember us Initiative Remember us Remember Us Independent SPY
NCD04 Co-Ordinator of Disadvantaged Youth Co-Ordinator of Disadvantaged Youth CROSSCARE Regional SPY
Services Services CROSSCARE
NCD05 Adventure Sports Adventure Sports CROSSCARE CROSSCARE Regional SPY
BLA16 Corduff Fingal Community & Recreation Fingal County Council Fingal County Local Authority Round II
Services Ltd Council
NCD07 Phibblestown Community Centre Phibblestown Community DDLETB ETB Other
CentreDDLETB
RATD01 Hillview Youth Project Dundrum Rathdown Youth Service CROSSCARE Regional Round l
CROSSCARE
RATD02 Ballyogan Youth Project Dundrum Rathdown Youth Service CROSSCARE Regional DTF M
CROSSCARE
RATD03 Rosemount Columbanus Youth Project Dundrum Rathdown Youth Service CROSSCARE Regional Round l
CROSSCARE
RATD04 Sandyford Youth Project Dundrum Rathdown Youth Service CROSSCARE Regional Round l
CROSSCARE
RATD05 Shanganagh Youth Project Shanganagh Youth Project CROSSCARE Regional DTF M
RATD06 Mountainview Youth Project Dundrum Rathdown Youth Service CROSSCARE Regional Round II
CROSSCARE
RATD07 Ballyogan R2 Dundrum Rathdown Youth Service CROSSCARE Regional Round II
CROSSCARE
RATD09 Nutgrove Nutgrove CROSSCARE CROSSCARE Regional Round II
RATD10 Ballyogan Early School Leavers Project Stand Alone Stand Alone Independent Interim
46 | P a g eNCD09 Balbriggan Youth Development Balbriggan Youth Development Foroige National RDTF
Foroige Organisation
NCD06 Baldoyle Youth Services Baldoyle Youth Services CROSSCARE Regional RDTF
CROSSCARE
NCD08 Child & Family Programmes Child & Family Programmes Foroige Foroige National RDTF
Organisation
TAL01 Slánú Slánú CARP Independent Emerging
needs
TAL02 West Dublin YMCA PAKT West Dublin YMCA PAKT YMCA Ireland National SPY
Organisation
TAL03 Tallaght Travellers Youth Service Tallaght Travellers Youth Service CROSSCARE Regional Round l
CROSSCARE
TAL04 Area 24 Youth Health Café - Mountain Park Area 24 Youth Health Café - Foroige National Emerging
Mountain Park Foroige Organisation Needs
TAL05 CARP Youth Project CARP CARP Independent Round l
TAL08 Springfield Community Youth Project West Dublin YMCA PAKT YMCA Ireland National Round l
Organisation
TAL09 STAY St Aengus Neighbourhood Youth STAY St Aengus Neighbourhood Foroige National DTF M
Project Youth Project Organisation
TAL10 Tallaght Youth Service Tallaght Youth Service Foroige Foroige National SPY
Organisation
TAL11 Whitechurch Youth Development Project Whitechurch Youth Development Foroige National DTF M
(WYDP) Project (WYDP) Foroige Organisation
TAL12 Peer Education Peer Education Foroige Foroige National DTF M
Organisation
TAL13 Tallaght Drug Education Initiative Foroige - Tallaght Foroige National Interim
Organisation
TAL14 Brookfield Youth & Community Centre (At Brookfield Youth & Community Foroige National Round l
Risk in Brookfield) Centre (At Risk in Brookfield) Foroige Organisation
TAL15 WHITECHURCH YOUTH DEVELOPMENT WHITECHURCH YOUTH Foroige National Round II
PROJECT DEVELOPMENT PROJECT Foroige Organisation
TAL16 Tallaght Travellers Youth Service Tallaght Travellers Youth Service CROSSCARE Regional SPY
47 | P a g eYou can also read