2021 QUALITY, COST EFFICIENCY, AND CIGNA CARE DESIGNATION METHODOLOGY - For Health Care Providers June 2020
←
→
Page content transcription
If your browser does not render page correctly, please read the page content below
2021 QUALITY, COST
EFFICIENCY, AND
CIGNA CARE
DESIGNATION
METHODOLOGY

 For Health Care Providers
 June 2020
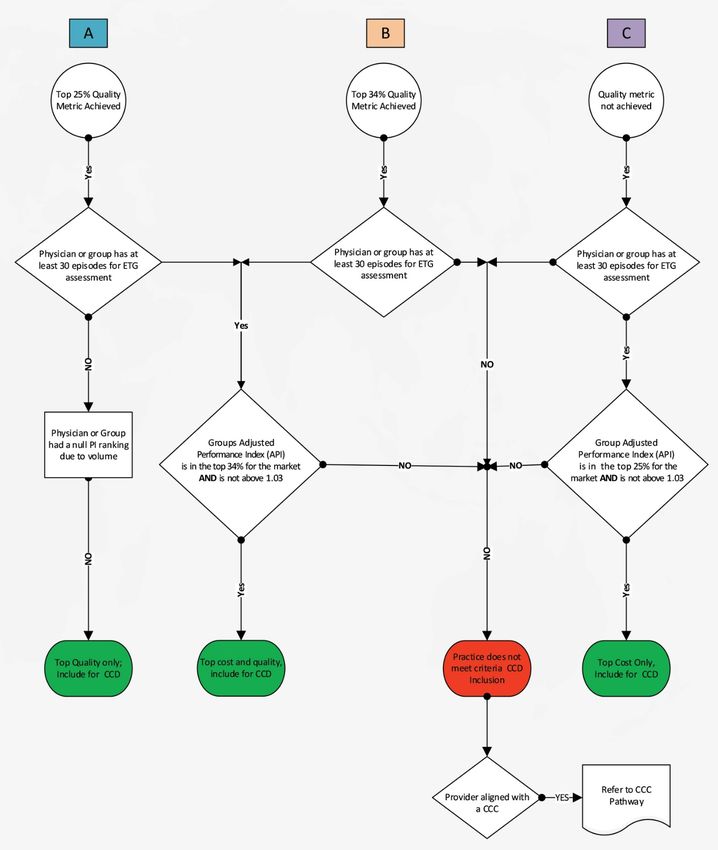
Table of contents

      Introduction ............................................................................................................................ 3
      Cigna quality and cost-efficiency display principles ................................................................ 3
      Specialty types assessed for quality and cost-efficiency displays ........................................... 4
      Quality evaluation and displays .............................................................................................. 5
      Evidence-based medicine (EBM) assessment process .......................................................... 6
      Credit for utilizing Cigna Centers of Excellence ...................................................................... 9
      Cost-efficiency evaluation and displays ................................................................................ 10
      2021 Outlier methodology .................................................................................................... 12
      Cigna Care Designation inclusion methodology ................................................................... 13
      Buffer zone methodology ..................................................................................................... 14
      Alternative pathways to achieve Cigna Care Designation..................................................... 17
      2021 Provider evaluation methodology changes .................................................................. 20
      Additional information and data limitations ........................................................................... 21
      Specific market activities ...................................................................................................... 22
      Feedback process ................................................................................................................ 22
      Provider process to request reconsideration ........................................................................ 22
      How to register complaints ................................................................................................... 23
      Appendices .......................................................................................................................... 24

      Appendix 1: 2021 Cigna Care Designation market information ............................................ 24
      Appendix 2: 2021 Quality and cost-efficiency display markets.............................................. 26
      Appendix 3: EBM rules used for the 2021 provider evaluation .............................................. 27
      Appendix 4: Colorado provider appeal process .................................................................... 40

                                                                                                                                                    Page 2 of 41
PCOMM-2020-378. © 2020 Cigna. Some content provided under license.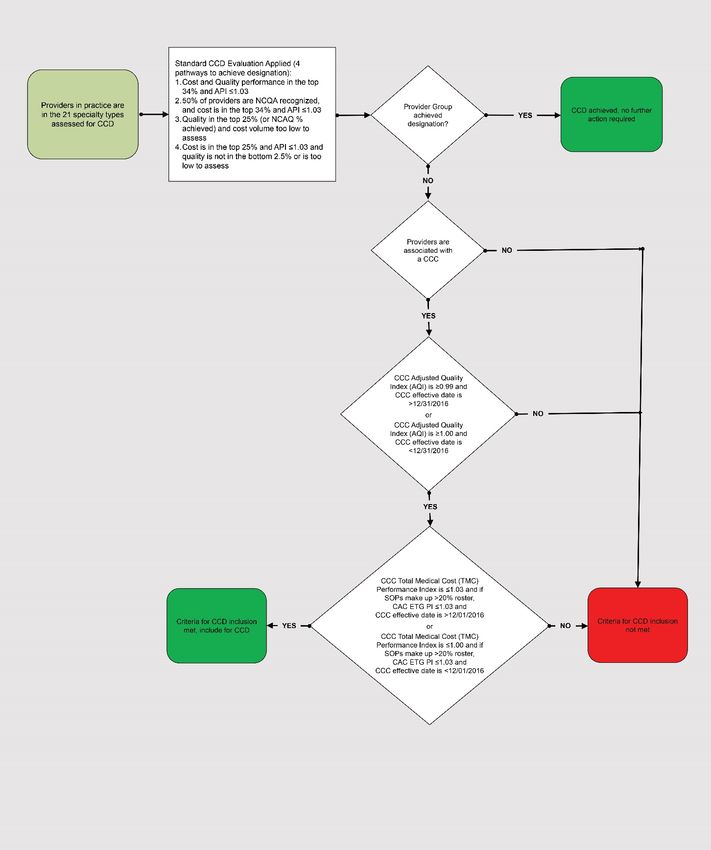
Introduction
Many of our customers want to know more about provider quality and cost-efficiency. To help provide Cigna
customers with relevant information to make their own health care decisions, we evaluate provider quality and
cost-efficiency information at the specialty level by using a methodology consistent with national standards and
incorporating provider feedback on contracted providers in 21 specialty types. In addition, groups who meet
Cigna’s specific quality and cost-efficiency criteria can receive the Cigna Care Designation (CCD), which
denotes a higher performing provider, based on the criteria outlined in this document. CCD may also be
utilized as part of a tiered benefit plan option.
This whitepaper explains the methodology used to measure the quality and cost-efficiency results of individual
providers at the specialty level and how the criteria are met for a group to achieve CCD, as well as provide
details regarding the profile information used on the provider directory displays.

Cigna quality and cost-efficiency display principles
We follow three key principles when providing our quality and cost-efficiency information to customers,
employers, and providers:
1. Standardized performance measures using the most comprehensive data set available. We use
   nationally recognized measures from those endorsed by the National Quality Forum (NQF), National
   Committee for Quality Assurance (NCQA), Healthcare Effectiveness Data Information Set (HEDIS® 1),
   or developed by national provider organizations.

2. Responsible use of the information. The profiles only reflect a partial assessment of quality and cost
   efficiency based on our claims data, and should not be the sole basis for decision-making as such
   measures have a risk of error. Our customers are encouraged to consider all relevant factors and to
   consult their treating provider when selecting a provider for care. In general, Cigna-participating
   providers are independent practitioners; they are not employees or agents of Cigna. Treatment
   decisions are made exclusively by the treating provider and their patient. We provide our customers with
   helpful information to allow them to make informed decisions. The quality and cost-efficiency markers
   used in evaluating providers for Cigna Care Designation are intended for that purpose only. We do not
   guarantee the quality or cost efficiency of the actual services provided by contracted providers, even
   those that qualify for CCD.

3. Collaboration and improvement enablement. We are committed to providing information and solutions
   that can help support access to quality health care. A detailed description of our methodology, information
   about the summary metrics, and ongoing data to help improve performance is available to providers and
   provider groups. We also continue to have ongoing discussions with key provider organizations, ranging
   from national associations to large provider groups, which provide input for future design changes.

The methodology for determining the quality and cost-efficiency displays is subject to change as tools and
industry standards evolve, and provider feedback is obtained and periodically updated. We used claims paid
data with dates of services from January 1, 2018 through December 31, 2019 for the review period to assess for
2021 quality and cost-efficiency profiles and directory displays. This review includes claims data from Cigna
Managed Care and PPO plans, and excludes government and capitated plans.

1   HEDIS® is a registered trademark of the National Committee for Quality Assurance (NCQA).

                                                                                                      Page 3 of 41
PCOMM-2020-378. © 2020 Cigna. Some content provided under license.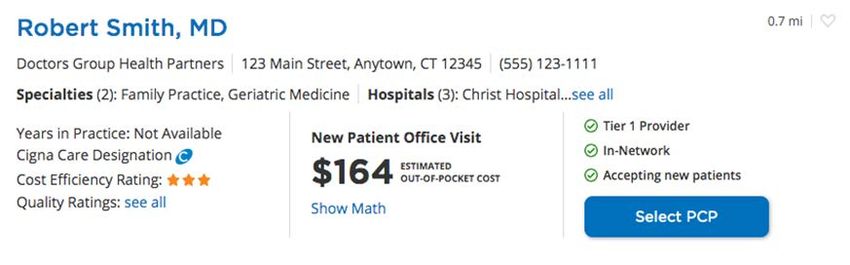
External certification
Cigna earned the NCQA Physician and Hospital Quality (PHQ) Certification for the sixth time in June 2019.
The PHQ certification program evaluates how well health plans measure and report the quality and cost of
physicians and hospitals. NCQA Quality Certification Standards meet New York state requirements
implemented in November 2007 concerning physician performance measurement, reporting, and tiering
programs.

Specialty types assessed for quality and cost-efficiency displays
Listed below are the 21 provider specialty types that are reviewed. These specialty types account for more
than 85 percent of primary and specialty healthcare spending based on Cigna claims data. A provider can only
be assigned one specialty, tax identification number (TIN), and geographical market for quality and cost-
efficiency displays. The provider’s primary specialty, as determined by Cigna, is used to establish the specialty
to evaluate providers with multiple specialties.
Assessed specialty types
         Allergy and immunology                                Cardiology          Cardio-thoracic surgery
                Dermatology                         Ear, nose, and throat (ENT)        Endocrinology
              Family practice                              Gastroenterology           General surgery
                Hematology*                                Internal medicine             Nephrology
                  Neurology                                  Neurosurgery         Obstetrics and gynecology
              Ophthalmology                               Orthopedic surgery             Pediatrics
               Pulmonary                                     Rheumatology                 Urology
*Does not include oncology

Note: While Cigna Care Designation is determined at the aggregated group level, we determine cost and
quality performance metrics by reviewable specialty type for groups comprised of more than one specialty type.
Market availability
Our Network Contracting and Market Medical Executive teams defined the 2021 geographical markets in which
CCD is recognized. The zip code of a provider’s primary office address is used to align a provider with a given
market. The provider’s primary specialty and geographic market is then used to determine the provider peer
group for comparison of quality and cost-efficiency results.

Please see Appendix 1 for a list of markets, and the volume and percent of providers reviewed in each
market, which are CCD providers effective January 1, 2021.

                                                                                                         Page 4 of 41
PCOMM-2020-378. © 2020 Cigna. Some content provided under license.
Sample: Online Health Care Professional Directory display (myCigna.com)
Quality, cost efficiency and
Cigna Care Designation displays
Quality evaluation and displays
Providers are evaluated on a number of criteria that we believe are markers of practice quality.
Information relative to specific quality criteria met by a provider is displayed in the online provider
directory on both the public website (Cigna.com) and secure customer website (myCigna.com). We
use four quality indicators to review participating providers in the 21 specialty types. Each provider
qualifying for a specific quality indicator is identified in our online health care professional directory.
1. Group board certification
Group board certification is measured based on certification data obtained from the American Board of
Medical Specialties (ABMS) and the American Osteopathic Association (AOA), consistent with our
Practitioner Credentialing and Recredentialing Policy. Board certifications criteria help determine
whether board-certified physicians in the group predominantly provide patient care to Cigna customers.
This standard is met if:
• Either 80 percent of physicians within a group are board certified and provide 50 percent of the
episodes of care, or at least 80 percent of the episodes of care is provided by board-certified
physicians, or
• For practices (groups) with four or fewer physicians, either 65 percent of physicians within a
group are board certified and provide 50 percent of the episodes of care, or at least 65
percent of the episodes of care is provided by board-certified physicians
2. Adherence to evidence-based medicine rules
The quality of provider care is evaluated using a claims-based assessment for 104 Evidence Based
Medicine (EBM) rules derived from measures endorsed by the NQF, Healthcare Effectiveness Data
Information Set (HEDIS), or developed by provider organizations. These rules span 45 diseases and
preventive cares conditions (see Appendix 3), and are potentially applicable to the care provided by
providers in 15 specialty types. For a list of the specialty types that are covered by Evidence Based
Medicine (EBM) rules, please see the chart on page seven.
Page 5 of 41
PCOMM-2020-378. © 2020 Cigna. Some content provided under license.3. National Committee for Quality Assurance (NCQA) Physician Recognition
NCQA Physician Recognition Programs assess clinicians and practices to ensure they support the
delivery of high-quality care, and provide medical services that adhere to evidence-based, nationally
recognized clinical standards of care. We identify physicians in our online provider directory who have
received recognition in any of these four NCQA Physician Recognition Programs:
• NCQA Diabetes Recognition Program (DRP)
• NCQA Heart/Stroke Recognition Program (HSRP)
• NCQA Patient-Centered Medical Home Recognition (PCMH - 2 versions)
• NCQA Patient Centered Specialty Practice Recognition (PCSP)
Additional information about these programs is available on the NCQA website (NCQA.org > Programs >
Recognition).
4. Bridges to Excellence (BTE) Provider Recognition
Bridges to Excellence programs measure the quality of care delivered in provider practices. BTE
emphasizes managing patients with chronic conditions, who may be at risk for potentially avoidable
complications. We identify providers in our online provider directory who have received recognition in any of
these BTE programs. BTE is currently available for these health concerns:
• Asthma care
• Cardiac care
• Chronic obstructive pulmonary disease (COPD) care
• Depression care
• Diabetes care
• Heart failure care
• Hypertension care
• Inflammatory bowel disease (IBD) care
• Maternity care
Additional information about these programs is available on the Bridges to Excellence website
(BridgestoExcellence.org). Refer to page 20 for the 2021 Provider Evaluation Methodology Changes and
2021 Data Sources tables.
Evidence-based medicine (EBM) assessment process
The EBM rules used in the 2021 evaluation apply to 15 primary care and non-primary care
specialty types. Currently there are no EBM rules that apply to dermatology. In 2017, the EBM
assessment process for gastroenterology, general surgery, neurosurgery, ophthalmology, and
orthopedic surgery was removed because fewer than two percent of groups with these specialty
types had sufficient volume to assess.
Overall, approximately 13.2 percent of providers in all assessed specialty types are associated with
groups that do not have sufficient volume to assess adherence to the EBM rules. However, they have
sufficient volume to assess cost efficiency. Similarly, 10,013 or 2 percent of providers are associated
with groups that do not have sufficient volume to assess cost efficiency and, as a result, are assessed
based on adherence with the EBM rules alone.
Page 6 of 41
PCOMM-2020-378. © 2020 Cigna. Some content provided under license.Specialty types covered by EBM rules
Allergy and immunology Cardiology Cardiothoracic surgery
Endocrinology Family practice Hematology
Internal medicine Nephrology Neurology
Obstetrics and gynecology Otolaryngology (ENT) Pediatrics
(OB/GYN)
Pulmonary Rheumatology Urology
The 2021 EBM assessment component review includes measuring compliance with 104 EBM rules obtained
from Optum EBM Connect® software, version 9.5 (see Appendix 3), where applicable, for the medical
conditions displayed in the following table:
Disease and preventive care conditions covered by EBM rules
Adolescent well-care Childhood immunization Otitis externa (acute)
Adult access to Persistence of beta-blocker
preventive/ambulatory health Chronic kidney disease treatment after a heart attack
Chronic obstructive pulmonary
Alcohol and other drug disease (COPD) exacerbation, Pharyngitis, appropriate testing
dependence pharmacotherapy management for children
Antidepressant medication Potentially harmful drug-disease
management Congestive heart failure interactions in the elderly
Asthma (includes use of Coronary artery disease (including
appropriate medications) statin therapy) Pregnancy management
Atrial fibrillation (includes use of
Anticoagulation Medications) Developmental screening Prenatal and postpartum care
Attention deficit hyperactivity
disorder (ADHD) Diabetes (including statin therapy) Prostate cancer
Breast cancer Epilepsy Rheumatoid arthritis
Breast cancer screening Human papillomavirus vaccine (HPV) Sickle Cell Anemia
Bronchitis (acute) Hypertension Sinusitis (acute)
Cardiac surgery Low back pain Tonsillectomy
Cerebral vascular accident and
transient cerebral ischemia Migraine headache Upper respiratory infection
Weight assessment
Cervical cancer screening Multiple sclerosis
Well-child visits in the first 15
Chlamydia screening Osteoporosis months of life
Well-child visits in the third, fourth,
Child and adolescent access to
fifth, and sixth years of life
primary care Otitis media (acute)
Page 7 of 41
PCOMM-2020-378. © 2020 Cigna. Some content provided under license.Definitions used in the following methodology description:
1. Provider specialty type: Any one of the 21 specialty types listed in the table of assessed
specialty types found on page four.
2. Group specialty type: Any one of the 21 specialty types listed in the table of assessed specialty
types found on page four. The provider group that is evaluated may include providers with the
same specialty, or the provider group may be evaluated using one of the following mixed-specialty
group designations, as applicable: multispecialty medical group (mixture of multiple non-PCP
specialists), mixed specialty medical group (mixture of PCPs and non-PCP specialists), primary
care medical group (mixture of PCP specialists)
3. Specialty category: Primary care specialties (family practice, internal medicine, and
pediatrics), or non-primary care specialties (the 18 other specialties assessed for CCD)
We determine the extent to which an individual provider or provider group complies with EBM rules
according to the following conventions:
Peer or market EBM rule adherence for each geographic market
• In order for an EBM rule to be included for review at the geographic market level for a provider or
provider group, there must be at least 20 opportunities for the rule within the specialty category
(primary care or non-primary care specialty types) and market for the most recent two-year data
review period. For 2021 displays, that period is January 1, 2018 through December 31, 2019.
• The average adherence rate for each EBM rule is calculated for the provider specialty category
(primary care or non-primary care specialty types) for each geographic market to derive the peer
market-average result.
Individual provider or group practice EBM rule adherence
• Opportunities and successes for each eligible EBM rule are aligned to the appropriate individual
provider (using the visit requirements outlined below and relevant specialty type category match).
Visit requirements: A provider is considered responsible for adherence to the EBM rule if the
following conditions are met:
• The EBM rule is relevant to the provider’s specialty (see Appendix 3). For example, the cervical
cancer screening EBM rule is relevant to OB/GYN, family practice, and internal medicine, but it is
not relevant to other specialty types.
• There have been at least two office visit encounters for a patient with Cigna coverage during the
claim review period.
• At least one of the office visit encounters occurred in the last 12 months of the claim review period.
Note: 41 of our EBM measures require only one office visit encounter in the last 12 months of the claim
review period. These measures are identified by an asterisk [*] in Appendix 3.
• Individual providers are aligned to medical groups (practices), and EBM rule opportunities,
successes, and expected successes are then summed to obtain totals. Provider performance is
aggregated to the specialty level within a group for quality displays and at the group level to
determine CCD.
Page 8 of 41
PCOMM-2020-378. © 2020 Cigna. Some content provided under license.• A Quality Index for the medical group is calculated by dividing the provider’s or provider group’s
number of actual EBM rule adherence successes by their number of expected EBM rule-adherence
successes. Expected EBM rule-adherence successes are derived by applying the geographic market-
average EBM rule adherence-success rates to that provider group’s particular mix of rule
opportunities.
• EBM (clinical quality) measures are not risk adjusted because the EBM rules have explicit definitions
for both the numerator and the denominator of each measure. The denominator explicitly defines the
population that is at risk; thus, risk adjustment is incorporated into the definition of the measure.
• A 90 percent confidence interval around the Quality Index is determined, allowing EBM quality
performance to be measured with a strong degree of certainty. The lower bound of the 90 percent
confidence interval for a particular provider or provider group is defined as the Adjusted Quality Index
for that provider group.
• Provider groups must have 30 or more total EBM rule- adherence opportunities. In addition, at
least 50 percent of their treatment episodes of care (used in the provider’s or group’s cost-
efficiency (ETG®) analysis) are attributed to the provider specialty types that are assessed for
EBM rule adherence, and are ranked using the Adjusted Quality Index score.
• Provider groups with an Adjusted Quality Index score in the top 34 percent of their medical group
specialty type and geographic market are placed in the highest performance category for EBM rule
adherence. This score is utilized at the group level in achieving the quality component of CCD.
Provider groups that have results in approximately the bottom 2.5 percent for the medical group
specialty types in the market where there are at least 20 medical groups of that medical group
specialty type in the market are placed in the bottom category; there will be no cost-efficiency display
for these individuals. The remainder is in the middle category.
• Specialties within each group are assessed in a similar manner to determine the Evidence Based
Medicine score at the specialty level. Specialty level scoring will drive directory displays at the
provider/specialty level, i.e. “Evidence Based Medicine Standards” language will display on the
directory for those providers in the top 34% for their specialty.
Credit for utilizing Cigna Centers of Excellence
We evaluate hospital-stay outcomes and cost-efficiency information for Cigna customers through the Cigna
Centers of Excellence (COE) program for all practices. Utilization of COEs by a reviewable physician
practice provides credit towards the quality component of CCD. If a practice has at least one COE
admission and a minimum Quality Index of 0.70 during the data analysis period, then a five percentage-
point increase in the Quality Index will be granted. The increased Quality Index is then used to determine
eligibility for CCD. COE admissions must be consistent with the specialty of the physician providing the
COE-related care in order to qualify.
Page 9 of 41
PCOMM-2020-378. © 2020 Cigna. Some content provided under license.Cost-efficiency evaluation and displays
Participating providers and provider groups are evaluated for their cost efficiency using an industry-
standard methodology (Episode Treatment Groups® or ETG®) that determines the average cost of treating
an episode of care for a variety of medical conditions and surgical procedures. The episode costs are
compared to other providers and provider groups of the same specialty in the same geographical market.
The results of this evaluation are displayed by using stars ( ) in our online provider directory and
myCigna.com, the secure website for Cigna customers.
Three stars for cost efficiency represent the top 34 percent of providers or provider groups when compared
to other providers and provider groups of like specialty type within the geographic market. Two stars
represent providers or provider groups in the middle 33 percent for cost efficiency. Provider groups that
are in the bottom 33 percent for cost efficiency receive one star.
Providers that do not meet the volume criteria for the cost-efficiency assessment will have a message next
to their name in the provider directory indicating that there was not enough Cigna claim volume to assess
their cost efficiency. Rankings are based on weighted percentile of total medical spend by market to
account for variation in group size.
Cost-efficiency symbols
Results in the top 34 percent for cost efficiency
Results in the middle 33 percent for cost efficiency
Results in the bottom 33 percent for cost efficiency
Please see Appendix 2 for the geographical markets and volume of providers reviewed for quality and
cost- efficiency displays beginning January 1, 2021.
We use ETG® methodology, an industry standard available through Optum, to evaluate the cost
efficiency of individual providers and medical groups. The methodology incorporates case-mix and
severity adjustment, and claims are clustered into more than 500 different episodes of care. Additional
information about the OptumInsight™ Episode Treatment Groups®, including a complete listing of the
ETG®s, is available on the Optum website ETG Transparency Learning Community home page
(https://learning.optum.com/exp/etg_transparency/page/home). Optum ETG® software version 8.3
is used for the assessment.
Using the ETG® methodology, we can determine how a provider’s cost-efficiency compares to other
providers in the same geographic market. The provider’s cost-efficiency performance is compared to the
performance of same-specialty providers in the same market for the same ETG. A provider or provider
group’s aggregated performance is influenced by its fee schedule, utilization patterns and referral patterns
(e.g., use of hospitals and other facilities).
ETG® assessment requirements
• Cigna uses ETG® ‘full number’ descriptions, inclusive of treatment approach and/or presence of
comorbid conditions or complications where they apply, to accurately compare like clinical scenarios.
There must be at least 10 occurrences of a specific ETG® (e.g., incorporating episode severity and
treatment level, co-morbidity, complications, or the presence of pharmacy benefits) within the
geographic market and specific provider specialty type in order to determine the market average cost
for that ETG® to include it in the market’s analysis.
Page 10 of 41
PCOMM-2020-378. © 2020 Cigna. Some content provided under license.• The peer or market average for each specific ETG® meeting the minimum tally above is
established for each market and provider specialty type. Provider performance is aggregated to the
specialty level within a group for cost displays and at the group level to achieve CCD.
• To reduce variation within cost-efficiency results, several ETG®s are excluded from the assessment
process, including routine immunizations and other inoculations, transplants, and ETG®s with low
volume or wide cost variation. Episodes with a severity level of four (the highest severity level assigned
by the OptumInsight ETG® software) are also excluded from analysis, for most conditions.
Example: For the Nashville market during the data analysis period, 15 occurrences of ETG® XX (with
the same severity, treatment level, co-morbidity, complications, and presence of pharmacy benefits)
are attributed to family physicians. The average cost of ETG® XX for family physicians in the Nashville
market is established by computing the numerical average of the cost of all 15 occurrences of this
ETG® subject to the application of outlier identification methodology outlined in the following section.
This process is replicated for each ETG® with at least 10 occurrences in the Nashville market for a
given provider specialty type in order to determine the market cost average for each ETG® that is
eligible for evaluation in the market.
ETG® assessment process
• Individual provider groups must have at least 30 total episodes of care in aggregate and at the individual
specialty level during the review period in order to be assessed for cost efficiency. In order for an episode
to be attributed to a provider group, two criteria must be met:
1. The practice must be responsible for more costs for medical or surgical management services
than any other provider group providing care for the episode, and
2. The medical or surgical management costs for the practice must be at least 30 percent of the
total episode medical or surgical management costs.
If these two criteria are not met, the episode is excluded from analysis. While only the costs associated
with practices’ provision of management services are used to attribute the episode to a particular
provider, total costs (provider management costs + all ancillary costs (e.g., lab, X-ray, hospital,
ambulatory surgery, and physical therapy) are used to characterize the total cost of the episode.
• The actual cost of an episode of care for each provider group and for the providers within that group
is compared to the market average cost of an episode of care, which is derived using their unique
mix of ETG®s and the peer averages.
• The sum of all actual ETG® costs for a medical group divided by the sum of all corresponding ETG®
market-average costs is the provider group’s Performance Index.
Example: The ABC Provider Group consisting of three family physicians in the Nashville market has
five episodes of care belonging to two unique ETG®s (ETG®1 and ETG®2) that are attributable to the
group. For simplicity, disregard the requirement that the provider or provider group must have a
minimum of 30 attributable episodes in order to be reviewed for cost efficiency. Average episode
costs for ETG®1 and ETG®2 have been established for all other primary care providers practicing in
the Nashville market. Three episodes of ETG®1 are attributable to the ABC Provider Group and two
episodes of ETG®2 are attributable to the ABC Provider Group.
Page 11 of 41
PCOMM-2020-378. © 2020 Cigna. Some content provided under license.In the table below, the provider group’s cost per episode is displayed for each of the three occurrences of
ETG®1 and for each of the two occurrences of ETG®2, along with the market average cost for an episode for
ETG®1 and ETG®2 for all family physicians in the Nashville market.
Actual episode cost Market average cost
ETG® 1 2,000 3,500
ETG® 1 1,000 3,500
ETG® 1 4,000 3,500
ETG® 2 15,000 19,000
ETG® 2 18,000 19,000
Average 8,000 9,700
Performance Index = 8,000/9,700 = 0.825
Dividing the average cost of all episodes of care attributable to the provider group by the average of all
market-average episode costs for the ETG®s on which the provider group’s cost-efficiency performance is
being evaluated yields a Performance Index (PI) of 0.825. The PI for the provider group can be interpreted
as Medical Group ABC is 17.5 percent more cost efficient than other family medicine physician groups in the
Nashville market.
• A 90 percent confidence interval around the PI is used to determine a range of performance within
which the medical group’s true performance would fall with a high level of confidence. The upper
bound of the confidence interval is defined as the Adjusted Performance Index and is used to
compare cost-efficiency performance among provider medical groups. The upper bound of the 90
percent confidence interval is used to ensure that the provider group’s performance is at least as
good as, or better than the upper bound threshold.
• Using a weighted percentile groups are then ranked by their Adjusted Performance Index within
their geographic area. Those groups ranking in the top 34% achieve 3 stars for efficiency and this
score is utilized at the group level in achieving the cost component of CCD evaluation.
• Specialties within each group are assessed in a similar manner to determine the Cost Efficiency
score at the specialty level, specialty level scoring will drive directory displays at the
provider/specialty level, i.e. 3 cost stars will display on the directory for those providers in the top
34% for their specialty, two stars for those falling between 34% and 66% and 1 star for those in the
bottom 34%.
2021 Outlier methodology
In order to portray providers’ cost-efficiency performance in the most accurate manner, the cost-
efficiency evaluation includes a methodology to account for outlier episodes. Outlier episodes are
substantially different from the market expected amounts. High cost episodes (ETG®s) are identified by
interquartile (IQ) variances by market and specialty averages; outlier episode costs are reduced to the IQ
value used to calculate cost-efficiency before peer comparison is performed. Similarly, low cost outlier
episodes are determined by the Optum software, or are episodes of less than $25 and are excluded
from the evaluation.
Page 12 of 41
PCOMM-2020-378. © 2020 Cigna. Some content provided under license.Level of evaluation (unit of analysis)
While we review participating providers at the individual level, the Cigna Care Designation is conferred at
the provider group or practice, or group TIN, level. Individual providers who are not part of a group are
assessed if volume criteria are met. This approach provides robust data for evaluation and is consistent
with the assumption that:
• Patients with Cigna coverage often chose a group rather than a specific provider within the
group, and;
• Patients with Cigna coverage who initially choose a specific provider frequently receive care
by another provider within the practice or group.
Cigna Care Designation inclusion methodology
In 2021, providers who meet our specific quality and cost-efficiency criteria, can receive the Cigna Care
Designation and will receive the CCD ( ) symbol next to their name in our online provider directory
tools. CCD may also be utilized as part of a tiered benefit plan option (e.g., Tier 1 Provider). Additional
information on Cigna products and benefit plans is available on the Cigna for Health Care Professionals
website (CignaforHCP.com > Resources > Medical Resources > Medical Plans and Products).
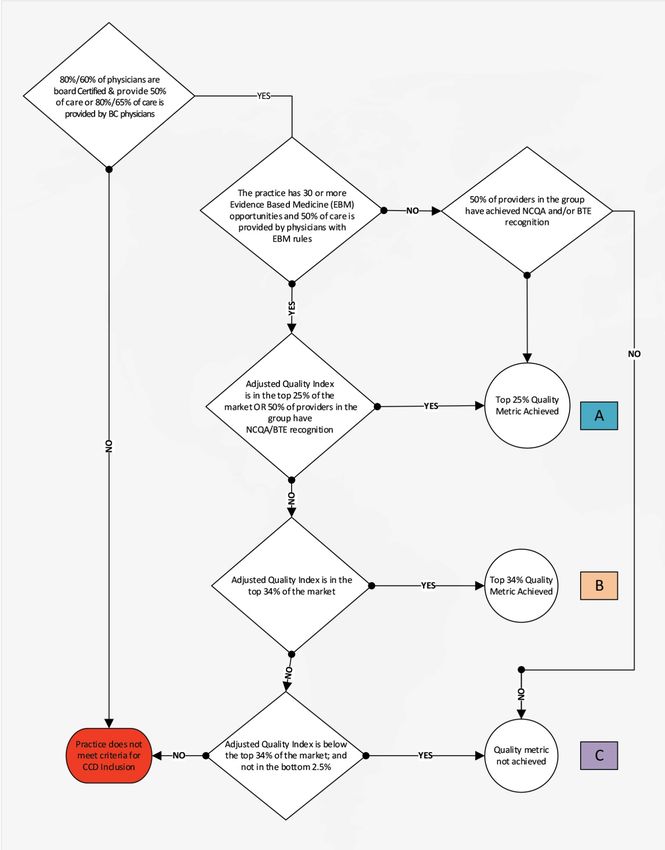
How providers are evaluated for Cigna Care Designation
Cigna evaluates whether the provider or group has achieved certain quality and cost-efficiency results,
which are described more fully below. If the provider or group achieves those results, then the provider or
group may be assigned the Cigna Care Designation.
Participating providers may receive Cigna Care Designation if the provider or provider group:
• Is located in one of the 73 markets that currently participate in this program
• Practices in one of the 21 assessed specialties
• Meets Cigna group board certification criteria
• Has a minimum volume of 30 complete episode treatment group occurrences AND
• Group performance in the top 34 percent for quality OR have 50 percent of providers in the
practice achieve NCQA or BTE recognition AND meet the cost-efficiency criteria of being in
the top 34 percent with the groups Adjusted Performance Index (API) less than or equal to
1.03 OR
• Group performance in the top 25 percent for quality OR have 50 percent of providers in the
practice achieve NCQA or BTE recognition AND have less than 30 ETG® episodes (with no
cost ranking) OR
• Group performance in the top 25 percent for cost with the groups Adjusted Performance Index
(API) less than or equal to 1.03 AND are either between 2.5 and 66 percent for quality or have
less than 30 EBM opportunities (with no quality ranking).
We inform our customers that a CCD for a provider or group should not be the sole basis for their
decision-making because our review for cost-efficiency and quality reflects only a partial assessment of
quality and cost efficiency. There could be a risk of error in the data used to perform the review, and
inclusion of a provider as CCD does not mean that the provider offers equal or greater quality and cost
efficiency than other participating providers. We encourage our customers to consider all relevant
factors when choosing a primary care provider or specialist for their care, and to speak with their
treating provider when selecting a specialist.
Page 13 of 41
PCOMM-2020-378. © 2020 Cigna. Some content provided under license.Buffer zone methodology
Variation in provider group or provider group performance (e.g., positive or negative, substantial or
minimal), is inevitable and expected in an annual review process due to various factors (e.g., changes
to provider group makeup, external market factors, and practice pattern modifications). A “buffer zone”
methodology addresses small-scale variation for providers or provider groups whose Cigna Care
Designation changes from the previous review cycle. A practice may maintain its designation status if
the group is within three percent of the current year's quality and cost criteria, or is within three percent
of the cost index when the group does not meet cost and quality criteria.
The selected provider group must meet certain criteria to achieve the 2021 buffer zone designation.
The standard criterion applied includes:
• meeting the physician group board certification criteria,
• the board-certified physicians must be responsible for at least 50 percent of the group episodes,
and
• the group must have at least 30 episodes, and
• the group must not be in the bottom 2.5 market percentile for EBM quality performance, in a
market with greater than 20 groups within the specialty category in the market.
Page 14 of 41
PCOMM-2020-378. © 2020 Cigna. Some content provided under license.2021 C i g n a Care Designation inclusion algorithm (Quality assessment)
Page 15 of 41
PCOMM-2020-378. © 2020 Cigna. Some content provided under license.2021 Cigna Care Designation inclusion algorithm (Cost assessment)
Page 16 of 41
PCOMM-2020-378. © 2020 Cigna. Some content provided under license.Alternative pathways to achieve Cigna Care Designation
Cigna Collaborative Care pathway to achieve Cigna Care Designation
We collaborate with selected provider groups in order to help them achieve the triple aim of
improving quality, cost efficiency, and the patient care experience. The Cigna Collaborative
Care (CCC®) approach, which leverages the foundation of accountable care organizations
(ACOs) and patient centered medical home (PCMH) models, recognizes providers affiliated
with CCCs that demonstrate improvement in medical delivery and clinical outcomes, and
reduced total cost of care.
Cigna's collaborative care model is designed for collaboration with provider groups that may
include PCPs only, a mix of PCPs and specialists or specialists only. The groups enter into
a contract with Cigna in which they agree to be evaluated based on quality and cost criteria
that are unique to the CCC model.
Providers and provider groups are first assessed by applying the standard CCD pathway to
determine inclusion. If the providers and provider groups are unable to achieve designation
through the standard CCD pathway, but they are affiliated with a CCC group, then a CCC
pathway inclusion criteria may be applied next to determine if they can be designated.
To be considered for Cigna Care Designation, CCC providers must be MDs and/or DOs in
one of three primary care specialties or one of 18 non-primary care specialties (see the
Assessed specialty types table on page four) with attributed Cigna customers in their patient
panels.
Primary care quality assessment
The CCC must have at least 20 evidence-based medicine (EBM) opportunities per rule
during the data collection period. A Quality Index is calculated for each CCC based on
adherence to Evidence Based Medicine (EBM) measures. CCCs with agreements effective
after December 31, 2016, must have a Quality Index of 0.99 or better to meet the quality
requirement. Established CCCs with an agreement effective prior to December 31, 2016,
must have a Quality Index of 1.00 or better to meet the quality requirement. The Quality
Index is calculated based on adherence to Evidence Based Medicine (EBM) standards.
The EBM rules for CCCs can vary from the core set utilized by CCD based on each
individual CCC agreement.
Primary care cost-efficiency assessment
Total medical cost (TMC) is used to evaluate cost-efficiency for primary care CCC
arrangements. To calculate the TMC index for primary care CCCs, aligned patients and
practitioners are identified. A CCC per patient per month (PPPM) score is calculated and risk
adjusted. The final risk adjusted CCC PPPM score is divided by the market PPPM score to
create the TMC cost index. The TMC cost index reflects all medical costs for Cigna
customers who are aligned to PCPs in the CCC, excluding pharmacy and non-PCP
behavioral health costs. CCCs with agreements effective after December 31, 2016, must
have a TMC Performance Index of 1.03 or less to meet the pathway cost requirement.
Established CCC’s with a CCC agreement effective prior to December 31, 2016, must have a
Page 17 of 41
PCOMM-2020-378. © 2020 Cigna. Some content provided under license.TMC Performance Index of 1.00 or less to meet the pathway cost requirement.
Specialty care cost-efficiency assessment
For CCCs with reviewable specialty type providers who comprise >=20% of the roster, the
ETG Performance Index must be 1.03 or less to meet the pathway cost requirement for the
specialists to meet the inclusion criteria.
NOTE: The alternate CCD pathway criteria may not be available in certain markets.
Buffer zone methodology
Variation in CCC performance (e.g., positive or negative, substantial, or minimal) is
inevitable and expected in an annual review process due to various factors (e.g.,
changes to provider group makeup, external market factors, and practice pattern
modifications). A “buffer zone” (grandfathering) methodology addresses variation for
provider groups or provider groups whose Cigna Care Designation changes from
the previous review cycle. A CCC may maintain its CCD status if the CCC was “in”
during the prior cycle.
Note: Individual markets may adjust the grandfathering criteria for CCCs at the market
level, in order to exclude from grandfathering those CCCs with large-scale variation in
results from the prior year. Adjustments are made at the market level and are applied to all
CCCs in the market.
Cigna Collaborative Care review process
The evaluation methodology is applied annually (and quarterly as needed) to all existing
CCC arrangements and to new CCCs that become effective.
• CCCs that do not meet criteria can be re-evaluated using quarterly data, through
our reconsideration process. If the quality and performance indexes improve, and
are meeting the market criteria for inclusion during two consecutive quarters, the
CCC will be given CCD status.
• Since CCCs can earn CCD status on a quarterly basis, we reserve the right to
remove the CCD status if the CCC demonstrates significant decline in performance
below the required criteria in four consecutive quarters, or if the CCC discontinues
its collaborative agreement with us and does not meet the standard CCD criteria.
• A re-evaluation occurs with each CCD refresh where grandfathering may be
applied. As noted previously, individual markets may adjust the grandfathering
criteria at the market level. When adjustments are made at the market level, they
are applied to all CCCs in the market.
Page 18 of 41
PCOMM-2020-378. © 2020 Cigna. Some content provided under license.2021 Cigna Collaborative Care to Cigna Care Designation Algorithm
Page 19 of 41
PCOMM-2020-378. © 2020 Cigna. Some content provided under license.Cigna Centers of Excellence pathway to achieve CCD
We evaluate hospital-stay outcomes and cost-efficiency information for Cigna customers
through the Cigna Centers of Excellence (COE) program; groups that do not qualify for any
Quality and/or Cost-efficiency inclusions are evaluated for COE to CCD inclusion pathway. The
pathway provides a 10 percent bump to the quality score and a 10 percent reduction to the cost
score. Group criteria for this inclusion pathway are:
• At least one admission to COE hospital for the diagnostic-related groups (DRGs) in the
latest COE evaluation program
• Group achieves a minimum Quality ranking of 70 percent
• At least 25 percent of the providers in the group are affiliated with a COE
2021 Provider evaluation methodology changes
Changes to our 2021 provider evaluation methodology are outlined below:
Methodology Change/enhancement Details/rationale
Evaluation data environment All code sets, data feeds, Update of evaluation capabilities to
rewrite and tables; mapping to and improve reliability, flexibility, and
between multiple systems responsiveness.
updated and validated
EBM Connect® software version Software package EBM EBM measures are subject to changes
update Connect® version 9.5 in clinical practice and national
update from Optum guideline standards.
Data sources
The following table outlines the evaluation data sources, and how they are used:
Data source How information is used
Cigna Provider Metrics The data is used to produce ETG® efficiency and
(January 2018 – December 2019) EBM summary reports.
Use combined Cigna managed care and PPO Note: Data for Medicare-eligible individuals and
product data with episodes of care or EBM rules capitated business is removed.
attributed to the responsible provider.
Cigna Central Provider File (CPF) File extracts to identify contracted providers, TIN,
(as of April 2020) Group demographics, specialty, board certification
status, network, and products contracted.
Page 20 of 41
PCOMM-2020-378. © 2020 Cigna. Some content provided under license.Data source How information is used
The status of physicians recognized for the
diabetes,
heart/stroke, physician practice connections, and
patient-centered medical home, or patient-
Physician Recognition Program File obtained
centered specialty practice recognition programs is
from the National Committee for Quality
updated based on information received from
Assurance (NCQA) (as of April 2020, and at least
NCQA.
six times per year)
Percent of physicians recognized in an NCQA
program for a group is calculated based on the
recognition and group alignment.
The status of providers recognized for BTE for
asthma care, cardiac care, chronic obstructive
pulmonary disease (COPD) care, depression care,
diabetes care, heart failure care, hypertension
care, inflammatory bowel disease (IBD) care, and
maternity care.
Physician Recognition Program File obtained from
Bridges to Excellence (BTE) (as of April 2020, and Physician Office Systems and Physician Office
at least six times per year) Systems Specialty certifications, recently retired by
BTE, will persist until individual two-year
certifications expire.
Percent of providers recognized in a BTE program
for a group is calculated based on the recognition
and group alignment.
Specialty groups that admit to COE facilities (based
on utilization data) will receive credit towards the
Cigna utilization and COE data
quality component evaluation for Cigna Care
Designation inclusion.
Additional information and data limitations
The quality and cost-efficiency profiles are a partial assessment of quality and cost-efficiency, and are
intended to provide information that can assist Cigna customers in health care decision-making. Cigna
customers are encouraged to consider all relevant information and to consult with their treating provider
in selecting a provider for care.
While we use the best available information to create an objective assessment methodology, there
are some limitations:
• The EBM and cost-efficiency information is based on our claim data only. Aggregated claim data
from multiple payers (e.g., insurance companies, self-insured plans, and government plans) may
provide a more complete picture of provider performance. We support data aggregation
initiatives, and will consider using it in evaluations when credible data are available.
• We can only use received claim data in evaluations. Claims received by Cigna, but processed
by a delegate are excluded. There may be health care services performed for which no
Page 21 of 41
PCOMM-2020-378. © 2020 Cigna. Some content provided under license.information is provided to us.
• Specific service line item detail may not always be available due to the way claims may be
submitted by providers or processed by us.
• Pharmacy data inclusion is limited to customers covered by a Cigna-administered pharmacy
benefit plan.
• We use ETG®, an industry standard grouper, to risk-adjust for patient severity. Although ETG®
software is recognized as a leading risk adjustment model, perfect patient severity-risk adjustment
does not exist.
• Many providers or provider groups are unable to be displayed for quality and cost-efficiency
due to small patient populations. We will not display results for those providers or provider
groups whose episodes or opportunities sample do not meet minimum volume thresholds.
Specific market activities
California Integrated Healthcare Association assessment: Pay for performance
• Cigna HealthCare of California participates in a statewide initiative coordinated by the Integrated
Healthcare Association (IHA) to measure and improve clinical quality, patient experience, use of
information technology, and public reporting of provider performance results.
• We pay incentive payments to provider organizations based upon performance against standard
quality measures.
• The common set of key measures used for assessment relies on national standards or EBM
practices.
• The measure set, audit manual, and data-submission file layouts are released each year by IHA.
• More information about the program and the assessment results is available on the IHA
website (www.iha.org).
Feedback process
We welcome and encourage participating providers, customers, and employers to provide feedback
and suggestions for how we can improve the evaluation or reports, as well as other suggested
program improvements. Employees and patients with Cigna-administered plans should call the
telephone number listed on the back of their Cigna ID card, or access the Feedback button available
online at myCigna.com. Participating providers can also provide feedback online by accessing the
Feedback button on Cigna.com, or call Cigna Customer Service at 1.800.88Cigna (1.800.882.4462).
Feedback and suggestions are reviewed, and changes to the provider evaluation methodology,
reporting formats, and processes are implemented as appropriate. Methodology changes are generally
reviewed and implemented on an annual basis.
Provider process to request reconsideration
Participating providers or provider groups have a right to seek correction of errors, and request data
review of their quality and cost-efficiency displays.
To do so, send an email to PhysicianEvaluationInformationRequest@Cigna.com, or fax to
1.866.448.5506 for detail reports, to request or submit additional information, to request
reconsideration of your quality and cost-efficiency displays, or to correct inaccuracies. The request for
reconsideration must include the reason, and any documentation you wish to provide in support of the
Page 22 of 41
PCOMM-2020-378. © 2020 Cigna. Some content provided under license.request. If the group meets the criteria for CCD inclusion upon reconsideration, the provider will be
displayed with the symbol next to their name in our online provider display tools.
The National Selection Review Committee process is initiated within five business days of our
receipt of a reconsideration request. A Cigna Network Clinical Manager (NCM) or Network Clinical
Specialist (NCS) will contact the provider practice or provider group to clarify information received
for reconsideration and generate detail reports. The NCM or NCS may change the provider group
designation if the obtained information meets CCD inclusion criteria. These may include, but are not
limited to a verification of board certification; a revision to the Evidence Based Medicine (EBM)
adherence score; or a verification of completion of one or more NCQA physician or BTE provider
recognition programs. The National Selection Review Committee will review the request if the
obtained information does not meet CCD inclusion criteria.
The National Selection Review Committee participants include Cigna physicians and Cigna network
clinical performance staff. Voting committee participants include the National Medical Director and
physician representatives from each Cigna region, their alternates, and ad hoc physicians. Non-
voting participants include the Assistant Vice President of Provider Measurement and Performance,
National Network Business Project Senior Analyst, Health Data Senior Specialist, Marketing
Product Senior Specialist, Network Clinical Managers and Network Clinical Specialists.
The National Selection Review Committee determination may include changing the designation,
upholding the original designation, or pending the determination for additional information.
Notification of the decision is sent to the provider group after the committee determination is made.
The National Selection Review Committee process and final decision is complete within 45 days of
receipt of a reconsideration request.
Colorado providers should refer to Appendix 4 on pages 41-42 for state-specific notes about CCD
reconsiderations.
How to register complaints
At any time, Cigna customers may register a complaint with us about the Cigna Care Designation,
and quality and cost-efficiency displays by calling the telephone number located on the back of their
Cigna ID card.
Registering a complaint for Cigna customers in New York
The NCQA is an independent not-for-profit organization that uses standards, clinical-performance
measures, and member satisfaction to evaluate the quality of health plans. It serves as an
independent ratings examiner for Cigna Health and Life Insurance Company, Connecticut General
Life Insurance Company, and Cigna HealthCare of New York, Inc., reviewing how CCD, and
quality and cost- efficiency displays meet criteria required by the State of New York.
Complaints about CCD, quality, and cost-efficiency displays in New York can be registered with
NCQA, in addition to Cigna, by submitting them in writing to customer support at www.ncqa.org
or to NCQA Customer Support, 1100 13th Street, NW, Suite 1000, Washington, DC 20005.
Page 23 of 41
PCOMM-2020-378. © 2020 Cigna. Some content provided under license.Appendices
Appendix 1: 2021 Cigna Care Designation market information
Market name Volume reviewed Percent designated Percent not designated
AR Arkansas 6,192 13.95 86.05
AZ Maricopa 10,246 37.97 62.03
AZ All Other 2,166 15.93 84.07
AZ Pima 2,659 29.82 70.18
CA North 2,175 9.43 90.57
CA South 32,433 24.59 75.41
CA Bay Area 12,587 44.92 55.08
CA Sacramento 3,428 36.93 63.07
CA Central Valley 3,473 47.42 52.58
CO Front Range 11,314 27.21 72.79
CT Connecticut 11,466 39.88 60.12
DE Delaware 2,812 10.81 89.19
FL Jacksonville 3,403 12.69 87.31
FL All Other 5,663 23.63 76.37
FL South Florida 11,742 33.96 66.04
FL Orlando 6,912 25.52 74.48
FL Tampa 11,799 32.76 67.24
GA Atlanta 10,563 34.83 65.17
GA All Other 4,831 27.92 72.08
IL Chicago Metro 18,890 42.14 57.86
IL Rockford 4,031 16.15 83.85
IN Indianapolis 4,729 30.32 69.68
KS KS/MO Kansas City 5,316 18.62 81.38
LA All Other 2,898 14.80 85.20
LA Baton Rouge 3,343 15.38 84.62
LA New Orleans 3,322 17.52 82.48
MA Western 4,660 30.92 69.08
MA Boston 20,162 24.06 75.94
MD Maryland 12,379 36.94 63.06
MD Northern VA 6,446 20.26 79.74
DC Metro North 6,778 23.66 76.34
ME Maine 4,229 19.91 80.09
MS Mississippi 5,840 9.98 90.02
NC Charlotte 5,070 25.88 74.12
NC East 4,594 23.90 76.10
NC Raleigh 6,105 34.38 65.62
NC Triad 4,106 39.26 60.74
NC West 2,873 22.55 77.45
NH New Hampshire 4,561 35.01 64.99
Page 24 of 41
PCOMM-2020-378. © 2020 Cigna. Some content provided under license.Market name Volume reviewed Percent designated Percent not designated
NJ North Jersey 12,656 40.88 59.12
NJ South Jersey 5,253 15.04 84.96
NV Nevada 4,630 21.38 78.62
NY Metro 33,378 35.17 64.83
OH Northern 12,226 21.68 78.32
OH Central 8,763 50.22 49.78
OH Southern 8,381 22.30 77.70
OH NW Ohio 3,067 30.13 69.87
OR Oregon 12,002 19.46 80.54
PA Philadelphia 12,497 28.58 71.42
PA All Other 14,086 25.25 74.75
PA Pittsburgh/Western 7,985 56.79 43.21
RI Rhode Island 3,406 17.15 82.85
SC Low Country 3,613 19.51 80.49
SC Midlands 3,047 12.70 87.30
SC Upstate 3,260 16.93 83.07
TN West 4,206 24.30 75.70
TN Central 7,253 26.46 73.54
TN East 7,458 29.47 70.53
TX Austin 4,974 22.18 77.82
TX Dallas/Ft. Worth 12,312 33.49 66.51
TX Houston 13,938 28.70 71.30
TX San Antonio 3,325 17.17 82.83
TX East Central Texas 3,100 23.81 76.19
UT Wasatch Front 4,832 24.65 75.35
VA Hampton Roads 3,990 20.25 79.75
VA Richmond 3,468 33.74 66.26
VA Western 4,200 22.26 77.74
VT Vermont 2,209 23.68 76.32
WA Seattle 12,079 27.25 72.75
WA All Other 5,724 14.36 85.64
WI Milwaukee/Green Bay 9,334 50.42 49.58
WI All Other 5,141 28.46 71.54
WV West Virginia 5,152 7.45 92.55
Page 25 of 41
PCOMM-2020-378. © 2020 Cigna. Some content provided under license.Appendix 2: 2021 Quality and cost-efficiency display markets
* Indicates markets where providers are assessed for quality and cost-efficiency display only.
Market name Specialist reviewed Market name Specialist reviewed
AL Alabama ** 8,217 NC Raleigh 6,105
AR Arkansas 6,192 NC Triad 4,106
AZ Maricopa 10,246 NC West 2,873
AZ All Other 2,166 NH New Hampshire 4,561
AZ Pima 2,659 NJ North Jersey 12,656
CA North 2,175 NJ South Jersey 5,253
CA South 32,433 NV Nevada 4,630
CA Bay Area 12,587 NY Metro 33,378
CA Sacramento 3,428 NY All Other ** 17,975
CA Central Valley 3,473 OH Northern 12,226
CO All Other ** 2,474 OH Central 8,763
CO Front Range 11,314 OH Southern 8,381
CT Connecticut 11,466 OH NW Ohio 3,067
DE Delaware 2,812 OK Oklahoma ** 6,022
FL Jacksonville 3,403 OR Oregon 12,002
FL All Other 5,663 PA Philadelphia 12,497
FL South Florida 11,742 PA All Other 14,086
FL Orlando 6,912 PA Pittsburgh/Western 7,985
FL Tampa 11,799 RI Rhode Island 3,406
GA Atlanta 10,563 SC Low Country 3,613
GA All Other 4,831 SC Midlands 3,047
IL Chicago Metro 18,890 SC Upstate 3,260
IL All Other ** 6,711 TN West 4,206
IL Rockford 4,031 TN Central 7,253
IN Indianapolis 4,729 TN East 7,458
IN All Other ** 6,648 TX Austin 4,974
KS KS/MO All Other ** 6,251 TX Dallas/Ft. Worth 12,312
KS KS/MO Kansas City 5,316 TX Houston 13,938
KY Kentucky ** 10,142 TX San Antonio 3,325
LA All Other 2,898 TX East Central Texas 3,100
LA Baton Rouge 3,343 UT Wasatch Front 4,832
LA New Orleans 3,322 VA Hampton Roads 3,990
MA Western 4,660 VA Richmond 3,468
MA Boston 20,162 VA Western 4,200
MD Maryland 12,379 VT Vermont 2,209
MD Northern VA 6,446 WA Seattle 12,079
DC Metro North 6,778 WA All Other 5,724
ME Maine 4,229 WI Milwaukee/Green Bay 9,334
MS Mississippi 5,840 WI All Other 5,141
NC Charlotte 5,070 WV West Virginia 5,152
NC East 4,594
Page 26 of 41
PCOMM-2020-378. © 2020 Cigna. Some content provided under license.You can also read