On the Impact of Biceps Muscle Fatigue in Human Activity Recognition
←
→
Page content transcription
If your browser does not render page correctly, please read the page content below
sensors
Article
On the Impact of Biceps Muscle Fatigue in Human
Activity Recognition
Mohamed Elshafei *,† , Diego Elias Costa †                       and Emad Shihab †

                                           Department of Computer Science and Software Engineering, Concordia University,
                                           Montreal, QC H3G 1M8, Canada; diego.costa@concordia.ca (D.E.C.); eshihab@cse.concordia.ca (E.S.)
                                           * Correspondence: m_lshafe@encs.concordia.ca
                                           † These authors contributed equally to this work.

                                           Abstract: Nowadays, Human Activity Recognition (HAR) systems, which use wearables and smart
                                           systems, are a part of our daily life. Despite the abundance of literature in the area, little is known
                                           about the impact of muscle fatigue on these systems’ performance. In this work, we use the biceps
                                           concentration curls exercise as an example of a HAR activity to observe the impact of fatigue impact
                                           on such systems. Our dataset consists of 3000 biceps concentration curls performed and collected
                                           from 20 volunteers aged between 20–35. Our findings indicate that fatigue often occurs in later sets
                                           of an exercise and extends the completion time of later sets by up to 31% and decreases muscular
                                           endurance by 4.1%. Another finding shows that changes in data patterns are often occurring during
                                           fatigue presence, causing seven features to become statistically insignificant. Further findings
                                           indicate that fatigue can cause a substantial decrease in performance in both subject-specific and
                                           cross-subject models. Finally, we observed that a Feedforward Neural Network (FNN) showed the
                                           best performance in both cross-subject and subject-specific models in all our evaluations.

                                           Keywords: human activity recognition; wearable sensors; wearable sensor data; machine learning


Citation: Elshafei, M.; Costa, D.E.;       1. Introduction
Shihab, E. On The Impact of Biceps
                                                Fatigue is an inevitable consequence when it comes to athletics and incremental
Muscle Fatigue in Human Activity
Recognition. Sensors 2021, 21, 1070.
                                           exercises [1]. There are a plethora of studies about human fatigue in the literature. Some
https://doi.org/10.3390/s21041070
                                           studies adopt the clinical approach to study human fatigue, where they provide an in-depth
                                           definition, characterization, and examination of fatigue. Clinically, fatigue differs based
Academic Editor: Raffaele Gravina          on the type of activities performed by a person. Physical activities generate objective
Received: 26 November 2020                 fatigue, which decreases the capability to exert mechanical work [2]. On the other hand,
Accepted: 1 February 2021                  subjective fatigue is generated by intense mental tasks that are characterized by a decline
Published: 4 February 2021                 of alertness and mental concentration [3]. These two types of fatigue gradually push the
                                           body to reach its limit, breaking the homeostasis state due to the difference between the
Publisher’s Note: MDPI stays neu-          metabolic energy production/consumption and the accumulation of metabolic waste at
tral with regard to jurisdictional clai-   the cellular level, conditioning the normal functioning of the organic system [4]. As a
ms in published maps and institutio-       result, this can damage the organism, or in more drastic situations, it may lead to overwork,
nal affiliations.                          chronic fatigue syndrome, over-training syndrome, and immunity dysfunctions [5].
                                                Recently, several fatigue detection approaches have been proposed in the literature
                                           to avoid fatigue-induced injuries. The invasive approach is one of the earliest methods
Copyright: © 2021 by the authors. Li-
                                           to detect fatigue and requires measuring the lactic acid in the bloodstream to determine
censee MDPI, Basel, Switzerland.
                                           the maximal muscle effort that a person can maintain without risking fatigue injuries [6].
This article is an open access article
                                           The cardio-respiratory approach is another method to detect fatigue however, it is based
distributed under the terms and con-       on a person’s metabolic system. It requires a face mask to measure the circulatory and
ditions of the Creative Commons At-        respiratory systems’ ability to supply oxygen (O2 ) to skeletal muscles during sustained
tribution (CC BY) license (https://        physical exercise [7]. Other studies refer to this method as VO2 max, which stands for the
creativecommons.org/licenses/by/           maximum volume of oxygen consumption measured during incremental exercise. Recently,
4.0/).                                     approaches using wearables have been developed to detect fatigue based on the Rating of

Sensors 2021, 21, 1070. https://doi.org/10.3390/s21041070                                                   https://www.mdpi.com/journal/sensors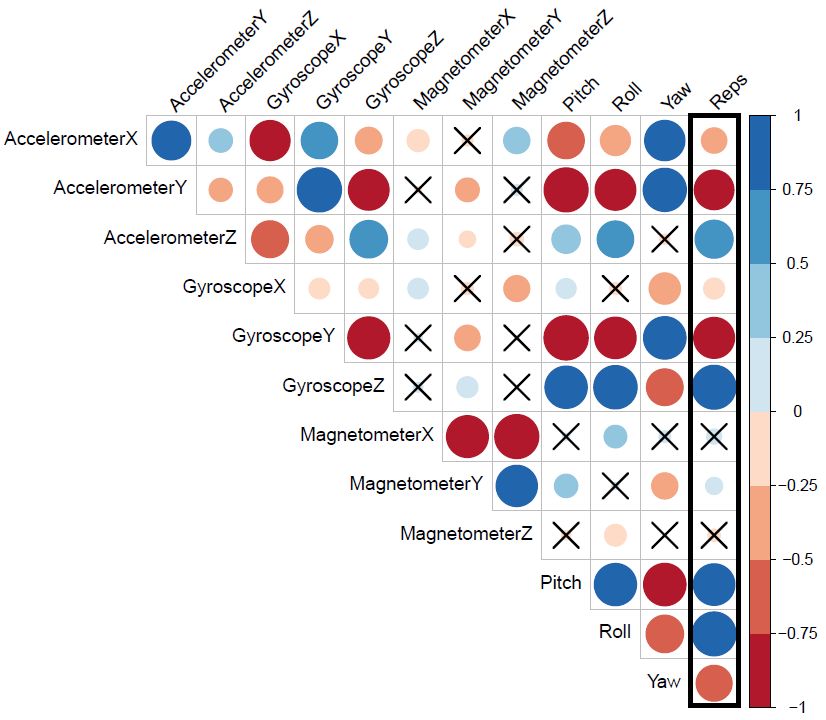
Sensors 2021, 21, 1070                                                                                             2 of 21

                         Perceived Exertion (RPE), a validated subjective measure of fatigue. For example, prior
                         work used wearables to measure fatigue for outdoor running [8].
                              Despite the abundance of works on fatigue detection in the literature, little is known
                         about its impact on Human Activity Recognition (HAR) systems. Outwardly, fatigue im-
                         pacts human performance through degradation of exerted force and internally, it impacts
                         heart rate, blood pressure, and core temperature, which can be measured using the appro-
                         priate tools. Although previous works (e.g., [9–11]) on the impact of fatigue have covered
                         human performance and internal body changes, these works have been focused on clinical
                         approaches that measure levels of lactate, creatine kinase, and VO2 max. The goal of our
                         work is to study the impact of fatigue on detection models. Fatigue may naturally occur in
                         any human activity, but it poses a bigger challenge for HAR models when identifying physi-
                         cally demanding activities, such as gym activities. For this reason, we focus on studying the
                         biceps concentration curls exercise, which involves flexing one of the most active skeletal
                         muscles at the elbow joint countless times to pick, lift, and pull objects [12,13]. We collect a
                         dataset for biceps concentration curls from 20 volunteers aged between 20–35. Then, we
                         analyze the data patterns that occurred in repetitions during the presence of fatigue and
                         extract all the non-fatigue repetitions into a subset. We extract two sets of features to detect
                         bicep concentration curls, a feature set from the complete dataset and another feature set
                         from the non-fatigue subset. We then contrast these two sets of features to find whether
                         fatigue has affected the number of extracted features. After that, we train five machine
                         learning models to detect biceps concentration curls to observe their performance before
                         and after fatigue presence. In comparison to related work, our contribution in this work is
                         to study the impact of fatigue using the recent wearable approach instead of the clinical
                         ones. Furthermore, we focus on how fatigue impacts the collected data, extracted features,
                         and performance of detection models rather than focusing on human performance and
                         internal body changes as in the clinical approaches.
                              The rest of the paper is structured as follows, Section 2 demonstrates how we collect
                         our dataset, label its entries, and address related challenges. Section 3 describes our
                         approach to data processing, feature extraction, and experiment setup. In Section 4, we
                         answer four research questions about the impact of fatigue. In Section 5, we discuss other
                         interpretations of our findings. Section 6 concludes our paper.

                         2. Data Collection and Related Challenges
                               In this section, we present our data collection approach and the challenges involved,
                         i.e., dumbbell suitability and subjectivity of the Rate of Perceived Exertion (RPE). We
                         also discuss the possible solutions to overcome these challenges to provide a high-quality
                         dataset for our study.

                         2.1. Data Collection
                               Our dataset must contain a sufficient number of biceps concentration curls for two
                         reasons. First, we have to collect enough data entries that capture the impact of fatigue
                         and second, to observe the kinetic changes that occur during the exercise. We use Borg’s
                         scale to evaluating the Rate of Perceived Exertion (RPE) during the exercise, which is a
                         subjective measurement of fatigue within sport science. We explained the Borg’s scale
                         to each volunteer to express their levels of fatigue, as shown in Table 1. Then, we asked
                         20 volunteers between the ages of 20 to 35 to perform biceps concentration curls using a
                         dumbbell. At scales of 6–10, the volunteer reported no to light feeling of exertion. At scales
                         11–14, the volunteer reported fairly light to moderate level of exertion. At scales 15 or
                         higher, the volunteer reports a vigorous level of exertion. We believe that RPE is suitable in
                         our case because it is non-invasive, convenient, and user-friendly, making it more practical
                         and less equipment demanding. Moreover, RPE measures peripheral muscle fatigue, given
                         that it provides a more comprehensive view, which includes feedback from cardiovascular,
                         respiratory, and musculoskeletal systems [14]. Furthermore, RPE has proven to model a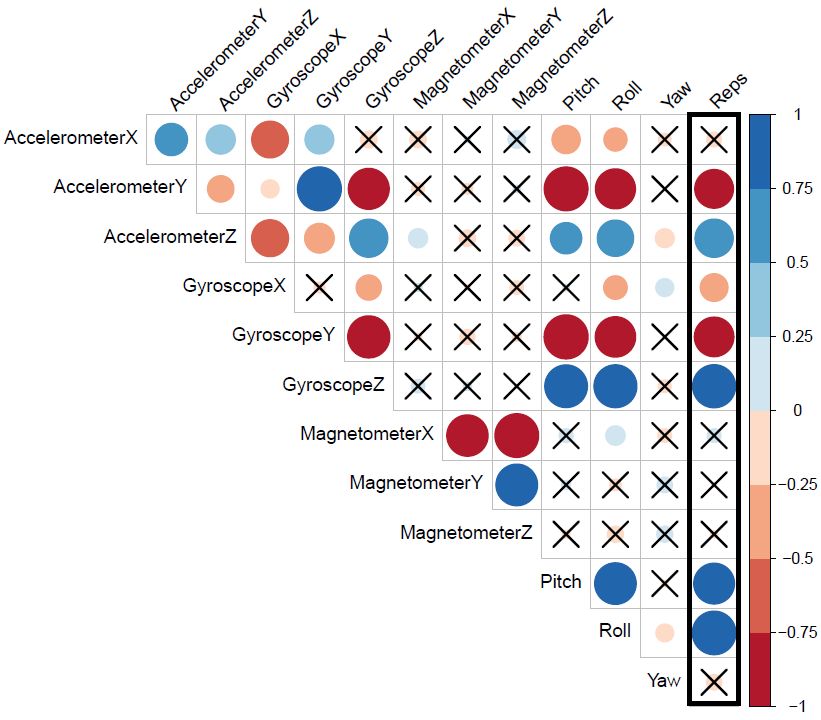
Sensors 2021, 21, 1070                                                                                                    3 of 21

                           person’s performance better in the real-world compared to only heart rate monitoring [15]
                           thus, RPE is an appropriate and validated marker of a volunteer’s fatigue [16].

                           Table 1. Borg G.A. psychophysical bases of perceived exertion [16].

      Perceived Exertion   Borg Rating                                          Examples
             None                    6                              Reading a book, watching television
        Very, very light          7 to 8                                         Tying shoes
          Very light             9 to 10                  Chores like folding clothes that seem to take little effort
          Fairly light          11 to 12         Walking through the grocery store (without speeding up your breathing)
        Somewhat hard           13 to 14             Brisk walking (moderate effort and speeding up your breathing)
             Hard               15 to 16           Bicycling, swimming, (vigorous effort and get the heart pounding)
          Very hard             17 to 18                       The highest level of activity you can sustain
        Very, very hard         19 to 20          A finishing kick in a race or activity that you can not maintain for long

                                We placed a single 50 Hz Neblina Inertial Measurement Unit (IMU) on the volunteer’s
                           wrist during our recording sessions. The IMU device contains a 3-axis accelerometer,
                           a 3-axis gyroscope, and a 3-axis magnetometer. The IMU unit measures one signal for each
                           of the three orthogonal axes per sensor type, resulting in nine signals per IMU. We also
                           placed the Apple Watch Series 4 on the opposite wrist to measure the volunteer’s heart rate.
                           The Apple Watch calculates the number of times the heart beats each minute and supports
                           a range of 30–210 beats per minute. Although Apple Watch uses Photoplethysmography
                           (PPG) for heart rate monitoring, which may inherit inaccuracies, previous work [17] have
                           shown that Apple Watch provided the most accurate readings with no statistical difference
                           compared to Electrocardiography (ECG). Moreover, another work [18] demonstrates that
                           the Apple Watch measures heart rate with clinically acceptable accuracy, and it might be
                           considered safe to use it for cardiac rehabilitation training programs. Therefore, the conve-
                           nience and accuracy of Apple Watch have motivated us to use the device to measure the
                           volunteer’s heart rate. Once we collect the volunteer’s heart rate and the reported Borg, we
                           multiply the reported Borg rating by 10 to estimate the volunteer’s heart rate during the
                           exercise. This means if both heart rates measured by the Apple Watch and the estimate
                           from the Borg scale are similar, we have a higher confidence on the validity of reported
                           RPE for each volunteer. In the rare case of dissimilarity between the Borg scale and the
                           measured heart rates, we average the reported RPE with the measured heart rate converted
                           to RPE, as similarly done in previous work [19]. Figure 1 shows a visual illustration of the
                           biceps concentration curl exercise where we demonstrate the exercise to each volunteer as
                           the following:
                           1.       The volunteer should sit down on a flat bench with one dumbbell placed between
                                    their legs;
                           2.       The volunteer should be in a release position by using their right arm to pick the
                                    dumbbell up. Then, place the back of their right upper arm on the top of the inner
                                    right thigh. The volunteer should rotate the palm of their hand until it is facing
                                    forward away from the thigh. Once, their arm is extended with the dumbbell above
                                    the floor then; the volunteer is in the correct release position, as shown in Figure 1;
                           3.       While the volunteer is holding the left arm stationary, they curls the weights forward
                                    while contracting the biceps as they breathe out. With the forearms movement only,
                                    the volunteer continues until their biceps are fully contracted, and the dumbbells are
                                    at shoulder level. The volunteer should hold the contracted position for a second,
                                    as shown in Figure 1;
                           4.       The volunteer should slowly begin to bring the dumbbells back to the release position
                                    as their breathe in. Avoid swinging motions at any time;
                           5.       Repeat for 15 repetitions. Then repeat the exercise the left arm to carry the dumbbell;
                           6.       The volunteers are equally allowed to rest for 2 min between sets, which is a common
                                    exercise protocol in previous works [20,21].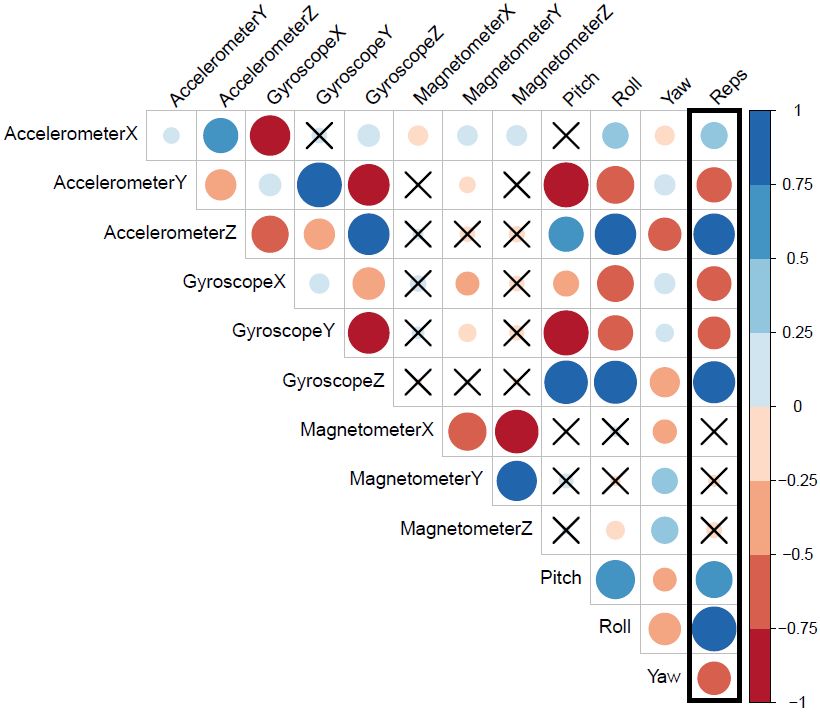
Sensors 2021, 21, 1070                                                                                                              4 of 21

      Figure 1. Visualization of data acquisition sessions of biceps concentration curl exercise. Rating of Perceived Exertion (RPE).

                                       In the end, each volunteer completed 5 warm-up repetitions followed by 15 repetitions
                                  per set for a total of 5 sets per hand, as shown in Figure 1. The volunteers reported their
                                  RPE after each set, including the warm-up, yielding 6 RPE values per hand. In total, we
                                  collected longitudinal data for 3000 concentration curl repetitions.

                                   2.2. Data Collection Challenges
                                       We encountered two major challenges during our data collection procedure: Dumbbell
                                  suitability and RPE subjectivity. We presumed that selecting a certain dumbbell weight
                                  for collecting data from different volunteers may induce a loose variance in their fatigue
                                  measures, such as the number of repetitions or completion time per set. In addition,
                                  using subjective measures, such as RPE, we could introduce a dependency between the
                                  correctness of the selected Borg rating and the volunteers’ body awareness.
                                       The first challenge we encountered is the suitability of the dumbbell. The process
                                  of collecting data from 20 volunteers raises the issue that not all volunteers can equally
                                  perform the exercise. To address this challenge, we provided all volunteers with three
                                  groups of dumbbells: Light-weight which includes 1.1 kg and 2.2 kg dumbbells, medium-
                                  weight which includes 4.5 kg dumbbells, and heavy-weight which includes 9 kg dumbbells,
                                  as shown in Table 2. Then, we asked each volunteer to perform at least 2 sets of bicep
                                  concentration curl repetitions until they felt fatigued. As expected, when volunteers used
                                  light-weight dumbbells, they were able to perform a high number of repetitions per set
                                  but fewer sets in total (see row 1 and 2 in Table 2). This resulted in long recording sessions
                                  with a lot of similar data entries until volunteers reached fatigue. On the other hand, when
                                  we look at the results obtained with a heavy-weight dumbbell (9 kg), volunteers were able
                                  to accomplish fewer repetitions and fewer sets in total (see row 4 of Table 2). This resulted
                                  in short recording sessions with fewer data entries however, momentum changes were
                                  not captured clearly throughout the exercise because volunteers reached fatigue quickly.
                                  We found the results obtained with medium-weight dumbbells (4.5 kg) to be the best
                                  compromise between the recording time length and the momentum changes as volunteers
                                  reached fatigue more gradually. Volunteers were able to perform 16 repetitions per set,
                                  which each set taking on average 1 min and 17 s to complete (see row 3 in Table 2). In
                                  addition, previous work found that a similar dumbbell weight (4.5 kg) provided the best
                                  trade-off between recording sessions length and the occurrence of fatigue on exercises [22].

                                  Table 2. The nominated dumbbells weights for the data collection process, the values reported
                                  are averages.

                                     Weight (∼kg)          Repetitions         Sets      Repetitions/Set         Completion Time
                                          1.1 kg               2960              60            42.0                  2 Min, 30 S
                                          2.2 kg               2417              79            31.0                  1 Min, 45 S
                                          4.5 kg               1580             100            16.0                  1 Min, 17 S
                                           9 kg                860               60            9.0                   1 Min, 10 S
Sensors 2021, 21, 1070 5 of 21
The second challenge we encountered is the subjectivity of RPE, where volunteers
may rate their exertion level differently based on their feeling of exhaustion. This issue
may lead them to inaccurately report their levels of exertion throughout the exercises.
The third challenge is the familiarity with RPE: Some volunteers were not familiar with
the RPE before the data acquisition sessions. This may lead them to rate their exertion
level incorrectly, even worsening the effects of the previous challenge if not appropriately
addressed. To address both of these challenges, we apply a min-max normalization
to the RPE value based on the current set to account for subjective differences in RPE.
For illustration, we set the minimum value based on the RPE reported after the warm-up,
which often ranges from 10 to 12. Then, we set the maximum value to the highest RPE on
the Borg scale, which is 20. We use such a fixed value as the maximum RPE because if we
use the values reported from the set, it will cause the current label to depend on future
data, which is not methodologically sound. The longitudinal nature of the data acquisition
sessions also helped participants to become more familiar with the scale as they performed
more sets. Therefore their use of the RPE potentially evolved across consecutive sets.
3. Data Processing and Experiment Setup
In this section, we describe how we prepared our dataset through data processing and
feature extraction. Then, we describe how we set up our experiment to evaluate the impact
of fatigue in HAR models.
3.1. Data Processing and Feature Extraction
Our collected data consists of an accelerometer, gyroscope, and magnetometer read-
ings, where each reading is composed of the three orthogonal axes from each sensor type.
These signals were converted to the three-dimensional Cartesian coordinates (x, y, z) for
better representation. At the end of this conversion, our data contains a total of nine signals:
The 3-axis of accelerometer, gyroscope, and magnetometer.
We illustrate in Figure 2, how we extracted and labeled repetitions for each volunteer.
In the figure, we exemplify the three main steps to extract and label repetitions, by using
an example of a fifth set from the gyroscope’s X-axis. The first step is the data fetching,
where we fetch volunteer’s data, including their IMU and RPE. In this example, we chose
the gyroscope’s X-axis because it best visualizes the repetitions however, we applied the
same process for all 3-axis of accelerometer, gyroscope, and magnetometer. The second
step is the set extraction, where we extract all five sets of concentration curls along with
their corresponding RPE values reported by the volunteer. We illustrate the extraction of
the fifth set because it often has the highest ratio of fatigue and non-fatigue repetitions.
The third step is the repetition labeling, where we look closely into all exercise sets to find
two distinct groups of non-fatigue and fatigue repetitions. The non-fatigue repetitions
are highlighted by the red thick border, while the blue dashed border highlights the
fatigue ones. The troughs indicate that the volunteer has reached the release position,
while peaks indicate that they have reached the contraction position, as demonstrated
in Section 2.1. A recent work on quantifying muscle fatigue has selected an RPE value
of 16 as the threshold of true fatigue to estimate the declines in muscle strength during
tasks [23]. Therefore, we extract and label each repetition manually according to the RPE
values reported for the set, where we label repetitions with reported RPE values larger than
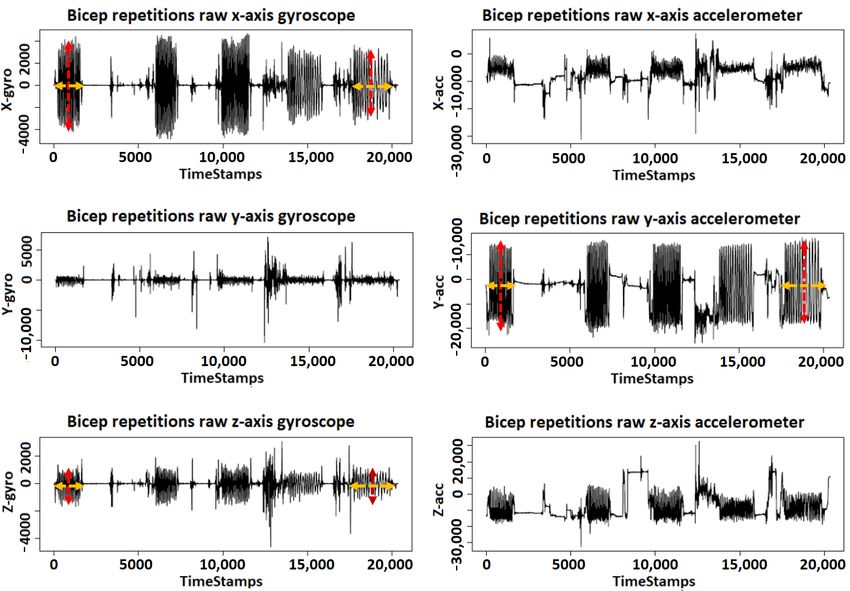
16 as fatigue. Figure 3a shows a zoomed-in look on a group of eight non-fatigue repetitions
from the fifth set, where each non-fatigue repetition can be clearly extracted between two
troughs. Similarly, we extract a complete fatigue repetition between two troughs, as shown
in Figure 3b. We observe that a non-fatigue repeat is relatively symmetrical on the other
hand, the fatigue repeats have a relatively positive skew, as shown in Figure 3. We repeat
the same process for all sets. The used IMU has a synchronized 3-axis accelerometer,
gyroscope, and magnetometer, which allows us to use the same timestamps from the
gyroscope’s X-axis to extract and label repetitions for all the remaining signals (other axes
of gyroscope, accelerometer, and magnetometer). After we processed all data from 20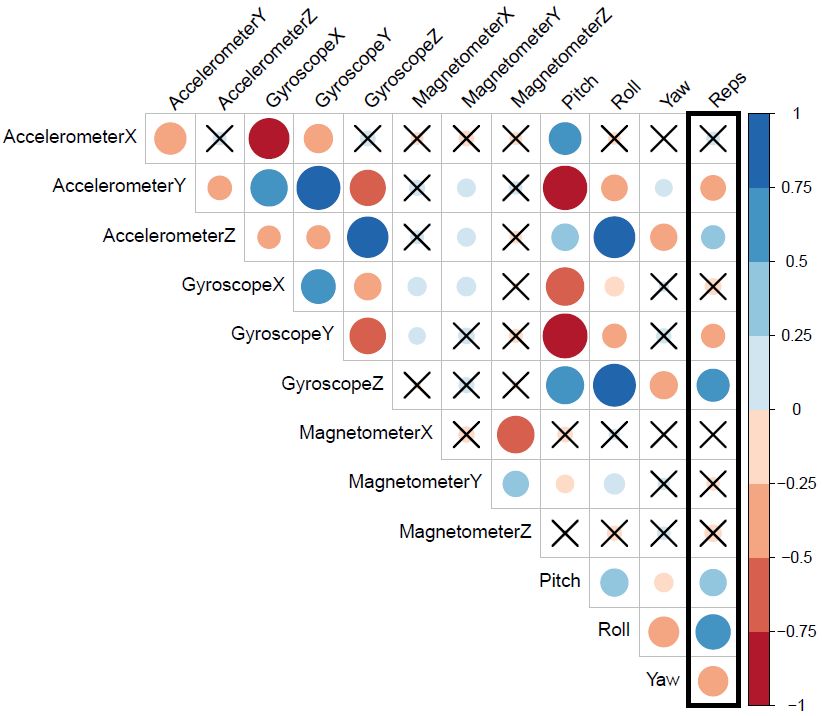
Sensors 2021, 21, 1070                                                                                                          6 of 21

                                   volunteers, we were able to extract a total of 3000 repetitions recorded from nine time-series
                                   signals with one IMUs.

              Figure 2. A visual example of extracting and labeling repetitions of the fifth set from the gyroscope’s X-axis.

                                                                    (a)

                                                                      (b)
      Figure 3. Raw bicep repetitions data collected from the X-axis of the gyroscope. Red thick boxes highlight repetitions
      without fatigue, while blue dashed boxes highlight repetitions with fatigue. (a) Extracting non-fatigue bicep concentration
      curl repetitions from the fifth set. (b) Extracting fatigue bicep concentration curl repetitions from the fifth set.

                                         To have a better understanding of the prevalence of fatigue in our dataset, we quantify
                                   the fatigue repetitions across the five sets. Then, we calculate the average of fatigue
                                   repetition share per volunteer, as shown in Figure 4. The volunteers did not report any
                                   fatigue repetitions at the warmup set thus, the share of fatigue for this set is 0%. However,
                                   in the first set, 19 volunteers reported the last repetition as fatigue, which represents 1 out of
                                   15 repetitions (6.6%), while 1 volunteer reported no fatigue (0%). Hence, the average share
                                   of fatigue repetitions in the first set was reported at 6.2%. As we see in Figure 4, the average
                                   share of fatigue repetitions increases at each subsequent set as volunteers become more
                                   progressively tired, reaching an average of 56.0% of fatigue repetitions per volunteer in the
                                   fifth set.

                Figure 4. A visualization of the weighted average of fatigue shares per exercise sets in the collected data.

                                       After we extract all repetitions individually, we extract 27 features by computing
                                   the mean, Mean Absolute Deviation (MAD), and Standard Deviation (SD) for all nine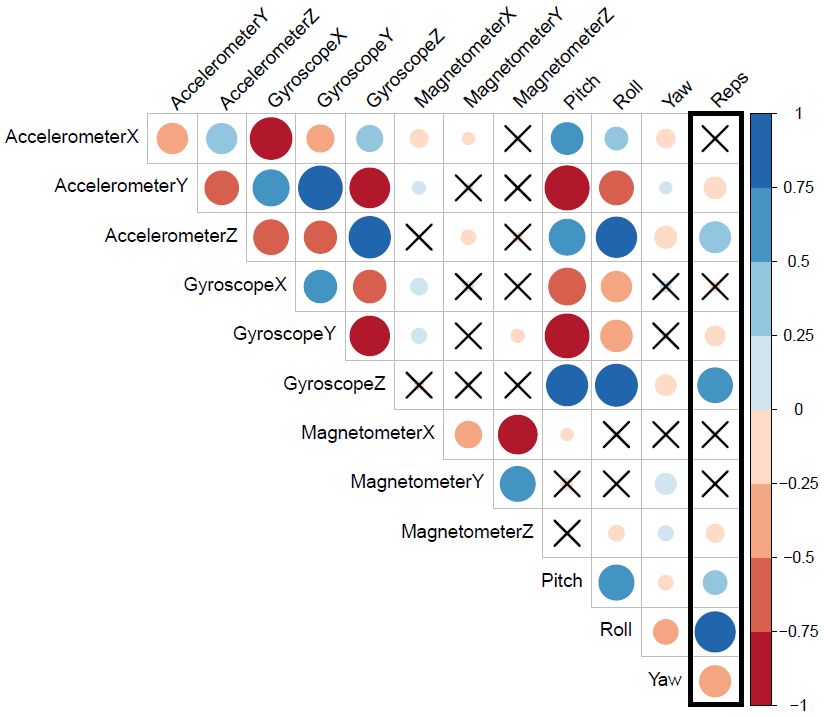
Sensors 2021, 21, 1070                                                                                           7 of 21

                         signals. We also computed three extra signals from the gyroscope: Roll, pitch, and yaw by
                         integrating angular velocity over time to give us the movement angle. Then, we extract
                         nine extra features from these signals so that we have a total of 36 extracted features. We
                         select these features primarily because they have been commonly used in previous works
                         to detect human activities and have shown to yield good performance [8,24,25]. In addition,
                         previous work have reported that these features perform well in displaying signal changes
                         over a span of time during an activity to spot possible anomalies [26]. After this entire
                         feature engineering step, we were able to extract 36 features from 3000 repetitions recorded
                         from nine time-series signals.

                         3.2. Experiment Setup
                               In this work, we study fatigue’s direct and indirect impact on HAR systems: The
                         changes that the presence of fatigue caused on the raw collected data, the impact of fatigue
                         on the significant features, and the performance of machine learning models in a dataset
                         with the presence of fatigue. In Figure 5, we show an overview of the methodology used in
                         this study. We select biceps concentration curls as an activity for this work and collected
                         our dataset from 20 volunteers using an IMU attached to their wrists. We manually labeled
                         each repetition in our dataset as containing fatigue or not containing fatigue. To study the
                         impact of including fatigue in our dataset, we group all the non-fatigue repetitions into
                         a subset. Then, we extract two sets of features, a feature set from the complete dataset
                         and another feature set from the non-fatigue subset. After that, we compare the two sets
                         of extracted features to find whether fatigue affects the number of significant features
                         in detecting biceps concentration curls. Next, we train five machine learning models to
                         detect biceps concentration curls to observe their performance before and after the presence
                         of fatigue. The goal of this step is to evaluate how fatigue may affect the models when
                         recognizing human-activity.

                         Figure 5. Overview of the wearable approach based human activity recognition system.

                              Machine learning classification models are often reported in comparative works
                         with high-performance rates in detecting human activities using wearable IMU on the
                         wrist [27–29]. So given the fact that these models were effective in detecting human activity
                         using similar data to what we collected, we select five of these models to detect bicep
                         concentration curl repetitions [30]. The first model is the Generalized Linear Models
                         (GLM) which has been adopted to analyze and count the number of walking steps in a
                         previous study [31]. The second model is the Logistic Regression (LR) which has been
                         used to analyze and detect human activities [32]. The third model is Random Forest (RF),
                         which has been used to detect and classify human actions using wearable motion sensor
                         networks [33]. The fourth model is the Decision Trees (DT) which has been used to count
                         and classify ambulatory activities using eight plantar pressure sensors within smart shoes
                         in a previous study [34]. The fifth model is the Feedforward Neural Network (FNN)
                         which has been used to detect and count repetitions for complex physical exercises [35].
                         Furthermore, we took into consideration two approaches for each model, the subject-
                         specific and cross-subject approaches:
                         •    Subject-specific model: The model is trained to fit an individual or individuals with the
                              same fatigue response pattern, however, it requires previous data from each subject;
                         •    Cross-subject model: The model is trained to fit a group of individuals and utilize
                              their previous data to fit new users.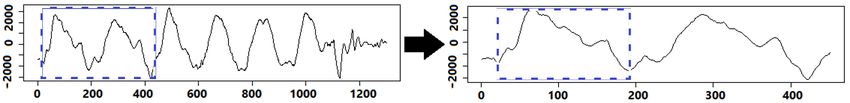
Sensors 2021, 21, 1070                                                                                           8 of 21

                               A cross-subject model is optimized for working with a large number of users, which is
                         more realistic in real-world applications. On the other hand, a subject-specific model that
                         is tailored to individual data tends to outperform the cross-subject model.

                         4. Experiment Evaluation
                              Our main goal in this section is to study the impact of fatigue on the collected data,
                         the number of significant features, and the models’ performance. In addition, we evaluate
                         the impact of fatigue on subject-specific and cross-subject models. Specifically, we address
                         the following research questions:
                         •    RQ1:   How does fatigue impact the collected data?
                         •    RQ2:   What impact can fatigue impose on the extracted features?
                         •    RQ3:   What is the impact of fatigue on subject-specific biceps repetitions models?
                         •    RQ4:   What is the impact of fatigue on cross-subject biceps repetitions models?
                              Next, we detail the motivation, approach, and the findings for each research question.

                         4.1. RQ1: How Does Fatigue Impact the Collected Data?
                              Motivation: We believe that fatigue impacts the collected data by changing its patterns,
                         leading to a snowball effect, affecting the extracted features and HAR models’ performance.
                         Hence, we want first to capture the data pattern changes, which might occur during the
                         data collection process.
                              Approach: To address this research question, we look into the data provided by the
                         IMU that contains the 3-axis gyroscope and accelerometer. We excluded the magnetometer
                         for simplicity as it did not show any significant changes in the magnetic field regarding
                         direction or strength during the exercise. We started with a visualization of the impact of
                         fatigue on collected data to evaluate the data pattern changes. Figure 6 shows an example
                         of the five sets of biceps repetitions using the gyroscope and the accelerometer signals.
                         The X-axis represents the vertical displacement, which is the distance between the highest
                         and lowest positions of the volunteer’s hand during bicep extension and flexion. The Y-axis
                         represents the horizontal displacement, which is the sideways vibration of the volunteer’s
                         hand during bicep extension and flexion. The Z-axis represents the depth displacement,
                         which is the farthest and nearest positions of the volunteer’s hand from their body during
                         bicep extension and flexion. We select the X-axis from the gyroscope and Y-axis from the
                         accelerometer because they provide the best visualization for the angular velocity and
                         sideways vibration of the volunteer’s hand. Similarly, we showcase the Z-axis from the
                         gyroscope as it provides the best visualization of the farthest and nearest positions of the
                         volunteer’s hand. We use the first set of bicep repetition as a reference set to comparatively
                         measure the data pattern changes. The rationale behind this is that the first set usually
                         contains the least number of fatigue repetitions. Therefore, as the fatigue accumulates in
                         later sets, we would be able to differentiate the changes in the data patterns. The first set
                         also always contains 15 biceps repetitions for all of the 20 volunteers.
                              We look for data pattern changes along the horizontal axis which indicates the changes
                         in completion time whereas the vertical axis indicates the changes in angular velocity
                         according to muscular endurance [36]. To analyze the data pattern changes in the horizontal
                         axis, we measured the time required to complete the first set of biceps repetitions for
                         each volunteer, which is the time interval from the 1st repetition until the end of the
                         15th repetition. We repeated the same approach to measure the completion time of the
                         remaining sets separately. Then, we calculate the difference in completion time between
                         each set compared to the first set. To analyze the data pattern changes in the vertical axis,
                         we measured the absolute magnitude of each repetition in the first set to calculate the
                         muscular endurance [36] during the first set of biceps repetitions. We repeated the same
                         approach to measure the muscular endurance for the remaining sets separately. Then, we
                         calculate the drop in muscular endurance between each set compared to the first set.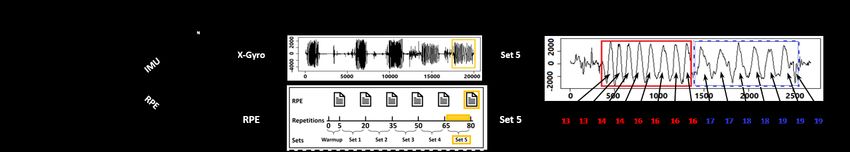
Sensors 2021, 21, 1070                                                                                              9 of 21

                         Figure 6. A visualization of the impact of fatigue on collected data.

                               Result: Table 3 shows the increase in completion time for each set in relation to the first
                         set. In the 2nd set, the average increase in completion time is 1.7%, which is considerably a
                         small change to the 1st set. The reason is that the 2nd set is usually the introductory stage
                         of fatigue, where fatigue occurs for the first time at the last 1 or 2 repetitions. When we
                         look at the 3rd set, we found the average increase in completion time to have increased to
                         8.1%. At the 4th set, volunteers take on average 14.3% more time to finish their exercises,
                         compared to the time they took in the 1st set. Comparing the 4th set to the 3rd set, the 4th
                         set contains almost twice the number of fatigue repetitions than the 3rd set, resulting
                         on substantial increase in the time to complete metric, from 8% to 14%. At the 5th set,
                         we found that the average increase in completion time is 31.0%, more than twice the
                         increase observed in the 4th set. The reason is that the 5th set contains at least eight fatigue
                         repetitions, which indicates that fatigue impacts later sets to a much larger extent, slowing
                         down bicep movements and increasing the time completion for the set. As a result, fixed-
                         size and non-overlapping windows will no longer be suitable to capture full repetitions
                         because of its narrow fit, especially, at the 4th and 5th sets.

                         Table 3. The increase in the time to complete a set compared to the 1st set.

                             Axis-Sensor          2nd Set           3rd Set          4th Set        5th Set     Avg.
                             X-Gyroscope           +2.0%            +6.0%            +17.0%         +33.0%    +14.5%
                             Z-Gyroscope           +1.7%            +11.0%           +15.0%         +45.0%    +18.2%
                           Y-Accelerometer         +1.5%            +7.4%            +11.0%         +15.0%    +8.7%
                               Avg./set            +1.7%            +8.1%            +14.3%         +31.0%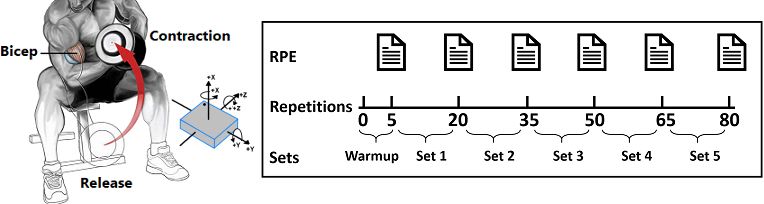
Sensors 2021, 21, 1070                                                                                               10 of 21

                              In Table 4, we present the changes of muscular endurance for each of the five sets as
                         the fatigue accumulates during repetitions in the later sets. It is possible to measure the
                         muscular endurance using the angular velocity from the gyroscope [36] rather than using
                         the accelerometer. Therefore, we observe that fatigue decreases the muscular endurance
                         according to the X- and Z-axes from the gyroscope by an average of −2.4% and −3.9%,
                         respectively. However, we do not observe a substantial decrease on the muscular endurance
                         using the Y-axis from the accelerometer, with a small average change of only 0.4%. Overall,
                         we observe that the average muscular endurance decreases in the later sets as the fatigue
                         accumulates in the repetitions. For example, the 2nd and 3rd sets maintain a muscular
                         endurance similar to the compared 1st set. However, the muscular endurance decreases
                         by an average of 5.5% in the 4th set, and 4.1% in the 5th set, as fatigue accumulates over
                         time. This could negatively impact data filtering, especially in the case of peak filtering,
                         because such a filter may exclude a complete bicep repetition if it did not meet the peak
                         threshold, especially, at the 4th and 5th sets.

                         Table 4. The change in muscular endurance represented in vertical shrinks, compared to the 1st set.

                            Axis-Sensor          2nd Set          3rd Set         4th Set         5th Set         Avg.
                            X-Gyroscope           +0.7%           +1.2%           −6.3%           −5.2%          −2.4%
                            Z-Gyroscope           +0.5%           +1.7%           −10.4%          −7.5%          −3.9%
                          Y-Accelerometer         +0.6%           +0.3%           +0.3%           +0.4%          0.4%
                              Avg./set            +0.6%           +1.1%            −5.5%          −4.1%

                         4.2. RQ2: What Impact Can Fatigue Impose on the Extracted Features?
                               Motivation: We believe that if fatigue affects the collected data, it may affect the
                         extracted features from the same data. In other words, some features may appear to be
                         significant in detecting biceps repetitions without fatigue, but become less significant at
                         later sets, where fatigue often occurs. We think that a factor such as fatigue can deform the
                         patterns of these features reducing their correlation hence, some extracted features may be
                         more sensitive to fatigue than others.
                               Approach: To address this research question, we have to analyze the effects of fatigue
                         on the extracted features. To that aim, we extract three main features from our complete
                         dataset and contrast them with the features extracted in the non-fatigue subset. Our goal
                         is to investigate whether fatigue could influence the number of significant features of a
                         HAR model. The three main features are mean, MAD, and SD. Our complete dataset
                         and the non-fatigue subset contain 12 data signals where 9 data signals are collected from
                         the 3-axes of gyroscope, accelerometer, and magnetometer; 3 data signals represent the
                         rotations on X-, Y-, and Z-axes which are roll, pitch, and yaw. In total, we have 36 extracted
                         features in our complete dataset and the non-fatigue subset. We use Spearman’s rank
                         correlation coefficient with a significance allowance of 0.1 to show how these extracted
                         features correlate with bicep repetitions [37].
                               Figure 7 presents the correlation matrix for 12 mean features and the bicep repetitions.
                         The positive correlations are displayed in blue and negative correlations are presented in
                         red. The color intensity and the size of the circle are also proportional to the correlation
                         coefficients whereas, the insignificant correlations are marked with ×. Figure 7a shows
                         that bicep repetitions have significant correlations with 9 out of 12 mean features extracted
                         from the non-fatigue subset. These 9 significant features are (X,Y,Z)-Accelerometer, (X,Y,Z)-
                         Gyroscope, pitch, roll, and yaw. On the other hand, Figure 7b shows that bicep repetitions
                         have significant correlations with 7 out of 12 mean features extracted from our complete
                         dataset where fatigue exists during the exercise. These 7 significant features are (Y,Z)-
                         accelerometer, (Y,Z)-gyroscope, pitch, roll, and yaw. We can observe two impacts of fatigue
                         on extracted features. First, some mean features correlations became insignificant to bicep
                         repetitions such as X-accelerometer and X-gyroscope. Second, an overall drop in the
Sensors 2021, 21, 1070 11 of 21
correlation coefficient values for all mean features, as presented by the faint color intensity
and the shrink of circle sizes.
(a) (b)
Figure 7. Graphical display of the differences in the correlation matrices of the 12 extracted features (mean) and the
bicep repetitions with and without fatigue. (a) Correlation matrix of the 12 mean features and the bicep repetitions in the
non-fatigue subset. (b) Correlation matrix of the 12 mean features and the bicep repetitions in our complete dataset.
To strengthen the evidence that points to fatigue as the potential cause of these
impacts, we believe that similar observations should exist for MAD and SD features.
Figure 8 presents the correlation matrix for 12 MAD features and the bicep repetitions in
our complete dataset and the non-fatigue subset. Figure 8a shows that bicep repetitions
have significant correlations with 10 out of 12 MAD features extracted from the non-
fatigue subset. On the other hand, Figure 8b shows that bicep repetitions have significant
correlations with seven out of 12 MAD features extracted from our complete dataset.
Again, we encounter a similar effect to the aforementioned ones in extracted features
(mean). Some MAD features correlations became insignificant to bicep repetitions such
as X-accelerometer, Y-magnetometer, and yaw. However, we did not observe a major
drop in all MAD features’ correlation coefficient values, only the newly three mentioned
insignificant suffered from a drop in the correlation coefficient values.
Figure 9 presents the correlation matrix for 12 SD features and the biceps repetitions
in our complete dataset and the non-fatigue subset. Figure 9a shows that bicep repetitions
have significant correlations with 10 out of 12 SD features extracted from the non-fatigue
subset. On the other hand, Figure 9b shows that bicep repetitions have significant corre-
lations with eight out of 12 SD features extracted from our complete dataset. Once more,
some SD features correlations became insignificant to bicep repetitions such as the X-axis
for both accelerometer and gyroscope. We also observe a slight drop in the correlation
coefficient values for all SD features, as presented by the faint color intensity and the shrink
of circle sizes. At this point, we clearly observe the same recurring effects when fatigue is
introduced to the data, which indicates that fatigue impacts the significant features of a
HAR model.
Table 5 shows the features extracted from each dataset. In RQ1, we pointed out that
the X-axis represents the vertical displacement, which has the largest angle of movement
and linear acceleration. However, fatigue often affects acceleration greatly compared to
the angle of movement due to the movement nature of the biceps muscle [38]. Therefore,
changes on the linear acceleration, measured by the accelerometer, affected the significance
of its extract features. On the other hand, the angular velocity, measured by the gyroscope,Sensors 2021, 21, 1070 12 of 21
remains relatively steady because of the fixed angle of movement of bicep muscles. Regard-
ing the low number of significant features from the magnetometer, we believe that fatigue
did not impact that feature. But mostly, the magnetometer is not an optimal sensor as it
did not reveal any significant characteristics readings about the magnetic field’s direction
or strength, as previously mentioned in RQ1. Most of the features extracted from the
magnetometer were insignificant.
(a) (b)
Figure 8. Graphical display of the differences in the correlation matrices of the 12 extracted features (MAD: Mean Absolute
Deviation) and the bicep repetitions with and without fatigue. (a) Correlation matrix of the 12 MAD features and the
bicep repetitions in the non-fatigue subset. (b) Correlation matrix of the 12 MAD features and the bicep repetitions in our
complete dataset.
(a) (b)
Figure 9. Graphical display of the differences in the correlation matrices of the 12 extracted features (SD: Standard Deviation)
and the bicep repetitions with and without fatigue. (a) Correlation matrix of the 12 SD features and bicep repetitions in the
non-fatigue subset. (b) Correlation matrix of the 12 SD features and the bicep repetitions in our complete dataset.Sensors 2021, 21, 1070 13 of 21
Table 5. Table of the significant (X) and insignificant (×) features extracted from both the non-fatigue
subset and complete dataset; the changed features are in highlighted bold.
Non-Fatigue Subset Complete Dataset
Mean MAD SD Mean MAD SD
X-axis X X X × × ×
Acc.
Y-axis X X X X X X
Z-axis X X X X X X
X-axis × × × × × ×
Sensors and Axes
Mag.
Y-axis × X × × × ×
Z-axis × × X × × X
X-axis X X X × X ×
Y-axis X X X X X X
Gyro.
Z-axis X X X X X X
Roll X X X X X X
Pitch X X X X X X
Yaw X X X X × X
Result: Our findings show that fatigue significantly impacts the extracted features,
by hindering their correlation coefficient values to the extent of turning some significant
features into insignificant ones. We were able to extract 9 mean, 10 MAD, and 10 SD
features from the none-fatigue subset for a total of 29 significant features with a significance
allowance of 0.1. However, once the fatigue was introduced in the data, we were only
able to extract 7 mean, 7 MAD, and 8 SD features for a total of 22 significant features,
as shown in Table 5. This indicates that fatigue, once introduced in the dataset, reduced
the significance of 7 features (24% of total significant features).
4.3. RQ3: What Is the Impact of Fatigue on Subject-Specific Biceps Repetitions Models?
Motivation: Given that fatigue impacted the extracted features, we want to investigate
how it could affect the biceps detection models’ performance. The presence of fatigue
has the potential to decrease the model’s performance in recognizing human activities.
Therefore, we start with subject-specific models to examine their ability to detect biceps
concentration curl in a dataset with a progressive inclusion of fatigue repetitions.
Approach: To address this research question, we use the five detection models men-
tioned in Section 3.2. These models use the 22 significant features extracted from our
complete dataset to eliminate weak features that turn to insignificant once fatigue occurs.
We use these models to detect biceps repetitions in our dataset. Then, we calculate the
accuracy using the confusion matrix shown in Table 6, where non-repetition represents an
incomplete repetition or any random movement, and repetition represents a completed
repetition, whether it contains fatigue or not. We perform six 10-fold cross-validation runs
using the non-fatigue subset where we replace 10% of the non-fatigue repetitions in the
subset with fatigue repetitions from our complete dataset per experiment. Note that all
models are trained and tested with similar levels of fatigue to simulate a realistic use-case.
Since fatigue is a natural consequence of any physical activity, it is expected to occur in
the training data of models as well as when a final users use wearable devices for HAR.
These runs are done over all participants, and then averaged, as shown in Table 7. This
allows us to observe the effects of fatigue on the detection models gradually, as more
fatigue repetition is added to the dataset. We use the first 10-fold cross-validation run as
a reference point because there are no fatigue repetitions in the dataset to hinder models’
performance. Then, we calculate the accuracy (1), precision (2), recall (3), and F1 (4) for
each run. Table 7 shows the performance averages for the six 10-fold cross-validation
runs over all participants per model. Each 4 F1* row shows the difference in the model’s
performance, compared to the performance obtained in the first run (no fatigue).Sensors 2021, 21, 1070 14 of 21
True( Repeat + NonRepeat)
Accuracy = (1)
True( Repeat + NonRepeat) + False( Repeat + NonRepeat)
True( Repeat)
Precision = (2)
True( Repeat) + False( Repeat)
True( Repeat)
Recall = (3)
True( Repeat) + False( NonRepeat)
2 ∗ Precision ∗ Recall
F1 = (4)
Precision + Recall
Table 6. Confusion matrix for biceps repetitions.
Actual
Repetition Non-Repetition
Repetition TRUE Repeat FALSE Repeat
Detect
Non-Repetition FALSE Non-Repeat TRUE Non-Repeat
Table 7. The performance averages for subject-specific models to detect biceps repetitions throughout
the incremental replacement of fatigue repetitions.
% of Fatigue Repetitions in Dataset
0% * 10% 20% 30% 40% 50%
Precision 0.94 0.89 0.78 0.71 0.65 0.44
Recall 0.91 0.81 0.61 0.60 0.52 0.37
GLM
Accuracy 0.90 0.84 0.80 0.76 0.63 0.45
F1 0.92 0.85 0.68 0.67 0.58 0.40
%4 F1* - −8% −26% −30% −38% −57%
Precision 0.90 0.85 0.71 0.63 0.49 0.40
Recall 0.81 0.73 0.53 0.44 0.55 0.36
Accuracy 0.88 0.83 0.76 0.62 0.57 0.49
LR
F1 0.85 0.79 0.61 0.52 0.52 0.38
%4 F1* - −9% −29% −40% −41% −56%
Precision 0.88 0.82 0.68 0.60 0.56 0.45
Recall 0.78 0.70 0.52 0.50 0.43 0.39
Accuracy 0.85 0.81 0.75 0.49 0.29 0.19
Models
RF
F1 0.83 0.76 0.59 0.55 0.49 0.42
%4 F1* - −10% −30% −34% −42% −50%
Precision 0.86 0.75 0.66 0.57 0.46 0.44
Recall 0.70 0.64 0.57 0.43 0.40 0.40
Accuracy 0.81 0.77 0.73 0.61 0.46 0.24
DT
F1 0.77 0.69 0.61 0.49 0.43 0.42
%4 F1* - −11% −21% −36% −45% −47%
Precision 0.98 0.89 0.76 0.68 0.58 0.50
Recall 0.91 0.79 0.71 0.65 0.60 0.48
FNN
Accuracy 0.99 0.91 0.86 0.80 0.73 0.67
F1 0.94 0.84 0.73 0.66 0.59 0.49
%4 F1* - −10% −21% −31% −38% −49%
* Reference to the first set which does not include fatigue. GLM: Generalized Linear Models, LR: Logistic
Regression, RF: Random Forest, DT: Decision Tree, and FNN: Feedforward Neural Network
Result: Our findings show that the more fatigue added to the dataset, the steeper the
decline in performance of the five models. In fact, Table 7 shows that replacing as little
as 10% of the repetitions with fatigue repetitions can drop the GLM models’ performance
by 8%, and 11% for DT. If we replace an additional 10% of the repetitions with fatigueSensors 2021, 21, 1070 15 of 21
repetitions, all models’ performance decrease by at least 21% (FNN and DT). The decrease
in the performance can be as severe as 30% in the RF model. Such findings indicate that,
for some models (e.g., GLM, LR, and RF), it only takes 20% of fatigued repetitions to
decrease a model’s performance by more than 20%. The impact in the model’s performance
is even more significant when we reach to 40% and 50% of fatigue repetitions. With half
the repetitions containing fatigue, the models lose between 47% (DT) to 57% (GLM) of its
original performance, which may compromise the reliability of HAR systems that do not
take fatigue properly into account.
4.4. RQ4: What Is the Impact of Fatigue on Cross-Subject Biceps Repetitions Models?
Motivation: We observed that the impact of fatigue on subject-specific models were
significant, hindering the performance of models by at least 20% when fatigue is present
in a quarter of all repetitions. We believe cross-subject models may be similarly affected,
perhaps even to a greater extent, given that these models tend to underperform the subject-
specific models. Hence, we assess the impact of fatigue on the generality of the models and
the ability to detect biceps repetitions across different subjects.
Approach: Our approach used to answer RQ4 is similar to RQ3. We use the 22 sig-
nificant features extracted from our complete dataset and use the five detection models
aforementioned in Section 3.2. We perform six Leave-One-Out Cross-Validations (LOOCV)
runs where K equals the number of volunteers, K = 20. Figure 10 shows a partial represen-
tation of the six LOOCV runs with K = 20 for using the data of 20 volunteers individually.
Each LOOCV run consists of 20 iterations, in the 1st iteration, we use the data from 19
volunteers to train our models then use the 20th volunteer’s data to test the models. At last,
in the 20th iteration, we should have used all volunteers data for testing except the 1st
volunteer therefore, we train the model using all the 19 volunteers dataset then, used the
1st volunteer’s data for testing. We calculate the precision, recall, accuracy, and F1-score
per iteration then report the averages. We repeat the LOOCV run after we replace 10% of
each volunteer’s data with fatigue repetitions from each individuals data, recursively. We
use the first LOOCV run as a reference point because there are no fatigue repetitions in the
individuals data to affect the models’ performance. Similarly to the approach used in RQ3,
all models are trained and tested with the same share of fatigue repetitions, to simulate a
realistic use-case. Then, we calculate the accuracy (1), precision (2), recall (3), and F1 (4) for
each run. Table 8 shows the performance averages for the six LOOCV runs per model. Each
4 F1* rows show the comparison of the model’s performance against the performance
obtained in the first run (no fatigue repetitions).
Figure 10. A partial representation of the six Leave-One-Out Cross-Validations (LOOCV) with K = 20 and different
percentages of fatigue.Sensors 2021, 21, 1070 16 of 21
Result: Similar to RQ3, our finding indicates fatigue significantly impacts the perfor-
mance in all five models. Table 8 shows that replacing as little as 10% of the repetitions
with fatigued ones can drop a model’s performance by 6% for RF, and down to 13% for
GLM and LR. If we replace an additional 10% of the repetitions with fatigued ones, the
models’ performance decrease by 20% for FNN and DT, and down to 25% for LR. Once the
fatigue reaches 30% of repetitions, we see a sharp decrease in all models by at least 30%.
This trend continues, as once the fatigue repetitions reach 50% of the dataset, the HAR
models’ performance decrease by at least 41%. We observe a negative linear effect in some
models’ performance as the fatigue increases. For instance, the performance of DT models
decreases by an average of 10% for every 10% increase of fatigue in the dataset.
Table 8. The performance averages for cross-subject models to detect biceps repetitions throughout
the incremental replacement of fatigue repetitions.
% of Fatigue Repetitions in Individuals Data
0% * 10% 20% 30% 40% 50%
Precision 0.85 0.73 0.60 0.52 0.45 0.41
Recall 0.80 0.71 0.72 0.50 0.32 0.31
GLM
Accuracy 0.87 0.71 0.66 0.52 0.41 0.33
F1 0.82 0.72 0.65 0.51 0.37 0.35
%4 F1* - −13% −21% −38% −55% −57%
Precision 0.87 0.79 0.66 0.53 0.45 0.40
Recall 0.78 0.65 0.58 0.41 0.36 0.30
Accuracy 0.82 0.75 0.66 0.52 0.43 0.29
LR
F1 0.82 0.71 0.62 0.46 0.40 0.34
%4 F1* - −13% −25% −44% −51% −58%
Precision 0.78 0.71 0.64 0.58 0.5 0.46
Recall 0.67 0.65 0.51 0.45 0.43 0.39
Accuracy 0.79 0.73 0.58 0.43 0.39 0.21
Models
RF
F1 0.72 0.68 0.57 0.51 0.46 0.42
%4 F1* - −6% −21% −30% −36% −41%
Precision 0.78 0.73 0.64 0.53 0.45 0.44
Recall 0.71 0.63 0.55 0.41 0.41 0.32
Accuracy 0.81 0.76 0.53 0.42 0.33 0.18
DT
F1 0.74 0.68 0.59 0.46 0.43 0.37
%4 F1* - −9% −20% −38% −42% −50%
Precision 0.90 0.81 0.73 0.66 0.58 0.57
Recall 0.84 0.75 0.66 0.55 0.48 0.46
FNN
Accuracy 0.95 0.87 0.81 0.74 0.53 0.49
F1 0.87 0.78 0.69 0.60 0.53 0.51
%4 F1* - −10% −20% −31% −40% −41%
* Reference to the first set which does not include fatigue.
5. Discussion
In this section, we discuss the findings from our four research questions. In RQ1,
our finding shows that fatigue can lead to changes in data patterns over time. A similar
finding to ours is shown in a previous work [39], which suggests a decrease in the mean
power frequency of the accelerometer readings trend with increasing biceps muscle fatigue.
The authors also reported that accelerometers should be used to sense skeletal muscle
vibrations, which can reduce the error of estimating fatigue up to 50%. Therefore, we
adopted a similar approach in RQ1, where we use a time series dataset collected using
an inertial sensor that includes accelerometers to observe data pattern changes along the
horizontal and vertical axes. In other words, this allows us to find a correlation between
fatigue and data pattern changes that occur horizontally related to completion time and
vertically associated with the muscular endurance and angular velocity.Sensors 2021, 21, 1070 17 of 21
In RQ2, we investigated the effects of the data pattern changes, associated with fatigue,
in the feature extraction outcome. Previous work [40] shows that muscle fatigue affects the
Electromyography (EMG) data signals collected from biceps by increasing the Root Mean
Square Error (RMSEs) of extracted features. Similarly, our findings show that fatigue can
hinder the correlation values of some of the extracted features to the extent of turning them
into insignificant features. However, if we look at this problem from another perspective,
we can label the extracted features as fatigue-resistant. Meaning, although fatigue existed
in the dataset, these features remain significant. As a result, we can develop a group
of fatigue-resistant features that can counter data pattern changes due to fatigue and
remain valuable to detect bicep activity such as biceps concentration curls. It is important
to mention, however, that these features are still affected by fatigue as their correlation
coefficient values drop, as previously mentioned in RQ2.
In RQ3, our findings show that the more fatigue is added to the dataset, the steeper
the decline in performance is on the five subject-specific models. Our findings show that
the impact of fatigue can indeed disrupt the models’ performance if not taken properly into
account. From the evaluated models, our results indicate that FNN outperforms all other
models in terms of precision, recall, accuracy, and F1-score in most cases. We did expect
the highest performance from FNN compared to other models as this occurred in previous
studies [41–44]. These studies show that neural networks have significantly better pattern
recognition compared to other machine learning models especially, when it comes to
periodic activities where extracted features inherit periodicity. Moreover, a popular reason
for FNN performance supremacy is its robustness against small-to-moderate changes in
the data. Other models, such as DT, has shown to be less robust to fatigue, as even smaller
data pattern changes can cause a large change in the structure of the tree.
In RQ3 and RQ4 we compare the performances of the subject-specific and the cross-
subject models. We observe a similar and significant performance loss in both models,
with a loss of more than 20% if the dataset contains 20% or more of fatigue repetitions. Once
again, the FNN has shown to be the most robust of the five evaluated models. This result
is corroborated by another related work [45], which reported that FNN maintained the
highest rate of accuracy in cross-subject experiments, when detecting fatigue in volunteers
driving their vehicles.
To further examine whether our approach adequately accounts for the impact of
fatigue, we repeat RQ3 and RQ4 using all features. We use all the 36 extracted features,
including the seven features that became insignificant due to the presence of fatigue. This
allows us to observe the performance of detection models using all features versus models
using only fatigue-resistant features. According to Tables 9 and 10, fatigue impacts a
model’s performance to an even greater extent compared to the models based on 22 fatigue-
resistant features presented in RQ3 and RQ4. This result corroborates with our previous
analyses, showing that the extraneous features are unlikely to contribute to detecting biceps
concentration curls when fatigue is present. It is important to highlight, however, that
models using all features do outperform the fatigue-resistant models when the presence of
fatigue is very low in the dataset (no fatigue or fatigue data at 10%).Sensors 2021, 21, 1070 18 of 21
Table 9. The performance averages for subject-specific models to detect biceps repetitions, using the
36 features, throughout the incremental replacement of fatigue repetitions.
% of Fatigue Repetitions in Dataset
0% * 10% 20% 30% 40% 50%
Precision 0.96 0.83 0.56 0.49 0.42 0.38
Recall 0.91 0.81 0.67 0.47 0.30 0.29
GLM
Accuracy 0.99 0.81 0.62 0.49 0.38 0.31
F136 0.94 0.82 0.61 0.48 0.35 0.33
%4 F136 * - −13% −35% −49% −63% -65%
Precision 0.95 0.86 0.60 0.47 0.37 0.33
Recall 0.85 0.71 0.53 0.37 0.29 0.24
Accuracy 0.89 0.82 0.60 0.46 0.35 0.24
LR
F136 0.90 0.78 0.56 0.41 0.33 0.28
%4 F136 * - −13% −37% −54% −64% −69%
Precision 0.94 0.65 0.59 0.50 0.42 0.38
Recall 0.80 0.60 0.47 0.39 0.36 0.32
Models
Accuracy 0.95 0.67 0.54 0.37 0.32 0.17
RF
F136 0.86 0.62 0.52 0.44 0.38 0.35
%4 F136 * - −28% −39% −49% −56% −59%
Precision 0.90 0.78 0.58 0.42 0.38 0.37
Recall 0.82 0.67 0.50 0.32 0.35 0.27
Accuracy 0.93 0.81 0.48 0.33 0.28 0.15
DT
F136 0.86 0.72 0.54 0.37 0.36 0.31
%4 F136 * - −15% −37% −57% −57% −63%
Precision 0.99 0.97 0.63 0.57 0.50 0.49
Recall 0.93 0.90 0.57 0.47 0.41 0.40
FNN
Accuracy 0.99 0.96 0.70 0.64 0.46 0.42
F136 0.96 0.93 0.60 0.52 0.45 0.44
%4 F136 * - −3% −38% −46% −53% −54%
* Reference to the first set which does not include fatigue.
Table 10. The performance averages for cross-subject models to detect biceps repetitions, using the
36 features, throughout the incremental replacement of fatigue repetitions.
% of Fatigue Repetitions in Dataset
0% * 10% 20% 30% 40% 50%
Precision 0.92 0.80 0.63 0.58 0.53 0.36
Recall 0.89 0.73 0.49 0.49 0.42 0.30
GLM
Accuracy 0.88 0.76 0.65 0.62 0.51 0.36
F136 0.91 0.76 0.56 0.53 0.47 0.33
%4 F136 * - −16% −39% −42% −48% −64%
Precision 0.82 0.76 0.63 0.56 0.40 0.33
Recall 0.74 0.65 0.47 0.39 0.45 0.29
Accuracy 0.80 0.74 0.68 0.55 0.46 0.40
LR
F136 0.78 0.70 0.54 0.46 0.42 0.31
%4 F136 * - −10% −30% −40% −46% −60%
Precision 0.85 0.77 0.59 0.52 0.46 0.37
Recall 0.76 0.66 0.45 0.44 0.36 0.32
Models
Accuracy 0.82 0.76 0.65 0.43 0.24 0.16
RF
F136 0.80 0.71 0.51 0.47 0.40 0.35
%4 F136 * - −11% −36% −41% −50% −57%
Precision 0.91 0.80 0.59 0.45 0.39 0.37
Recall 0.74 0.69 0.51 0.34 0.34 0.34
Accuracy 0.85 0.82 0.65 0.48 0.39 0.20
DT
F136 0.81 0.74 0.55 0.39 0.36 0.36
%4 F136 * - −9% −33% −52% −55% −56%
Precision 0.99 0.89 0.65 0.58 0.50 0.43
Recall 0.92 0.79 0.61 0.56 0.52 0.41
FNN
Accuracy 0.99 0.91 0.74 0.69 0.63 0.58
F136 0.96 0.83 0.63 0.57 0.51 0.42
%4 F136 * - −13% −34% −40% −47% −56%
* Reference to the first set which does not include fatigue.You can also read