The Implication of Chemotypic Variation on the Anti-Oxidant and Anti-Cancer Activities of Sutherlandia frutescens (L.) R.Br. (Fabaceae) from ...
←
→
Page content transcription
If your browser does not render page correctly, please read the page content below
antioxidants
Article
The Implication of Chemotypic Variation on the
Anti-Oxidant and Anti-Cancer Activities of
Sutherlandia frutescens (L.) R.Br. (Fabaceae) from
Different Geographic Locations
Samkele Zonyane 1 , Olaniyi A. Fawole 2,3 , Chris la Grange 1 , Maria A. Stander 4 ,
Umezuruike L. Opara 2 and Nokwanda P. Makunga 1, *
 1    Department of Botany and Zoology, Stellenbosch University, Private Bag X1, Merriman Avenue,
      Stellenbosch 7602, South Africa; 15965678@sun.ac.za (S.Z.); chrislag@sun.ac.za (C.l.G.)
 2    South African Research Chair in Postharvest Technology, Department of Horticultural Science, Stellenbosch
      University, Private Bag X1, Merriman Avenue, Stellenbosch 7602, South Africa; olaniyi@sun.ac.za (O.A.F.);
      opara@sun.ac.za (U.L.O.)
 3    Department of Botany and Plant Biotechnology, University of Johannesburg, P.O. Box 524, Auckland Park,
      Johannesburg 2006, South Africa
 4    Central Analytical Facility, Stellenbosch University, Private Bag X1, Merriman Avenue, Stellenbosch 7602,
      South Africa; lcms@sun.ac.za
 *    Correspondence: makunga@sun.ac.za; Tel.: +27-21-808-3061

 Received: 17 January 2020; Accepted: 1 February 2020; Published: 13 February 2020

 Abstract: Extracts of Sutherlandia frutescens (cancer bush) exhibit considerable qualitative and
 quantitative chemical variability depending on their natural wild origins. The purpose of this
 study was thus to determine bioactivity of extracts from different regions using in vitro antioxidant
 and anti-cancer assays. Extracts of the species are complex and are predominantly composed
 of a species-specific set of triterpene saponins (cycloartanol glycosides), the sutherlandiosides,
 and flavonoids (quercetin and kaempferol glycosides), the sutherlandins. For the Folin-Ciocalteu
 phenolics test values of 93.311 to 125.330 mg GAE/g DE were obtained. The flavonoids ranged
 from 54.831 to 66.073 mg CE/g DE using the aluminum chloride assay. Extracts from different sites
 were also assayed using the 2,2-diphenyl-1-picrylhydrazyl (DPPH• ) radical scavenging method and
 ferric reducing anti-oxidant power (FRAP) methods. This was followed by an in vitro Cell Titer-Glo
 viability assay of various ecotypes using the DLD-1 colon cancer cell line. All test extracts displayed
 anti-oxidant activity through the DPPH• radical scavenging mechanism, with IC50 values ranging
 from 3.171 to 7.707 µg·mL−1 . However, the degree of anti-oxidant effects differed on a chemotypic
 basis with coastal plants from Gansbaai and Pearly Beach (Western Cape) exhibiting superior activity
 whereas the Victoria West inland group from the Northern Cape, consistently showed the weakest
 anti-oxidant activity for both the DPPH• and FRAP methods. All extracts showed cytotoxicity
 on DLD-1 colon cancer cells at the test concentration of 200 µg·mL−1 but Sutherlandia plants from
 Colesburg (Northern Cape) exhibited the highest anti-cancer activity. These findings confirm that
 S. frutescens specimens display variability in their bioactive capacities based on their natural location,
 illustrating the importance of choosing relevant ecotypes for medicinal purposes.

 Keywords: cycloartane glycoside; flavonoids; LC-MS; metabolite profiling; terpene saponins;
 sutherlandioside; sutherlandin; cancer bush

Antioxidants 2020, 9, 152; doi:10.3390/antiox9020152                          www.mdpi.com/journal/antioxidants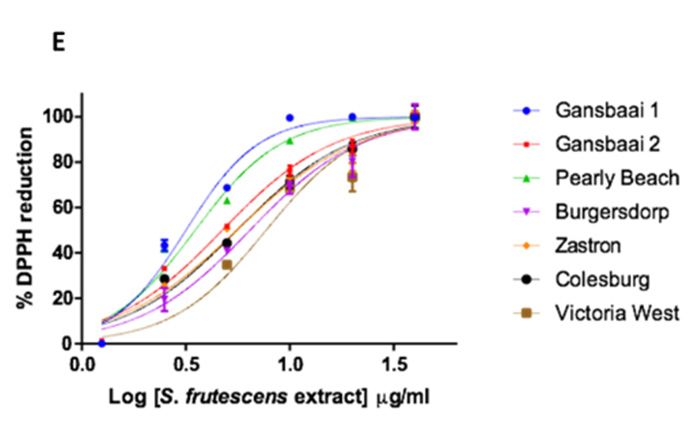
Antioxidants 2020, 9, 152                                                                            2 of 21

1. Introduction
      Sutherlandia frutescens (L.) (=Lessertia frutescens (L.) R.Br. (Fabaceae) has a complex chemistry that
contains a unique set of flavonoids and triterpene saponins amongst other chemical constituents [1].
Flavonoids, a phytochemical group of polyphenolic compounds, are recognized for health benefiting
effects exhibiting a diverse range of biological activities such as anti-oxidant, anti-inflammatory,
antimicrobial, anti-tumoral, anti-thrombogenic, anti-therosclerotic, anti-viral, and anti-allergic
properties; to name a few (for details refer to Umesh et al. [2]). They are some of the most effective
anti-oxidant compounds available to humans. They exert their anti-oxidant effect by scavenging oxygen
derived free radicals which are known to have adverse effects on health that lead to the development
of various degenerative diseases such as cancers, brain dysfunction, cardiovascular diseases, and also,
those that are associated with a weakened immune system [2]. The polyphenols, in general, act by
inhibiting or delaying the initiation of oxidative chain reactions. Therefore, the presence of flavonoids
creates more stable and less reactive radicals when the hydroxyl group in these phytochemicals have
reacted and been oxidized by radicals themselves [3]. Flavonoids are also known to exhibit anti-oxidant
action by chelating iron which causes peroxidation when combined with reactive oxygen species [2].
These phytochemical constituents also directly inhibit lipid peroxidation that affects the integrity
of lipid membranes of cells, which is another measure for protection from the adverse effects of
oxidation [2,3]. The production of anti-oxidants in plants is ubiquitous in nature, but those plants with
specialized metabolites that are species specific, may have better anti-oxidant effects than other species.
      Triterpene saponins have in the recent decade become very interesting as drug candidates for
cancer chemotherapy due to their cytotoxic and cytostatic effects. The work of Thakur et al. [4] reviews
the potential of these chemicals as anti-cancer agents as triterpene saponins may exhibit their action
by either slowing the growth of tumor cells or result in cell death. These actions are linked to the
permeabilization of membranes, alterations to cellular anion channel function, mitochondrial and
endoplasmic reticulum (ER) malfunction, and stimulation of immune responses in the presence of
carcinogens [4]. Furthermore, they may protect DNA from damage and thus act as anti-mutagens.
As a result, plants with unique triterpenoidal saponins are highly sought after as potential sources of
new anti-tumorigenic drugs.
      Scientific interest in S. frutescens is also on the rise as its extracts have been shown to exhibit
anti-cancer activity in in vitro assays. It is important to recognize that, at this stage, our knowledge on
the phytochemical composition of S. frutescens is still shallow as not all metabolites that are synthesized
by this species have been completely elucidated. Progress in this regard dates back to the late 1960s
when triterpene saponins in S. frutescens were first reported [1], but it was only in the past decade,
that chemical biomarkers were purified (refer to Supplementary information for chemical structures).
Specifically, the triterpene saponins of Sutherlandia, (as it is often called in colloquial terms) are in
fact cycloartane glycosides, termed sutherlandiosides (Figure S1). These are characteristic of the
species and they are known to show site-specific variation [5]. They are nowadays used in quality
control protocols as part of the regulatory measures in a commercial production pipeline [5]. Thus far,
the flavonoids that have been characterized in S. frutescens are those with a kaempferol or quercetin
aglycone (Figure S2) and these flavonoid glycosides are also thought to be important contributors
to the various pharmacological activities of the species. Since the bioactivity of medicinal plants is
ascribed to the presence of chemical compounds contained by the plant, the chemotypic variation of
S. frutescens (shown by Albrecht et al. [5] and Zonyane et al. [6] in previous work) might cause variable
bioactivity of plants collected from differing wild habitats. There is a link between strong anti-oxidant
activity and chemopreventative anti-tumor actions mediated by herbal products but the efficacy of the
herbal preparation is often determined by the quality and source of the plant [5].
      Although the functional relevance of sutherlandins and sutherlandiosides in the plant is not yet
known, plants in general, are phenotypically plastic, responding to micro-environmental changes by
adjusting metabolic flux leading to chemical-based variation [6]. S. frutescens is widely distributed in
South Africa, occurring in different biomes and where it is found, it is an important herbal medicine that
Antioxidants 2020, 9, 152 3 of 21
is used by various cultural groups and its record of use spans across centuries [1]. The plant is popular
for the treatment of a wide range of ailments including stomach diseases, stress, fever, wounds, diabetes,
and cancers, hence, the Afrikaans name of ‘kankerbos’ or cancer bush in English [1]. Because this
species has a strong reputation in folklore as a medicinal plant that treats cancers, studies to validate
these claims are plenty. For example, some studies showed that extracts lead to apoptosis of breast
cancer cell lines with MCF-7 tumor cells being more susceptible to cell death in comparison to
the MCF-12 A cells [7,8]. They also inhibit growth of CaCo2 colon cancer cells by disrupting cell
membranes and cell death is mediated via the P13-K pathway [9]. Various publications also indicate
the anti-oxidant properties of S. frutescens [10–13] but at this stage, the key bioactive(s) that may hold
anti-cancer activity are not yet known. Furthermore, there is limited information regarding specific
ecotypes and their anti-cancer activities. Most studies typically use material from one chosen natural
population or material that has been farmed but without provenance information being provided in
detail [6]. The latest research shows the cytotoxicity effects of both water and ethanolic extracts of
S. frutescens using a zebrafish bioassay and this effect is clearly dose-dependent [14]. Other recent
studies have tried to explain the mechanisms that may dictate the physiological effects of various
extracts of S. frutescens and the NF-kB, MAPK, and TNF signaling are linked to immune-modulation
effects [15]. Ntuli et al. [16] showed anti-mutagenic effects of ethyl acetate and methanol extracts using
an AMES analysis. Several authors use commercially available products of Sutherlandia to obtain plant
material for pharmacological testing (see work of Leisching et al. [9]; Ntuli et al. [16]; Lin et al., [17];
and Van Der Walt et al. [18]). However, the manufacturers of these products do not necessarily attest
to the origins of the chemotypes used in the manufacturing process and neither do they indicate where
the mother stock plants used for building an agricultural crop of the species actually came from.
To add to a growing body of knowledge with regards to S. frutescens and its chemotypes, the aim
of this particular study was two-fold. At first, it was to establish whether chemical variation among
S. frutescens plants from different places has any implications on anti-oxidant activity of this species
because these plants possess flavonoids and terpene saponins in the form of sutherlandins and
sutherlandiosides, respectively. All other studies focused on using either wild or field-grown plant
material to validate the effects of S. frutescens extracts in bioassays, and in some instances, commercially
purchased leaves without taking into consideration the origins of the plant material have been used as
test materials. The second aim was, therefore, to test for in vitro anti-cancer effects using a DLD-1 colon
cancer cell line which has not been previously tested; and, to establish which of the wild chemotypes
identified by Zonyane et al. [5] showed the greatest potency as accumulation of the sutherlandins and
sutherlandiosides is site specific. This paper thus adds additional evidence to support the popularity
of this medicinal plant as an anti-cancer agent and directly correlates both anti-oxidant and anti-cancer
bioactivities to inter-population based chemical variation.
2. Materials and Methods
2.1. Plant Collection and Extraction
Sutherlandia frutescens plants growing in the wild were collected from various populations
in different provinces of South Africa (Table 1). We targeted the month of November 2014 for
these collections as this is the flowering season. The characteristic orange-red flowers were used
as a diagnostic feature to identify plants in the wild. Most plant material was collected by SZ
(representative voucher numbers: SF (Z14 to 19)) as only one set of samples, from Pearly Beach,
were collected by NPM (NM(1)). A set of voucher specimens was lodged with the herbarium of the
Department of Botany and Zoology (Stellenbosch University, Stellenbosch, South Africa) and during
this time, their botanical identity was confirmed.Antioxidants 2020, 9, 152 4 of 21
Table 1. Sutherlandia frutescens specimens from different habitats of South Africa and chemical
compounds that are important for their chemotypic differences.
Quercetin and Terpenoid Saponins
Province Geographic Location Kaempferol Derived (Cycloartanol
Flavonoids Glycosides)
Gansbaai 1
Sutherlandin B
34◦ 320 09.4”S 18.69_737.4104 *
7.66_755.2021 *
19◦ 240 26.0”E
Gansbaai 2
Western Cape Sutherlandin B
34◦ 320 34.8”S 18.69_737.4104 *
7.66_755.2021 *
19◦ 240 38.6”E
Pearly Beach
Sutherlandin B
34◦ 400 47.3”S 18.69_737.4104 *
7.66_755.2021 *
19◦ 330 20.0”E
Burgersdorp
Sutherlandin A Sutherlandioside A
Eastern Cape 31◦ 020 26.0”S
Sutherlandin B Sutherlandioside B
25◦ 440 08.0”E
Zastron
8.73_593.1501 * Sutherlandioside A
Free State 30◦ 290 49”S
7.99_609.1448 * Sutherlandioside B
27◦ 090 71”E
Colesberg Sutherlandin A
Sutherlandioside A
30◦ 480 17.3”S Sutherlandin C
Sutherlandioside B
Northern Cape 24◦ 580 52.4”E Sutherlandin D
Victoria West Sutherlandin A
Sutherlandioside B
31◦ 320 48.2”S Sutherlandin C
Sutherlandioside C
23◦ 350 00.4”E Sutherlandin D
* Elution time and mass number of unidentified compound.
Plant material was dried at room temperature and stored in the dark for the duration of the
study. Since plants from the same habitats displayed similar LC-MS profiles based on previous
work from our laboratories (see also Zonyane et al. [6], leaf material from four individual plants
from each of the seven localities were pooled together for the anti-oxidant and anti-cancer analyses
(Table 1). One gram of dried and pulverized leaves of S. frutescens was extracted with 20 mL of 75%
(v/v) ethanol and an ultra-sound sonicator (Branson B220H, Danbury; United States of America). for
60 min was used to increase extraction efficiency. The distilled water in the sonicator was kept cool by
the addition of ice during this period. After the extraction, cell debris was removed from the plant
extracts using Whatman® No. 1 filter paper (Merck, Darmstadt, Germany). The filtered extracts were
then concentrated to dryness by evaporating the solvent at room temperature in the dark for 72 h.
Extractions were conducted in triplicate. Each dried extract was weighed and resuspended with 75%
(v/v) ethanol to obtain a stock extract with a concentration of 1 mg·mL−1 .
2.2. Measurement of the Total Phenolic and Flavonoid Content
The total phenolic concentration of various S. frutescens plants representing each study collection
site was determined spectrophotometrically by the Folin–Ciocalteu method [19] whereby 50 µL
of the plant extract was mixed with 450 µL of 50% (v/v) methanol and 500 µL of Folin–Ciocalteu
reagent. After 2 min, 2.5 mL of 2% (v/v) sodium carbonate was added to the mixture and the
contents were vortexed to mix thoroughly. The reactions were kept at room temperature in the
dark for 40 min, after which the absorbances were measured at the wavelength of 725 nm with a
UV-Vis spectrophotometer (Thermo Scientific Technologies, Madison, Wisconsin). The total phenolic
content of various Sutherlandia samples was quantified by a calibration curve that was obtained
from absorbance readings of known concentrations of gallic acid standard solutions (2 µg·mL−1 to 16Antioxidants 2020, 9, 152 5 of 21
µg·mL−1 resuspended in 50% methanol; A = 0.02 c (gallic acid) − 0.0286, R2 = 0.9941). This experiment
was conducted in triplicate. The data were expressed as mg of gallic acid equivalent per grams of dry
extract (mg GAE/g DE).
To determine the total flavonoids content of S. frutescens samples, an aluminum chloride
colorimetric assay was used in which 250 µL of the plant extract was mixed with 1.25 mL of
distilled water and 75 µL of 5% (v/v) sodium nitrite. Samples were left for 5 min before 150 µL
of 10% (v/v) aluminum chloride solution was added. This was followed by addition of 500 µL of
1 M sodium hydroxide solution and 775 µL of distilled water after 5 min. The absorbances were
measured immediately thereafter at 510 nm using a spectrophotometer (Thermo Scientific Technologies,
Madison, WI, USA). The total flavonoid concentration of samples was calculated using the calibration
curve of catechin (10 µg·mL−1 to 500 µg·mL−1 resuspended in 50% methanol; A = 0.0059 c(catechin) +
0.6245, R2 = 0.8592). The assay was conducted in triplicate. The data were calculated to represent mg
of catechin equivalent per gram of dry extract (mg CE/g DE).
2.3. Anti-Oxidant Activity
The anti-oxidant activity was assessed by two methods. The first method involved using the
free radical scavenging method based on the 2,2-diphenyl-1-picrylhydrazyl (DPPH• ) assay which
measures the hydrogen donating ability of the plant extract by reducing DPPH• to DPPH-H; and,
this is physically indicated by the bleaching of a purple-colored DPPH• solution. The ferric reducing
anti-oxidant power (FRAP) assay which involves the reduction of a ferric-tripyridyltriazine complex to
its ferrous colored form in the presence of anti-oxidants was also used.
2.3.1. DPPH• Radical Scavenging Activity
To measure the anti-oxidant activity using DPPH• method, 15 µL of the plant extract was mixed
with 735 µL of methanol and 750 µL of 0.1 mM DPPH• solution. The reaction contents were mixed
thoroughly using a vortex and incubated at room temperature for 30 min and covered with aluminum
foil, after which the absorbances of the reaction solutions were measured at the wavelength of 517 nm.
Even though DPPH• is a relatively stable free radical, it gradually deteriorates when it is in solution
form, hence, the assay was conducted under dark conditions and only freshly prepared solutions were
used. An anti-oxidant, ascorbic acid was used as a positive control (0.4 mM to 2.4 mM resuspended in
methanol); A = −0.298c (ascorbic acid) + 0.7482, R2 = 0.9843. The free radical scavenging activity (RSA)
as determined by the decoloration of the DPPH solution was calculated using the following formula:
Scavenging (%) of DPPH = (1 − AE )/AD × 100
where: AE = Absorbance of the reacted extract or antioxidant standard; AD = absorbance of the DPPH
solution only.
A dilution series (1.25, 2.50, 5.00, 10.0, 20.0, and 40 µg·mL−1 ) for each of the samples from
different sites was prepared to give approximately 0% to 100% inhibition of DPPH• . The radical
scavenging capacity of S. frutescens extracts was then evaluated in terms of their respective IC50 values
(inhibitory concentration of the extract (µg) necessary to neutralize DPPH by 50%) with lower IC50
values indicating higher hydrogen donating (anti-oxidant activity) ability and vice versa.
2.3.2. Ferric Reducing Anti-Oxidant Power (FRAP) Assay
To measure the anti-oxidant activity using the FRAP method, 150 µL of the plant extract was
added to 2850 µL of the FRAP solution which contained 300 mM sodium acetate buffer (pH 3.6), 10 mM
2,4,6-Tri(2-pyridyl)-s-triazine (TPTZ) solution and 20 mM ferric chloride. The reaction contents were
thoroughly mixed and incubated for 30 min at room temperature in the dark. The absorbances were
measured, thereafter, at a wavelength of 593 nm. Trolox (0.1 to 1 mM resuspended in 50% methanol;Antioxidants 2020, 9, 152 6 of 21
A = 1.8872c (Trolox) + 0.3194, R2 = 0.9631) was used as the standard. The anti-oxidant activity was
expressed as mM Trolox equivalent per gram of dry extract (mM TE/g DE).
2.4. Anti-Cancer Activity
2.4.1. Cell Culture
The anti-proliferative effect of S. frutescens specimens was evaluated on a colon adenocarcinoma
cell line (DLD-1; American Type Culture Collection) as at the time of designing these experiments,
the S. frutescens extract had not previously been tested on this cell line. The DLD-1 cells were provided
by Reaction Biology Corporation where tests were performed (Pennsylvania, USA). The DLD-1 cells
were cultured in 20 µL of RPMI-1640 medium which was supplemented with 10% (v/v) fetal bovine
serum, 100 µg/mL of penicillin and 100 µg/mL of streptomycin. Cultures were maintained at 37 ◦ C
in a humidified atmosphere with 5% CO2 (v/v) and 95% air (v/v) and to prevent liquid evaporation
of the medium, a porous microplate sealing film was used to seal the 383-well plate during the cell
incubation period.
2.4.2. Cell Titer-Glo Viability Assay
To conduct the Cell Titer-Glo Viability Assay, the cancer cells were seeded into wells of the 384-well
cell culture plate at 2000 cells per well in triplicate. This was followed by incubation at 37 ◦ C in 5%
CO2 overnight to mediate attachment of cells to the wells. Then, each plant extract was added to the
wells of a plate as 5 µL aliquots and the plates were incubated for 48 h for the duration of treatment.
Plant extracts were analyzed in a 10-dose-dependent manner with three-fold serial dilutions and
subsequently, the concentrations that were tested were; 0.01, 0.03, 0.10, 0.30, 0.80, 2.50, 7.40, 22.2, 66.7,
and 200 µg·mL−1 for their cytotoxicity effects on test cancer cells. A protein-kinase inhibitor, 5 µL of
staurosporine (Sigma-Aldrich, Michigan), at the concentration of 10 µM, was used as the reference
compound and was diluted and screened in the same manner as the plant extracts. After 48 h, 25 µL
of CellTiter-Glo® 2.0 luminescent reagent (Promega (Madison, WI, USA)) was added to each well.
The contents were mixed on an orbital shaker for 2 min and incubated at room temperature for 15 min
to stabilize the luminescent signal. Luminescence was recorded by Envision 2104 Multilabel Reader
(PerkinElmer, Santa Clara, CA, USA). The number of viable cells in culture was determined based on
quantitation of the ATP present in each culture well. This assay was performed at Reaction Biology
Corporation (PA, USA).
2.5. Phytochemical Profiling
A Waters Acquity Ultra Performance Liquid Chromatography (Milford, MA, USA) coupled with
an Acquity photo diode array (PDA) detector and a Waters Synapt G2 quadrupole time-of-flight
mass spectrometry was used to analyze phenolic and terpenoid compounds in S. frutescens samples.
Using an autosampler, 1 µL was injected for analysis. The chromatography was performed using
a Waters UPLC BEH C18 column (2.1 mm × 100 mm, 1.7 µm particle size) under a flow rate of 350 µL
min−1 for 26 min. Water (A) and acetonitrile (B) (both containing 0.1% formic acid) were combined
for the elution and the gradient elution was performed as follows: 5% B at 0.5 min, 44% B at 20 min,
100% B at 21 min, 100% B at 22 min, 5% B at 23 min, and A5% B at 26 min. Other conditions were
set at 15 V for the cone voltage, 3.0 kV for the capillary voltage. Data were acquired in MSE mode
and a collision energy of 6 V (low energy transition) to obtain MS data, with a ramp setting of 15
to 60 V for the trap collision energy to obtain fragmentation data. This protocol uses nitrogen as
the desolvation gas (650 L h−1 flow rate and at 275 ◦ C) and a positive electrospray ionization mode.
The flavonoids (sutherlandins) and terpenoids (sutherlandiosides) eluted between 6.3–9 min and
15.9–21.6 min, respectively. All spectra of the largest peaks and were tabulated in an excel spreadsheet.
This was followed by combining the mass spectra data, lambda (UV) and fragmentation (MSE ) data to
make putative chemical assignments.Antioxidants 2020, 9, 152 7 of 21
2.6. Data Analysis
All the anti-oxidant data are presented as mean including the standard deviation (mean ±
SD). The results were compared by one-way analysis of variance (ANOVA) to determine significant
differences between the means after normality testing. Differences that are at p < 0.05 between the
means were considered statistically significant. The IC50 values for DPPH reduction were calculated
on GraphPad Prism 7.04, within the dilution series that was prepared.
The in vitro anti-cancer assay results were interpreted in terms of percentage cellular viability
which was expressed as mean ± SD. The Tukey post-hoc test was used to compare which means were
significant from each other at the significance level of p < 0.05. Plant extract concentrations at which
Antioxidants 2020, 9, x FOR PEER REVIEW 7 of 19
50% cell growth is inhibited (IC50 ) were determined by the log sigmoid dose-response curve plotted
on GraphPad Prism 4. Data were utilized to construct a principal component analysis illustrated as
biplot and a Pearson’s correlation matrix was used to visualize relationships between polyphenolic
a biplot and a Pearson’s correlation matrix was used to visualize relationships between polyphenolic
content, anti-oxidant-, and anti-cancer activities.
content, anti-oxidant-, and anti-cancer activities.
3.
3. Results
Results
3.1. Anti-Oxidant
Anti-Oxidant Analyses
Analyses
It is
iswell
wellestablished
established that
that all plants
all plants possess
possess anti-oxidant
anti-oxidant activity
activity but variations
but variations in different
in different phenolic
phenolic structural profiles lead to different anti-oxidant capacities for plant extracts and extracts
structural profiles lead to different anti-oxidant capacities for plant extracts and extracts of S. frutescens of
S. frutescens
from from
different different
areas areas were
were variable variable
(Figure 1). (Figure 1).
Figure 1. Examples of chromatograms of Sutherlandia frutescens extracts prepared from plants
Figure 1. in
occurring Examples
different of chromatograms
localities. of region
The yellow Sutherlandia frutescens
represents extracts prepared
the sutherlandins and thefrom plants
blue region
occurring in different
the sutherlandiosides. localities. The yellow region represents the sutherlandins and the blue region
the sutherlandiosides.
Both qualitative and quantitative differences seem to be expressed as a result of geographic
BothTotal
location. qualitative and
phenolic quantitative
content in plantsdifferences seem to be
is largely implicated in expressed as a result
their anti-oxidant powerof and
geographic
ethanol
location. Total phenolic content in plants is largely implicated in their anti-oxidant power and ethanol
extracts of various specimens of S. frutescens obtained from different geographic regions varied in
their composition of total phenolics and flavonoids (Figure 2).Antioxidants 2020, 9, 152 8 of 21
extracts of various specimens of S. frutescens obtained from different geographic regions varied in their
composition of 9,
Antioxidants 2020, total phenolics
x FOR and flavonoids (Figure 2).
PEER REVIEW 8 of 19
Figure 2. Anti-oxidant effect of Sutherlandia frutescens plants from different localities studied using
Figure
in 2. Anti-oxidant
vitro tests. effect ofcontent,
(A) Total phenolic Sutherlandia frutescens
(B) Total plants
flavonoid from
content, (C)different localities
comparative DPPH studied using
free radical
in vitro tests. (A) Total phenolic content, (B) Total flavonoid content, (C) comparative
scavenging activity (IC50) and (D) ferric reducing anti-oxidant power (Trolox equivalent) and IC50curve DPPH free
radical scavenging activity
• (IC50) and (D) ferric reducing anti-oxidant power (Trolox
for free radical (DPPH ) scavenging activity (E). Mean values (±SD) of triplicate measurements are equivalent) and
IC50curve Different
presented. for freeletters
radical (DPPH
above
•) scavenging activity (E). Mean values (±SD) of triplicate
average bars denote statistically significant differences at p < 0.05.
measurements are presented. Different letters above average bars denote statistically significant
differences
The contentatofp phenolics
< 0.05. ranged from 93.311 to 125.330 mg GAE/g DE with plants from Gansbaai
1 (Western Cape) having the highest concentration followed consecutively by plants from the nearby
regionThe content
of Pearly of phenolics
Beach (Westernranged from 93.311
Cape) (Figure to interest
2A). Of 125.330 ismg GAE/g
that, DE
all the with plants
Western Cape from
plantsGansbaai
studied
1 (Western
in Cape)investigation
this particular having the highest
have beenconcentration
shown tofollowed consecutively
be a chemotype by plants from
that accumulates the nearby
sutherlandin
Bregion
(Tableof1).Pearly Beach (Western
Sutherlandia plants from Cape) (Figure 2A).
Burgersdorp Of interest
(Eastern Cape)ishadthat,
thealllowest
the Western
value ofCape plants
phenolics
studied in this particular investigation have been shown to be a chemotype
measured (Figure 2A), and predominantly, these plants accumulate the cycloartenol glycosides, that accumulates
sutherlandin B (Table
sutherlandioside A and1). Sutherlandia plants
sutherlandioside from 1).
B (Table Burgersdorp
The phenolic (Eastern Cape) had
concentration of the lowest
plants fromvalue
the
of phenolics measured (Figure 2A), and predominantly, these plants accumulate
other wild collection sites were relatively similar and generally significantly lower than the levels of the cycloartenol
glycosides,
phenolics sutherlandioside
that were recorded for A and sutherlandioside
Sutherlandia plants from B (Table 1). TheCape
the Western phenolic
groupconcentration of plants
(p < 0.05) (Figure 2A).
The total flavonoid values are displayed in Figure 2B and flavonoid constituents ranged from 54.831the
from the other wild collection sites were relatively similar and generally significantly lower than to
levels mg
66.073 of phenolics
CE/g DE.that were recorded
Sutherlandia plants for
fromSutherlandia
Pearly Beach plants
hadfrom the Western
the highest Cape group
composition (p < 0.05)
of flavonoids
(Figure 2A).
recorded withThethetotal flavonoid
in vitro values areto
assay. Similarly, displayed in Figure
the phenolic 2B and
analysis, the flavonoid constituents
levels of flavonoids ranged
recorded
from 54.831 to 66.073 mg CE/g DE. Sutherlandia plants from Pearly Beach had
for studied specimens followed the same trend with Western Cape having significantly higher amounts the highest composition
ofopposed
as flavonoids recorded
to those plantswith
fromthe in vitro
other assay. Similarly, to the phenolic analysis, the levels of
provinces.
flavonoids recorded for
The measurement studied
of the specimens followed
total anti-oxidant the same
phytochemicals wastrend withbyWestern
followed Cape having
an assessment of the
significantly higher amounts as opposed to those plants from other provinces.
anti-oxidant capacity of various S. frutescens specimens, shown in Figure 2C,D. As expected, all the
samples Thefrom
measurement of the total
different habitats anti-oxidant
displayed phytochemicals
anti-oxidant activity aswas followed byby
demonstrated an both
assessment
DPPH•ofand the
anti-oxidant
FRAP assays capacity
that wereofused,
variousandS.ICfrutescens specimens, shown in Figure 2C and 2D. As −1 expected, all
50 values ranged between 3.171 and 7.707 µg·mL (Figure 2C).
the samples from different habitats displayed anti-oxidant activity as demonstrated by both DPPH•
and FRAP assays that were used, and IC50 values ranged between 3.171 and 7.707 µg·mL−1 (Figure
2C). The plants from Victoria West displayed an IC50 value of 7.707 µg·mL−1, thereby indicating the
lowest radical scavenging activity recorded among all studied specimens of S. frutescens, whereas
those plants from the Pearly Beach subset had the strongest bioactivity (Figure 2C). Figure 2E showsAntioxidants 2020, 9, 152 9 of 21
The plants from Victoria West displayed an IC50 value of 7.707 µg·mL−1 , thereby indicating the lowest
Antioxidants
radical 2020, 9, x FOR
scavenging PEERrecorded
activity REVIEW among all studied specimens of S. frutescens, whereas those plants
9 of 19
from the Pearly Beach subset had the strongest bioactivity (Figure 2C). Figure 2E shows the IC50 curve
the IC50 curve for free radical (DPPH•) scavenging activity and these data further emphasize the
for free radical (DPPH• ) scavenging activity and these data further emphasize the higher DPPH• power
higher DPPH• power of the Gansbaai 1 population group. Both DPPH• and FRAP methods showed
of the Gansbaai 1 population group. Both DPPH• and FRAP methods showed a strong correlation
a strong correlation between the total phenolic and flavonoid content and the degree of anti-oxidant
between the total phenolic and flavonoid content and the degree of anti-oxidant activity of Sutherlandia
activity of Sutherlandia plants with r2 values of 0.9032 and 0.9163 for radical scavenging activity,
plants with r2 values of 0.9032 and 0.9163 for radical scavenging activity, respectively, and 0.9501 and
respectively, and 0.9501 and 0.9834 for reducing anti-oxidant activity, respectively (Figure 3).
0.9834 for reducing anti-oxidant activity, respectively (Figure 3).
Figure 3.3. Correlation
Figure Correlation between
between the
the studied
studied anti-oxidant
anti-oxidant phytochemicals
phytochemicals (total
(total phenolics
phenolics and
and total
total
flavonoids) and anti-oxidant capacity of Sutherlandia frutescens plants from various geographic locations.
flavonoids) and anti-oxidant capacity of Sutherlandia frutescens plants from various geographic
(A) %DPPH versus total phenolic content (B) FRAP activity versus total phenolic content (C) %DPPH
locations. (A) %DPPH versus total phenolic content (B) FRAP activity versus total phenolic content
versus total flavonoid content (D) FRAP activity versus total flavonoid content.
(C) %DPPH versus total flavonoid content (D) FRAP activity versus total flavonoid content.
Again, all S. frutescens specimens from various localities displayed anti-oxidant activity when
Again, all S. frutescens specimens from various localities displayed anti-oxidant activity when
they were assessed for reducing anti-oxidant power through FRAP assay. Plants from Gansbaai 1
they were assessed for reducing anti-oxidant power through FRAP assay. Plants from Gansbaai 1
and Pearly Beach exhibited equal and highest reducing anti-oxidant powers at 16.2319 mM TE/g DE,
and Pearly Beach exhibited equal and highest reducing anti-oxidant powers at 16.2319 mM TE/g DE,
followed by plants from Burgerdorp and Colesburg, both with the reducing anti-oxidant powers
followed by plants from Burgerdorp and Colesburg, both with •the reducing anti-oxidant powers at
at 15.4162 mM TE/g DE (Figure 2D). The two methods, DPPH , and FRAP assays, used to assess
15.4162 mM TE/g DE (Figure 2D). The two methods, DPPH•, and FRAP assays, used to assess anti-
anti-oxidant activity in this study were more congruent with each other (Figures 2 and 3) and therefore
oxidant activity in this study were more congruent with each other (Figures 2 and 3) and therefore
able to conclusively show those S. frutescens specimens that were more potent in their bioactivities.
able to conclusively show those S. frutescens specimens that were more potent in their bioactivities.
Both methods confirmed the presence of variability in the anti-oxidant activities among wild-collected
Both methods confirmed the presence of variability in the anti-oxidant activities among wild-
plants and this was largely correlated to biogeographic zones where plants were harvested from and
collected plants and this was largely correlated to biogeographic zones where plants were harvested
those plants from coastal localities being more powerful.
from and those plants from coastal localities being more powerful.
3.2. Anti-Cancer Activity
3.2. Anti-Cancer Activity
S. frutescens is reputed as an anti-cancer agent and we were thus interested to examine the
S. frutescens
possibilities is reputed
of variable as an anti-cancer
anti-proliferation effects agent
linkedand we were
to extracts thus
from interested
disparate to examine
habitats. the
This idea
possibilities of variable anti-proliferation effects linked to extracts from disparate
was based on the fact that there is no consistency and congruency in recorded data as various habitats. This idea
was based on
laboratories willthe factcollect
only that there is no
material fromconsistency
one site toand congruency
conduct in recorded data
their investigations. as various
The amount of
laboratories will only collect material from one site to conduct their investigations.
ATP, as measured by Cell Titer-Glo viability assay was used as a signal for cellular metabolic The amount of
activity,
ATP, as measured by Cell Titer-Glo viability assay was used as a signal for cellular metabolic
therefore, acting as an indirect measure of cell death in extract treated cancer cells. At the highest test activity,
therefore, acting as an indirect measure of cell death in extract treated cancer cells. At the highest test
concentration of 200 µg·mL–1, all tested extracts demonstrated cytotoxicity on test colon cancer cells
(DLD-1).
However, specimens had varying degrees of cytotoxicity on the cancer cells, with plants from
Colesburg (Northern Cape) exhibiting the highest anti-cancer activity (36.6% viability). Even though,
Victoria West is in the Northern Cape (63.2% viability) where some studies have shown plants fromAntioxidants 2020, 9, x FOR PEER REVIEW 10 of 19
this area to have superior anti-tumor effects [5], these plants were least effective in the anti-cancer
activity test in comparison to extracts produced from other localities (Figure 4). There was no
particular
Antioxidants 2020, 9, trend
152 connecting the anti-cancer activities with anti-oxidant activities in Section 3.1, except 10 of 21
plants from Gansbaai 1 which showed consistency in their relatively higher anti-oxidant and anti-
cancer activities (Table 2). Between concentrations of 22.2 µg·mL−1 and 200 µg·mL−1, all the plant
extracts
concentration of induced cytotoxicity
200 µg·mL −1 , allontested
DLD-1extracts
cells in ademonstrated
dose-dependent cytotoxicity
manner illustrating a relationship
on test colon cancer cells
regarding the concentration and cytotoxicity effects where higher concentrations of the extract
(DLD-1).
prevented the growth of the cancer cells. Concentrations lower than 22.2 µg·mL−1which ranged from
However, specimens had varying degrees of cytotoxicity on the cancer cells, with plants from
0.01 µg·mL−1 to 7.4 µg·mL−1 induced similar cytotoxicity on DLD-1 cells (p > 0.05). The IC50 values
Colesburg (Northern
further confirmed Cape) exhibiting
the relatively the highest
higher potency of anti-cancer
Colesburg,activity
Zastron (36.6% viability).
and Gansbaai Even
1 plants as though,
Victoriaspecimens
West is in the Northern Cape (63.2% viability) where some studies have shown plants
from these regions had IC50 values of 158.7, 172.7, and 176.7 µg·mL , respectively (Table
−1 from
2).
this area to have superior anti-tumor effects [5], these plants were least effective in the anti-cancer
activity test in comparison to extracts produced from other localities (Figure 4). There was no particular
Table 2. IC50 values of Sutherlandia frutescens extracts produced from plants growing at different
trend connecting the anti-cancer activities with anti-oxidant activities in Section 3.1, except plants
geographic localities in South Africa.
from Gansbaai 1 which showed consistency in their relatively higher anti-oxidant and anti-cancer
Plant Type Provincial Location IC50 (µg·mL−1)
activities (Table 2). Between concentrations of 22.2 µg·mL−1 and 200 µg·mL−1 , all the plant extracts
Gansbaai 1 Western Cape 176.7
induced cytotoxicity onGansbaai
DLD-1 cells2 in a dose-dependent
Western Cape manner illustrating>200 a relationship regarding
the concentration and Pearlycytotoxicity
Beach effects where higher
Western Cape concentrations of
>200 the extract prevented the
growth of the cancer cells. Concentrations lower
Burgersdorp 22.2 µg·mL−1 which
thanCape
Eastern ranged from 0.01 µg·mL−1 to
>200
7.4 µg·mL−1 induced similar Zastroncytotoxicity on DLD-1 cells (p > 0.05). The172.7
Free State IC50 values further confirmed
Colesburg Northern Cape 158.7
the relatively higher potency of Colesburg, Zastron and Gansbaai 1 plants as specimens from these
Victoria West Northern Cape−1 >200
regions had IC50 values of 158.7, 172.7, and 176.7 µg·mL , respectively (Table 2).
Boldtype face highlights extracts that are regarded as being active.
Figure 4. The cell viability of DLD-1 colon cancer cell lines treated with Sutherlandia frutescens extracts
at 200 µg·mL −1The
Figure 4. from different
cell viability geographic
of DLD-1 localities
colon cancer using
cell lines an with
treated in vitro test. Values
Sutherlandia frutescensare reported as
extracts
percentages and different letters above bars denote statistically significant mean differences at p < 0.05.
at 200 µg·mL −1 from different geographic localities using an in vitro test. Values are reported as
percentages and different letters above bars denote statistically significant mean differences at p <
IC50 values of Sutherlandia frutescens extracts produced from plants growing at different
Table 2.0.05.
geographic localities in South Africa.
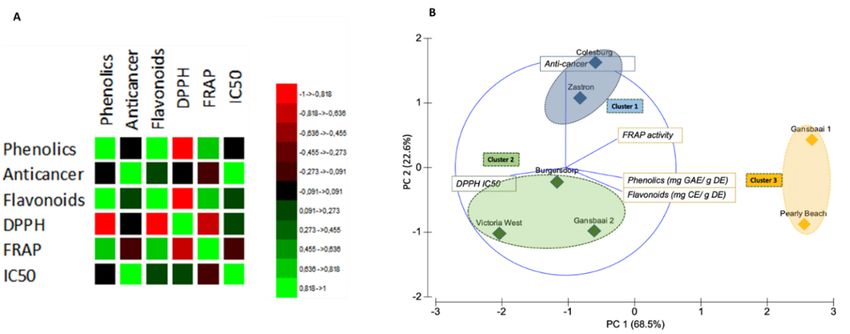
3.3. Correlation Matrix and Principal Component Analysis
Plant Type Provincial Location IC50 between
(µg·mL two ) −1
A Pearson’s correlation matrix was used to reveal the degree of correlation
Gansbaai
parameters, 1
confirming Western
relationships between Cape
the test indices (Figure 5A). As expected,176.7
significant
Gansbaai
positive 2
correlations were recorded for totalWestern Cape
phenolics and flavonoid content (r = 0.916,>200
p = 0.05) but
Pearly Beach Western Cape >200
Burgersdorp Eastern Cape >200
Zastron Free State 172.7
Colesburg Northern Cape 158.7
Victoria West Northern Cape >200
Boldtype face highlights extracts that are regarded as being active.
3.3. Correlation Matrix and Principal Component Analysis
A Pearson’s correlation matrix was used to reveal the degree of correlation between two parameters,
confirming relationships between the test indices (Figure 5A). As expected, significant positivechemicals present in Sutherlandia plants across all populations (Table 3). It is clear that extracts of S.
frutescens are complex with high variation quantitatively in their pool of compounds with anti-
oxidant power. In this study, there are several other kaempferol and quercetin derivatives that were
present in the extracts that have not been fully characterized and remain unknown. The bioactives
that have anti-cancer activity thus need to be explored further. However, it is clear that anti-cancer
activity
Antioxidants 2020, 9,shown
152 here is not necessarily strongly correlated to the flavonoids. Some of the other 11 of 21
chemicals that we were able to tentatively identify include isomers of the sutherlandins, some
triterpenoids and cycloartanol glycosides (sutherlandiosides). The cycloartanol glycosides have
characteristic
correlations MS spectra
were recorded for showing characteristic
total phenolics cycloartanolcontent
and flavonoid aglycone
(rfragments
= 0.916, p(Figure
= 0.05)S3),
buta low
the DPPH
double bond equivalency and no UV peaks [5]. The sutherlandins are flavonols with characteristic
activity was negatively correlated to the flavonoid and total phenolic content (r= −0.847 and r = −0,872
UV spectra with a UV max at 265 and 345 nm and also a base peak in the higher energy trace that
at the p =corresponds
0.05 level of to significance, respectively).
the specific aglycone [M+H],The eg highest correlation
m/z 303.05 efficient
for quercetin and ofm/z0.985 wasfor
287.055 recorded
for the IC values
kaempferol
50 versus the
(Figure S3). anti-cancer activity and this was also statistically significant.
Relationship
Figure 5.Figure of tested
5. Relationship bioactivities
of tested bioactivitiesfrom
from different localities
different localities (A)(A) Correlation
Correlation matrixmatrix
based onbased on
Pearson’s coefficient
Pearson’s scores showing
coefficient correlated
scores showing pairs pairs
correlated amongst test parameters
amongst (p =(p0.05).
test parameters Green
= 0.05). Greenindicates
positiveindicates positive
correlations correlations
and negativeand negative correlations
correlations are shown are shown
in redinandred and
the the intensityofofthe
intensity the colour
colour is proportional to the correlation coefficients. (B) Principal component analysis indicating
is proportional to the correlation coefficients. (B) Principal component analysis indicating tested
tested bioactivities and origin of plant extracts of Sutherlandia frutescens. Extracts from different
bioactivities and origin of plant extracts of Sutherlandia frutescens. Extracts from different sources are
sources are identified by the locality (represents active observations) and clusters are based on tested
identified by the of
attributes locality (represents
S. frutescens active observations)
extracts (represents and clusters are based on tested attributes of
active variables).
S. frutescens extracts (represents active variables).
The biplot with resulting PC 1 and PC 2 axes showing principal components corresponding to
68.5% and 22.6% of the variation, respectively, was constructed to further correlate bioactivity and
biogeographic origins of the extracts (Figure 5B). In respect to the overall bioactivity, the biplot shows
the separation of S. frutescens plants, from various regions, into three main clusters. The first cluster
has plants from Colesburg and Zastron which had remarkable high anti-proliferative activity against
DLD-1 cancer cells. On the other hand, the second cluster is composed of S. frutescens plants from
Victoria West, Burgersdorp and Gansbaai 2, characterized by high DPPH IC50 values which signify
relatively low anti-oxidant activity. The S. frutescens plants in the third cluster were from Gansbaai 1
and Pearly Beach and the plants from these regions were mainly characterized by high FRAP activity
and high contents for the presence of flavonoids and phenolics. These plants further had an attribute
of low IC50 values for DPPH activity signifying the high anti-oxidant activity they possessed.
The largest peaks, presented in Figure 1, were used to characterize the profiles of the major
chemicals present in Sutherlandia plants across all populations (Table 3). It is clear that extracts of
S. frutescens are complex with high variation quantitatively in their pool of compounds with anti-oxidant
power. In this study, there are several other kaempferol and quercetin derivatives that were present in
the extracts that have not been fully characterized and remain unknown. The bioactives that have
anti-cancer activity thus need to be explored further. However, it is clear that anti-cancer activity shown
here is not necessarily strongly correlated to the flavonoids. Some of the other chemicals that we were
able to tentatively identify include isomers of the sutherlandins, some triterpenoids and cycloartanol
glycosides (sutherlandiosides). The cycloartanol glycosides have characteristic MS spectra showing
characteristic cycloartanol aglycone fragments (Figure S3), a low double bond equivalency and no UV
peaks [5]. The sutherlandins are flavonols with characteristic UV spectra with a UV max at 265 and 345
nm and also a base peak in the higher energy trace that corresponds to the specific aglycone [M+H],
eg m/z 303.05 for quercetin and m/z 287.055 for kaempferol (Figure S3).Antioxidants 2020, 9, 152 12 of 21
Table 3. Constituents tentatively identified in Sutherlandia frutescens leaf extracts.
RT (min) [M + H]+ Found MSE Fragment Ions Elemental Formula UV Max Tentative Identity
Quercetin glycoside
303.051, 465.100,
1 6.31 903.2404 C38 H46 O25 256; 347 (Sutherlandin A/B
597.142, 771.187
derivative)
149.069, 287.059,
177.07, 120.091,
2 6.66 427.1911 225.163, 207.126, C28 H26 O4 245; 323 Unknown flavonoid
163.056, 303.059,
387.197, 427.194
Quercetin-glycoside
303.051, 609.143,
3 6.80 771.1998 C33 H38 O21 256; 347 (Sutherlandin A/B
771.198
derivative)
303.05, 609.144,
4 7.32 741.1874 741.186, 287.057, C32 H36 O20 256; 352 Sutherlandin A
127.041
303.05, 609.148,
5 7.54 741.1855 C32 H36 O20 255; 354 Sutherlandin B
741.19, 187.06, 127.039
Kaempferol glycoside
287.055, 755.200,
6 7.66 755.2021 C33 H38 O20 265; 351 (Sutherlandin C/D
777.1755
derivative)
Quercetin glycoside
303.051, 609.107,
7 7.99 609.1469 C27 H28 O16 256; 347 (Sutherlandin A/B
287.059, 187.065
derivative)
287.055, 725.211,
Sutherlandin C
8 8.16 725.1927 593.146, 303.035, C32 H36 O19 264; 347
isomer (small peak)
187.061, 593.148
287.055, 593.149,
9 8.32 725.1920 725.192, 127.039, C32 H36 O19 265; 347 Sutherlandin C
187.06Antioxidants 2020, 9, 152 13 of 21
Table 3. Cont.
RT (min) [M + H]+ Found MSE Fragment Ions Elemental Formula UV Max Tentative Identity
287.055, 593.15,
10 8.53 725.1899 725.191, 127.042, C32 H36 O19 266; 348 Sutherlandin D
187.049
Kaempferol glycoside
287.055, 593.1500,
11 8.73 593.1501 C27 H28 O15 265,349 (Sutherlandin C/D
615.130
derivative)
177.056, 303.048, Quercetin glycoside
12 9.01 1079.2913 641.152, 1079.287, C66 H45 O15 255; 347 (Sutherlandin A/B
947.248, 145.035 derivative)
Kaempferol glycoside
287.055, 593.150,
13 9.21 593.1508 C27 H28 O15 265; 347 (Sutherlandin C/D
615.134
derivative)
505.348, 487.337,
Unknown
14 11.79 829.4537 177.067, 846.464, C49 H64 O11 None
triterpenoid
851.438
505.353, 487.342, Similar to compound
689.387, 203.152, 505 at RT 11.71,
15 12.90 831.4672 C49 H66 O11 None
471.349, 853.458, Unknown
705.363 triterpenoid
473.363, 455.353,
437.342, 491.373,
16 15.02 653.4250 C36 H60 O10 None Sutherlandioside A
419.331, 635.416,
653.427, 675.408
489.358, 471.347,
Cycloartanol
17 15.97 813.4630 651.410, 813.461, C42 H68 O15 None
glycoside
830.489, 835.447
489.358, 471.347,
916.491, 719.400, Unknown
18 16.31 899.4630 C45 H70 O18 None
657.397, 453.336, cycloartanol glycoside
921.447Antioxidants 2020, 9, 152 14 of 21
Table 3. Cont.
RT (min) [M + H]+ Found MSE Fragment Ions Elemental Formula UV Max Tentative Identity
437.341, 455.352,
419.330, 489.357, Sutherlandioside A
19 17.3 653.4252 C36 H60 O10 None
617.404, 635.415, isomer
675.407, 653.424
489.357, 471.347,
Cycloartanol
20 17.57 809.4454 177.06, 437.339, C46 H65 O12 None
glycoside
827.457
489.358, 471.346,
21 17.97 651.4094 453.336, 668.437, C36 H58 O10 None Sutherlandioside C
873.392
437.341, 419.331,
455.353, 541.355,
Cycloartanol
22 18.21 825.4257 789.407, 771.396, C42 H65 O16 None
glycoside
807.414, 523.343,
842.455, 848.409
437.342, 455.353,
473.363, 489.358,
23 18.53 653.4268 C36 H60 O10 None Sutherlandioside B
419.33, 635.416,
653.426, 675.408
489.359, 471.348,
453.338, 737.412, Cycloartanol
24 18.69 737.4104 C39 H60 O13 None
719.401, 657.402, glycoside
701.391, 759.395
455.353, 437.342,
25 19.49 635.4160 419.333, 657.398, C36 H58 O9 None Sutherlandioside D
473.364635.419
437.341, 455.352,
703.404, 419.330,
Cycloartanol
26 19.99 721.4149 685.393, 667.382, C39 H60 O12 None
glycoside
641.407, 721.415,
743.397Antioxidants 2020, 9, 152 15 of 21
Table 3. Cont.
RT (min) [M + H]+ Found MSE Fragment Ions Elemental Formula UV Max Tentative Identity
437.341, 455.351,
419.330, 657.396, Sutherlandioside D
27 20.84 635.4144 C36 H58 O9 None
489.358, 473.362, isomer
635.414
437.341, 455.352,
721.416, 419.331, Cycloartanol
28 21.13 721.4154 C39 H60 O12 None
703.404, 473.362, glycoside
685.392, 738.443
703.406, 437.342,
Cycloartanol
29 21.61 703.4058 455.352, 419.332, C39 H58 O11 None
glycoside
229.160, 685.396
MSE fragments in boldtype face refers to the base peak (highest peak) [5].Antioxidants 2020, 9, 152 16 of 21
4. Discussion
The Western Cape samples generally had higher levels of the anti-oxidant phytochemicals
and displayed higher anti-oxidant activities compared to the plants from other provinces within
the Karoo region (Figures 2 and 3). Even though the Western Cape plants performed better than
plants from other provinces, they also had considerable variation among themselves with plants
from Gansbaai 2 consistently being the least active, whereas the plants from the Karoo region had
anti-oxidant phytochemicals (phenolics and flavonoids) that were relatively uniform among each
other (Figure 1A,B). In fact, Karoo specimens have a distinct metabolomic profile that is constituted
of the major triterpene saponin, sutherlandioside B [14]. This is interesting as there has been a
perception, since the isolation and purification of this chemical, that it could play a strong role in the
cytotoxicity actions of Sutherlandia plants and it may have other pharmacological functions, hence it is
monitored in products manufactured from the raw materials of this species [5]). Recently, the study of
Lin et al. [17] showed those fractions with sutherlandioside D to have high anti-tumorogenic effects
against prosrate cancer using an in vivo setup suggesting that these anti-cancer effects are exerted
through Gli/Hn signaling pathways that control cell patterning and formation plus proliferation in
animal cells. A previous study identified a sutherlandioside D isomer in plants obtained from the
Gansbaai area [5] but plants from the Northern Cape had sutherlandioside B and C [6]. These variations
may possibly explain anti-cancer activity exhibited by extracts from different regions.
The present study shows a strong correlation between phenolics and flavonoids and the
anti-oxidant activity, likewise, several studies have demonstrated a positive relationship between total
content of phenolics and respective anti-oxidant capabilities of medicinal plants [20–22]. The plants
referred to here as the Gansbaai 1 and Pearly Beach set possessed the highest concentrations of
phenolics and flavonoids and consequently, these plants displayed the highest radical scavenging
activity and reducing anti-oxidant activity. However, this is inconsistent with the observations linked
to the Burgersdorp chemotype which consistently had the lowest concentrations of both phenolics and
flavonoids, and interestingly, these plants did not turn out to display the lowest anti-oxidant power in
both DPPH• and FRAP methods, applied in this study (Figures 2 and 3).
Despite variations that are site-specific, these data are in agreement with previous reports that
have investigated the anti-oxidant activity of S. frutescens [10–13]. It is important to note that specific
chemotypes have not been directly correlated to their anti-oxidant power in most studies in the past as
their aims have not been placed on studying the bioactivity of plants collected from a range of localities
and biogeographic considerations that may lead to different behaviors of extracts in pharmacological
tests are not the main concern. However, extracts of S. frutescens have been shown to scavenge other
reactive oxygen species that include superoxide ions, hydrogen peroxide, and nitric oxide, which are
known to be involved in the pathogenesis of various health conditions [10,11]. Extracts are also known
to have iron chelating capacity which is an important anti-oxidant feature [13]. It is thus likely that
the anti-oxidant effects are linked to a complex mechanism that has diverse targets. For example,
the suppression of the production of reactive oxygen species in various cell cultures such as neurons
and microglial cells has been demonstrated by Jiang et al. [12] and this plays a protective role against
oxidative stress linked to S. frutescens.
The Karoo (a semi-dessert region) and Western Cape (a coastal region with a Mediterranean
climate) present with different climates that influence plant metabolism, leading to different chemicals
occurring in plant extracts derived from different locations and the work of Zonyane et al. [6] indicate
differential display of sutherlandins and sutherlandiosides for populations found at these localities,
linking the habitat to the geospatial climatic conditions that the plants face. As we had collected the
plants during November to December when the temperatures start to rise and the rain becomes less
frequent in both the Karoo and the Western Cape, this in itself is likely to influence the availability
of bioactives as many other authors discuss the impact of seasons on secondary plant metabolism
is well established. Seasons and plant metabolism show remarkable biochemical adjustments to
environmental changes and such changes need to be monitored for S. frutescens in the future.You can also read