The Arctic Ozone Layer - How the Arctic Ozone Layer is Responding to Ozone-Depleting Chemicals and Climate Change
←
→
Page content transcription
If your browser does not render page correctly, please read the page content below
The Arctic
Ozone Layer
How the Arctic Ozone Layer is Responding to
Ozone-Depleting Chemicals and Climate Change
Photographs are the property of the EC ARQX picture archive.
Special permission was obtained from Mike Harwood (p. vii:
Muskoxen on Ellesmere Island), Richard Mittermeier (pp. vii,
12: Sunset from the Polar Environment Atmospheric Research
Laboratory), Angus Fergusson (p. 4: Iqaluit; p. 8: Baffin Island),
Yukio Makino (p. vii: Instrumentation and scientist on top of the
Polar Environment Atmospheric Research Laboratory), Tomohiro
Nagai (p. 25: Figure 20), and John Bird (p. 30: Polar Environment
Atmospheric Research Laboratory).

To obtain additional copies of this report, write to:
Angus Fergusson
Science Assessments Section
Science & Technology Integration Division
Environment Canada
4905 Dufferin Street
Toronto ON M3H 5T4
Canada
Please send feedback, comments and suggestions to
Angus.Fergusson@ec.gc.ca
© Her Majesty the Queen in Right of Canada,
represented by the Minister of the Environment, 2010.
Catalogue No.: En164-18/2010E
ISBN: 978-1-100-10787-5
Aussi disponible en français
The Arctic
Ozone Layer
How the Arctic Ozone Layer is Responding to
Ozone-Depleting Chemicals and Climate Change

by Angus Fergusson
Acknowledgements

    The author wishes to thank David Wardle,
    Ted Shepherd, Norm McFarlane, Nathan
    Gillett, John Scinocca, Darrell Piekarz,
    Ed Hare, Elizabeth Bush, Jacinthe Lacroix
    and Hans Fast for their valuable advice
    and assistance during the preparation of
    this manuscript.

i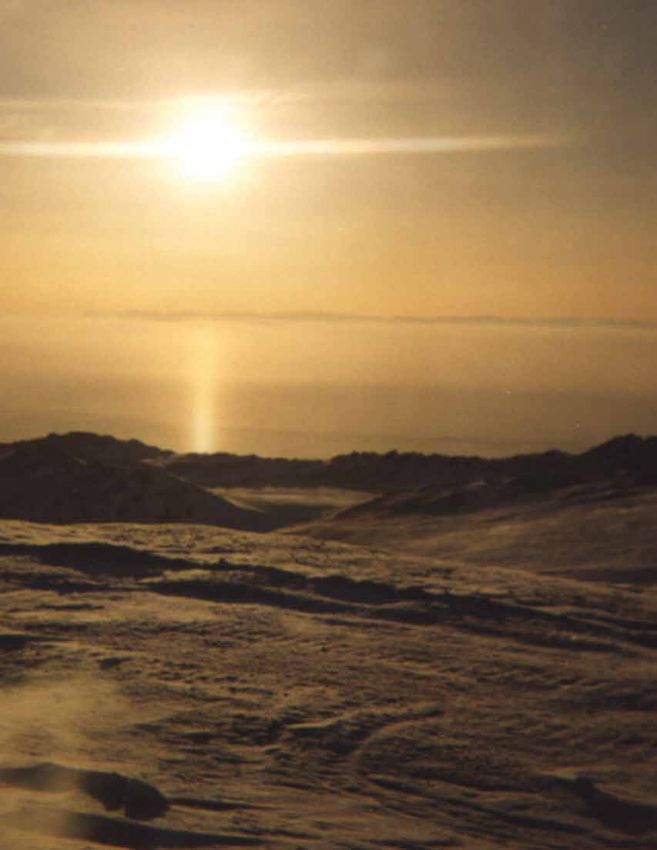
Contents

  Summary...................................................................................................................................................... v

  Introduction................................................................................................................................................. 1

  The Natural Ozone Regime and the Arctic............................................................................................ 5

  Ozone-Depleting Substances and their Impact on the Arctic Ozone Layer..................................... 9

  Other Factors Affecting Arctic Ozone Depletion................................................................................ 13

  The Linkages between Climate Change and the Ozone Layer.......................................................... 17

  Research and Observations: the State of the Arctic Ozone Layer..................................................... 23

  The Future of the Arctic Ozone Layer................................................................................................... 31

  Useful Links on the Internet................................................................................................................... 34

  Bibliography............................................................................................................................................... 35

  Glossary...................................................................................................................................................... 36

  Notes........................................................................................................................................................... 37

                                                                               iii
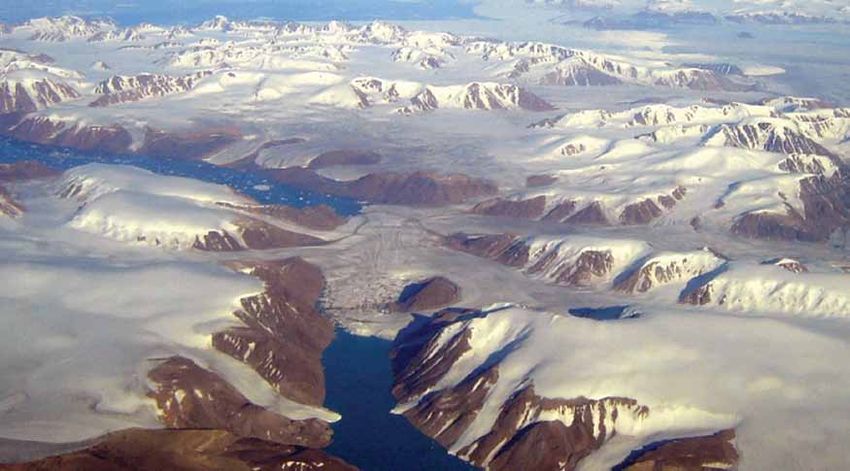
Looking north over
     Ellesmere Island, Nunavut

iv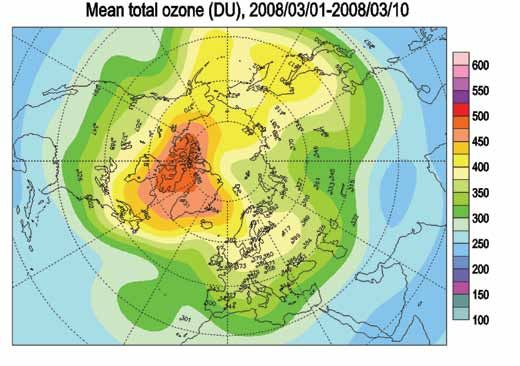
Summary

The report Arctic Ozone: The Sensitivity of the Ozone        total ozone values in the Northern Hemisphere
Layer to Chemical Depletion and Climate Change               reversed their downward trend starting in about
was published in 1998, based on research carried             2000 and increased at a rate that was higher than
out from the 1960s to the mid-1990s. Over the last           what had been expected from the change in the
10 years, significant advances have been made in             concentration of ozone-depletion substances in
ozone depletion science, namely in monitoring                the atmosphere. Over the same time period, the
and observation, analysis and computer modelling.            serious Arctic ozone depletion episodes continued
This report updates the science, looking into how            to occur during abnormally cold years, but the
the Arctic ozone layer has evolved since 1998. The           intensity of the cold years diminished (Fioletov
most recent information is based on work reported            2008). Even though ozone depletion is still occur-
in the World Meteorological Organization’s                   ring in the Arctic atmosphere, it has not been in
Scientific Assessment of Ozone Depletion: 2006, the          the same proportions since 2000. This may be due
United Nation Environment Programme’s 2006                   to a strengthening of the stratospheric circulation
Environmental Effects of Ozone Depletion and its             increasing the abundance of stratospheric ozone
Interactions with Climate Change, the 2005 Arctic            in the Arctic and warming the Arctic stratosphere.
Climate Impact Assessment and the special March              This change could be partly due to increased energy
2008 issue of Atmosphere-Ocean: “Ozone Science               driving of the stratosphere, an expected response to
in 2007: A Canadian Perspective on Ozone in the              greenhouse gas increases, or partly due to natural
Changing Atmosphere.”                                        variability.
During the 1990s when the Arctic atmosphere                  Research has shown that large increases in ultra-
was unusually cold, scientists observed extensive            violet radiation at the earth’s surface as a result of
ozone losses over the Arctic and were concerned              severe ozone depletion are highly damaging to
that episodes of serious ozone depletion could               sensitive Arctic life forms. In abnormally cold years,
become even more frequent. There was also unease             Arctic ozone levels have been 30 to 60 percent
among scientists that ozone losses over the Arctic           below normal in the spring, which produced a cor-
could reduce ozone amounts over the middle                   responding but slightly larger increase in ultraviolet
latitudes as a result of the mixing of air masses. The       radiation at the earth’s surface. Although ultraviolet
concern was that concentrations of ozone-depleting           radiation levels are generally very low in the Arctic
chemicals containing chlorine or bromine atoms               in spring, the increase in ultraviolet radiation has
would be near peak levels at the end of the 20th             caused concern about human and environmental
century, and the cooling of the Arctic stratosphere          impacts, such as increased incidence of sunburns
resulting from increases in the concentration of             and snow blindness that had not been previously
carbon dioxide in the atmosphere could create                observed. The warming of the northern climate
more favourable conditions for ozone depletion               has accompanied a decrease in the extent of ice
than had previously existed. In other words, at the          and snow cover in polar and sub-polar areas. Since
end of the 20th century, the Arctic was expected to          ice and snow strongly attenuate the penetration
be vulnerable to significant ozone depletion for the         of ultraviolet radiation into the water column, the
subsequent 20 years.                                         extreme decrease in the sea ice and snow cover that
                                                             occurred in the late summer of 2007 and in 2008
Since 2000, however, scientists have observed                altered the exposure of aquatic ecosystems to solar
changes in the total ozone and temperatures in               ultraviolet radiation. An increase in ultraviolet
the atmosphere of the Northern Hemisphere. The

                                                         v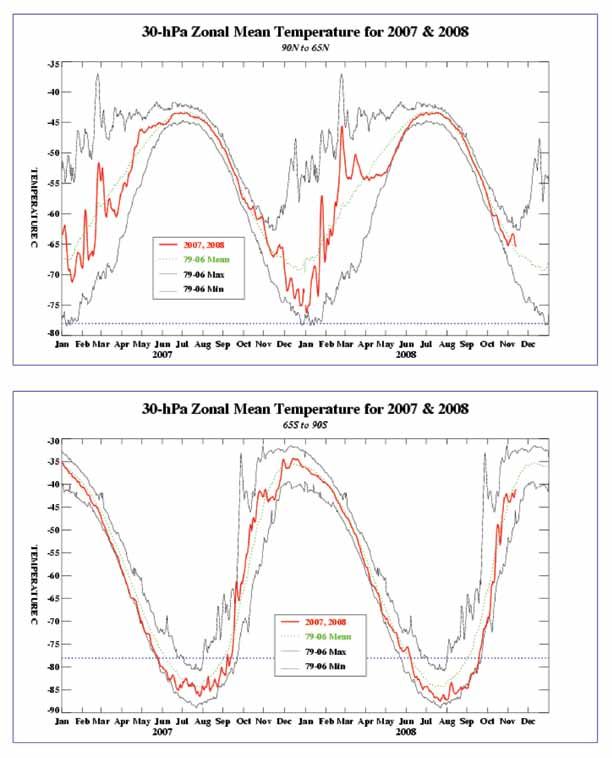
radiation has been shown to damage organisms that             every spring, as shown in Figure 1. Over the
live near the surface of the water during their early         Arctic, similar processes occur, but ozone amounts
stages of life.                                               have not fallen to the very low levels observed in
                                                              Antarctica. This is partly because the Arctic has a
Severe losses of ozone over both the Arctic and               higher concentration of ozone in the late winter and
Antarctic are the result of special meteorological            spring. It is also a result of the variable atmospheric
conditions that occur over polar regions in the               circulation of the northern hemisphere, which
winter and early spring. As winter arrives in each            makes the Arctic circulation vortex less stable. As a
hemisphere, a vortex of winds develops around the             result, incursions of air from the south often keep
poles and isolates the polar stratosphere. Without            the Arctic stratosphere too warm for PSCs to be
milder air flowing in from the lower latitudes, and           formed.
in the absence of sunlight, air within the vortex
becomes very cold. At temperatures of −78°C or                Arctic ozone depletion will continue to be of
less, clouds made up of ice, nitric acid and sulphuric        concern in the coming decades as a result of the
acid begin to form in the stratosphere. Called polar          high concentration of anthropogenic ozone-
stratospheric clouds (PSCs), they give rise to a              depleting substances in the atmosphere and the
series of chemical reactions that destroy ozone far           variability of Arctic meteorological conditions.
more effectively than the reactions that take place in        Controls are in place under the Montreal Protocol
warmer air. Once PSCs are created, the destruction            on Substances that Deplete the Ozone Layer to
of ozone begins with the return of sunlight in the            phase-out the production of ozone-depleting
spring. This starts a series of chemical reactions to         substances from the atmosphere. Eliminating these
free chlorine through photolysis. The destruction             chemicals from the atmosphere will take between
continues rapidly until all the available ozone is            50 to 100 years, since ozone-depleting substances
depleted. As the atmosphere slowly warms in the               break down and are removed only very slowly from
spring, the vortex dissipates and warmer tempera-             the atmosphere. There is uncertainty about the
tures prevent further PSCs from being formed.                 severity of the impact of climatic changes caused
                                                              by increasing accumulations in the atmosphere of
                                                              greenhouse gases, such as carbon dioxide, methane,
                                                              nitric oxides and halocarbons. Changes from
                                                              radiative and chemical mechanisms brought on
                                                              by increases in these gases will affect stratospheric
                                                              ozone. In addition, the wind circulation in the
                                                              stratosphere is changing due to alterations in the
                                                              troposphere climate (Shepherd 2008), with implica-
                                                              tions for ozone and ultraviolet radiation. Although
                                                              the buildup of these gases causes warming in the
                                                              earth’s lower atmosphere, carbon dioxide also
                                                              contributes to cooling in the upper stratosphere,
                                                              through more efficient radiative cooling. Since
                                                              temperatures in the Arctic stratosphere often
                                                              come within a few degrees of the threshold for
Figure 1. The Antarctic ozone hole reached a
                                                              PSC formation, further cooling of the stratosphere
maximum size of 27 million km2 in October 2000.               could cause PSCs to form more frequently and
Source: National Aeronautics and Space Administration         increase the severity of ozone losses. Studies with
                                                              atmospheric models suggest that this effect could
Over the Antarctic, these processes commonly                  either delay or accelerate a recovery of the Arctic
lead to the formation of a massive ozone hole                 ozone layer.

                                                         vi
Continued monitoring of, and research on,
stratospheric ozone are necessary to improve
our understanding of depletion processes and
strengthen our capability to predict how the
ozone layer may respond to changing atmospheric
conditions and stresses. Canada’s involvement in
ozone research and monitoring reflects our special
concern as a northern polar nation over the fate of
the Arctic ozone layer.
The manner in which the Arctic ozone layer evolves
Muskoxen on Ellesmere Island, Nunavut. in the future will depend not only on the elimina-
tion of ozone-depleting chemicals, but also on the
A number of natural phenomena also affect Arctic control of greenhouse gases and other pollutants.
ozone levels, over time periods ranging from days These issues are linked and it makes scientific sense
to years. These include weather systems, the quasi- to address them through a comprehensive and
biennial oscillation (the periodic reversal of the integrated approach.
direction of stratospheric winds over the equator),
the El Niño southern oscillation, the solar cycle
(slight variations in solar radiation associated with
the sunspot cycle) and volcanic eruptions.
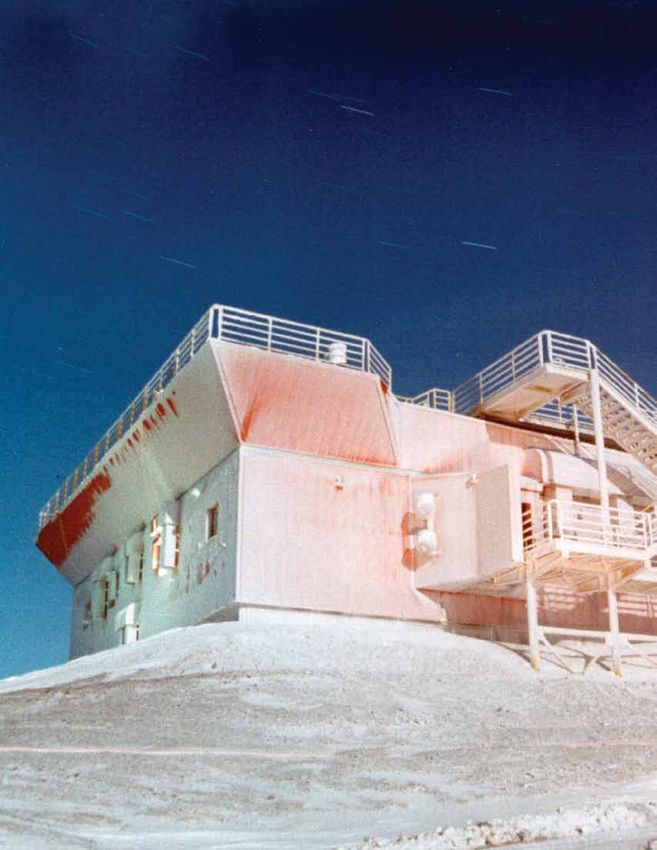
Sunset from the Polar Environment Atmospheric
Research Laboratory, Eureka, Nunavut.
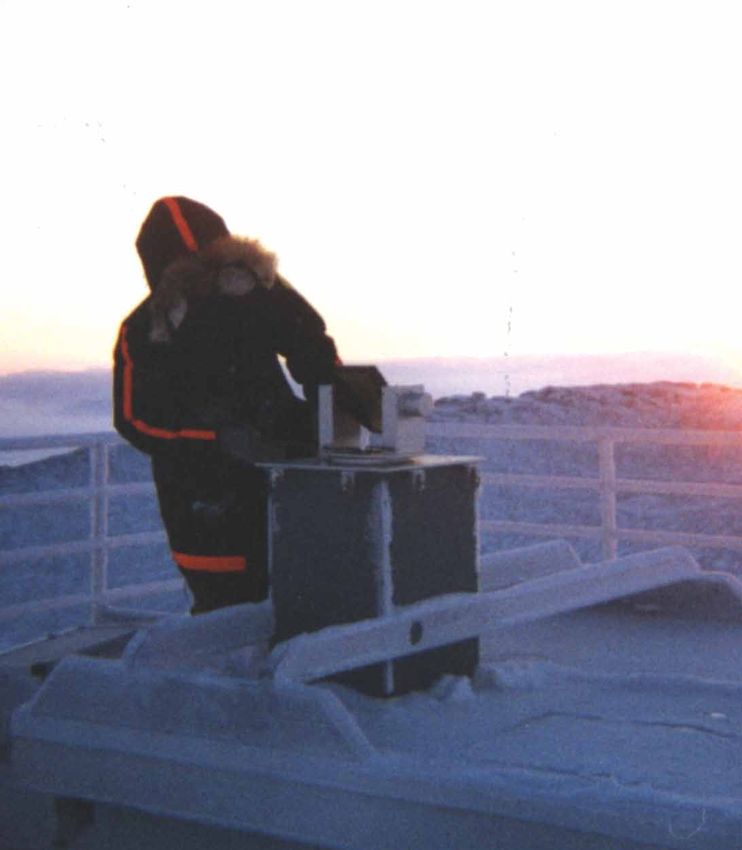
Instrumentation and scientist on top of the Polar
Environment Atmospheric Research Laboratory.
viiSunset over the Brewer
spectrophotometer,
Eureka, Nunavut
viiiIntroduction
Since the 1980s, the depletion of the Arctic ozone in Figure 2 for Resolute Bay, Nunavut. Although the
layer has been of great concern, due to the sensitivity ultraviolet radiation is normally weak in the Arctic,
of human health and the environment to increased it is reflected by snow and clouds, which increases
ultraviolet radiation (UV): elevated levels of ultra its strength and impact. For example, its reflection
violet radiation will have an impact on people living from fresh snow can almost double the amount of
in the Arctic and on Arctic ecosystems (Arctic ultraviolet radiation received, causing sun burns
Climate Impact Assessment 2005). and affecting human vision.
In 1992, Environment Canada developed the UV The other area of great concern is the reduction of
Index to provide Canadians with updates of the the extent and thickness of sea ice that has been
status of the ozone layer and information on the observed in the summer over the past few decades.
intensity of erythermal ultraviolet radiation (which The loss of sea ice allows the ultraviolet radiation
causes sunburns) reaching the earth’s surface. In to enter the water column and alter the exposure of
Canada, the UV Index ranges from 0 to 11, with 11 aquatic ecosystems to ultraviolet radiation.
being an extreme value of the intensity over south-
ern Ontario in June. The UV Index is normally low Ecologists have serious concerns about the possible
in the Arctic for most of the year, reaching into the effects on Arctic plants and animals of major ozone
moderate range during the summer, as illustrated losses and the corresponding increase in ultraviolet
Max. UV Index
Resolute, CAN (74.705N, 94.969W, 40m) Brewer MKII #31 2008
10 Very high
8
High
UV Index
6
Moderate
4
2 Low
0
J F M A M J J A S O N D
Month
Figure 2. The daily maximum ultraviolet index for Resolute Bay, Nunavut, in 2008.
Source: Archive Preliminary
1radiation. Because Arctic life has evolved in an since 1982, reaching a maximum size in 2000 of
environment in which ultraviolet radiation levels 29 million km2. In comparison, severe ozone deple-
are normally low, organisms may be extremely tion has only occurred in the Arctic during very
sensitive to the increased radiation that reaches cold years. For example, as shown in Figure 3, severe
the earth’s surface during periods of significant ozone depletion occurred in the Canadian Arctic
ozone depletion. in 1997, decreasing to more than 45 percent below
pre-1980 means on individual days. In Sweden in
Since 1990, the Arctic ozone layer has experienced the spring of 2000, ozone loss was observed to reach
severe ozone depletion in 10 out of the last 18 years, 70 percent at an altitude of 20 km; ozone losses of
all when the Arctic stratosphere was unusually 40 percent were estimated for southern Greenland
cold. Although ozone depletion occurs as a result for the first 10 days of March 2005.
of the elevated concentration of ozone-depleting
substances in the atmosphere, cold temperatures Concentrations of known ozone-depleting sub-
less than –78°C and a stable wind circulation of the stances in the stratosphere peaked between 1995
Arctic atmosphere for a long period during the late and 2000, but remained close to their peak levels
winter and spring can create conditions that are for the subsequent decade because of their long
right for severe depletion. A stable wind circulation lifetimes in the atmosphere. There are, however,
limits the possibility of the incursion of warm air other forces at work in the Arctic atmosphere. The
from the mid-latitudes known as stratospheric loss of stratosphere ozone over the pole causes the
sudden warming. The cold conditions allow for the stratosphere to cool, since ozone absorbs sunlight.
formation of polar stratospheric clouds that provide In addition, climatic changes stemming from the
a surface for the conversion of stable compounds buildup of greenhouse gases may be altering the
into unstable chemicals. With the energy provided Arctic stratosphere in ways that could potentially
by sunlight, the unstable chemicals break apart increase the intensity of ozone depletion events
rapidly and release the chlorine and bromine atoms during abnormally cold winters. Severe ozone deple-
that destroy the ozone. tions in the Arctic also have repercussions for ozone
levels elsewhere in the Northern Hemisphere. After
Although this pattern continues today, there has a severe ozone depletion event, the ozone-poor
been a decrease in the intensity of very cold years Arctic air mixes with and dilutes the ozone content
since 2000. The Arctic atmosphere appears to be of air further south. Indeed, the polar regions, with
warming and fewer severe ozone depletion episodes their unique atmospheric processes, may influence
are occurring. This could be due to an increase in the rate of recovery of the global ozone layer.
stratosphere circulation, which is moving more
air and ozone from the tropics to the pole. The The Government of Canada is especially concerned
air warms adiabatically as it descends through about the future of the Arctic ozone layer, due to the
the stratosphere into the troposphere in the polar country’s vast northern territories. The Government
region. The result has been fewer very cold years has conducted extensive monitoring and research
in the Arctic and fewer years with severe ozone to measure trends and changes in the Arctic strato-
depletion. Scientific assessments suggest that the sphere. Canadian scientists have also placed a high
Arctic atmosphere will continue to be vulnerable to priority on collaborating with their counterparts
ozone depletion over the next 10 to 20 years during around the world to improve scientific understand-
abnormally cold years. In the years when the Arctic ing of processes affecting Arctic ozone as well as
atmosphere is warm, ozone depletion will be at global ozone generally.
levels similar to those for the middle latitudes.
This report summarizes what is known about the
Ozone depletion rates in the Arctic have not been as state of the Arctic ozone layer and the processes
high as those in the Antarctic. Massive ozone holes that affect it. Some of these processes are natural
have formed over Antarctica almost every spring and contribute to normal daily, seasonal and annual
2variations in ozone amounts. Others stem from However, whether Arctic ozone depletion becomes
ozone-destroying pollutants released by human more serious before it gets better will ultimately
activities, which result in long-term changes to the depend on the complex interaction of all these
ozone layer. There are also crucial links between elements and the degree to which the Parties to the
Arctic ozone destruction and changes occurring Protocol meet the control measures of the Montreal
in the stratosphere as a result of climate change. Protocol. If all the Parties are successful, and if our
Current controls under the 1987 Montreal Protocol current understanding of the science holds true,
on Substances that Deplete the Ozone Layer we would expect the Arctic ozone layer to return to
should eventually repair much of the damage done. pre-1980 levels by the middle of this century.
Figure 3. Deviation in total ozone changes over the Canadian Arctic from 1965 to 2009.
Source: Fioletov, 2008
3Iqaluit, Nunavut, March 2007 4
The Natural Ozone Regime and the Arctic

Ozone forms in the stratosphere (the atmospheric            in Figure 4, but in any given place, average natural
layer that lies between about 10 and 50 km above            ozone levels tend to be much the same from one
the earth’s surface) when powerful ultraviolet              decade to another.
rays in sunlight break up oxygen molecules (O2),
                                                            Ozone amounts above a point on the earth’s
liberating oxygen atoms (O) that then combine
                                                            surface are commonly measured in Dobson Units
with intact oxygen molecules to form ozone (O3).
                                                            (DU), with 100 DU corresponding to 1 mm of
Most of the stratosphere’s ozone is produced over
                                                            ozone at standard temperature (0°C) and pressure
the tropics, where ultraviolet rays penetrate deeply
                                                            (1013.25 millibars or one atmosphere or “atm”).
into the atmosphere. Stratospheric winds distribute
                                                            Most of this ozone is in the stratospheric ozone
the ozone over the rest of the world. Eventually,
                                                            layer, but a small amount (about 10 percent) is
sunlight destroys the ozone in reactions involving
                                                            also present near the earth’s surface, brought down
chlorine, bromine, water vapour, nitrogen oxides
                                                            by air currents from the stratosphere, created by
and other substances in the air. In an undisturbed
                                                            chemical reactions involving air pollutants or
natural system there is always enough new ozone
                                                            present naturally. Average yearly ozone values range
coming in from the tropics to replenish these losses.
                                                            from a low of 260 DU in the tropics to a high of
This does not mean that the amount of ozone in
                                                            380 DU in the Arctic. In early spring, ozone levels
the stratosphere is always constant. The amount, in
                                                            over parts of the Arctic commonly exceed 500 DU
fact, varies considerably from day to day, season to
                                                            on some days, as shown in Figure 5.
season, year to year, and place to place, as shown

Figure 4. Surface plot of zonal mean total ozone as a function of latitude and month, estimated from ground based
data for the period from 1964 to 1980.
Source: Fioletov 2008

                                                        5
Figure 5. Mean total ozone over the northern hemisphere for the period from March 1 to 10, 2008.
Source: WOUDC
The fact that the highest ozone levels in the world poles. This difference causes the boundary between
are found over the Arctic is, at first glance, surpris- these layers, known as the tropopause, to slope
ing, but there are at least three good reasons why from the equator to the poles, at first gradually, then
this is so. First, the total absence of sunlight for more steeply, similar to the slope of the bottom of
several weeks to months during the Arctic winter a swimming pool. Because the deepest part of the
slows down the destruction of ozone. Without solar stratosphere is over the Arctic, it can hold more
energy to split ozone molecules apart, the natural ozone than can the stratosphere over the tropics or
breakdown of ozone slows considerably. Second, the
flow of ozone towards the pole is generally greater
in the winter than at other times of the year. This
seasonal bias appears to be related to seasonal shifts
in upper-level wind patterns that provide much of
the energy that drives the air and, therefore, ozone
in the stratosphere toward the pole. Third, the
stratosphere is deeper over the polar latitudes than
anywhere else in the world. To understand why,
it is necessary to look at the atmosphere’s vertical
structure (see Figure 6). The stratosphere sits on
top of the troposphere, which is the lower, more
turbulent layer of the atmosphere where weather
activity takes place. The troposphere commonly
occupies as much as the bottom 18 km of the atmo-
sphere in the tropics but only about 8 km near the The High Arctic Weather Station at Eureka.
6middle latitudes. As for the Antarctic, ozone values Ozone accumulates gradually in the Arctic strato-
there, even before any depletion, have always been sphere during the winter as the rate of supply from
lower than those in the Arctic. The difference is due the tropics exceeds the natural rate of destruction.
to the geography and meteorology of the southern With the arrival of spring, ozone values reach to
hemisphere, which influence the stratospheric wind 450 DU or more. The reappearance of the sun
circulation from the tropics to the south pole. In the increases the pace of ozone destruction, however,
stratosphere, the vertical and north-south compo- while the rate at which ozone is transported from
nent of the wind circulation—rising in the tropics, the tropics falls off considerably and remains low
moving towards the pole in middle latitudes and throughout the summer. Consequently, ozone levels
descending in the polar regions—is known as the decline from the late spring high of approximately
Brewer-Dobson circulation. 450 DU to about 300 DU in October.
Figure 6. Left panel: Annual mean ozone mixing ratio (the fractional concentration of ozone as the number
of ozone molecules per million air molecules). Middle panel: A schematic diagram showing the structure and
circulation of ozone from the tropics towards the poles in the atmosphere. Right panel: The mean pressure that
ozone alone creates in the atmosphere illustrating ozone structure and concentration.
Source: Fioletov, 2008
7Baffin Island in the
Canadian Arctic, March 2007
8Ozone-Depleting Substances and their
Impact on the Arctic Ozone Layer
The ozone layer was created over the earth some Most of these ozone-depleting chemicals can
two billion years ago and is believed to have been survive for many years, becoming horizontally
relatively stable ever since. In the mid-1970s, and vertically well mixed in the lower atmosphere.
scientists discovered that industrial chemicals The chemicals are eventually carried up to the
such as chlorofluorocarbons were changing tropopause by air motion or convection, where they
the chemical balance in the upper atmosphere, ascend into the stratosphere in association with
causing stratospheric ozone to be destroyed at a the Brewer-Dobson circulation or other dynamics.
faster-than-normal rate. Depletion of the ozone Once there, these compounds gradually rise above
layer is occurring because human activities have the ozone layer to be broken down by the sun’s
increased the natural abundance of ozone-depleting intense ultraviolet radiation, which releases their
substances in the stratosphere, causing an increase chlorine or bromine atoms. Chlorine and bromine
in the rate of destruction of stratospheric ozone are powerful ozone destroyers because they act
that exceeds the natural rate of replenishment. catalytically—that is, they are part of reactions that
Ozone-depleting substances are stable chemicals destroy ozone but are not themselves consumed, so
in the lower atmosphere but degrade under intense they are free to be part of more of these reactions.
ultraviolet radiation in the upper stratosphere Consequently, a single atom of chlorine or bromine
and release their chlorine or bromine atoms. can destroy hundreds of thousands of ozone mol-
Man-made ozone-depleting substances include ecules before it returns to the troposphere and is
chlorofluorocarbons, hydrochlorofluorocarbons, removed by other chemical reactions. It is estimated
carbon tetrachloride, methyl chloroform, methyl that the burden of chlorine in the atmosphere rose
chloride and methyl bromide. Of these chemicals, from a natural state of 0.5 parts per billion before
only methyl chloride and methyl bromide are found the invention of chlorofluorocarbons to 3.5 parts
naturally in the environment as well as being indus- per billion by 1994.
trial chemicals.
Over polar regions, two additional factors make
Chlorofluorocarbons are highly versatile chemicals ozone destruction brutally efficient for several
that have been widely used as refrigerants, foams weeks in the spring. The first of these is the polar
and spray propellants as well as in an extensive vortex, a closed natural circular wind circulation
variety of industrial applications. They are also the system that develops around the poles with the
predominant ozone-destroying substances in the onset of winter, isolating the polar air from middle
stratosphere, responsible for the largest percentage latitude air. Without sunlight and warmer air
increase of chlorine in the atmosphere. Halons and flowing in from lower latitudes, the polar strato-
methyl bromide are also major ozone-depleting sphere becomes extremely cold, with temperatures
substances that contain the bromine atom and falling to –78°C or lower. At these temperatures,
whose concentrations have been growing in the the second factor comes into play—the formation
atmosphere in recent years. The bromine atom is of polar stratospheric clouds (PSCs), made up of
about 60 times more effective at destroying ozone in ice, nitric acid and sulphuric acid. In the absence
the stratosphere than the chlorine atom but is found of PSCs, most of the chlorine and bromine in the
in much smaller concentrations. Halons were used stratosphere is locked up in compounds that would
mostly in fire extinguishers, while methyl bromide be quite stable and therefore harmless to the ozone
is still used as a fumigant and pesticide. layer under ordinary circumstances. However,
9Figure 7. Ozone deviations from normal in Dobson units per kilometer (top panel) and temperature deviations from
normal in degrees Celsius over the Resolute, Eureka and Alert, Nunavut (bottom panel): three-month running mean
values. The panels indicate the close correlation between extensive ozone depletion (dark blue in top panel) and
cold stratospheric temperatures below −78°C.
Source: Fioletov 2008
PSCs provide a surface on which these compounds vortex dissipates (allowing the return of ozone-rich
can break down, leaving the chlorine and bromine air from the tropics) and warmer temperatures
atoms in less stable compounds. When sunlight prevent the formation of PSCs. Over the Arctic,
returns in the spring, solar radiation breaks these the same processes intensify depletion; however,
compounds apart, releasing the chlorine and research indicates that conditions will not develop
bromine atoms. Ordinarily, the reactions that to thin the ozone layer to anywhere near to the
destroy ozone require strong sunlight. However, same extent as in the Antarctic. Why the difference?
with the cold temperatures and the especially high A major factor is that the greater variability of the
concentrations of chlorine present in the vicinity atmospheric circulation in the northern hemisphere
of PSCs, the reactions that do take place in the makes the Arctic vortex much less stable than its
spring sunshine are actually far more effective at southern counterpart. As a result, it is frequently
destroying ozone in comparison to those at middle penetrated by stratospheric flow patterns that bring
latitudes. Without the flow of fresh ozone from ozone and warmer air from the south, as illustrated
lower latitudes, which is blocked by the vortex, in Figure 8. This figure depicts the zonal mean
ozone amounts drop rapidly and deeply as these temperature, which is the mean temperature com-
reactions proceed, as shown in Figure 7. In some ponent along the local parallel of latitude. Because
layers of the stratosphere, the ozone may be almost of these events, known as stratospheric sudden
completely destroyed. warmings, the Arctic stratosphere becomes too
warm for PSC formation. Consequently, PSCs do
Over the Antarctic, these processes commonly lead not form as often in the Arctic nor do they last as
to the formation of a massive ozone hole (defined as long as they do over the Antarctic. For that reason,
an area in which total ozone amounts are less than no single massive ozone hole has ever developed
220 DU). This hole does not fill in until the winter over the Arctic.
10Figure 8. Zonal minimum temperatures for 2007 and 2008 for the Arctic (top panel) and the Antarctic (bottom
panel). The warming of the Arctic stratosphere is clearly evident in late February 2008. In comparison, the
stratosphere over the Antarctic in 2008 was colder than average, and the warming occurred in late spring as the
vortex dissipated.
Source: Climate Prediction Center, National Oceanic and Atmospheric Administration
11Sunset from the Polar
Environment Atmospheric
Research Laboratory,
Eureka, Nunavut
12Other Factors Affecting
Arctic Ozone Depletion
Although ozone-depleting chemicals and the 2000, for example, the QBO was predominantly
unique depletion processes of the polar strato- in its westerly phase and large ozone losses were
sphere have the most dramatic impact on Arctic recorded in the Arctic. In 1994, 1996, 1998, 2005
ozone, several other factors affect ozone levels. For and 2006, it was in its easterly phase. Depletion was
example, day-to-day changes as large as 25 percent minimal, as expected, in 1994, 1998 and 2006, but
of the mean total ozone are often associated with losses as high as 30 percent and 45 percent occurred
the movement of weather systems and pressure in 1996 and 2005, respectively. These unexpected
patterns in the troposphere, and with changes in the results suggest that factors other than the QBO had
height of the tropopause. Long-term changes have a substantial effect on ozone levels in those years.
been linked to a variety of other natural processes,
of which the most significant are the periodic
reversal of stratospheric winds over the equator
(the quasi-biennial oscillation), El Niño southern
oscillation, the solar or sunspot cycle, and volcanic
eruptions. Many of these processes affect the flow
of ozone directly or do so indirectly through other
processes. For example, the solar cycle affects
atmospheric pressure and wind circulation, thereby
affecting the flow of ozone in the stratosphere.
Variations in solar UV associated with the solar
cycle directly affect the production of ozone in the
upper stratosphere, which in turn influences ozone
in the lower stratosphere.
The Quasi-Biennial Oscillation Figure 9. Warming (red area) of the tropical Pacific
Ocean due to El Niño.
Over the equator, the stratospheric winds circle the Source: NASA
globe in either an easterly or a westerly direction.
Every 20 to 30 months the direction reverses, start- El Niño Southern Oscillation
ing from the top of the stratosphere and working
As shown in Figure 9, El Niño is a periodic
down. This phenomenon is known as the quasi-
warming of the eastern equatorial Pacific Ocean.
biennial oscillation (QBO). Its ultimate cause is not
Occurring roughly every three to seven years,
fully understood, but it is thought to be created by
it is accompanied by a reversal of normal pres-
the upward propagation of energy in atmospheric
sure patterns over the Southern Hemisphere (a
waves from the troposphere. The QBO is known
phenomenon known as the southern oscillation),
to influence a variety of atmospheric phenomena,
which results in disturbances of prevailing weather
including stratospheric ozone amounts over the
patterns in much of the world. Because El Niños
middle and high latitudes. When the QBO is in its
also change normal pressure patterns in the upper
westerly phase, polar stratospheric temperatures
troposphere, they alter the height of the tropopause,
tend to be lower, the Arctic vortex stronger, the
affect the transport of ozone toward the poles, and
transport of ozone toward the pole reduced and
cause changes in ozone levels over many parts of
ozone depletion greater. In 1993, 1995, 1997 and
the world.
13One of the strongest observed El Niños occurred
in 1997 and 1998, the consequence of which was
a deepening of the Aleutian Low, a large, semi-
permanent low pressure area over the northeastern
Pacific Ocean. It is an important feature in the
large-scale circulation of the atmosphere, and its
strengthening may well have made the Arctic vortex
less stable and more subject to the stratospheric
sudden warmings that moderated temperatures
within the vortex during the winter of 1998.
By making conditions less favourable for PSC
formation, the El Niño may have made a significant
contribution to the comparatively low rate of Arctic
ozone depletion that was observed in the spring of
that year. Since the El Niño of 1997 and 1998, the
others that have followed in 2002, 2004 and 2006
have been generally weak.
The Solar Cycle
Over a period of approximately 11 years, the total
energy output of the sun varies by only about
0.1 percent, changing with the growth and decay
of sunspots on the solar surface, which are shown
in Figure 10. When the number of sunspots is
greatest, the sun produces more energy than when
the number of sunspots is at its lowest. Although Figure 10. The solar cycle is a 11-year sunspot cycle.
the change in energy output is quite small, much The number of sunspots on the surface of the sun has
of it is concentrated in the ultraviolet range. Since varied between 50 and 200 since the 1750s. The solar
cycle affects the production of ozone and the average
ozone is created as a result of the breaking down of annual air pressure patterns in the stratosphere. Such
oxygen molecules by the sun’s ultraviolet radiation, pressure variations affect transport of ozone towards
more ozone will be produced in years when the the poles, with more ozone being carried into the Arctic
solar cycle is at its maximum and correspondingly when the incoming solar radiation is greatest.
Source: Solar Influences Data Analysis Centre, 2008
less ultraviolet radiation reaches the earth’s surface.
The observed variation in ozone amounts over the
cycle is approximately one to two percent. Volcanoes
Studies have linked the solar cycle maximum to Major volcanic eruptions can have a significant
a slight warming of the winter stratosphere (thus impact on stratospheric temperatures and ozone
making conditions less favourable for PSC forma- depletion over a one- or two-year period, as shown
tion) and to a strengthening of the transport of in Figure 11. That is because chemical reactions
ozone toward the poles. Both of these conditions similar to those that take place on PSCs can also
tend to diminish the extent of ozone depletion in take place on the surfaces of sulphate aerosols (fine
the Arctic. Other factors being equal, ozone deple- droplets or particles) that form in the stratosphere
tion over the Arctic is therefore likely to be lower at as a result of volcanic eruptions. These aerosols may
the peak of the solar cycle (as it was in 1968, 1979, also stimulate the formation of PSCs by various
1990 and 2001, and will be again in about 2012). indirect processes.
14The eruption of Mount Pinatubo in the Philippines period, ozone amounts in the lower stratosphere
in 1991, for example, put about 120 million tonnes in the high Arctic (between 10 and 20 km) fell to
of sulphur dioxide into the stratosphere; within about 110 DU, a low value not seen again until 1997
a week or two, atmospheric reactions converted during an episode of severe ozone depletion.
the gas into sulphate aerosols. During the next
two years, severe ozone depletion was observed Volcanoes function as a kind of wild card when
over northern mid-latitudes. Over Canada, ozone estimating future ozone depletion because
amounts in the spring of 1993 were 10 to 17 percent the timing and magnitude of eruptions are
below normal, the largest decrease that had been unpredictable.
observed up until that time. During the same
Figure 11. Globally averaged temperature variations in the lower stratosphere from a range of climate models
and observations. The eruptions of El Chichón in 1982 and Mount Pinatubo in 1991 sent sulfate aerosols and ash
into the stratosphere causing temperatures in the stratosphere to rise initially by about 1°C. They also caused
tropospheric cooling for several years afterwards since the volcanic aerosols absorbed or reflected the solar
radiation.
Source: World Meteorological Organization 2007
15Arctic flowers bloom
in the short summer season
at Eureka, Nunavut
16The Linkages between Climate Change
and the Ozone Layer
Ozone depletion and climate change are often con- Figure 12 shows the trend in temperatures for
sidered to be independent concerns. They involve Canada over the last 30 and 50 years. As shown
different atmospheric processes from one another, in Figure 12b, Canada has warmed by more than
have different impacts and are the subject of sepa- 1.3°C over the past 60 years. The greatest warming
rate international negotiations and treaties. Yet both (up to 2.6°C) has occurred in the last 30 years from
affect the same atmosphere, and, given the complex the high Arctic to the lower Hudson Bay. In com-
array of interactions and feedback that characterize parison, the Earth as a whole has warmed by about
atmospheric behaviour, it is not surprising that 0.74°C over the last 100 years (Intergovernmental
there are important linkages between them. Panel on Climate Change 2007).
Some of these linkages are very direct. For example,
the halocarbons that cause ozone depletion are also
a greenhouse gas that contributes to warming in
the lower atmosphere. Carbon dioxide, a powerful
greenhouse gas warming the lower atmosphere, is
also causing a net radiative cooling of the strato-
sphere, which may affect the evolution of the ozone
layer in the polar regions.
There are many more subtle links involving changes
in atmospheric circulations and chemical processes
in the atmosphere. For example, changes in ocean
temperatures and the energy distribution in the
atmosphere as a result of the warming of the lower
atmosphere may be changing the dynamics of the Figure 12. Above: Accumulated observed temperature
atmospheric circulation and the speed of chemical trend in Canada from 1976 to 2006. Below: Departures
reactions and processes in the atmosphere. These from the annual national temperatures and the long-
links are very important for understanding how the term average (1951–1980).
Source: Bob Whitewood, Climate Research Division,
atmosphere has changed, is changing and will change Environment Canada
as a result of the addition to it of gases and chemicals.
Climate Change
Climate change has become a very serious concern
in recent years because it will have adverse effects
on life on earth. Human activities are causing
concentrations of greenhouse gases, such as carbon
dioxide, methane, nitrous oxide, ozone and halo-
carbons, to rise well above natural levels. It is widely
accepted today that increasing the concentrations of
the greenhouse gases will cause the troposphere to
retain heat, raising the average surface temperature
of the earth and lower atmosphere.
17Carbon dioxide, released by the burning of fossil
fuels, is the most abundant of the greenhouse
gases associated with human activities, but
chlorofluorocarbons, the major players in ozone
depletion, are also powerful greenhouse gases, with
up to 10 000 times the global warming potential
of carbon dioxide. In addition, ozone, itself a
greenhouse gas, has a considerable effect on the
earth’s heat distribution. Not only does ozone add
heat to the stratosphere when it absorbs ultraviolet
radiation from the sun but it also absorbs long-wave
radiation from the earth’s surface.
The Linkages
The state of the atmosphere at any given time is the
result of a constantly adjusting balance among a
wide range of processes. By altering some of these
processes, ozone-depleting substances and green-
house gases trigger readjustments that affect other
parts of this balance. Some of these readjustments Figure 13. Vertical profile of temperature trends
have a significant effect on ozone depletion. There is obtained from model, satellite and radiosonde data
over 60°N to 60°S for the period from 1979 to 2005.
a possibility, for example, that rising concentrations Source: World Meteorological Organization 2007
of methane will raise the water vapour content of
the stratosphere, since water vapour is produced
when methane reacts with two molecules of oxygen into the troposphere. As shown in Figure 13, obser-
to produce two molecules of water plus carbon vations from satellites and radiosondes between
dioxide. Water, however, primarily flows into the 1979 and 2005 show that the lower stratosphere
stratosphere by being transported vertically across cooled by 0.5°C per decade. In the upper strato-
the tropical tropopause layer as part of the Brewer- sphere, the cooling has been more pronounced,
Dobson circulation. Many studies have reported an from 1 to 2°C per decade. Studies also indicate that
increase in water vapour over various time periods. ozone depletion has led to a smaller cooling of the
The increase can be attributed to an increase in Arctic polar vortex, which maximizes in the spring.
methane or an increase in the Brewer-Dobson Model studies suggest that only part of the observed
circulation. With more water vapour in the strato- cooling of the Arctic vortex can be attributed to
sphere, more polar stratosphere clouds could form ozone depletion.
(when temperatures are below −78°C) and ozone
The other significant cause of cooling in the
depletion would be enhanced.
stratosphere is the increase in carbon dioxide in
Ozone losses in the lower stratosphere have led to the atmosphere, which increases the rate at which
cooling of the stratosphere, because with ozone longwave radiation is emitted into space. With
depletion there is less ozone to absorb shortwave the buildup of carbon dioxide, more energy than
energy from the sun and longwave radiation from normal is emitted into space from the top of the
the earth. The cooling of the stratosphere through stratosphere as compared to the bottom of the
the loss of ozone has been shown to offset some, but stratosphere, resulting in an overall cooling as
not all, of the direct warming caused by the intro- shown in Figure 14.
duction of chlorofluorocarbons, a greenhouse gas,
18Atmosphere dynamics play an important role
in understanding and accurately describing
stratospheric ozone depletion. Dynamics affect
the distribution and abundance of stratospheric
ozone, directly through the transport of ozone
itself and indirectly through their effect on ozone
chemistry via temperature and transport of other
chemical species. With ozone-depleting substances
decreasing in the atmosphere and with the expected
impacts of climate change, the tasks for researchers
are to detect when a recovery will begin and to
determine the possible future states of the ozone
layer.
Computer models
Chemistry–climate models have become useful
tools, since they provide a consistent representa-
tion of the dynamic aspects of climate and their
coupling to ozone chemistry. A new area of model
research involves quantifying the combined effects
by evaluating the impact of stratospheric ozone
depletion and its recovery on the tropospheric
climate as well as understanding the effects of
climate change on the evolution of ozone itself.
This, in turn, requires understanding the long-term
sensitivity of the climate system to changes in the
radiation budget associated with human activities
and natural events, such as volcanoes and solar
variability, on the composition and evolution of the
Figure 14. The annually averaged temperature change atmosphere and ultimately of the effects of such
(K) for (a) total observed halocarbon change since events on the climate change signal throughout the
about 1950, (b) the change in stratospheric ozone active atmosphere and at the surface.
from 1979 to 1997, and (c) the 1980 to 2000 change in
carbon dioxide. The interactions between warming due to green-
Source: McFarlane 2008
house gases and ozone depletion can be explored
using global climate system models that incorporate
The cooling of the stratosphere over the middle not only the warming effects of greenhouse gases
latitudes has been shown to slow the speed of but also the reactions that determine the chemical
chemical reactions and, hence, ozone depletion. composition of the atmosphere. In recent years,
Over the polar regions, however, the cooling of the scientists have used estimates from complex climate
polar stratosphere increased the likelihood and computer models (coupled atmospheric–ocean
frequency of polar stratospheric clouds, leading to general circulation models and chemistry–climate
an increase in polar ozone depletion in the spring. models with interactive ozone) to predict the
Since this ozone-depleted air is exported from the general evolution of the stratosphere. All the
polar regions in the late spring as the polar wind models indicate a cooling of the global average
circulation breaks down, the concentration of ozone stratosphere similar to what is being observed.
in the middle latitudes is reduced.
19The degree of cooling varies by model and global atmosphere will result in the reoccurrence of the
scenario, but the general consensus is that there is ozone hole until about 2065. Over the Arctic,
a cooling of the global average stratosphere, from model simulations indicate severe ozone depletion
0.5 K/decade in the lower stratosphere, increas- episodes will be possible until the middle of the
ing to 2.0 K/decade in the upper stratosphere. century. The models also indicate that the interac-
Predictions of the rate of cooling in polar regions tions between ozone depletion and climate change
are much more difficult to make, due to the high have not led to large delays in ozone recovery. It
degree of variability in the Arctic atmosphere. cannot be assumed, however, that the interactions
will be linear or will proceed at the current rate.
Arctic stratospheric model simulations indicate that Some Arctic observations currently indicate that
there will not be a major decline in ozone levels in climate change is occurring faster than the rate the
the Arctic atmosphere in the years to come but that models predict. As a result, profound changes in the
it will slowly improve. This will depend to a large climate systems of the troposphere and stratosphere
degree on the temperatures of the Arctic strato- should be anticipated, with unknown interactions
sphere. Severe ozone depletion episodes will occur and impacts on the environment and human
in very cold years, similar to those that occurred in health.
2000 and 2005. Model simulations show that the
Arctic stratosphere is getting warmer with more As reported by the Intergovernmental Panel on
variability and that much of the increase in ozone Climate Change in 2007, climate models suggest
can be explained by changes in wind circulation that the earth’s average surface temperature could
rather than a reduction in chlorine or bromine in rise by another 1.5 to 4°C by 2100. The range is
the atmosphere. dependent on the emission scenario for greenhouse
gases and their rise over this century. However,
The Canadian Middle Atmosphere Model provides as the ozone layer recovers as a result of measures
results similar to those of the other major and under the Montreal Protocol, the polar stratosphere
reliable chemical–climate models in the world. For will warm as a result of the higher concentration
example (see Figure 15), it recreated the decline of ozone, the frequency of polar stratospheric
in the near-global total ozone (60°S–60°N) that clouds will decline and the strength of the westerly
occurred as the halogens increased in the atmo- winds in the vortex will decrease in the spring and
sphere and predicts a recovery, with the expected summer. In other words, the troposphere changes
decrease in future halogen concentrations. The due to the ozone depletion will reverse and the full
model also suggests a strengthening of the Brewer- effect of climate change will be realized.
Dobson circulation in the stratosphere, which
may lead to a “super recovery” to levels about four
percent more than pre-1980 levels as more ozone
is transported from the tropics to the Arctic. With
the increased circulation, the model indicates a
dynamic induced warming of the Arctic strato-
sphere that may limit the meteorological conditions
suitable for severe ozone depletion in the Arctic.
Model simulations that include climate feedback
indicate that the ozone layer over the middle lati-
tudes will return to pre-1980 levels before similar
recovery takes place in the polar regions. The
cold spring temperatures and the high abundance
of ozone-depleting chemicals in the Antarctic Arctic icebergs.
20Figure 15. The grey lines show changes in near-global total ozone as projected by three Canadian Middle
Atmosphere Model (CMAM) simulations for 1960 to 2100, relative to the 1960 to 1975 averages. The black lines are
smoothed versions of the grey lines, and the green line shows the projected changes in inorganic chlorine in the
lower stratosphere. The red line shows observed changes in ozone from 1964 to the present, relative to the 1964 to
1975 average. CMAM near-global total ozone follows the chlorine loading closely, and shows recovery to 1960 to
1975 levels occurring by 2060.
Source: Shepherd 2008
21Polar stratospheric clouds
photographed over Sweden
22Research and Observations:
The State of the Arctic Ozone Layer
Observation and Monitoring
Scientists have been active in stratospheric ozone
research since the late 1920s, but it was not until
1957 that Canada began, as its contribution to
the International Geophysical Year, to establish a
permanent network to gather data on stratospheric
ozone. At this time, it was hoped that this research
network would lead to improvements in weather
forecasting. Monitoring stations using Dobson
ozone spectrophotometers were installed at five
sites between 1957 and 1964: Edmonton (1957),
Resolute Bay (1957), Toronto (1960), Goose Bay
(1962) and Churchill (1964). The Dobson ozone
spectrophotometer, devised in the 1920s by the
pioneering British ozone researcher G. M. B.
Dobson, was used for these measurements until
1988 and then replaced by an automated Brewer
ozone spectrophotometer developed by scientists Figure 16. The Canadian ozone observation network
at Environment Canada (T. McElroy, J. Kerr and consists of 10 Brewer spectrophotometers. In southern
D. Wardle). Canada, they are located Goose Bay (Labrador),
Toronto, Churchill (Manitoba), Regina, Saskatoon and
Edmonton, and on Saturna Island in British Columbia.
In the Arctic, Brewer instruments are located in
Nunavut, at Resolute Bay, Eureka and Alert.
At all these sites, ground-based Brewer spectro-
photometer instruments measure ozone. The
instruments are programmed to make total ozone
measurements with light from the sun and/
or moon, and spectral scans of the horizontal
ultraviolet irradiance. Since the 1980s, the data
from the sites have been used to calibrate satellite
measurements.
Brewer spectrophotometers located on top of the In addition to the ground-based Brewer ozone
Environment Canada building in Toronto. observations, some 300 ozonesondes—small
instrument packages carried aloft by balloons (see
The current Canadian observation network consists Figure 17)—are launched by Environment Canada
of 10 stations, 3 of which are located in the Arctic throughout the year at Edmonton, Churchill, Goose
(Figure 16). Three additional sites, in Halifax, Bay and all three Arctic sites, to provide direct mea-
Montréal and Winnipeg, operated from the early surements of ozone concentrations at altitudes of up
1990s until 2006. to 35 km. Ozonesondes have been launched from
23Edmonton, Churchill and Goose Bay since about in by other means, such as atmospheric circula-
1970 and from Resolute Bay, Alert and Eureka since tion. Among other things, data from the Match
1966, 1987 and 1992, respectively. program clearly revealed the crucial role of sunlight
in ozone destruction. It also showed the role that
polar stratospheric clouds and ice particles play in
severe ozone depletion. The ice particles absorb and
thereby remove nitrogen compounds from stable
reservoir compounds (such as ClONO2, BrONO2,
HCl) to release chlorine or bromine atoms in
sunlight, which worsens ozone loss when the Arctic
winter is particularly cold.
Canadian researchers from universities and govern-
ments worked together to detect ozone chemical
changes in the stratosphere using very large (about
10 stories tall) research balloons. These balloons, as
shown in Figure 18 were launched from Vanscoy,
Saskatchewan, to study the stratosphere. They
carried a gondola of instruments to an altitude of
35 km at which point it was released remotely to
parachute safely back to the surface.
Figure 17. Canadian ozonesondes, such as the one
shown on the left, are launched from Edmonton,
Churchill, Goose Bay, Resolute Bay, Eureka, and Alert
to provide ozone measurements at altitudes of up to
35 km.
Source: Janice Lang, DRDC
Since 1991, Canada has participated in the
Match ozonesonde program, which coordinates
the launches of ozonesondes in the Northern
Hemisphere to probe the same air mass at different
points as it travels around the Arctic vortex. During
a Match campaign, 300 to 600 ozonesondes are
launched at 30 sites around the northern hemi-
sphere, including the six Canadian ozonesondes
sites. Data from satellites is also collected. By
analyzing the differences between measurements
taken at various times and places within this air
mass, it is possible to determine the amount of Figure 18. At ten storeys tall, the Mantra research
ozone loss due to chemical processes alone and balloon carries instruments in a small gondola to an
to avoid any distortions caused by ozone brought altitude of 35 km.
24You can also read