Noise Exposure Alters Glutamatergic and GABAergic Synaptic Connectivity in the Hippocampus and Its Relevance to Tinnitus - Hindawi.com
←
→
Page content transcription
If your browser does not render page correctly, please read the page content below
Hindawi
Neural Plasticity
Volume 2021, Article ID 8833087, 16 pages
https://doi.org/10.1155/2021/8833087

Research Article
Noise Exposure Alters Glutamatergic and GABAergic Synaptic
Connectivity in the Hippocampus and Its Relevance to Tinnitus

          Liqin Zhang ,1,2,3,4 Calvin Wu,1 David T. Martel ,1,5 Michael West,1
          Michael A. Sutton ,1,2,6 and Susan E. Shore 1,5,6
          1
            Kresge Hearing Research Institute, Department of Otolaryngology, University of Michigan, Ann Arbor, Michigan, USA
          2
            Molecular & Behavioral Neuroscience Institute, University of Michigan, Ann Arbor, Michigan, USA
          3
            Department of Otolaryngology, Peking Union Medical College Hospital, Beijing, China
          4
            Xiangya Medical School, Central South University, Changsha, Hunan, China
          5
            Department of Biomedical Engineering, University of Michigan, Ann Arbor, Michigan, USA
          6
            Department of Molecular and Integrative Physiology, University of Michigan, Ann Arbor, Michigan, USA

          Correspondence should be addressed to Michael A. Sutton; masutton@umich.edu and Susan E. Shore; sushore@umich.edu

          Received 15 April 2020; Revised 16 December 2020; Accepted 30 December 2020; Published 15 January 2021

          Academic Editor: Josef Syka

          Copyright © 2021 Liqin Zhang et al. This is an open access article distributed under the Creative Commons Attribution License,
          which permits unrestricted use, distribution, and reproduction in any medium, provided the original work is properly cited.

          Accumulating evidence implicates a role for brain structures outside the ascending auditory pathway in tinnitus, the phantom
          perception of sound. In addition to other factors such as age-dependent hearing loss, high-level sound exposure is a prominent
          cause of tinnitus. Here, we examined how noise exposure altered the distribution of excitatory and inhibitory synaptic inputs in
          the guinea pig hippocampus and determined whether these changes were associated with tinnitus. In experiment one, guinea
          pigs were overexposed to unilateral narrow-band noise (98 dB SPL, 2 h). Two weeks later, the density of excitatory (VGLUT-
          1/2) and inhibitory (VGAT) synaptic terminals in CA1, CA3, and dentate gyrus hippocampal subregions was assessed by
          immunohistochemistry. Overall, VGLUT-1 density primarily increased, while VGAT density decreased significantly in many
          regions. Then, to assess whether the noise-induced alterations were persistent and related to tinnitus, experiment two utilized a
          noise-exposure paradigm shown to induce tinnitus and assessed tinnitus development which was assessed using gap-prepulse
          inhibition of the acoustic startle (GPIAS). Twelve weeks after sound overexposure, changes in excitatory synaptic terminal
          density had largely recovered regardless of tinnitus status, but the recovery of GABAergic terminal density was dramatically
          different in animals expressing tinnitus relative to animals resistant to tinnitus. In resistant animals, inhibitory synapse density
          recovered to preexposure levels, but in animals expressing tinnitus, inhibitory synapse density remained chronically diminished.
          Taken together, our results suggest that noise exposure induces striking changes in the balance of excitatory and inhibitory
          synaptic inputs throughout the hippocampus and reveal a potential role for rebounding inhibition in the hippocampus as a
          protective factor leading to tinnitus resilience.

1. Introduction                                                         noise exposure is widely used as a method to induce tinnitus
                                                                        in animal models [10–14].
Tinnitus is a phantom perception of sound (e.g., ringing in                 Previous studies indicate that most cases of chronic tinni-
the ears) in the absence of corresponding external auditory             tus develop as a consequence of neuroplasticity in central
stimuli, which affects millions of people worldwide [1, 2].              auditory pathways and other brain regions following reduced
Tinnitus is debilitating for 1-2% of the general population             auditory input [15]. The hippocampus plays essential role in
who seek medical help [3, 4] and is comorbid with anxiety               learning, memory, and mood [16, 17], and hippocampal neu-
[5], depression [6, 7], and emotional distress [8], all of which        roplasticity can be impacted by early auditory training [18].
significantly affect quality of life. The most common factor              Previous studies implicate the hippocampus in tinnitus
associated with tinnitus is noise overexposure [9]. Therefore,          [19–22]. Acute, high-intensity noise induces rapid Arc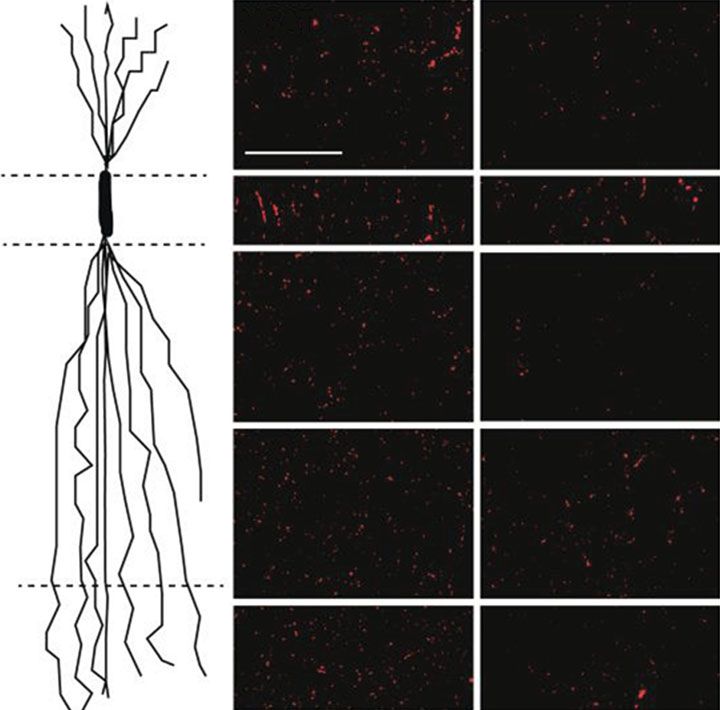
2                                                                                                               Neural Plasticity

protein expression in the rat hippocampus [23], alters the         weeks after a unilateral noise exposure, we found primarily
responses of hippocampal place cells [21], and impairs             opposite changes in excitatory and inhibitory synapse density
hippocampal-dependent learning [24]. In humans, it has             throughout the hippocampus—VGLUT-1 density largely
been demonstrated by resting-state fMRI that tinnitus loud-        increased, while VGAT density exhibited robust decreases
ness is positively correlated with bilateral hippocampal activ-    in numerous hippocampal subregions, including the DG
ity [22], while BOLD fMRI has revealed a decline in                and areas CA3 and CA1. All these changes were evident bilat-
functional connectivity between lower auditory brainstem           erally. To investigate whether these changes were persistent
regions and hippocampus in tinnitus patients [25]. Collec-         and potentially relevant to tinnitus, we designed a second
tively, these findings suggest a potential role for the hippo-      experiment using animals exposed to the same noise band
campus in the altered auditory processing associated with          twice four weeks apart, a paradigm that induces tinnitus in
tinnitus.                                                          a subset of animals [11, 44]. Twelve weeks after the initial
     Neural information processing relies on the proper bal-       noise exposure, VGLUT-1 and VGLUT-2 density recovered
ance of excitation and inhibition. In the hippocampus, a pro-      regardless of tinnitus phenotype, but VGAT density recovery
posed basic route of information processing occurs via             was markedly different depending on whether the animals
excitatory glutamatergic projections forming the so-called         exhibited tinnitus: exposed animals that were resistant to tin-
“trisynaptic circuit” [26, 27], characterized by feed-forward      nitus showed similar or even higher levels of VGAT labeling
excitatory projections via the perforant path from entorhinal      compared to controls in every hippocampal subregion exam-
cortex (EC) to dentate gyrus (DG), the mossy fiber pathway          ined, while animals that developed tinnitus exhibited persis-
to hippocampal area CA3, and Schaffer collateral projections        tent reduction in VGAT density in the DG and areas CA3
to area CA1 [28].                                                  and CA1. Collectively, our results identify a novel association
     The information flow in the “trisynaptic circuit” is medi-     between remodeling of GABAergic innervation in the hippo-
ated via neurotransmission, in which vesicular transporters        campus and the pathophysiology of noise-induced tinnitus.
play essential roles. A vesicular transporter is a membrane
protein that regulates or facilitates the movement of specific      2. Materials and Methods
molecules across a vesicle’s membrane, thus governing the
concentration of molecules within a vesicle. Vesicular gluta-      2.1. Animals. The same animals were used as in a previously
mate transporters form a family of proteins responsible for        published work from our lab [45]. Pigmented guinea pigs of
the transport of glutamate into vesicles, thus playing an          either sex (n = 19) were obtained from Elm Hill Labs at 2-3
indispensable role in glutamatergic transmission. VGLUT-1          weeks of age. Animals were housed two per cage in a temper-
is the predominant isoform in the hippocampus, which crit-         ature and humidity-controlled environment and had free
ically affects the efficacy of hippocampal glutamatergic syn-         access to water and food. All animal procedures were per-
aptic transmission [29, 30]. VGLUT-2 is the major isoform          formed in accordance with protocols established by the
in thalamocortical sensory projections and is localized to         National Institutes of Health and approved by the University
the granule cell layer of the DG [31]. VGLUT-2 is pivotal          Committee on Use and Care of Animals at the University of
to the proper development of mature pyramidal neuronal             Michigan.
architecture and plasticity in the hippocampus [32]. Immu-
nohistochemistry and in situ hybridization of VGAT                 2.2. Experimental Design. The first experiment was designed
revealed that the transporter is expressed in the GABAergic        to investigate the effects of noise exposure on the hippocam-
and glycinergic neurons of neocortex, hippocampus, cerebel-        pus (Figure 1(a)). Animals were divided into noise-exposure
lum, striatum, septal nuclei, and reticular nucleus of the thal-   group (n = 5) and Sham controls (n = 3). Animals were
amus [33, 34]. Inhibition of the principal neurons in the          noise-exposed/sham-exposed once. Auditory brainstem
hippocampus is performed mainly by a heterogeneous group           responses (ABRs) were recorded in response to tone bursts
of GABAergic interneurons, which regulate the overall level        before, immediately after, and two weeks after the noise
of excitability in the network and contribute to hippocampal       exposure to assess shifts in hearing thresholds. Two weeks
oscillations [35]. Dysfunction of GABAergic inhibition is          following the noise exposure, animals were sacrificed, and
related to several neurological diseases including epilepsy        brains were collected as described below in brain collection
[36–38], schizophrenia [39, 40], and autism [41, 42]. Further-     and tissue preparation.
more, noise-exposed rats exhibit reduced GABA levels and               The second experiment was conducted to further investi-
upregulation of glutamic acid levels in the hippocampus            gate whether the changes seen two-week postnoise exposure
and performed worse on Morris Water Maze tests [43].               persisted and evaluate its relevance to tinnitus (Figure 2(a)).
These findings raise the question of whether hippocampal            Animals (n = 19) were exposed to the same noise band
glutamatergic and GABAergic innervation is affected by              (n = 13)/sham (n = 6) twice four weeks apart and assessed
noise exposure, whether these changes are persistent, and          for tinnitus development using gap-prepulse-inhibition of
whether they are associated with tinnitus.                         acoustic startle reflex (GPIAS). Baseline data were collected
     Here, we examined immunohistochemical labeling of             4 weeks prior to the first noise exposure, and GPIAS experi-
VGLUT-1, VGLUT-2, and the vesicular GABA transporter               ments were performed twice a week for 4 weeks. The postex-
(VGAT) to investigate glutamatergic and GABAergic inner-           posure data was collected 8 weeks after the first noise
vation in the hippocampus after noise exposure and further         exposure, and the frequency and duration of the experiment
explored the relevance of these changes to tinnitus. Two           were the same as at baseline. All GPIAS experimental data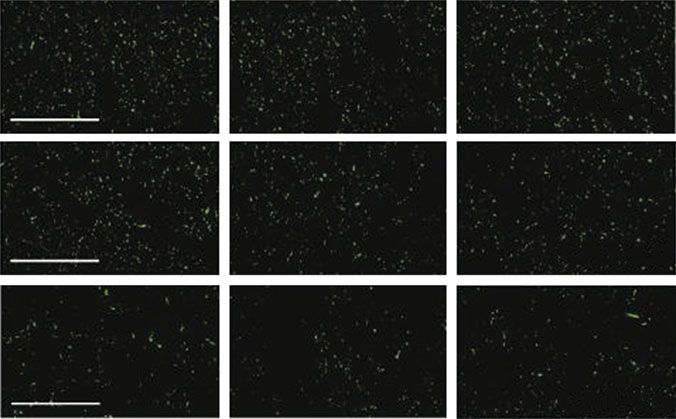
Neural Plasticity                                                                                                                   3

            Noise exposure (2h)                                      2.4. Tinnitus Assessment. Gap-prepulse inhibition of acoustic
           97 dB                                                     startle (GPIAS) was used for tinnitus assessment and per-
                                                                     formed as previously described [11, 44]. A constant back-
               0                                                     ground carrier (band limited at 8-10, 12–14, 16–18, and 20-
                      7 kHz               Sacrifice
                                                                     30 kHz) was presented at 65 dB SPL. Because the guinea-pig
       n=8                                       Exposed (n = 5)     pinna reflexes to startle pulses have been shown to be less
                                2w                                   variable than whole body startles [46], we quantified pinna
                                                                     reflex startle responses evoked by broadband noise pulses
                                                 Control (n = 3)
                                                                     (20 ms) at 95 dB SPL. Startle reflexes were inhibited by a
                Sham exposure                                        silent gap (50 ms) or prepulse noise (75 dB SPL) 100 ms
                                  (a)                                before the startle pulse. To quantify the pinna reflex ampli-
                                                                     tude, pinna tips of animals were marked with nontoxic,
                                        CA1                          water-soluble green paint, manually applied by trained inves-
                                                                     tigators. Green pixels were identified using a custom-written
                                        DG                           k-nearest neighbor classifier algorithm (Mathworks
                                                      EC
                                                                     MATLAB). Frames where green points constituted less than
                    CA3
                                                                     0.01% of pixels were excluded, as this indicated the animal’s
                                  (b)                                ears were not located in the frame. Pinna locations were iden-
                                                                     tified by clustering green pixels and computing the centroids
Figure 1: Experimental procedures of two-week postnoise-             of a two-dimensional Gaussian mixture model. The Euclid-
exposure animals. (a) Timeline of the experimental procedures for    ean distance between (Xear(t), Year (t)) points was com-
the two-week postexposure group. Eight animals were grouped
                                                                     puted over the trial duration. Startle amplitudes were
into sham-exposed controls (n = 3) and noise-exposed animals
(n = 5). Animals were exposed to a 7 kHz-centered noise band at      computed by fitting the Euclidean distance to a Gaussian-
97 dB SPL for 2 hours unilaterally (left). ABR measurements were     windowed sine-wave cycle and computed as the resultant
performed before, immediately after, and 2 weeks after noise         amplitude parameter.
exposure. Two weeks after noise exposure, animals were sacrificed,
and brain tissue was collected. (b) Schematic diagram of                      mean startle amplitude for gapðprepulseÞ trials
hippocampal circuit. Arrowheads in dashed line show information       SR =                                                     ,
                                                                             mean startle amplitude for nogapðprepulseÞ trials
flow in the hippocampal trisynaptic circuit. Black rectangles point
out where images in the dentate gyrus (DG) and areas CA3 and                                          xpost − μpre
                                                                                    Tinnitus index =               :
CA1 were taken for immunohistochemistry. EC: entorhinal cortex.                                           σpre
                                                                                                                                   ð1Þ
were collected within twelve weeks of the first noise exposure.
The noise-exposed animals were further divided into                      A normalized startle ratio (SR) was defined as the ratio of
exposed-no-tinnitus (ENT, n = 6) group and exposed-                  the mean startle amplitude for the gap (or prepulse noise) tri-
tinnitus (ET, n = 7) group according to the GPIAS results.           als and those for the no-gap trials. Tinnitus index, as shown
ABRs were measured before and immediately after each                 by the equation above, was used to quantify the difference
noise exposure and by the end of GPIAS tests. Animals were           between postexposure and preexposure. xpost is the mean of
sacrificed by the end of GPIAS tests. Immunohistochemical
                                                                     postexposure SR value. μpre and σpre are the mean and stan-
staining was performed with brain sections from both exper-
iments to evaluate the changes of glutamatergic and                  dard deviation (SD) of preexposure SR value, which was the
GABAergic neurotransmission in hippocampus and their                 behavioral baseline. By twelve weeks after the initial noise
correlation with tinnitus.                                           exposure, GPIAS data collection was completed and SR
                                                                     values for each animal were calculated. If an animal showed
                                                                     significantly greater normalized gap-startle response postex-
2.3. Noise Exposure and ABR Measurement. Noise exposure              posure compared to preexposure, and not significantly
and ABR were conducted in a double-wall soundproof booth             increased prepulse noise startle responses, then an animal
as previously described [11, 44]. Guinea pigs were anesthe-          was considered to have tinnitus at that frequency band.
tized with ketamine/xylazine (40 mg/kg ketamine; 10 mg/kg                In a separate testing session, an equivalent number of
xylazine), and were then unilaterally exposed to a 7 kHz cen-        noise-prepulses (75 dB; 50 ms; 5 ms rise-fall times), with fre-
tered noise band at 97 dB SPL for 2 hours via a closed speaker       quencies used in gap-prepulse testing, were also presented
system inserted in the left ear canal (Figure 1(a)). Auditory        prior to the startle pulse as an assessment of hearing function.
brainstem responses(ABRs) were recorded in response to               Postnoise exposure, no animals demonstrated significant
tone bursts (0.5 ms cosine squared gating, 5 ms duration) at         increases in noise prepulse inhibition at any testing fre-
8, 12, 16, and 20 kHz, before and after each noise exposure          quency, compared to prenoise exposure.
to assess shifts in hearing thresholds and wave I amplitude-             Because threshold shifts or deficits in suprathreshold
intensity functions as previously described [45]. ABRs were          hearing can affect GPIAS outcome [47], to ensure the deficits
also assessed two weeks after the noise exposure to determine        in gap detection resulted from tinnitus instead of hearing
hearing threshold recovery.                                          loss, we used a titrated noise exposure that only causes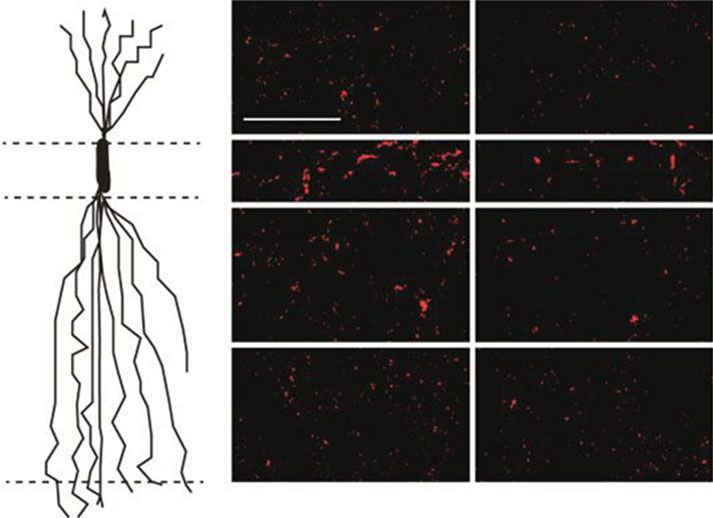
4                                                                                                                                                                                 Neural Plasticity

                                                      Noise exposure (2h)
                                                     97 dB

                                                                                                                 Threshold shift (dB SPL)
                                                                                                                                             60
                              GPIAS                                         GPIAS                                                            40
                              baseline
                                                        0
                                                                  7 kHz    post‑exp        ET (n = 6)
                     n = 19                                                                                                                  20
                                         4w                  4w           4w     4w        ENT (n = 7)
                                                                                                                                              0

                                                                                                                                            −20
                                                       Sham exposure                       Control (n = 6)                                             8      12     16      20
                                                                                                                                                           Frequency (kHz)
                                                                                                                                                  Ctr ENT ET
                                                                                                                                                                    Immediately
                                                                                                                                                                    12w
                                                                     (a)                                                                                     (b)
                                                     1.5
                                                             Baseline
                                                       1                                                                                      ⁎
                                  Wave I amp. (uV)

                                                                                                    0.65
                                                     0.5
                                                                                                     0.6
                                                       0                                            0.55

                                                                                             NSIR
                                                     1.5                                             0.5
                                                              12w
                                                       1                                            0.45
                                                     0.5                                             0.4
                                                       0                                            0.35
                                                             50            70         90                   Pre                              Post Pre         Post
                                                              Intensity (dB SPL)                                 Gap                                   PPI

                                                              Control                                        Control
                                                              ENT                                            ENT
                                                              ET                                             ET
                                                                    (c)                                                         (d)

Figure 2: Repeated noise exposure induces tinnitus in a subset of animals. (a) Timeline of the experimental procedures of the chronically
exposed group. Nineteen animals were grouped into sham controls (n = 6) and noise-exposed animals (n = 13). GPIAS was used for
tinnitus assessment, and the baseline of GPIAS was acquired for four weeks before noise exposure. Animals were noise-exposed to the
same noise band/sham for two hours twice in sessions conducted four weeks apart, and then assessed for tinnitus with GPIAS eight weeks
following the first noise exposure. ABR measurements were performed before and after each noise exposure and GPIAS. Noise-exposed
animals were divided into two further groups according to GPIAS assessment results: noise exposed animals that exhibit no behavioral
evidence signs of tinnitus (ENT, n = 7) and exposed animals that exhibit behavioral evidence of tinnitus (ET, n = 6). (b) Mean (±SEM)
ABR thresholds of animals with tinnitus (ET) and without tinnitus (ENT). ABR thresholds on the ipsilateral side were elevated
immediately following noise exposure in both groups, but recovered to baseline levels at 8, 12, 16, and 20 kHz 12 weeks after the first noise
exposure. (c) Mean (±SEM) ABR wave I amplitude-intensity functions for ENT and ET animals pre- (baseline) and postnoise exposure
(12w) were not significantly different, suggesting no underlying cochlear synaptopathy in both ENT and ET animals after the noise
exposure. (d) Mean (±SEM) normalized startle inhibition ratio (NSIR) was the ratio of the startle amplitudes for the gap (or prepulse
inhibition, PPI) trials and those for the no-gap trials. NSIR for gap trials was significantly higher postexposure (post) relative to baseline
levels (pre) for ET animals, but not for ENT or control animals. All animals exhibited stable responses to PPI trials both pre- and
postnoise exposure. ∗ p ≤ 0:05. This figure is reproduced with permission of authors in Zhang et al., 2019.

temporary threshold shift and no observable suprathreshold                                      formed at room temperature. Brain sections were rehydrated
deficits [11, 44]. ABR wave I amplitude-intensity functions                                      in PBS for 30 min to optimize morphological details. Subse-
were used to identify suprathreshold hearing deficits in ani-                                    quently, sections were incubated in blocking solution consist-
mals [48]. Prepulse startle amplitudes did not change signif-                                   ing of 1% normal goat serum (Jackson ImmunoResearch
icantly over the course of testing.                                                             Labs, Cat# 005-000-121, RRID: AB_2336990) and 0.1%
                                                                                                Triton-X 100 (MP Biomedicals, Cat# 807423) in PBS for
2.5. Tissue Preparation and Immunohistochemistry. The pro-                                      30 min, to limit nonspecific binding. Sections were then incu-
cedures of brain collection, tissue preparation, and immuno-                                    bated with primary antibody, rabbit anti-VGLUT-1 antibody
histochemistry were as described before [45]. Hippocampus                                       (Synaptic Systems, Cat# 135 303, RRID: AB_887875),
was sectioned into five series of coronal sections (30 μm) with                                  1 : 1000 diluted in blocking solution, or rabbit anti-VGLUT-
a cryostat (Leica, CM 3050S), mounted on glass slides, air                                      2 antibody (Synaptic Systems, Cat# 135 403, RRID: AB_
dried for 24 hours, and stored at -20°. Before staining, slides                                 887883), 1 : 500 diluted in blocking solution, or rabbit anti-
were allowed to thaw at room temperature for one hour after                                     VGAT antibody (Synaptic Systems, Cat# 131 003, RRID:
removal from -20°C. All subsequent procedures were per-                                         AB_887869), and 1 : 200 diluted in blocking solution for 24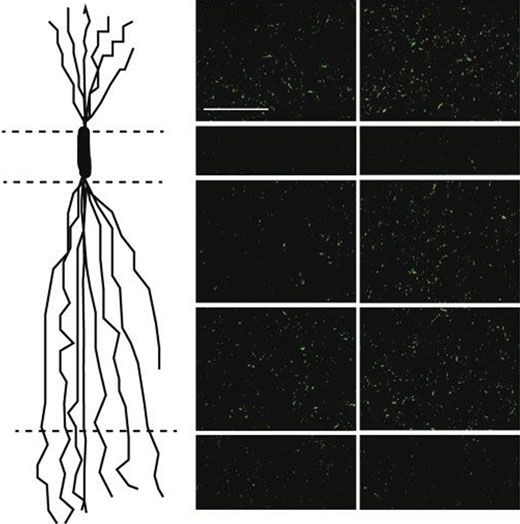
Neural Plasticity                                                                                                               5

hours. After thorough rinsing (10 min∗ 3 times) in PBS to         altered glutamatergic and GABAergic innervation in the hip-
remove unbound primary antibody, all sections were incu-          pocampus accompanies noise exposure, we used immuno-
bated with secondary antibody (Alexa Fluor 555-conjugated         histohemical detection of VGLUT-1, VGLUT-2, and VGAT
goat anti-rabbit, Molecular Probes Cat# A-21429, RRID:            to identify glutamatergic and GABAergic terminals in hippo-
AB_141761) diluted 1 : 500 in blocking solution for two           campal subregions. Immediately after noise exposure, ani-
hours. DAPI (Thermo Fisher Scientific, Cat# D1306, RRID:           mals exhibited elevated ABR thresholds on the ipsilateral
AB_2629482) 1 : 1000 diluted in blocking solution was             side at 8, 12, 16, and 20 kHz and recovered to baseline levels
applied together with the secondary antibody for counter-         at 8 and 20 kHz within one week [45]. Control animals and
stain. After the incubation, another thorough rinsing             contralateral sides of exposed animals did not exhibit any
(10 min∗ 3 times) was performed to remove excess secondary        changes in ABR thresholds using this noise exposure para-
antibody. Slides were mounted with Fluoromount-G (South-          digm in previous studies [11, 44]. ABR wave I amplitude-
ern Biotech, Cat# 0100-01). To ensure specificity of the sec-      intensity functions did not show any differences from base-
ondary antibody, negative controls were done in sections          line levels in exposed animals two weeks following the noise
only treated with secondary (and not primary) antibody.           exposure, suggesting that the exposed animals did not have
All matched groups were processed in parallel.                    any observable suprathreshold hearing impairments.

2.6. Image Processing and Quantification. Image processing
                                                                  3.2. VGLUT-1 Labeling in the Hippocampus Was Increased
was performed as previously described [45, 49]. The control
                                                                  Two Weeks after Noise Exposure. VGLUT-1 is the predomi-
and exposed animal images were acquired, processed, and
                                                                  nant isoform of VGLUT in the hippocampus. VGLUT-1-
analyzed using identical methods. The experimenters were
                                                                  positive puncta were detected throughout the hippocampus
blind with respect to treatment at the time of image quantifi-
                                                                  except for the pyramidal and granule cell layers. Although
cation. The ROIs were selected based on anatomical land-
                                                                  the noise exposure was unilateral, we found changes in
marks referring to the Allen Brain Atlas and relevant
                                                                  VGLUT-1 expression on both sides of the hippocampus
staining characteristics of DAPI, VGAT, VGLUT-1, and
                                                                  two-week postexposure (Figure 3). In the DG, the proximal
VGLUT-2 to ensure that ROI’s demarcate analogous areas
                                                                  molecular layer exhibited increases in VGLUT-1 puncta den-
of hippocampal subregions. Images for VGLUT-1 and
                                                                  sity after noise exposure, but only the changes on the contra-
VGAT were taken from Dentate Gyrus (DG), area CA3,
                                                                  lateral side reached statistical significance. The hilus showed
and area CA1 (Figure 1(b)). VGLUT-2 staining was only
                                                                  significant reductions in VGLUT-1 density on both sides.
quantified for the granule cell layer of the DG. For
                                                                  The distal and middle regions of the molecular layer did
VGLUT-1 and VGAT staining quantification, the molecular
                                                                  not show any significant changes compared to controls.
layer of the DG was subdivided into three equally sized
                                                                      In hippocampal area CA3, only stratum oriens showed
regions—proximal, middle, and distal regions. The proximal
                                                                  significantly increased VGLUT-1 density in exposed animals
part is adjacent to the granule cell layer. In CA1, the stratum
                                                                  on both sides (ipsilateral(I): p ≤ 0:01; contralateral(C): p ≤
radiatum was subdivided into two equally sized region-
                                                                  0:001). No significant change was seen in stratum lucidum
s—proximal and distal regions. Quantification of puncta
                                                                  and radiatum.
density was performed with Image J (version 1.50i, National
                                                                      In area CA1, most layers, including stratum oriens
Institutes of Health, USA, RRID: SCR_003070) with a cus-
                                                                  (s.o), proximal (s.rp), and distal (s.rd) regions of stratum
tom macro. First, RGB images were converted into single
                                                                  radiatum showed significant increases in VGLUT-1 density
channels, and only the red channel corresponding to the
                                                                  on both sides(s.o, I: p ≤ 0:001; C: p ≤ 0:001; s.rp, I: p ≤
Alexa Fluor 555 signal was used for subsequent processing.
                                                                  0:001; C: p ≤ 0:001; s.rd, I: p ≤ 0:01; C: p ≤ 0:01). Stratum
Then, the contrast was enhanced, and background was sub-
                                                                  lacunosum-moleculare (s.lm) exhibited a slight reduction
tracted with consistent parameters. Subsequently, an auto
                                                                  in VGLUT-1 expression, but the difference did not reach
threshold was applied followed by a watershed paradigm
                                                                  statistical significance. Most prominent changes were
which separated overlapping puncta. Puncta density was
                                                                  observed on both sides of areas CA3 and CA1 despite
yielded by dividing puncta counts by respective image area.
                                                                  the unilateral nature of the noise exposure. Together, these
All the above steps were run automatically in Image J with
                                                                  results demonstrate layer-specific changes in glutamatergic
a set macro, and all parameters for a certain staining were
                                                                  inputs to the hippocampus two weeks following noise
consistent.
                                                                  exposure.
2.7. Statistics. Statistical analysis was done with MATLAB
(The MathWorks, RRID: SCR_001622). One-sample student             3.3. VGLUT-2 Labeling in the Hippocampus Was Decreased
test, two-sample student test, and two-way ANOVA followed         Two Weeks after Noise Exposure. VGLUT-2-positive puncta
by Tukey-Kramer post hoc correction for multiple compari-         mainly localize to the granule cell layer of the dentate gyrus.
sons were used (p ≤ 0:05).                                        Compared to controls, exposed animals exhibited signifi-
                                                                  cantly lower levels of VGLUT-2 density on both ipsilateral
3. Results                                                        and contralateral sides in the granule cell layer (I: p ≤ 0:001;
                                                                  C: p ≤ 0:001) (Figure 4). Again, while the noise exposure
3.1. Hippocampal VGLUT and VGAT Density Were Altered              was unilateral, robust changes in VGLUT-2 density were
Two Weeks following Noise Exposure. To determine whether          observed in hippocampi on both sides of the brain.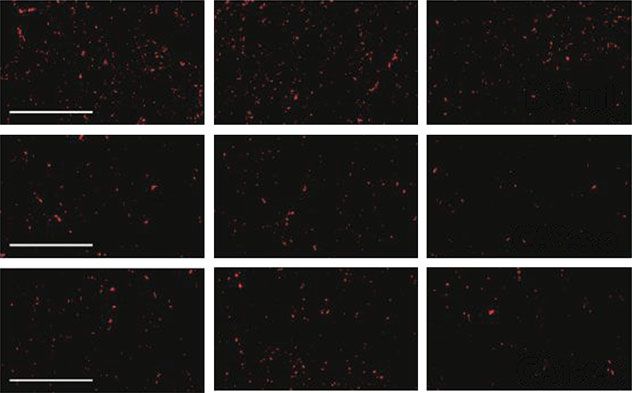
6 Neural Plasticity
Control Exposed 2
Normalized VGLUT‑1
density (% control)
mld
VGLUT‑1
1.5 #
##
mlm 1
mlp 0.5
g 0
mld mlm mlp h
DG
h
Ipsilateral
Contralateral
(a)
Control Exposed 2
Normalized VGLUT‑1
##
density (% control)
VGLUT‑1
s.o 1.5
s.p 1
0.5
s.l
0
s.o s.l s.r
s.r
CA3
Ipsilateral
Contralateral
(b)
Control Exposed 2
## ##
Normalized VGLUT‑1
VGLUT‑1
density (% control)
s.o 1.5 ##
s.p 1
s.rp 0.5
0
s.o s.rp s.rd s.lm
s.rd
CA1
Ipsilateral
s.lm Contralateral
(c)
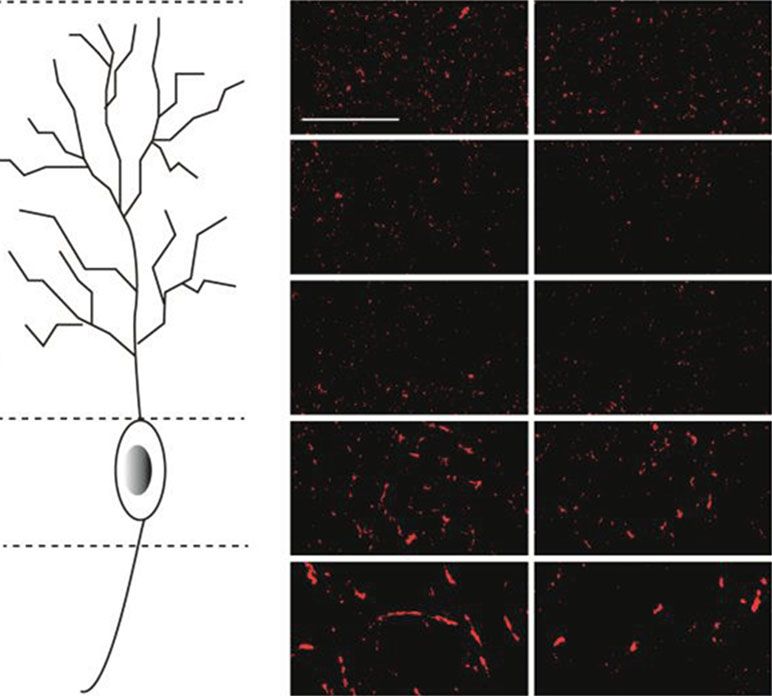
Figure 3: VGLUT-1 puncta density primarily increases in dentate gyrus (DG), area CA3, and area CA1 two weeks after noise exposure.
Schematic granule cell in DG (a), pyramidal neuron in CA3 (b), and pyramidal neuron in CA1 (c), depicting organization of inputs
corresponding to the layers on the right, which are images of VGLUT-1 labeling in CA1 at 400x magnification. Scale bar, 50 μm. Mean (±
SEM) normalized VGLUT-1 puncta density (per 104 μm2; normalized to respective control) in the dentate gyrus (DG) (a), area CA3 (b),
and area CA1 (c) two weeks following noise exposure are shown on respective right panels. #When compared to the controls (dashed
line), p ≤ 0:05. mld: distal region of molecular layer; mlm: middle region of molecular layer; mlp: proximal region of molecular layer; h:
hilus; s.o: stratum oriens; s.l: stratum lucidum; s.r: stratum radiatum; s.rp: proximal region of stratum radiatum; s.rd: distal region of
stratum radiatum; s.lm: stratum lacunosum-moleculare.
3.4. VGAT Labeling in the Hippocampus Was Decreased Two Noise-exposed animals demonstrated significantly lower
Weeks after Noise Exposure. VGAT-positive puncta were VGAT counts in all four layers of area CA3 compared to con-
detected throughout the hippocampus (Table 1). Except for trols. Stratum pyramidale (s.p) exhibited the most striking
the distal region of the molecular layer, all other DG layers decrease. The other three layers—stratum oriens, lucidum
examined, including the middle region of molecular layer (s.l), and radiatum (s.r)—exhibited moderate, yet significant,
(mlm), granule cell layer (g), and hilus (h), exhibited signifi- reductions in VGAT density.
cant bilateral reductions in VGAT density (Figure 5). The As observed in CA3, the most striking reduction of
proximal region of the molecular layer was significantly VGAT density in area CA1 occurred in stratum pyramidale.
decreased only on the ipsilateral side. Stratum oriens and proximal and distal regions of stratum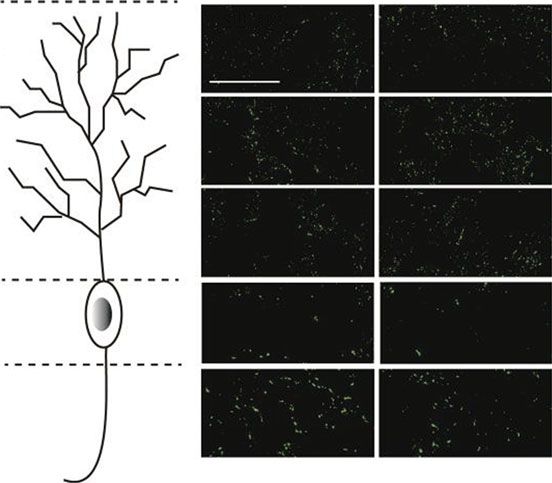
Neural Plasticity                                                                                                                                  7

                 Control                                  Exposed                     inputs two weeks following noise exposure, we next investi-
                                                                                      gated the persistence of these changes and their association
                                                                                      with tinnitus. We thus induced tinnitus in a subset of animals
                                                                      DG‑g
                                                                                      by exposing them to the same noise twice but four weeks
                                                 (a)                                  apart (Figure 2). Tinnitus was assessed with GPIAS frame-
                                           1.2                                        work as previously described [11]. As the utilized noise expo-
                    Normalized VGLUT‑2
                     density (% control)

                                            1                                         sure paradigm induces tinnitus in roughly half of
                                                       # #                            experimental animals in previous studies [11], chronically
                                           0.8
                                                                                      exposed animals were divided into three groups: sham
                                           0.6
                                                                                      exposed controls (n = 6), noise exposed animals that exhibit
                                           0.4
                                                                                      no behavioral evidence of tinnitus (ENT, n = 7), and noise
                                           0.2
                                                                                      exposed animals that exhibited behavioral evidence of tinni-
                                            0
                                                       DG‑g
                                                                                      tus (ET, n = 6).
                                                                                           While GPIAS is a widely used behavioral index of tinni-
                                                 Ipsilateral                          tus, there is currently debate over what aspect of tinnitus
                                                 Contralateral                        alters auditory processing during the gap [50]. To ensure
                                                 (b)                                  behavioral evidence of tinnitus via GPIAS was not secondary
                                                                                      to hearing deficits induced by the noise exposure paradigm,
Figure 4: VGLUT-2 puncta density decreases in the granule cell                        several measures have been taken. Following the dual noise
layer of the dentate gyrus two weeks following noise exposure. (a)
                                                                                      exposure, ipsilateral ABR thresholds of noise-exposed ani-
Representative images of VGLUT-2 labeling in the granule cell
layer of the DG (DG-g) at 400x magnification. Scale bar, 50 μm.                        mals (n = 13) recovered to baseline levels within 2 weeks
(b) Mean (±SEM) VGLUT-2 puncta density (per 104 μm2;                                  and remained recovered at 12-week postexposure [45]. Fur-
normalized to respective control) in the granule cell layer. #When                    thermore, ET and ENT animals exhibited similar ABR wave
compared to the controls (dashed line), p ≤ 0:05.                                     I amplitude-intensity functions pre- and postnoise exposure
                                                                                      [45], suggesting that neither ENT nor ET animals had any
Table 1: VGAT labeling in the hippocampus was decreased                               supratheshold hearing deficits. The prepulse inhibition
significantly in most areas two weeks after noise exposure with t                      (PPI) ratios of the noise-exposed animals remained constant
-test.                                                                                [45], indicating that the animals’ attenuated responses to gap
                                                                                      trials were not because of hearing impairment. The startle
                                                                    p value           amplitude for no-gap/no-prepulse condition, i.e., the baseline
Area                     Layer
                                                         Ipsilateral Contralateral
                                                                                      startle reflexivity, remained unaltered postexposure in con-
         Molecular layer—distal                               >0.05           >0.05   trol, ENT, and ET animals. Given that ABR thresholds recov-
        Molecular layer—middle                               ≤0.01           ≤0.05    ered to baseline levels 12-week postexposure and that ABR
DG      Molecular layer—proximal                             ≤0.01            >0.05   wave I amplitude-intensity functions were the same in ENT
            Granule cell layer                               ≤0.001          ≤0.001   and ET animals, the differences observed in gap-startle ratios
                  Hilus                                      ≤0.001          ≤0.001   do not arise due to hearing differences.
                 Oriens                                      ≤0.001          ≤0.001
                                                                                      3.6. VGLUT-1 and VGLUT-2 Labeling Recovered towards
               Pyramidale                                    ≤0.001          ≤0.001   Normal Regardless of Tinnitus Expression. Two-way ANOVA
CA3
                Lucidum                                      ≤0.001          ≤0.001   with two factors “tinnitus status” and “side” reveals nearly
                Radiatum                                     ≤0.001          ≤0.01    identical noise-induced changes in VGLUT-1 and VGLUT-
                 Oriens                                      ≤0.001          ≤0.001   2 expression in most layers on both sides of the hippocampus
               Pyramidale                                    ≤0.001          ≤0.001   for the noise exposure group. Although the “side” effect in
CA1       Radiatum—proximal                                  ≤0.001          ≤0.001   the proximal region of stratum radiatum is significant, the
                                                                                      interaction of “side” and “tinnitus status” is not significant.
            Radiatum—distal                                  ≤0.01           ≤0.01
                                                                                      VGLUT-1 puncta density comparison with two-way
        Lacunosum—moleculare                                 ≤0.05            >0.05   ANOVA is shown in Table 2.
                                                                                          In the DG (Figure 6), animals with tinnitus (ET) and ani-
radiatum all showed significant reductions of VGAT labeling                            mals resistant to tinnitus (ENT) exhibited similar levels of
on both sides. Stratum lacunosum-moleculare decreased on                              VGLUT-1 density in all four layers examined: the distal, mid-
both sides, but only reached statistical significance for the                          dle, proximal regions of molecular layer, and hilus. No signif-
ipsilateral side. There were no significant differences in                              icant differences between ipsilateral and contralateral sides
VGAT density between ipsilateral and contralateral sides in                           were revealed by two-way ANOVA in these four layers. In
exposed animals for all the subregions examined. These                                the proximal region of molecular layer, ENT animals recov-
results reveal pronounced changes in GABAergic innerva-                               ered towards baseline levels compared to those examined
tion of the hippocampus induced by noise trauma.                                      two-week postexposure on both sides (I: p ≤ 0:01; C: p ≤
                                                                                      0:001), but ET animals only showed significant recovery on
3.5. Chronic Effects of Noise Exposure and Tinnitus. Given the                         contralateral side (C: p ≤ 0:01). Whereas ENT animals were
changes in hippocampal glutamatergic and GABAergic                                    significantly lower than the paired controls (I: p ≤ 0:01; C: p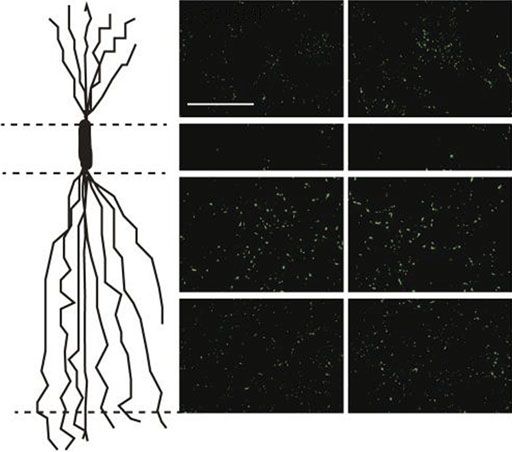
8 Neural Plasticity
Control Exposed
mld VGAT
DG
1.2
# #
density (% control)
Normalized VGAT
mlm 1
#
0.8 ## ##
0.6
mlp 0.4
0.2
0
g mld mlm mlp g h
Ipsilateral
h Contralateral
(a)
Control Exposed
CA3
VGAT 1.2
s.o
density (% control)
Normalized VGAT
1 ##
0.8 ## ##
s.p 0.6
##
0.4
s.l 0.2
0
s.o s.p s.l s.r
s.r Ipsilateral
Contralateral
(b)
Control Exposed
VGAT
s.o
CA1
s.p 1.2
## #
density (% control)
Normalized VGAT
1
##
0.8
##
0.6 ##
s.rp
0.4
0.2
s.rd 0
s.o s.p s.rp s.rd s.lm
Ipsilateral
s.lm Contralateral
(c)
Figure 5: VGAT puncta density decreases in dentate gyrus (DG), area CA3, and area CA1 two weeks following noise exposure. Schematic
granule cell in DG (a), pyramidal neuron in CA3 (b), and pyramidal neuron in CA1 (c), depicting organization of inputs corresponding to
the layers on the right, which are images of VGAT labeling in CA1 at 400x magnification. Scale bar, 50 μm. Mean (±SEM) VGAT puncta
density (per 104 μm2; normalized to respective control) in the dentate gyrus (DG) (a), area CA3 (b), and area CA1 (c) two weeks
following noise exposure is shown on respective right panels. #When compared to the controls (dashed line), p ≤ 0:05. mld: distal region of
molecular layer; mlm: middle region of molecular layer; mlp: proximal region of molecular layer; g: granule cell layer; h: hilus; s.o: stratum
oriens; s.p: stratum pyramidale; s.l: stratum lucidum; s.r: stratum radiatum; s.rp: proximal region of stratum radiatum; s.rd: distal region of
stratum radiatum; s.lm: stratum lacunosum-moleculare.Neural Plasticity 9
Table 2: Animals with tinnitus and animals without tinnitus demonstrated similar VGLUT-1 labeling in all layers and no difference between
both sides, analyzed by two-way ANOVA.
Area Layers p value for ‘tinnitus status’ effect p value for ‘side’ effect Interaction of tinnitus status∗ side
Molecular layer—distal >0.05 >0.05 >0.05
Molecular layer—middle >0.05 >0.05 >0.05
DG
Molecular layer—proximal >0.05 >0.05 >0.05
Hilus >0.05 >0.05 >0.05
Oriens >0.05 >0.05 >0.05
CA3 Lucidum >0.05 >0.05 >0.05
Radiatum >0.05 >0.05 >0.05
Oriens >0.05 >0.05 >0.05
Radiatum—proximal >0.05 ≤0.05 >0.05
CA1
Radiatum—distal >0.05 >0.05 >0.05
Lacunosum—moleculare >0.05 >0.05 >0.05
≤ 0:01), ET animals exhibited similar levels of VGLUT-1 The proximal regions of stratum radiatum in both ENT
labeling to the baseline. Unlike other DG layers, VGLUT-1 and ET animals significantly recovered towards baseline
density in the hilus was decreased relative to paired controls levels during the extended period. The distal regions of stra-
in both twelve-week noise exposure groups, although only tum radiatum on both sides of ENT and the contralateral side
ET animals showed significant reductions on both sides com- of ET animals significantly recovered towards baseline levels
pared to the animals examined two-week postexposure (ET: twelve-week postexposure. Twelve weeks following the initial
I, p ≤ 0:05; C, p ≤ 0:05). noise exposure, VGLUT-1 labeling in stratum lacunosum-
Like the dentate gyrus, area CA3 showed similar recovery moleculare remained lower than the baseline levels on the
of VGLUT-1 density regardless of tinnitus status. None of the contralateral side of ENT and both sides of ET animals.
three VGLUT-1-rich layers—stratum oriens, lucidum, and VGLUT-2 in the granule cell layer of the dentate gyrus
radiatum—exhibited significant differences between ENT remained lower than the paired controls in chronically
and ET animals. Similarly, we did not see any differences exposed animals regardless of tinnitus expression (ENT: p
between ipsilateral and contralateral sides in these layers. In ≤ 0:001; ET: p ≤ 0:001), though both ET and ENT animals
stratum oriens, ENT animals showed significantly lower exhibited significantly recovery of VGLUT-2 density relative
VGLUT-1 density than the paired controls on both sides (I, to the two-week time-point (p ≤ 0:05) (Figure 7). Together,
p ≤ 0:001; C, p ≤ 0:01), whereas ET animals only showed sig- these results suggest that altered excitatory synapse density
nificant decreases on the ipsilateral side compared to controls evident two weeks following noise exposure recovers over
(I, p ≤ 0:05). In stratum lucidum, chronically exposed ani- time, and this recovery is similar in tinnitus-vulnerable and
mals did not show any changes in VGLUT-1 labeling com- tinnitus-resistant animals.
pared the two-week time-point. But ET animals exhibited a
slight, but significant, decrease in VGLUT-1 density relative
to sham controls on the contralateral side (p ≤ 0:05). Though 3.7. VGAT Labeling Showed Differential Recovery Depending
VGLUT-1 expression in stratum radiatum was not affected on Tinnitus Status. Two-way ANOVA (see Table 3) reveals
two-week postexposure, it was decreased significantly during that VGAT expression changed equally on both sides of the
the extended period in ENT on both sides but not in ET ani- brain. We thus assess expression in pooled ipsilateral and
mals (ENT, I: p ≤ 0:05; C: p ≤ 0:01). contralateral hippocampal subregions in subsequent analy-
Similar to what we observed in DG and CA3, changes in ses. Overall, the robust changes in hippocampal VGAT label-
VGLUT-1 density observed 2 weeks following noise expo- ing observed two weeks after noise exposure largely
sure in CA1 recovered to near control levels, an effect that recovered to near control levels after a 12-week recovery
was evident independent of tinnitus phenotype. All four period. However, animals exhibiting behavioral evidence of
layers in CA1—stratum oriens, proximal and distal radiatum, tinnitus (ET) showed less recovery relative to animals that
and stratum lacunosum-moleculare—showed nearly identi- were resistant to tinnitus (ENT).
cal changes of VGLUT-1 labeling between ENT and ET In the dentate gyrus (Figure 8, Table 4), ENT animals dis-
groups. The proximal region of stratum radiatum exhibited played significantly higher levels of VGAT density than ET
changes of VGLUT-1 density differentially between ipsilat- animals in all layers—the distal, middle, and proximal
eral and contralateral sides (p ≤ 0:05), whereas other regions of molecular layer, granule cell layer, and hilus. ET
layers—stratum oriens, distal region of stratum radiatum, animals maintained lower levels of VGAT labeling than the
and stratum lacunosum-moleculare—did not show any dif- paired controls in all layers—the distal, middle, and proximal
ferences between sides. In stratum oriens, VGLUT-1 density regions of molecular layer and granule cell layer—but the
recovered to control levels by twelve weeks regardless of ENT animals recovered completely to baseline levels in the
tinnitus status. distal, middle, and proximal regions of molecular layer and10 Neural Plasticity
Control ENT ET DG ⁎
⁎
1.5 # ⁎
DG‑mld
Normalized VGLUT‑1
⁎
density (% control)
##
1 ## ## #
#
CA3‑s.o
0.5
CA1‑s.o
0
mld mlm mlp h
2w ENT ET
Ipsi
Contra
(a) (b)
⁎ ⁎
⁎
2 ⁎ 2
⁎ # #
Normalized VGLUT‑1
⁎
Normalized VGLUT‑1
# #
density (% control)
density (% control)
##
1.5 ⁎ 1.5 ##
⁎
# # # #
1 1 # #
## ## # #
0.5 0.5
0 0
s.o s.l s.r s.o s.rp s.rd s.lm
CA3 CA1
2w ENT ET 2w ENT ET
Ipsi Ipsi
Contra Contra
(c) (d)
Figure 6: Tinnitus and no-tinnitus animals exhibit recovery of VGLUT-1 labeling by 12-week postnoise exposure in the dentate gyrus (DG),
area CA3 and CA1. (a) Representative images of VGLUT-1 labeling from distal molecular layer of the DG (DG-mld), stratum oriens of CA3
(CA3-s.o), and stratum oriens of CA1 (CA1-s.o) at 400x magnification; scale bar = 50 μm. (b–d) Mean (±SEM) change of VGLUT-1 density
(normalized to respective control) on both ipsilateral (left) and contralateral (right) sides in the DG (b), CA3 (c), and CA1 (d) in two-week
and 12-week postnoise-exposure animals. Both sides are pooled for comparison between groups (2w, ENT, and ET). Compared to two-week
postexposure animals (2w), 12-week postexposure animals (ENT and ET) largely recovered to or near to baseline levels. Animal exhibiting
tinnitus (ET) showed similar pattern of recovery in VGLUT-1 expression to animals resistant to tinnitus in all the three subregions. #For
comparison to the paired controls (dashed line), p ≤ 0:05. ∗ For comparison between 2w, ENT, and ET groups, p ≤ 0:05. mld: distal region
of molecular layer; mlm: middle region of molecular layer; mlp: proximal region of molecular layer; h: hilus; s.o: stratum oriens; s.l: stratum
lucidum; s.r: stratum radiatum; s.rp: proximal region of stratum radiatum; s.rd: distal region of stratum radiatum; s.lm: stratum
lacunosum-moleculare.
exhibited significantly higher levels of VGAT density than animals completely recovered above the baseline in all layers.
the paired controls in the granule cell layer and hilus. VGAT expression ET animals remained diminished in in the
Like the dentate gyrus, ENT animals displayed greater proximal and distal regions of stratum radiatum. Expression
recovery of VGAT density than ET animals in all layers of in both ENT and ET animals recovered completely to the
area CA3: stratum oriens, pyramidale, lucidum, and radia- baseline in stratum pyramidale.
tum. ET animals exhibited significantly lower levels of VGAT Taken together, our results demonstrate that VGAT
density than paired controls in all these. ENT animals recov- expression in several hippocampal regions recovers differen-
ered to levels similar to the baseline in stratum oriens, pyra- tially in animals that are resistant to tinnitus and animals that
midale, and lucidum and to levels higher than the baseline are vulnerable to noise-induced tinnitus. These results thus
in stratum radiatum. suggest a relationship between incomplete recovery of noise-
Similar patterns of recovery were seen in area CA1, in induced reduction in GABAergic innervation in the hippo-
which VGAT expression in ET animals remained diminished campus and increased susceptibility to developing tinnitus.
whereas that in ENT animals recovered completely. Except
for stratum pyramidale, the other four layers—stratum 4. Discussion
oriens, proximal and distal region of radiatum, and stratum
lacunosum-moleculare—demonstrated higher levels of In this study, we investigated the effects of noise exposure on
VGAT labeling in ENT animals than in ET animals. ENT hippocampal VGAT and VGLUT expression andNeural Plasticity 11
Control ered by the terminals from the entorhinal cortex. VGLUT-2
terminals in the granule cell layer of the dentate gyrus arise
0.2 from the mossy cells in the hilus [58] or supramammillary
density
ENT nucleus [54, 58]. The expression of VGLUT-2 during neural
0
(% control)
⁎
development is pivotal to the proper development of mature
∆VGLUT‑1
pyramidal neuronal architecture and plasticity [32].
−0.2
ET Two weeks after noise exposure, VGLUT-1 expression
−0.4 was primarily increased in hippocampal subregions, whereas
VGLUT-2 expression in the granule cell layer was decreased.
2w ENT ET These acute changes in glutamatergic transmission after
(a) (b) moderate noise exposure are consistent with previous studies
in which NMDAR 2B subunit and glutamic acid levels in the
Figure 7: Tinnitus animals exhibit similar recovery of VGLUT-2 hippocampus were shown to be regulated by auditory stimu-
labeling relative to no-tinnitus animals in the granule cell layer of lation [43, 59, 60]. Increased VGLUT-1 density two weeks
the dentate gyrus. (a) Representative images of VGLUT-2 labeling after noise exposure could be due to either neural sprouting
from granule cell layer of the dentate gyrus at 400x magnification.
(more terminals) or terminal enlargement (each terminal
Scale bar = 50 μm. (b) Mean (±SEM) change of VGLUT-2 density
(normalized to respective control) in the DG in two-week and 12-
contains more vesicles) and likely reflects enhanced efficacy
week postnoise-exposure animals. Compared to 2-week of glutamate transmission [30]. VGLUT-2 appears to be
postexposure animals (2w), 12-week postexposure animals (ENT expressed at synapses with a high release probability and
and ET) significantly recovered towards baseline levels (only ENT VGLUT-1 at synapses with lower probabilities of release
significant). Animal exhibiting tinnitus (ET) showed similar [57, 61]. The downregulation of VGLUT-2 puncta density
pattern of recovery in VGLUT-2 expression to animals resistant to is possibly a homeostatic adaptation for more widespread
tinnitus in the granule cell layer of dentate gyrus. ∗ p ≤ 0:05. changes in VGLUT-1, to compensate for overall glutamater-
gic release probability [62] but could also reflect different
determined the relevance of these effects to tinnitus. Two intrinsic propensities of noise-induced changes at VGLUT-
weeks following noise exposure, VGLUT-1 density primarily 1 and -2 synapses. Future studies are needed to probe func-
increased in the three hippocampal subregions (dentate tional changes in glutamatergic transmission in the hippo-
gyrus, CA3, and CA1), but especially in CA1. VGLUT-2, campus that accompany noise exposure.
which mainly localizes in the granule cell layer of the dentate As an acute response to noise exposure, VGAT-positive
gyrus, decreased by over 30%. VGAT, which is crucial for puncta density changed in the opposite direction of
GABAergic transmission, decreased robustly in all three hip- VGLUT-1 in the hippocampus. A dramatic decrease in
pocampal subregions. Twelve weeks following the initial VGAT expression was detected two weeks following the
noise exposure, animals exhibiting tinnitus and animals moderate noise exposure, consistent with previous studies
exposed to noise but without tinnitus expression showed [43]. GABAergic inputs to hippocampus regulate the overall
equivalent recovery in VGLUT-1 and VGLUT-2 expression, level of excitability in the network and contribute to hippo-
but divergent recovery in VGAT expression, in which only campal oscillations [35]. Dysfunction of GABAergic inhibi-
animals without tinnitus recovered substantially towards tion is related to several neurological diseases including
control levels. These findings thus demonstrate a relationship epilepsy [36–38], schizophrenia [39, 40], and autism [41,
between changes in GABAergic innervation of the hippo- 42]. The downregulation of VGAT expression levels and
campus and the development of tinnitus. upregulation of VGLUT-1 levels in the hippocampus two-
week postexposure reflects altered excitation-inhibition bal-
4.1. Altered Excitation-Inhibition Balance Two Weeks after ance, which is a feature underlying the circuit dysfunction
Noise Exposure. VGLUTs are essential for transporting gluta- observed in various neurodevelopmental and neuropsychiat-
mate into synaptic vesicles. Three VGLUT isoforms have ric disorders [63, 64].
been identified in mammalian brains, among which Another interesting finding in this study is that no differ-
VGLUT-1 and VGLUT-2 are the most abundant. VGLUT- ences were seen between ipsilateral and contralateral sides of
1 and VGLUT-2 exhibit complementary distributions in hippocampal VGLUT-2 and VGAT labeling in all layers
the brain, both spatially and temporally. VGLUT-1 increases despite the unilateral nature of noise exposure. This bilateral
gradually after birth and eventually predominates over the feature contrasts to the findings in cochlear nucleus, where
other isoforms in telencephalic regions, including the hippo- noise-exposed animals show tinnitus-associated interaural
campus [51]. VGLUT-2 is expressed at high levels shortly asymmetry of VGLUT-1 and VGLUT-2 puncta density
after birth, declines with age in multiple regions [51], and is [62]. The cochlear nucleus is the first central stage in auditory
localized primarily in the thalamus and lower brainstem sensory pathway, receiving signals from the ipsilateral
regions of adult animals [31, 52]. Whereas VGLUT-1 is cochlea via auditory nerve fibers. Unlike the cochlear
mainly found at synapses known to show low probability of nucleus, the hippocampus is far removed from the site of
transmitter release, and VGLUT-2 is predominantly found noise-damage and receives complex inputs from multiple
at synapses with higher release probability in sensory path- regions, including the entorhinal cortex [26, 65], the medial
ways [53–55]. Hippocampal VGLUT-1 is synthesized by septum/diagonal band of Broca (MSDB). Massive informa-
the pyramidal neurons and granule cells [52, 56, 57] or deliv- tion exchange between both sides of the brain, which occurs12 Neural Plasticity
Table 3: Animals with tinnitus and animals without tinnitus exhibited different VGAT labeling in most layers but no difference between both
sides, analyzed by two-way ANOVA.
Area Layers p value for ‘tinnitus status’ effect p value for ‘side’ effect Interaction of tinnitus status∗ side
Molecular layer—distal ≤0.05 >0.05 >0.05
Molecular layer—middle ≤0.05 >0.05 >0.05
DG Molecular layer—proximal ≤0.01 >0.05 >0.05
Granule cell layer ≤0.001 >0.05 >0.05
Hilus ≤0.001 >0.05 >0.05
Oriens ≤0.001 >0.05 >0.05
Pyramidale ≤0.01 >0.05 >0.05
CA3
Lucidum ≤0.001 >0.05 >0.05
Radiatum ≤0.001 >0.05 >0.05
Oriens ≤0.001 >0.05 >0.05
Pyramidale >0.05 >0.05 >0.05
CA1 Radiatum—proximal ≤0.001 >0.05 >0.05
Radiatum—distal ≤0.001 >0.05 >0.05
Lacunosum—moleculare ≤0.05 >0.05 >0.05
Control ENT ET
DG ⁎ ⁎
DG‑mld ⁎ #
1.2 #
⁎ ⁎
density (% control)
Normalized VGAT
1 # #
#
# # #
0.8 #
#
CA3‑s.o 0.6
0.4
0.2
CA1‑s.o
0
mld mlm mlp g h
2w
ENT
ET
(a) (b)
⁎ ⁎ ⁎ ⁎
1.5 1.5 ⁎
density (% control)
#
density (% control)
Normalized VGAT
⁎
Normalized VGAT
# # #
⁎ ⁎ #
# # # #
1 # # 1 # #
# #
# #
#
#
0.5 # 0.5
0 0
s.o s.p s.l s.r s.o s.p s.rp s.rd s.lm
CA3 CA1
2w 2w
ENT ENT
ET ET
(c) (d)
Figure 8: Tinnitus animals exhibit diminished recovery of VGAT labeling relative to no-tinnitus animals in the dentate gyrus (DG) and areas
CA3 and CA1. (a) Representative images of VGAT labeling from distal molecular layer of the DG (DG-mld), stratum oriens of CA3 (CA3-
s.o), and stratum oriens of CA1 (CA1-s.o) at 400x magnification; scale bar = 50 μm. (b–d) Mean (±SEM) change of VGAT density
(normalized to respective control) in the DG (b), CA3 (c), and CA1 (d) in two-week and 12-week postnoise-exposure animals. Compared
to 2-week postexposure animals (2w), 12-week postexposure animals (ENT and ET) largely recovered to or near to baseline levels.
Tinnitus animals (ET) exhibit better recovery of VGAT labeling relative to no-tinnitus animals (ENT) in the dentate gyrus(DG) and areas
CA3 and CA1. #For comparison to the paired controls (dashed line), p ≤ 0:05. ∗ For comparison between 2w, ENT, and ET groups, p ≤
0:05. mld: distal region of molecular layer; mlm: middle region of molecular layer; mlp: proximal region of molecular layer; g: granule cell
layer; h: hilus; s.o: stratum oriens; s.p: stratum pyramidale; s.l: stratum lucidum; s.r: stratum radiatum; s.rp: proximal region of stratum
radiatum; s.rd: distal region of stratum radiatum; s.lm: stratum lacunosum-moleculare.Neural Plasticity 13
Table 4: Animals with tinnitus and animals without tinnitus loss, we carefully chose our noise-exposure parameters to
exhibited different VGAT labeling in most layers, analyzed with induce only temporary threshold shifts. Consistent with this
two-way ANOVA followed by Tukey-Kramer post hoc correction goal, ABR wave I amplitude-intensity functions indicated no
for multiple comparisons. suprathreshold deficits for both the ET and ENT animals at
the time of tinnitus assessment with GPIAS. Twelve-week
p value
Area Layers ENT vs. ET vs. ENT vs. postexposure, noise-exposed animals exhibited recovery
ET controls controls towards control levels in VGLUT-1 and VGLUT-2 density,
regardless of tinnitus expression. This finding suggests that
Molecular layer—distal ≤0.05 ≤0.001 >0.05
while glutamatergic innervation of the hippocampus exhibits
Molecular layer—middle ≤0.05 ≤0.001 >0.05 pronounced changes following moderate noise exposure,
Molecular chronic adaptations in excitatory synaptic density proceed
DG ≤0.01 ≤0.001 >0.05
layer—proximal similarly in both tinnitus-vulnerable and tinnitus-resistant
Granule cell layer ≤0.001 ≤0.01 ≤0.01 animals. Acute noise-induced changes in VGAT-labeled
Hilus ≤0.001 >0.05 ≤0.001 inhibitory synapses also recovered over twelve weeks but
Oriens ≤0.001 ≤0.001 >0.05 did so differentially depending on tinnitus phenotype. VGAT
Pyramidale ≤0.01 ≤0.01 >0.05 labeling in animals exhibiting tinnitus remained lower but
CA3 recovered to levels even higher than the controls in animals
Lucidum ≤0.001 ≤0.001 >0.05
without tinnitus, suggesting a correlation between a sus-
Radiatum ≤0.001 ≤0.05 ≤ 0.001
tained reduction in GABAergic inhibition in the hippocam-
Oriens ≤0.001 ≤0.001 >0.05 pus and the presence of tinnitus.
Pyramidale >0.05 >0.05 >0.05 It is widely accepted that tinnitus is associated with
CA1 Radiatum—proximal ≤0.001 ≤0.001 ≤0.05 altered neural plasticity in the central nervous system
Radiatum—distal ≤0.001 ≤0.001 ≤0.001 [13, 44, 75, 76]. Rauschecker et al. [77] hypothesized that
Lacunosum—moleculare ≤0.05 ≤0.05 >0.05 if limbic structures fail to block hyperactive signals gener-
ated from auditory pathways, this noise-cancellation fail-
ure leads to chronic forms of tinnitus. In the present
before input to the hippocampus, might underlie the study, tinnitus was associated with diminished GABAergic
nearly identical changes in excitatory and inhibitory syn- inhibition after noise trauma, potentially resulting in
apse density observed in hippocampi on both sides of increased excitability and impaired noise-cancellation
the brain. function, consistent with Rauschecker’s hypothesis [22].
There are massive anatomical connections indirectly Another hypothesis is based on the fact that some tinni-
linking the hippocampus to sensory cortices including ento- tus patients can modulate their tinnitus via head, neck,
rhinal cortex (EC), through which auditory and other sen- and jaw contractions [78–80], which is called somatosen-
sory information enter the hippocampus [66, 67]. Auditory sory tinnitus. In compensation for reduced auditory
information from the cochlear nucleus is conveyed via the innervation after cochlear damage, somatosensory inputs
caudal pontine reticular nucleus, pontine central gray, and to cochlear nucleus are upregulated, which is thought to
medial septum, to entorhinal cortex [68]. Input to the audi- be essential for initiating tinnitus and manipulating
tory cortex is provided by a projection from hippocampal timing-dependent plasticity of cochlear nucleus fusiform
CA1 [69]. cells with auditory-somatosensory stimulation alleviates
Changes in hippocampal synaptic connectivity after tinnitus in both guinea pigs and humans [44]. The hip-
noise exposure might be related to increased release of pocampus might be involved in this process since it also
stress hormones [43, 70–72] and hence the comorbidity responds to somatosensory stimulation via entorhinal
of tinnitus with anxiety [5] and depression [7]. The cortex [81, 82].
parvalbumin-positive GABAergic interneurons in the hip-
pocampus represent an especially vulnerable population
of neurons in chronic stress, which might be of key 5. Conclusions
importance in the development of mood disorders [73].
The changes of VGAT and VGLUT-1 expression levels In conclusion, this study demonstrates altered glutamatergic
in the hippocampus two-week postexposure observed in and GABAergic innervation in the hippocampus in noise-
this study are similar to what has been reported in stress exposed animals. Our results demonstrate robust changes
animal models [74]. in excitatory and inhibitory synapse density in the hippo-
campus after noise exposure, suggesting involvement of hip-
4.2. Hippocampal GABAergic but Not Glutamatergic pocampal glutamatergic and GABAergic neurotransmission
Innervation Is Related to Tinnitus Susceptibility. To investi- in altered auditory information processing after noise dam-
gate whether the changes seen two-week postexposure were age. After chronic tinnitus induction, VGAT but not
relevant to tinnitus, another cohort of animals was exposed VGLUT-1/VGLUT-2 labeling showed tinnitus-specific pat-
to the same noise twice for tinnitus induction and followed terns of recovery, suggesting that rebounding inhibition in
for twelve weeks to allow tinnitus development. To make sure the hippocampus is potentially a protective factor against tin-
the GPIAS measurements reflect tinnitus rather than hearing nitus induction.You can also read