A SAMPLING STRATEGY FOR RECENT AND FOSSIL BRACHIOPODS: SELECTING THE OPTIMAL SHELL SEGMENT FOR GEOCHEMICAL ANALYSES - AWI
←
→
Page content transcription
If your browser does not render page correctly, please read the page content below
Rivista Italiana di Paleontologia e Stratigrafia
                                                                                              (Research in Paleontology and Stratigraphy)
                                                                                                            vol. 124(2): 343-359. July 2018

A SAMPLING STRATEGY FOR RECENT AND FOSSIL BRACHIOPODS: SELECTING
THE OPTIMAL SHELL SEGMENT FOR GEOCHEMICAL ANALYSES

Marco Romanin1*, Gaia Crippa2, Facheng Ye2, Uwe Brand3,
Maria Aleksandra Bitner1, Danièle Gaspard4, Verena Häussermann5
& Jürgen Laudien6

1*
  Corresponding author. Institute of Paleobiology, Polish Academy of Sciences, Twarda 51/55, 00-818 Warsaw, Poland. E-mail: m.romanin@
twarda.pan.pl; bitner@twarda.pan.pl
2
 Università degli Studi di Milano, Dipartimento di Scienze della Terra ‘A. Desio’, via Mangiagalli 34, Milano, 20133, Italy. E-mail: gaia.crippa@
unimi.it; facheng.ye@unimi.it
3
 Department of Earth Sciences, Brock University, 1812 Sir Isaac Brock Way, St. Catharines, ON Canada L2S 3A1. E-mail: ubrand@brocku.ca
4
 Museum National d’Histoire Naturelle, Département Origines et Evolution, UMR CNRS-MNHN-UPMC 7207, Centre de Recherche sur la
Paléodiversité et les Paléoenvironnements (CR2P), 8 Rue Buffon, 75231 Paris Cedex 05, France.E-mail: daniele.gaspard@mnhn.fr
5
 Pontificia Universidad Católica de Valparaíso, Facultad de Recursos Naturales, Escuela de Ciencias del Mar, Avda. Brasil 2950, Valparaíso, Chile
and Huinay Scientific Field Station. E-mail: v.haussermann@gmail.com
6
 Alfred-Wegener-Institut Helmholtz-Zentrum für Polar- und Meeresforschung, Bremerhaven, Germany. E-mail: juergen.laudien@awi.de

To cite this article: Romanin M., Crippa G., Ye F., Brand U., Bitner M.A., Gaspard D., Häussermann V. & Laudien J. (2018) - A sampling strategy
for recent and fossil brachiopods: selecting the optimal shell segment for geochemical analyses. Riv. It. Paleontol. Strat., 124(2): 343-359.

Keywords: microstructures; trace elements; stable isotope; brachiopod ontogeny; sampling strategy.

                     Abstract. Recent and fossil brachiopod shells have a long record as biomineral archives for (palaeo)climatic and
            (palaeo)environmental reconstructions, as they lack or exhibit limited vital effects in their calcite shell and generally are
            quite resistant to diagenetic alteration. Despite this, only few studies address the issue of identifying the best or opti-
            mal part of the shell for geochemical analyses. We investigated the link between ontogeny and geochemical signatures
            recorded in different parts of the shell. To reach this aim, we analysed the elemental (Ca, Mg, Sr, Na) and stable iso-
            tope (δ18O, δ13C) compositions of five recent brachiopod species (Magellania venosa, Liothyrella uva, Aerothyris kerguelensis,
            Liothyrella neozelanica and Gryphus vitreus), spanning broad geographical and environmental ranges (Chile, Antarctica,
            Indian Ocean, New Zealand and Italy) and having different shell layer successions (two-layer and three-layer shells).
            We observed similar patterns in the ventral and dorsal valves of these two groups, but different ontogenetic trends by
            the two- and three-layer shells in their trace element and stable isotope records. Our investigation led us to conclude
            that the optimal region to sample for geochemical and isotope analyses is the middle part of the mid-section of the
            shell, avoiding the primary layer, posterior and anterior parts as well as the outermost part of the secondary layer in
            recent brachiopods. Also, the outermost and innermost rims of shells should be avoided due to diagenetic impacts
            on fossil brachiopods.

Introduction                                                                 haviours are observed in different shell layers/seg-
                                                                             ments (e.g., Carpenter & Lohmann 1995; Auclair et
       Brachiopods have a proven record with their                           al. 2003; Parkinson et al. 2005; Cusack et al. 2012;
shells storing important geochemical signatures                              Brand et al. 2013, 2015; Bajnai et al. 2018). They
of stable isotopes (oxygen and carbon) and trace                             are not abundant in modern seas and oceans, where
elements (TE) (e.g., Carpenter & Lohmann 1995;                               they are mainly represented by the Order Terebra-
Brand et al. 2003, 2011), rare earth elements (REE)                          tulida (Curry & Brunton 2007; Emig et al. 2013).
(e.g., Azmy et al. 2011; Zaki et al. 2015), and of                           In contrast, they dominated the benthic communi-
course other tracers (i.e. strontium, clumped, mag-                          ties during the Palaeozoic, where many orders were
nesium isotopes). They precipitate their generally                           present (Williams et al. 1997). For this reason, in
low-magnesium calcite (LMC) shells in brachiopod                             recent years, there has been growing interest and
isotopic equilibrium with ambient seawater exerting                          use of fossil and recent brachiopod shells as high
no or a limited vital effect, although different be-                         resolution biomineral archives for environmental
                                                                             and (palaeo)climatic reconstructions in the recent
Received: January 31, 2018; accepted: April 26, 2018                         and distant past (e.g., Popp et al. 1986; Grossman et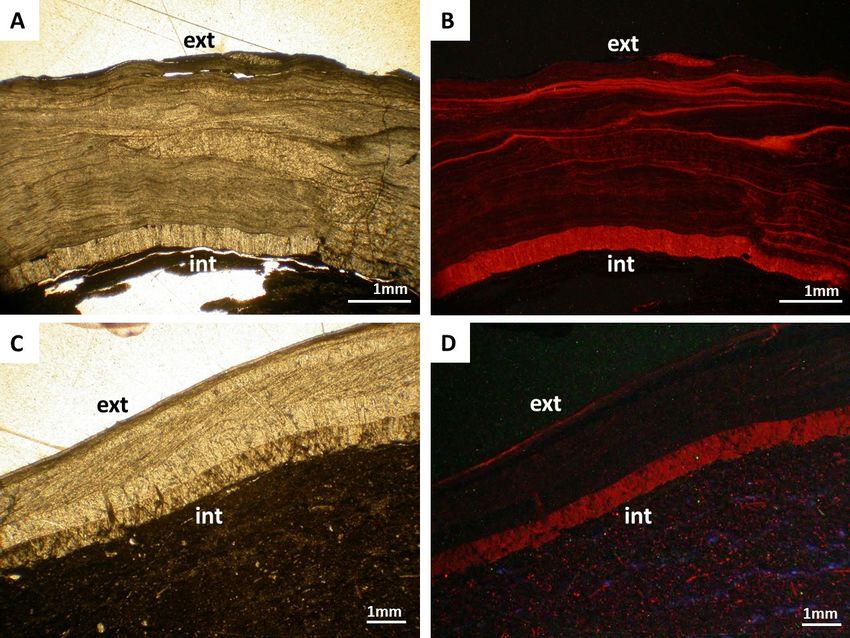
344                 Romanin M., Crippa G., Ye F., Brand U., Bitner M. A., Gaspard D., Häussermann V. & Laudien J.

                                                                                                     Fig. 1 - Map showing the localities
                                                                                                             of the specimens analysed
                                                                                                             in this study: 1) Magellania
                                                                                                             venosa, Comau fjord, Chile
                                                                                                             (South Pacific), 2) Liothyrel-
                                                                                                             la uva, off Rothera Island,
                                                                                                             Antarctica (Southern Oce-
                                                                                                             an), 3) Aerothyris kerguelensis,
                                                                                                             off South Cochons Island
                                                                                                             (Indian Ocean), 4) Liothyrel-
                                                                                                             la neozelanica, off New Zea-
                                                                                                             land coast (South Pacific); 5)
                                                                                                             Gryphus vitreus, off Monte-
                                                                                                             cristo Island, Italy (Mediter-
                                                                                                             ranean Sea).

al. 1991; Veizer et al. 1999; Brand 2004; Parkinson                 suitable components for environmental reconstruc-
et al. 2005; Came et al. 2007; Angiolini et al. 2008,               tions, if diagenetic alteration can be ruled out for
2009; Brand et al. 2011; Cusack & Pérez-Huerta                      fossil specimens (Ye et al. 2018). Regions within the
2012; Garbelli et al. 2017; Ye et al. 2018), as well                shell, such as the umbonal and muscle scar areas, can
as tracers of diagenetic processes (Brand & Veizer                  also have an impact on geochemical results if not
1980, 1981; Casella et al. 2018).                                   removed from the studied material, mainly resulting
        Terebratulid brachiopods form two- or three-                in negative shifts in their δ18O and δ13C values and
layer mineralised shells, consisting of primary and                 extraneous Mg contents probably linked to growth-
secondary layers, or of primary, secondary and ter-                 related kinetics (Buening & Carlson, 1992; Carpen-
tiary layers (e.g., Gaspard 1986; Gaspard & Nouet                   ter & Lohmann 1995; Brand et al. 2003; Parkinson
2016; and see Fig. 1 in Ye et al. 2018). Although LMC               et al. 2005; Bajnai et al. 2018).
of brachiopod shells seems ideal for geochemical                            The high complexity in brachiopod shell mi-
analyses as it is generally resistant to diagenetic alte-           crostructure and chemistry requires standardised
ration (Lowenstam 1961; Popp et al. 1986; Brand et                  analytical sampling procedures to correctly interpret
al. 2011), our increased understanding suggests that                the multitude of information stored in this biomi-
the different microstructures, composed of primary,                 neral archive. Zaky et al. (2015) and Crippa et al.
secondary and tertiary shell layers, are not spatially              (2016a) addressed the issues of proper cleaning and
homogenous in respect to their trace element con-                   preparation procedures to use for both recent and
centrations and stable isotope compositions (Cusack                 fossil brachiopod shells. However, only a few stu-
et al. 2008, 2012; Rollion-Bard et al. 2016). The mi-               dies have investigated the link between shell onto-
crocrystalline calcite of the primary layer is not se-              geny, microstructure and geochemistry to define the
creted in isotopic equilibrium with seawater during                 optimal part of the shell to sample for ontogenetic
biogenic precipitation and furthermore its Mg con-                  and (palaeo)environmental reconstructions (Pérez-
tent falls outside the limits defining LMC (~5% mol                 Huerta et al. 2008; Butler et al. 2015; Takizawa et al.
MgCO3; Veizer 1992; Carpenter & Lohmann 1995).                      2017; Ullmann et al. 2017; Ye et al. 2018).
Buening & Carlson (1992) observed deviations from                           The aim of this study is to identify the optimal
the ‘norm’ in the Mg contents of the umbonal area.                  part of the shell for geochemical analyses without
Furthermore, Brand et al. (2003, 2013) observed de-                 incurring a major bias from biochemical and bio-
viations in Mg content in several species as well as in             logical processes of the organism or from external
some areas close to the anterior; changes in growth                 forces (e.g., fish farms, tectonic upheaval). To achie-
kinetics are a possible explanation (work in pro-                   ve this purpose, we analysed trace elements (Mg, Sr
gress). On the other hand, fibres of the innermost                  and Na) and stable isotopes (δ18O, δ13C) intrashell
secondary layer and the columnar calcite of the ter-                compositions of five recent brachiopod species: Ae-
tiary layer are deposited in brachiopod isotopic equi-              rothyris kerguelensis (Davidson, 1878), Magellania veno-
librium with seawater (Parkinson et al. 2005; Cusack                sa (Solander, 1786), Liothyrella uva (Broderip, 1833),
et al. 2012; Brand et al. 2013, 2015) and are the most              Liothyrella neozelanica (Thomson, 1918) and Gryphus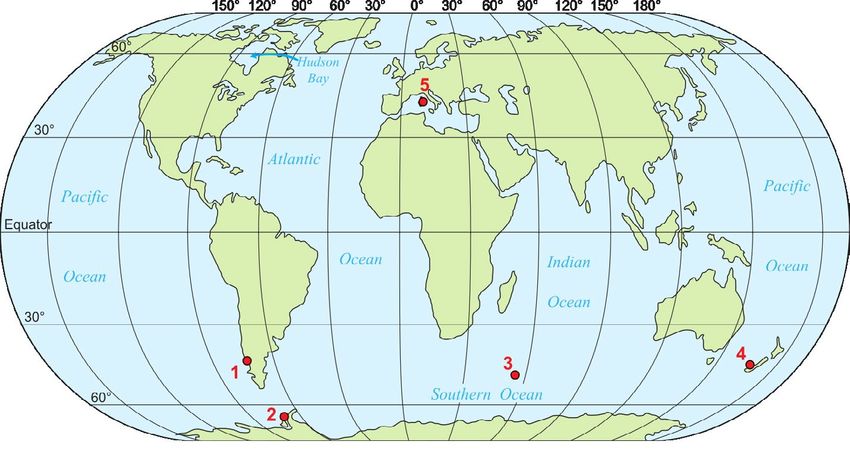
Geochemical analyses on brachiopods shells                                                    345

        Species            #-Layers   Length (mm)    Location            Coordinates           Depth (m)   SW-18O (‰)   Temperature (°C)   Salinity (psu)
   Magellania venosa          2           37           Chile       42°22'29"S, 2°25'41.58"W          ~20     -1.21          8 to 14            32.0
 M. venosa (supplement)       2           70
     Liothyrella uva          2           47         Antarctica    67°34’11”S, 68°07’88”W            ~10     -0.87           -1 to 1           32.8
 Aerothyris kerguelensis      2           39        S. Cochons      46°13’04”S, 50°12’08’E      200-400       +0.5           4 to 8              -
 Liothyrella neozelanica      3           70        New Zealand       34.707°S, 178.57°E         ~1150        +0.3           3 to 7            34.5
     Gryphus vitreus          3           47        Montecristo    42°55.035’N, 10°05.600’E      ~150        +1.24          12 to 17           39.0

Tab. 1 - Species, shell structure (# of layers and ventral valve length), locality and seawater information. Note: length measured on the ventral
         valves as well as along the ‘curved’ growth axis.

vitreus (Born, 1778). They cover a wide geographical                           rent shell layer successions (Table 1). The main goal
range respectively from the Indian Ocean to Chile to                           of this study is to devise an approach which can be
Antarctica to New Zealand to Italy, and have diffe-                            used not only in recent specimens, but also in fossil
                                                                               ones, in order to make the geochemical composition
                                                                               of fossil brachiopod shells a more reliable tool for
                                                                               palaeoclimatic and palaeoenvironmental reconstruc-
                                                                               tions.

                                                                               Material

                                                                                        Seven recent articulated brachiopod specimens belonging
                                                                               to five species of the Order Terebratulida were collected from five
                                                                             1 worldwide locations (Fig.1, Table 1, Appendix 1). All the species an-
                                                                               alysed have a punctate shell and may have a two- or three-layer shell
                                                                               successions. Aerothyris kerguelensis was sampled off south Cochons Is-
                                                                               land, Indian Ocean during the MD30 “BIOMASS” cruise, Station 29
                                                                               (CP 82), at depths ranging from 200 to 400 m and an average water
                                                                               temperature of about 4.5°C (Table 1; Locarnini et al. 2013). Magellania
                                                                               venosa was collected at Comau fjord, Northern Patagonia, Chile from a
                                                                               depth of about 20 m and an average water temperature of about 11°C
                                                                               (Table 1). Liothyrella uva was collected off Rothera Island, Antarctica at
                                                                               an average depth of 10 m (Table 1). Liothyrella neozelanica was collected
                                                                               off New Zealand at a depth of about 1150 m (Table 1). Gryphus vit-
                                                                               reus was collected off Montecristo Island, Italy from a water depth of
                                                                               about 150 m (Table 1). Specimen size ranged from 70 mm to 39 mm
                                                                               for the ventral valve with correspondingly smaller dorsal valves (Table
                                                                               1). The three-layer shells were generally thicker than their two-layer
                                                                               counterparts and thus facilitating greater sampling interval.

                                                                               Methods

                                                                                       Sample preparation and sampling
                                                                                       All specimens were cleaned following the pro-
                                                                               cedure of Zaky et al. (2015). Shells were washed with
Fig. 2 - Schematic representation of cross section (upper image) and           distilled water, then cleaned by immersion in hydro-
          top view (lower image) of a brachiopod valve showing the             gen peroxide for up to three days. The remaining
          posterior (p), middle (m) and anterior (a) parts of the shell.
          In yellow is highlighted the primary layer; in orange the in-        organic tissue and epibionts were physically remo-
          nermost layers of the shell easily susceptible to alteration;        ved and further cleaning of the exterior and interior
          the black area is intended to represent the suggested optimal
          sampling area. The direction of sampling is also illustrated         surfaces and removal of the primary layer was achie-
          on the profile. Note: M – mid-section sampling interval              ved by leaching shells with 10 % hydrochloric acid
          ranging from m1 adjacent to anterior (a) sample to m15               (HCl) for about 5 seconds or until clean. Finally all
          (or other) adjacent to the posterior (p, umbonal area) (see
          Appendix 1), Black line (side) and area (top) is the optimal         shells were rinsed with deionized water and air dri-
          sampling area, NTS – not to scale.                                   ed. Sampling was performed along the growth axis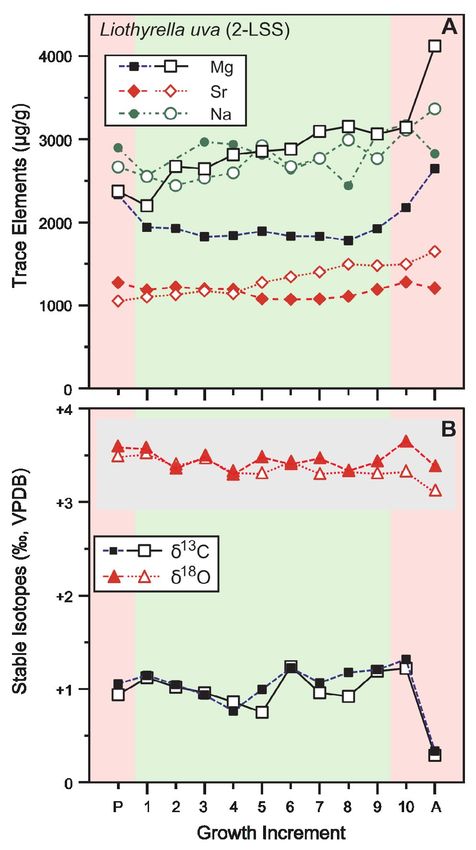
Table 2
346 Romanin M., Crippa G., Ye F., Brand U., Bitner M. A., Gaspard D., Häussermann V. & Laudien J.
Tab. 2 - Statistical comparison
Species Parameter N Mean STD Min Max p
between ventral (V) and dor-
Mg (V) 9 910 145 750 1176 sal (D) valves of M. venosa,
0.564
Mg (D) 8 945 89 825 1048 A. kerguelensis, L. uva and
Sr (V) 9 1115 180 933 1490 L. neozelanica. Number of
0.742
Magellania Sr (D) 8 1085 189 939 1511 results (N), mean (Mean),
venosa δ13C (V) 9 -0.66 2.06 -4.93 0.94 standard deviation (STD),
0.661 minimum (Min), maximum
δ13C (D) 8 -0.26 1.60 -3.29 0.96
δ18O (V) 9 -0.71 1.25 -3.15 0.19 (Max) and p-value for each
0.574 element (Mg, Sr, Na) and
δ18O (D) 8 -0.40 0.96 -2.10 0.40
stable isotopes (δ13C and
Mg (V) 18 1177 394 694 2065
0.986 δ18O). In brown significant
Mg (D) 18 1175 324 787 2131 p-values, in red highly signi-
Sr (V) 18 875 116 696 1072 ficant ones.
0.873
Sr (D) 18 881 97 753 1093
Aerothyris
Na (V) 18 1871 497 1220 2628
kerguelensis 0.594
Na (D) 18 1789 417 1220 2651
δ13C (V) 10 2.48 0.21 2.00 2.68
0.421
δ13C (D) 10 2.56 0.22 2.13 2.78
δ18O (V) 10 2.80 0.14 2.56 3.06
0.076
δ18O (D) 10 2.95 0.19 2.70 3.22
Mg (V) 12 2920 483.6 2202 4125 <
Mg (D) 12 1999 260.5 1784 2649 0.001
Sr (V) 12 1314 193.6 1056 1652
0.037
Sr (D) 12 1177 73.1 1075 1282
Liothyrella Na (V) 12 2784 269.9 2445 3368
0.745
uva Na (D) 12 2741 371.1 1770 3188
δ13C (V) 12 0.99 0.26 0.32 1.27
0.832
δ13C (D) 12 1.02 0.26 0.33 1.31
δ18O (V) 12 3.47 0.11 3.23 3.63
0.538
δ18O (D) 12 3.45 0.11 3.29 3.65
Mg (V) 17 1425 395 1035 2644
0.592
Mg (D) 13 1503 392 1121 2627
Sr (V) 17 670 89 571 921
0.381
Sr (D) 13 701 103 582 972
Liothyrella Na (V) 16 1089 277 777 1743
0.701
neozelanica Na (D) 12 1133 326 816 1921
δ13C (V) 17 2.31 0.46 1.57 2.82
0.729
δ13C (D) 13 2.25 0.55 1.39 2.89
δ18O (V) 17 1.16 0.13 1.00 1.44
0.276
δ18O (D) 13 1.22 0.14 0.88 1.41
following major growth lines on the shell surface, layer tends to be the dominant mass (Ye et al. 2018)
without assuming that growth increments are equiv- and thus the prominent factor in their overall geo-
alent to annual increments. Individual growth incre- chemistry. Posterior, middle and anterior parts were
ments were separated from the shell using a scalpel, discriminated based on the curvature of the shell:
microdrill and/or razor blade and labelled ‘a’ for the umbonal curvature in the posterior region, lowest
anterior-most increment followed by ‘m-1’ to ‘m-X’, curvature in the middle part and again increase in
and finally by ‘p’ for the last increment 1 that included curvature in the anterior part (Fig. 2), and ultimately
the umbonal and muscle scar area (Fig. 2, Appendix on the chemical trace element and/or stable isotope
1). The number of m-1 to m-X increments sampled trends. Each shell increment was powdered in an ag-
depended, in part, on the length as well as the thick- ate mortar and about 3-20 mg of each sample was
ness of the shell. In general, in the analysed speci- weighed to four decimal places, and digested in 2 %
mens, the three-layer shells were thicker than their (v/v) distilled nitric acid (HNO3) with the addition
two-layer counterparts. To be noted, in the three-lay- of matrix modifier solutions (sample, calibration and
er shells (L. neozelanica and G. vitreus) the powder for standards) to facilitate analysis for Ca, Mg, Sr and Na
the analysis was collected from both the secondary by atomic absorption spectrophotometer (AAS) at
and tertiary layers, thus, each sample represents both Brock University, St. Catharines, Canada (cf. Brand
layers in varying proportions. However, the tertiary & Veizer 1980).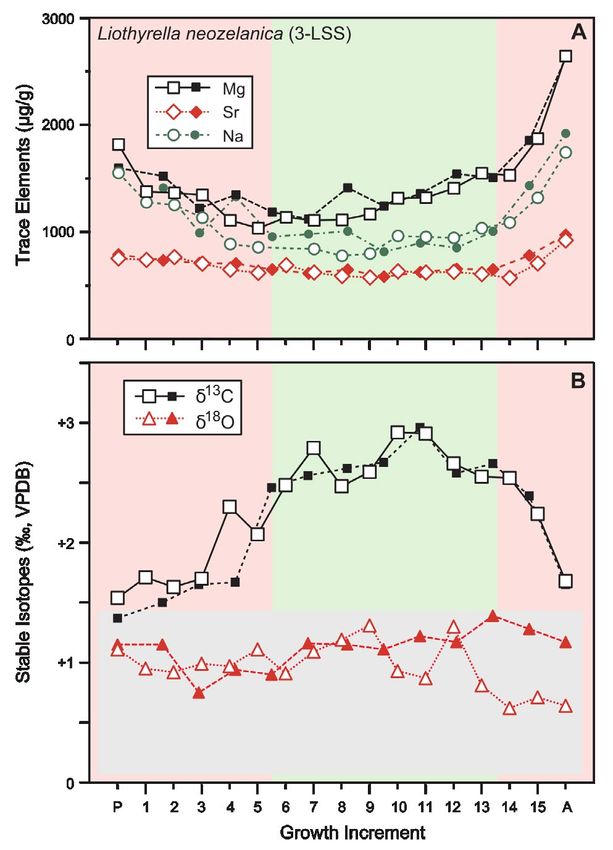
Geochemical analyses on brachiopods shells                                                  347

        Atomic Absorption Spectrometry (AAS)                      NY). For the independent-sample t-test a p-value
        All samples were analysed for Ca, Mg, Sr, and             ≤ 0.05 was considered significant and a p-value ≤
Na by AAS on a Varian 400P Spectrophotometer                      0.001 was considered highly significant.
(Varian Medical Systems Inc., Palo Alto, USA) with
appropriate gases and the addition of required ma-
trix modifiers (cf. Brand & Veizer 1980) at the De-               Results
partment of Earth Sciences at Brock University, St.
Catharines, Canada. Accuracy and precision of che-                       Trace elements
mical analyses was determined with duplicates and                        •Trace elements in M. venosa (Fig. 3) show
standard reference material NIST NBS standard                     a slightly positive trend from the posterior to the
rock material 633 (Portland cement). The reprodu-                 anterior areas in both valves. When comparing the
cibility (1σ) of results relative to certified values for         concentrations of Mg and Sr between the two valves
NBS SRM 633 was 2.12 % for Ca (N=101), 1.76 %                     a p-value of 0.564 for Mg and 0.742 for Sr indicate
for Mg (N=108), 3.03 % for Sr (N=110) and 6.51                    no significant differences between them (Table 2).
% for Na (N=80). Finally, all elemental results were              In contrast, a highly significant difference is noted
adjusted to a 100 % carbonate basis (cf. Brand &                  between the anterior and middle areas of the shell
Veizer 1980).                                                     for Mg (Table 3), and also a significant difference is

       Mass Spectrometry
       For carbon and oxygen isotope analyses about
250 μg of powdered calcite of each sample was
analysed with a Finnigan GasBench connected to
a Delta V (Thermo Fisher Scientific Inc., Waltham,
Massachusetts, USA) mass spectrometer at the Di-
partimento di Scienze della Terra, Università degli
Studi di Milano, Italy. Isotope values (δ18O, δ13C) are
reported as per mil (‰) deviations of the isotopic
ratios (18O/16O, 13C/12C) calculated to the V-PDB
scale using a within-run internal laboratory standard
(MAMI) calibrated against the International Ato-
mic Energy Agency 603 standard (IAEA-603; δ18O:
-2.37 ± 0.04 ‰, δ13C: +2.46 ± 0.01 ‰). Analytical
reproducibility (1σ) for these analyses was better
than 0.15 ‰ for δ18O and 0.09 ‰ for δ13C values.

       Statistical analysis
       The mean, standard deviation and minimum
and maximum values of each element (Mg, Sr and
Na) and stable isotope values (δ18O, δ13C) were cal-
culated for each valve of each specimen and for the
entire specimen (i.e., ventral and dorsal valves to-
gether; Tables 2, 3). Also, an independent-sample
t-test was conducted to check if there was a sig-
                                                                   Fig. 3 - Geochemical profiles of Magellania venosa and its 2-layer shell
nificant difference in the geochemical and isotopic                         sequence (2-LSS) from posterior (p) to anterior (a). A) Trace
results, 1) between ventral and dorsal valves of the                        element concentration (Mg and Sr), B) Oxygen and Carbon
                                                                            stable isotopes. Empty symbols: ventral valve, solid symbols:
same specimen (applies to M. venosa, L. uva, A. ker-                        dorsal valve. Pink coloured areas represent posterior and an-
guelensis and L. neozelanica) and 2) among the poste-                       terior regions; green area represents the mid-section of the
rior, middle and anterior parts of the shell of the                         valve. The grey horizontal box shows the brachiopod isoto-
                                                                            pe equilibrium field for measured δ18O values with respect
same species (Table 3). The analysis was performed                          to the ambient seawater-18O and temperature (cf. Brand et
using SPSS Statistics (IBM Version 22.0. Armonk,                            al. 2013; Appendix 1).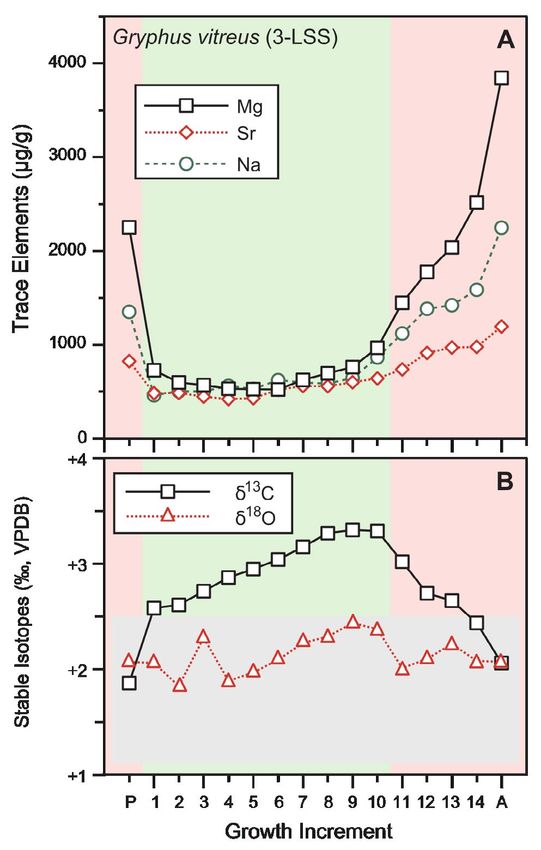
348                         Romanin M., Crippa G., Ye F., Brand U., Bitner M. A., Gaspard D., Häussermann V. & Laudien J.

      Species   Parameter       N        Mean        STD         Min       Max                p              Tab. 3 - Statistical comparison of
                  Mg (p)        2         789         56         750        829       A vs M 0.001                  trace element and stable iso-
                  Mg (m)        8         865         77         759        979        P vs M 0.238                 tope chemistry between the
                  Mg (a)        7        1036         71         937       1176        A vs P 0.003                 posterior (p), middle (m) and
                   Sr (p)       2        1049        154         940       1159        A vs M 0.007                 anterior (a) shell parts of
                  Sr (m)        8         980         34         933       1032        P vs M 0.639                 the articulated brachiopod
 Magellania        Sr (a)       7        1253        182        1041       1511        A vs P 0.199
  venosa
                                                                                                                    specimens M. venosa, A. ker-
                 δ13C (p)       2         0.76       0.03        0.74      0.78        A vs M 0.004
                 δ13C (m)       8         0.71       0.19        0.45      0.96        P vs M 0.734
                                                                                                                    guelensis, L. uva, L. neozelanica
                 δ13C (a)       7        -2.18       1.70       -4.93      -0.05       A vs P 0.053                 and G. vitreus. Number of
                 δ18O (p)       2         0.26       0.19        0.12      0.40        A vs M 0.003                 samples (N), mean (Mean),
                 δ18O (m)       8         0.15       0.08       -0.01      0.26        P vs M 0.234                 standard deviation (STD),
                 δ18O (a)       7        -1.62       1.00       -3.16      -0.28       A vs P 0.041                 minimum (Min), maximum
                  Mg (p)        2        2357         29        2336       2377        A vs M 0.049                 (Max) and p-values. In
                  Mg (m)        18       2345        531        1784       3155        P vs M 0.929                 brown significant p-values,
                  Mg (a)        4        3025        833        2180       4125        A vs P 0.345                 in red highly significant ones.
                   Sr (p)       2        1166        156        1056       1276        A vs M 0.026
                  Sr (m)        18       1218        133        1075       1498        P vs M 0.615
                   Sr (a)       4        1411        202        1210       1652        A vs P 0.215
                  Na (p)        2        2784        164        2668       2900        A vs M 0.011
  Liothyrella
                  Na (m)        18       2680        297        1770       3074        P vs M 0.638
      uva
                  Na (a)        4        3123        225        2827       3368        A vs P 0.138
                 δ13C (p)       2         1.01       0.05        0.98      1.05        A vs M 0.439
                 δ13C (m)       18        1.05       0.15        0.76      1.27        P vs M 0.747
                 δ13C (a)       4         0.80       0.55        0.32      1.31        A vs P 0.502
                 δ18O (p)       2         3.59       0.02        3.58      3.60        A vs M 0.697
                 δ18O (m)       18        3.45       0.09        3.29      3.63        P vs M 0.053
                 δ18O (a)       4         3.43       0.17        3.23      3.65        A vs P 0.295
                  Mg (p)        2         787         13         777        796       A vs M<0.001
                  Mg (m)        14       1006        199         694       1313        P vs M 0.001
                  Mg (a)        4        1466        122        1321       1619        A vs P 0.002
                   Sr (p)       2         800         21         786        815       A vs M<0.001
                  Sr (m)        14        879         69         789        982        P vs M 0.017
                   Sr (a)       4        1049         40        1003       1093        A vs P 0.001
                  Na (p)        2        1366         7         1361       1371        A vs M 0.004
  Aerothyris
                  Na (m)        14       1742        430        1220       2493        P vs M 0.006
 kerguelensis
                  Na (a)        4        2495        179        2273       2651        A vs P 0.001
                 δ13C (p)       2         2.22       0.13        2.14      2.31       A vs M<0.001
                 δ13C (m)       14       2.63        0.10       2.42       2.78       P vs M<0.001
                 δ13C (a)       4         2.26       0.19        2.00      2.44        A vs P 0.812
                 δ18O (p)       2         2.74       0.20        2.60      2.88        A vs M 0.097
                 δ18O (m)       14       2.93        0.17       2.70       3.22        P vs M 0.173
                 δ18O (a)       4         2.76       0.15        2.65      2.97        A vs P 0.888
                  Mg (p)        11       1357        226        1035       1817        A vs M 0.022
                  Mg (m)        14       1308        163        1109       1549        P vs M 0.531
                  Mg (a)        5        2105        503        1529       2644         A vs P 0.026
                   Sr (p)       11        710         54         618        789        A vs M 0.083
                  Sr (m)        14        624         31         575        689       P vs M<0.001
                   Sr (a)       5         790        162         571        972         A vs P 0.338
                  Na (p)        10       1165        237         857       1552        A vs M 0.016
  Liothyrella
                  Na (m)        13        913         88         777       1035        P vs M 0.009
 neozelanica
                  Na (a)        5        1501        333        1087       1921         A vs P 0.041
                 δ13C (p)       11        1.81       0.35        1.40      2.49        A vs M 0.046
                 δ13C (m)       14        2.70       0.12        2.50      2.89       P vs M<0.001
                 δ13C (a)       5         2.18       0.41        1.74      2.66         A vs P 0.083
                 δ18O (p)       11        1.13       0.12        0.88      1.28        A vs M 0.092
                 δ18O (m)       14        1.25       0.12        1.04      1.44        P vs M 0.017
                 δ18O (a)       5         1.14       0.12        1.00      1.31         A vs P 0.817
                 Mg (Vp)        1        2252
                 Mg (Vm)        10        653        140        553        968         M vs A 0.016
                 Mg (Va)        5        2325        936        1447       3846
                  Sr (Vp)       1         825
                 Sr (Vm)        10        514        74          421       641        M vs A<0.001
                  Sr (Va)       5         958        164         737       1194
                 Na (Vp)        1        1351
   Gryphus
                 Na (Vm)        10        587        113        461        865         M vs A 0.006
   vitreus
                 Na (Va)        5        1552        423        1120       2248
                δ13C (Vp)       1         1.85
                δ13C (Vm)       10        2.97       0.28       2.56        3.30       M vs A 0.029
                δ13C (Va)       5         2.56       0.36       2.04        3.00
                δ18O (Vp)       1         2.06
                δ18O (Vm)       10        2.14       0.21       1.83        2.43       M vs A 0.524
                δ18O (Va)       5         2.09       0.09       2.00        2.23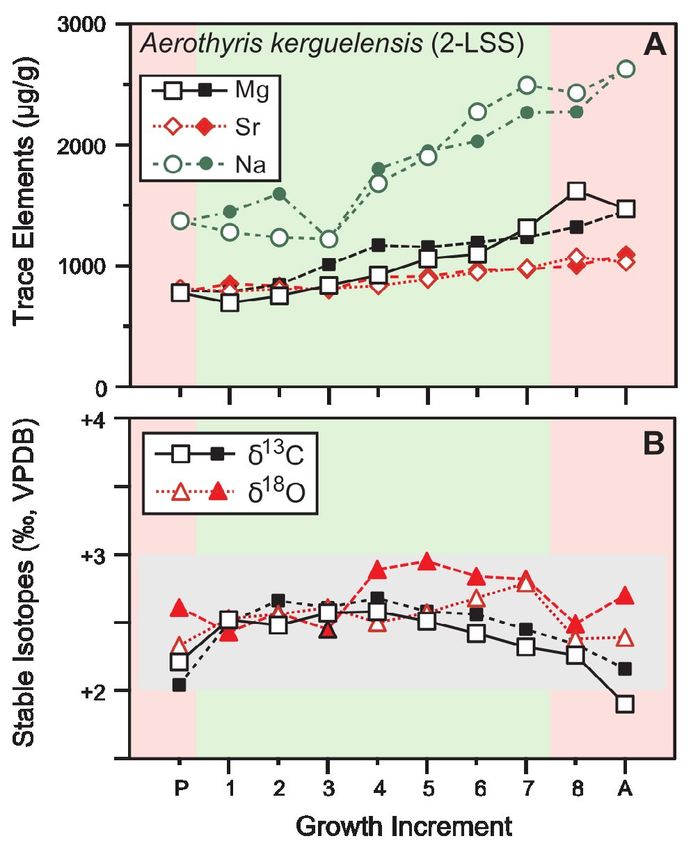
Geochemical analyses on brachiopods shells                                                  349

                                                                             Fig. 5 - Geochemical profiles of Aerothyris kerguelensis and its 2-layer
                                                                                      shell sequence (2-LSS) ) from posterior (p) to anterior (a).
                                                                                      A) Trace element concentration (Mg, Sr and Na), B) Oxygen
                                                                                      and Carbon stable isotopes. Empty symbols: ventral valve,
                                                                                      solid symbols: dorsal valve. Pink coloured areas represent
                                                                                      posterior and anterior regions; green area represents the
                                                                                      mid-section of the valve. The grey horizontal box as in Fi-
                                                                                      gure 3.

                                                                            comparing the different areas of the shell, a signif-
                                                                            icant difference is found between the anterior and
Fig. 4 - Geochemical profiles of Liothyrella uva and its 2-layer shell
                                                                            middle area for all three elements (Table 3).
         sequence (2-LSS) from posterior (p) to anterior (a). A) Tra-              •Trace elements recorded in A. kerguelensis
         ce element concentration (Mg, Sr and Na), B) Oxygen and            show continually slightly upward trends from the
         Carbon stable isotopes. Empty symbols: ventral valve, solid
         symbols: dorsal valve. Pink coloured areas represent poste-        posterior region to the anterior margin in both
         rior and anterior regions; green area represents the mid-          valves (Fig. 5). The minimum and maximum con-
         section of the valve. The grey horizontal box as in Figure 3.
                                                                            centrations are relatively comparable between the
                                                                            two valves (Table 2, Appendix 1); only in Mg we ob-
found between the anterior and posterior areas for                          serve a big difference, where the ventral valve max-
Mg, and anterior and middle areas for Sr (Table 3).                         imum value is 1619 µg/g, whereas the dorsal one
       •Trace elements in L. uva (Fig. 4) show a                            is 1454 µg/g. Correlation between the two valves,
slightly positive trend from the posterior to the                           relative to the investigated elements is noteworthy
anterior area of the shell, which is particularly evi-                      with p-values for the three elements as follows:
dent in the divergent Mg concentrations that reach                          0.986 for Mg, 0.873 for Sr and 0.594 for Na, indi-
high values anteriorly of 4125 µg/g in the ventral                          cating no significant difference between the valves
valve and 2649 µg/g in the dorsal valve (Appendix                           (Table 2). In contrast, the comparison between the
1). A highly significant difference for Mg concen-                          different areas of the valve shows highly significant
tration (p-value < 0.001) is found between ventral                          differences between anterior and middle areas for
and dorsal valves, whereas a significant difference                         Mg and Sr, between posterior and middle areas for
is observed in Sr concentrations (Table 2). When                            Mg, and between anterior and posterior areas for Sr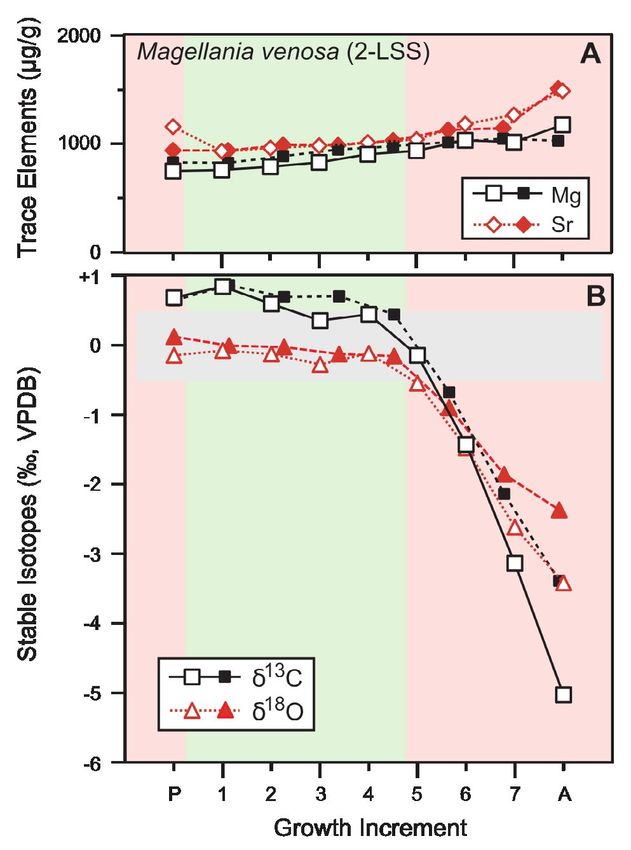
350                      Romanin M., Crippa G., Ye F., Brand U., Bitner M. A., Gaspard D., Häussermann V. & Laudien J.

                                                                           Mg and Na, middle and posterior areas in Na, and
                                                                           anterior and posterior areas in Mg and Na (Table 3).
                                                                                  •Trace elements recorded in G. vitreus show
                                                                           a pronounced U-shaped trend, with high values in
                                                                           the posterior (umbo area), which then decrease in
                                                                           concentration reaching lowest values in the middle
                                                                           part of the shell with 523 µg/g for Mg, 421 µg/g for
                                                                           Sr and 461 µg/g for Na, and subsequently increase
                                                                           approaching the anterior margin, with Mg reaching
                                                                           3846 µg/g, Sr up to 1194 µg/g and Na reaching
                                                                           2248 µg/g (Fig. 7, Table 2; Appendix 1). A highly
                                                                           significant difference is present between anterior
                                                                           and middle areas for Sr, whereas a significant differ-
                                                                           ence is found between anterior and middle areas for
                                                                           Mg and Na (Table 3).

                                                                                  Stable isotopes
                                                                                  •The δ18O and δ13C values of M. venosa (Fig.
                                                                           3) are rather constant up to the middle part of both
                                                                           valves, then a sharp drop in the δ18O and δ13C values
                                                                           of both valves is observed, reaching very negative
                                                                           values (ventral valve: δ18O = -3.16 ‰, δ13C = -4.93
                                                                           ‰; dorsal valve: δ18O =-2.10 ‰, δ13C = -3.29 ‰;
                                                                           Appendix 1). No significant difference is observed
                                                                           between ventral and dorsal valves in stable isotope
Fig. 6 - Geochemical profiles of Liothyrella neozelanica and its 3-layer
         shell sequence (2-LSS) from posterior (p) to anterior (a). A)     values (Table 2). Instead, a significant difference is
         Trace element concentration (Mg, Sr and Na), B) Oxygen            found between anterior and middle areas in their
         and Carbon stable isotopes. Empty symbols: ventral valve,         collective δ13C values (p = 0.004), and anterior and
         solid symbols: dorsal valve. Pink coloured areas represent
         posterior and anterior regions; green area represents the         middle areas (p = 0.003) and anterior and posterior
         mid-section of the valve. The grey horizontal box as in Fi-       areas (p = 0.041) in their δ18O values (Table 3).
         gure 3.
                                                                                  •Oxygen and carbon isotope compositions
                                                                           of L. uva (Fig. 4) show a rather constant trend from
and Na. A significant difference is found between                          the umbo to the anterior part of the shell (ventral
anterior and posterior areas for Mg, posterior and                         valve: maximum δ18O = +3.65 ‰, minimum δ18O
middle areas for Sr and Na, and anterior and middle                        = +3.29 ‰, maximum δ13C = +1.31 ‰, minimum
area for Na (Table 3).                                                     δ13C = +0.33 ‰. Dorsal valve: maximum δ18O =
       •In L. neozelanica, trace element trends are                        +3.63 ‰, minimum δ18O = +3.23 ‰, maximum
similar for both valves (Fig. 6), showing a U-shaped                       δ13C = +1.25 ‰, minimum δ13C = +0.32 ‰; Ap-
trend with higher concentration in the posterior                           pendix 1). No significant differences are found be-
(umbo area) and anterior area, reaching maximum                            tween dorsal and ventral valves (δ18O, p = 0.538;
values anteriorly of 2644 µg/g for Mg, 921 µg/g for                        δ13C, p = 0.832) and among the different parts of
Na and 1743 µg/g for Sr in the ventral valve, and of                       the shell (Tables 2, 3). Carbon isotope values in the
2627 µg/g for Mg, 972 µg/g for Na and 1921 µg/g                            anterior area record a decrease of nearly 1 ‰ both
for Sr in the dorsal valve (Fig. 6, Table 2; Appendix                      in the ventral and dorsal valves.
1). As indicated by the p-values no significant dif-                              •The oxygen and carbon isotope values re-
ference is found between ventral and dorsal valve                          corded in the A. kerguelensis specimen show similar
trace-element contents (Table 2). Instead, a highly                        trends in both ventral and dorsal valves (Fig. 5; Ap-
significant difference is observed between middle                          pendix 1). Oxygen values show no particular trend
and posterior areas in Sr, whereas significant differ-                     and remain rather constant from the umbo to the
ences is found between anterior and middle areas in                        anterior part of the shell (ventral valve: maximum: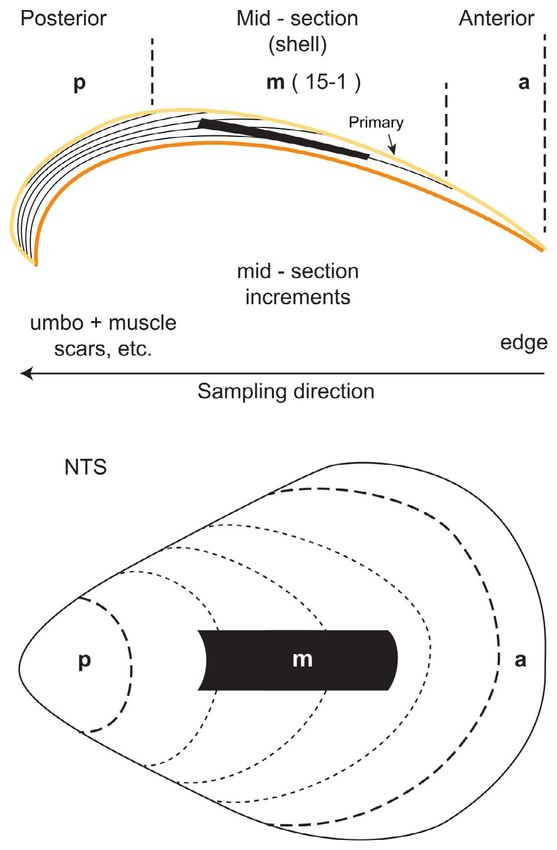
Geochemical analyses on brachiopods shells                                                351

+3.06 ‰; minimum: +2.56 ‰; dorsal valve: maxi-
mum: +3.22 ‰; minimum: +2.70 ‰). Carbon val-
ues show, instead, a slightly reverse U-shaped trend
with lower values in the umbo (+2.31 ‰ in the ven-
tral valve and +2.14 ‰ in the dorsal one) and in the
anterior margin (+2.00 ‰ in the ventral valve and
+2.26 ‰ in the dorsal one) and higher values in
the middle area of the shell (up to +2.68 ‰ in the
ventral valve and +2.78 ‰ in the dorsal one). The
higher p-values obtained (δ18O, p = 0.076; δ13C, p
= 0.421) indicate that there is no significant differ-
ence between the stable isotope values of the ven-
tral and dorsal valves (Table 2). A highly significant
difference (p < 0.001) is found between anterior and
middle areas, and posterior and middle areas in δ13C
values (Table 3).
       •Oxygen isotope compositions in L. neoze-
lanica (Fig. 6; Appendix 1) show a nearly constant
trend punctuated by apparently seasonal variation,
recorded by both ventral and dorsal valves (ventral
valve: maximum δ18O = +1.44 ‰, minimum δ18O
= +1.00 ‰; dorsal valve: maximum δ18O = +1.41
‰, minimum δ18O = +0.88 ‰). Carbon isotopes
show a distinctly reverse U-shaped trend with lower
values in the umbo (+1.57 ‰ in the ventral valve
and +1.40 ‰ in the dorsal one) and in the anterior
area (+1.76 ‰ in the ventral valve and +1.74 ‰ in
the dorsal one) reaching higher values in the middle
                                                                 Fig. 7 - Geochemical profiles of Gryphus vitreus and its 3-layer shell
area of the shell, up to +2.82 ‰ in the ventral valve                     sequence (2-LSS) from posterior (p) to anterior (a). A) Tra-
and +2.89 ‰ in the dorsal valve. No significant                           ce element concentration (Mg, Sr and Na), B) Oxygen and
difference is found between the dorsal and ventral                        Carbon stable isotopes. Empty symbols: ventral valve, solid
                                                                          symbols: dorsal valve. Pink coloured areas represent poste-
valves (δ18O, p = 0.276; δ13C, p = 0.729) (Table 2).                      rior and anterior regions; green area represents the mid-
Instead, a significant difference is observed between                     section of the valve. The grey horizontal box as in Figure 3.
the posterior and middle areas (p = 0.017) in δ18O
values and anterior and middle areas (p = 0.046) in
δ13C values, whereas a highly significant difference            Discussion
is found between the posterior and middle area (p <
0.001; Table 3).                                                       Two-layer vs. three-layer shells
       •Oxygen isotope compositions in G. vitreus                      Comparable trends have been observed in the
(Fig. 7; Appendix 1) do not record a peculiar trend,            trace element concentrations and stable isotope va-
remaining nearly constant from the umbo to the                  lues recorded along the growth axis by the two-layer
anterior part of the shell (maximum δ18O = +2.43                vs. three-layer shells. For this reason, the following
‰, minimum δ18O = +1.83 ‰). In contrast, carbon                 discussion will be organized along the groups G. vi-
isotope values, instead, show a reverse U-shaped                treus and L. neozelanica, with a columnar tertiary layer
trend, similar to the one observed in L. neozelanica,           (Gaspard 1991), and A. kerguelensis, M. venosa and L.
with lower values in the umbo (+1.85 ‰) and in                  uva, with only primary and secondary layers (Wil-
the anterior area (+2.04 ‰) and higher values in                liams & Cusack 2007).
the middle of the shell (up to +3.30 ‰) (Fig. 7; Ap-                   As shown in Figures 6 and 7, trace element
pendix 1). A significant difference is found between            concentrations for both three-layer shells of L. neo-
anterior and middle areas in δ13C values (Table 3).             zelanica and G. vitreus show a U-shaped trend, which
352 Romanin M., Crippa G., Ye F., Brand U., Bitner M. A., Gaspard D., Häussermann V. & Laudien J. is particularly evident for Mg. Higher concentra- ues in agreement with the present observations. Al- tions are recorded in the posterior region, they then though carbon isotopes and elemental contents ex- decrease toward the middle of the shell and increase hibit clear trends, δ18O values for both G. vitreus and again toward the anterior margin, where they reach L. neozelanica remain relatively stable and seem not their highest concentrations. In G. vitreus this trend to correlate with the other trace element and δ13C is highly emphasized, with Mg and Sr concentrations trends (Figs. 6 and 7). Their variations appear not to respectively increasing more than 7 and 2.5 times be related to microstructural changes and shell suc- between their lowest and their maximum values. A cessions, and thus, δ18O potentially records environ- reverse U-shaped trend is recorded in the δ13C val- mental changes that occurred during the life of the ues in both species, similar to that observed in other organism (cf. Veizer & Prokoph 2015). studies by Takayanagi et al. (2013) and Takizawa et The two-layer shells of L. uva and A. kerguelen- al. (2017). The observed trends may be explained sis (Figs. 4, 5) do not show any U-shaped trends (nor- considering the three-layer structure of L. neozelani- mal or reverse) in their trace element and stable iso- ca and G. vitreus and the current sampling strategy, tope records, as has been observed in the three-layer which collected shell powders from both the sec- shells. This may be also due to the relatively uniform ondary and tertiary layers. The tertiary layer is gen- ambient water conditions (temperature), and low erally depleted in trace elements (Milner et al. 2017) metabolism and slow growth rates (cf. L. uva at Ro- and has a lower organic content compared to the thera, Peck et al. 1997). secondary layer, where the organic matter is present Trace elements in both species show a general as organic sheaths around the fibres (intercrystalline increasing trend from the umbo to the anterior mar- matrix) and within the punctae in punctate brachi- gin, which is especially evident in the Mg content. opods, such as terebratulid brachiopods (Gaspard However, Mg concentrations of L. uva are much et al. 2007; Pérez-Huerta et al. 2009). Only imper- higher compared to the ones of A. kerguelensis. Cu- sistent organic sheets between the tertiary columns sack et al. (2008) have observed in Terebratalia trasversa have been observed (Williams et al. 1997; Schmahl that Mg may be associated with organic components, et al. 2012). According to Garbelli et al. (2014), the and since L. uva has a greater organic content than greater amount of organic matter may be related other recent species (Ye et al. 2018), this may explain to vital processes and this may be reflected in the our results. Stable isotope values remain rather con- carbon isotope compositions of the shell calcite. In stant through the shell of both species, with carbon fact, metabolic respiration and photosynthesis may being slightly more variable than oxygen, but in both cause shifts in the δ13C values of the shells without cases having a less than 1 ‰ variation along the shell. having an apparent impact on their δ18O composi- In the δ13C values of A. kerguelensis a similar reverse tions (McConnaughey 1989). The normal and re- U-shaped trend to those observed in G. vitreus and verse U-shaped trends observed in trace elements L. neozelanica is recorded, although much less pro- and carbon isotope values are thus related to the nounced. The sampling of specialized areas in the different distribution of the tertiary and second- posterior part and a decrease due to metabolic effect ary layers in the shells. The maximum thickness of in the anterior area may account for these low val- the tertiary layer is in the middle part of the shell, ues (cf. Parkinson et al. 2005; Takayanagi et al. 2013; where L. neozelanica and G. vitreus recorded compar- Takizawa et al. 2017). The significant drop in δ13C atively lower trace element contents and higher δ13C values of 0.98 ‰ (ventral valve) and 0.93 ‰ (dorsal values, whereas in the anterior area, where the sec- valve) in the anterior area of L. uva may be the result ondary layer is dominant, higher concentrations of of primary layer contamination during sampling - a trace elements and lower δ13C values are observed. distinct possibility due the extreme thinness of the Similarly low δ13C values and high trace elements shell - or may be due to a metabolic effect. The de- concentrations (mainly Mg) are recorded also in the crease in 13C incorporation into shells at a mature age posterior umbonal area. This part represents a spe- has been reported in brachiopods (Yamamoto et al. cialized area of the shell, where cardinal structure 2010, 2013; Takayanagi et al. 2012, 2013; Takizawa et and muscle scars are present. As described by other al. 2017) and bivalves (Lorrain et al. 2004; Freitas et studies (e.g., Parkinson et al. 2005; Takizawa et al. al. 2005). As the organism grows and become older, 2017) specialized areas have generally low δ13C val- its metabolism increases while shell growth slows;
Geochemical analyses on brachiopods shells                                                353

so the amount of available metabolic CO2 increases,
while the amount needed for shell growth is reduced,
resulting in more metabolic carbon (12C enriched),
being incorporated into the shell (Lorrain et al. 2004).
Generally, in the two-layer shells, trace elements and
δ13C values show a more stable pattern throughout
the shell. With regards to trace element contents, dif-
ferent authors described different trends through the
shells especially focusing on Mg. Some authors (e.g.,
Takizawa et al. 2017; Ullmann et al. 2017) observed
an increase in their concentrations at the anterior
margin, whereas others noticed the opposite (e.g.,
Buening & Carlson 1992). As reported by Cusack
& Williams (2007) and Cusack et al. (2008), the Mg
distribution within the shell is not even and may have
unpredictable variations, and its concentration may
not only be linked to shell growth rate but may be in-
corporated in different ways in different ontogenetic
parts of the shell. Milner et al. (2017) showed that               Fig. 8 - Scanning electron microscope (SEM) image of microstruc-
                                                                            tural layers in L. uva. Image shows the primary layer calcite
trace elements varied in the different shell layers and                     intruding into the fibres of the secondary layer correspon-
explained this variation as possibly due to modifica-                       ding to the position of a growth lamella. This results in an
tions in the chemical composition of the biological                         uneven boundary transition between the primary and outer-
                                                                            most secondary layers in brachiopods, and possibly corre-
fluids during biomineralization.                                            sponds to isotope irregularities (cf. Yamamoto et al. 2010).
       A separate discussion is required for the                            PL: primary layer, SL: secondary layer.
two-layer shell of M. venosa (Fig. 3, Suppl. Fig. 1).
Trace elements display a pattern similar to that ob-
served in the other brachiopod species of this study,             imen analysed in this study is a juvenile specimen
of a slightly increasing trend from the umbo to the               (Fig. 3, 37 mm, Table 1), while the other (~70 mm,
anterior margin. In contrast, oxygen and carbon iso-              Table 1; Suppl. Fig. 1) and the one of Ullmann et al.
tope values show a peculiar behaviour. Their values               (2017) are mature ones. Comparing our stable iso-
remain quite stable up to the middle of the shell, then           tope trends with the ones of Ullmann et al. (2017),
they suddenly drop by up to 5 ‰ in both valves and                we noted the same significant drop in isotope val-
both isotopes (Fig. 3). A similarly perplexing trend is           ues in the first part of the shell (juvenile part) and
also observed in the carbon and oxygen isotopes of                latter part of the mature one, also in terms of ‰
a mature specimen of M. venosa with many plateaus                 variation (up to 4 ‰ for δ18O and up to 6 ‰ for
and negative isotope excursions, although less pro-               δ13C in Ullmann et al. 2017). However, Ullmann
nounced in terms of ‰ variations (Suppl. Fig. 1).                 et al. (2017) did not discuss in detail the observed
       A first explanation for this sudden shift to-              trend, pointing only to possible shell secretion in
wards lighter isotopic values may be contamination                disequilibrium with ambient seawater. It may be hy-
with the primary layer material. This is a possibility,           pothesised that this behaviour is species-specific, or
although, we strictly followed the cleaning protocol              it may be related to specific environmental pertur-
of Zaky et al. (2015). Incorporation of some minute               bations which characterise the environment of M.
amounts of powder from the primary layer – pos-                   venosa. According to Försterra et al. (2008), large ac-
sibly entrapped inside the growth lamellae (Fig. 8) -             cumulations of M. venosa were found in Comau and
may not cause the significant variations in both δ18O             Reñihué fjords (42° to 43° South, southern Chile),
and δ13C values because of the large difference in                areas characterised by a high productivity especially
mass between the two layers. Similar negative iso-                in summer and deep-water upwelling. Shifts in near-
tope excursions were also recorded by Ullmann et                  shore productivity and higher temperatures linked
al. (2017; their Fig. 6) in their mature specimen of              to the El Niño-Southern Oscillation (ENSO), oc-
M. venosa from the South American shelf. The spec-                curring on interannual and decadal timescales, have
354 Romanin M., Crippa G., Ye F., Brand U., Bitner M. A., Gaspard D., Häussermann V. & Laudien J.
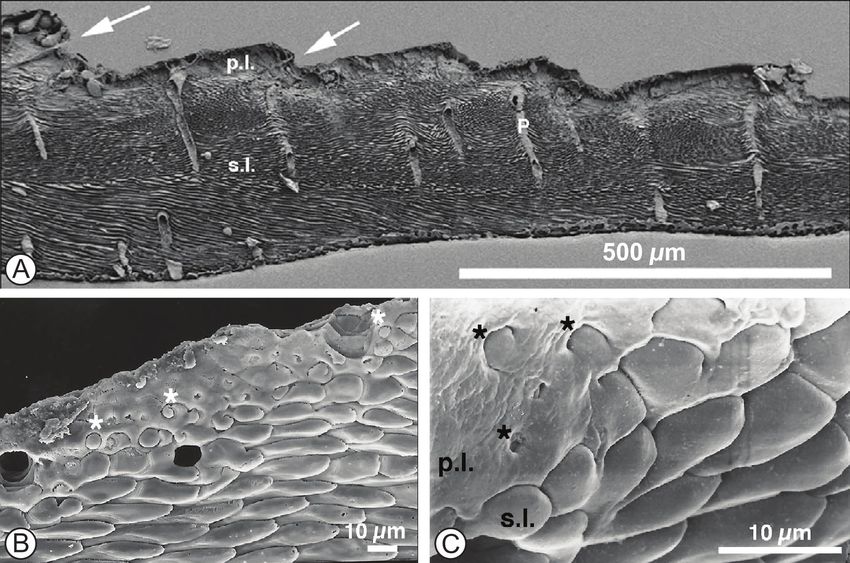
Fig. 9 - Scanning electron microscope (SEM) images of shell cross-sections showing microstructures in A. kerguelensis, G. vitreus and L. neoze-
lanica (arrows, modified after Gaspard & Nouet 2016). A) growth lamellae with primary layer calcite into fibres of the secondary layer
in A. kerguelensis, B) transitional contact between the primary and secondary layers in G. vitreus (white stars), C) transitional contact
between the primary and secondary layers in L. neozelanica (black stars). The tertiary layer is not represented in the images. Note: p.l. -
primary layer, s.l. - secondary layer, p - punctae.
been observed along the Chilean coast (e.g. Ulloa et fjord shoreline was documented for 2012 (Försterra
al. 2001; Takesue et al. 2004), possibly affecting the et al. 2014), probably after an intense algae bloom.
geochemical signatures recorded by the brachiopod Mayr et al. (2014) showed that primary production
shells. Furthermore, effects on benthic organisms in Comau fjord has doubled during the last two dec-
of the Patagonian fjord region were observed dur- ades. The developments in Comau Fjord also may
ing the intense development of anthropogenic ac- have caused a deviation of the geochemical signa-
tivities (aquaculture, shellfish harvesting) over the tures with respect to shell parts precipitated under
past two decades (Buschmann et al. 2006; Mayr et undisturbed conditions. However, for the evaluation
al. 2014; Försterra et al. 2014, 2016). In 2003, three of the different possibilities and to better understand
small salmon farms were operating in Comau Fjord, the causes of the drop, more specimens of M. venosa
whereas in 2017, 23 very large farms were actively need to be analysed.
using their concessions (Häussermann, pers. ob-
servation). For example, a significant depletion of Which is the best or optimal part of the
mussels, gorgonians, large deepwater sea anemones, shell for geochemical analysis?
calcifying ectoprocts, and decapods was observed, Independent-sample t-tests performed on
probably caused by eutrophication and increased trace elements and stable isotopes recorded by the
sedimentation and/or the increase of event-based specimens, highlight that there is no significant dif-
adding of chemical substances during the salmonid ference between dorsal and ventral valves, with the
farming process (Häussermann et al. 2013). Cor- exception of the Mg concentration in L. uva (Ta-
al mass mortality along a 14 km stretch of Comau bles 2, 3). This is in agreement with previous stud-Geochemical analyses on brachiopods shells 355
ies which found no difference in the geochemistry external part of the secondary layer may have been
(Parkinson et al. 2005; Brand et al. 2015) and in the secreted in disequilibrium with the ambient seawa-
morphometry of the fibres of the secondary layer ter (e.g., Auclair et al. 2003; Parkinson et al. 2005;
(Ye et al. 2018) between ventral and dorsal valves. Cusack et al. 2012; Takizawa et al. 2017). According
This means that for terebratulids, which possess to Cusack et al. (2012) only the innermost fibres of
valves with similar shell layer succession and general the secondary layer of mature specimens should be
shape, both ventral and dorsal valves can be used included in proxy calculations of seawater temper-
for geochemical analyses. However, this may not be ature. The calcitic fibres produced early in ontog-
the case for the other brachiopod taxa in the fossil eny are likely to be isotopically light, thus resulting
record. Representatives of Palaeozoic orders such in higher/warmer calculated seawater temperatures.
as the Productida have valves strongly different in Furthermore, in fossil brachiopods, the outer-
terms of shape and microstructure (i.e., species of most and innermost part (outer rims) of the whole
the genus Gigantoproductus; Angiolini et al. 2012; No- shell may be more prone to diagenetic alteration as
lan et al. 2017) and thus record a different primary testified by Figure 10. Carboniferous brachiopods
geochemical signature. Also, they may undergo dif- from England (Stephenson et al. 2010), analysed by
ferent degrees of diagenetic alteration which in turn cathodoluminescence, show a highly luminescent in-
control their ultimate geochemical record (Garbelli nermost shell rim (Fig. 10). In fact, the outermost
et al. 2014). and innermost parts of shells, as well as the posteri-
Here, we proved that, not only the posterior or and particularly the thinner anterior regions, may
(umbonal) area and primary layer of the shell have be more directly affected by diagenetic fluids, and
to be avoided as previously mentioned by several au- thus be the first to be altered.
thors (e.g., Carpenter & Lohmann 1995; Brand et al. Therefore, it is recommended to focus sam-
2003; Parkinson et al. 2005; Griesshaber et al. 2007; pling for geochemical analysis, both in recent and
Pérez-Huerta et al. 2008), but care has to be taken fossil specimens, to the middle part of the shell of
also when using the anterior part of the shell for ge- both valves, avoiding the posterior and anterior re-
ochemical analyses. In fact, significant geochemical gions as well as the outermost and innermost parts,
differences have been found between the different and potentially other areas (cf. Casella et al. 2018).
areas of the shells in nearly all geochemical signa-
tures (trace elements and carbon isotopes) of the
five studied brachiopod species. δ18O values seem to Summary and Conclusions
remain generally stable throughout the overall shell,
whereas both two- and three-layer shell successions In this study, we analysed the trace element
exhibit greater stability in their trace element and contents (Mg, Sr, Na) and stable isotope composi-
carbon isotope records in the middle of the shells. tions (δ18O, δ13C) of five recent brachiopod species
This is in agreement with observations by Butler (M. venosa, L. uva, A. kerguelensis, L. neozelanica and G.
et al. (2015), who documented a certain stability in vitreus) collected from different latitudes and differ-
the δ18O values recorded along the growth axis in ent environments (Chile, Antarctica, Indian Ocean,
their specimens of L. neozelanica and Terebratulina re- New Zealand and Italy). Three-layer shells of L.
tusa. These results are also supported by the study neozelanica and G. vitreus show characteristic trends
of Takizawa et al. (2017), which showed that the in- (i.e., normal and reverse U-shaped trend) in their
trashell and intraspecific δ18O and δ13C variations of geochemical signatures compared to that of the
the middle part of the shell were small compared two-layer shells of L. uva and A. kerguelensis, mainly
to those in the anterior and posterior sections. This due to the different incorporation of trace elements
suggests that this portion provides reliable results and different carbon isotope fractionation, in the
for palaeoenvironmental investigations. Besides re- secondary and tertiary layers. Among the two-layer
moval of the out of disequilibrium primary layer, shells, M. venosa shows a sudden change in stable iso-
the outermost part of the secondary layer should topes at mid-shell length in both juvenile and mature
be chemically etched to avoid possible contamina- specimens. Further studies are necessary to confirm
tion by the intrusion of the primary layer in corre- our findings and adequately evaluate the causes for
spondence of growth lamellae (Figs 8, 9). Also, the the observed geochemical profiles.356 Romanin M., Crippa G., Ye F., Brand U., Bitner M. A., Gaspard D., Häussermann V. & Laudien J.
Fig. 10 - Primary and diagenetic features in fossil brachiopods. Transmitted light (A, C) and cathodoluminescence (B, D) photomicrographs.
Note that in both specimens the innermost and outermost rims of the shell luminesce due to recrystallization and incorporation of
manganese in the calcite of the shell (Brand & Veizer 1980). The outer shell may reflect the readily altered primary layer, whereas the
innermost part reflects a zone of the secondary/tertiary layer more prone to diagenetic alteration; a layer in direct contact with diage-
netic fluids circulating through the sediment column (cf. Casella et al. 2018). A, B: Antiquatonia hindi; C, D: Skelidorygma sp., Yoredale
cyclothems, Serpukhovian, Carboniferous, NE England (Stephenson et al. 2010). Ext: external part of valve; int: internal part of valve.
The results of the analyses undertaken on in pristine fossil brachiopods oxygen isotopes can
shells of both groups led us to observe that data be considered good proxies of palaeoenvironmental
obtained from geochemical and isotope analyses and palaeoclimatic conditions. Diagenesis can ob-
performed on the posterior and anterior areas of scure the original signal, but it can be easily screened
shells should be interpreted with care, as the in- (e.g. Angiolini et al. 2009; Brand et al. 2011; Crippa
corporation of trace elements and stable isotopes et al. 2016b). Although diagenesis may reset primary
in these regions may be controlled and affected by values, it may preserve their cyclicity or trend of var-
the organism metabolism. Also for fossil specimens, iation (Angiolini et al. 2012).
the outermost and innermost parts of the shells, as In addition to proper cleaning and sample
well as the posterior and anterior region, should be preparation procedures, for both recent and fossil
avoided as they may be the first parts to be diage- brachiopod specimens, it is also very important to
netically altered, yielding erroneous results. Of note define 1) the microstructure and shell succession,
is the trend observed in δ18O values in nearly all the and 2) the best part of the shell where to safely per-
species, which remain quite stable throughout the form geochemical and isotope analyses. The middle
shells, being less affected by the microstructure or region of the shell, which represents the most stable
the organism’s metabolism and being thus a most part from a geochemical and isotopic point of view,
reliable tool for (palaeo)climatic reconstructions. So should be used for analyses.Geochemical analyses on brachiopods shells 357
Acknowledgements: This project was supported by the Europe-
ment. Petrol., 51: 987-997.
an Union’s Horizon 2020 research and innovation programme ETN-
BASE-LiNE Earth “Brachiopods As SEnsitive tracers of gLobal
Brand U., Logan A., Hiller N. & Richardson J. (2003) - Ge-
mariNe Environment: Insights from alkaline, alkaline Earth metal, ochemistry of modern brachiopods: applications and
and metalloid trace element ratios and isotope systems” under the implications for oceanography and paleoceanography.
Marie Skłodowska-Curie grant agreement No 643084. U. Brand was Chem. Geol., 198: 305-334.
supported by Natural Science and Engineering Research Council of Brand U., Logan A., Bitner M.A., Griesshaber E., Azmy K. &
Canada Discovery grant #7961-2015. We thank Lucia Angiolini for Buhl D. (2011) - What is the ideal proxy of Palaeozoic
constructive discussion and comments on a first draft of the man- seawater chemistry? Assoc. Australas. Paleontol. Mem., 41:
uscript, and Elizabeth Harper, Giovanna Della Porta and an anony- 9-24.
mous reviewer for their constructive reviews. We thank Mike Lozon Brand U., Azmy K., Bitner M.A., Logan A., Zuschin M., Came
(Brock University) for drafting the figures, and Elena Ferrari (Univer- R. & Ruggiero E. (2013) - Oxygen isotopes and MgCO3
sity of Milan) for technical support with stable isotope analyses. D.
in brachiopod calcite and a new paleotemperature equa-
Gaspard thanks the Curator of the recent brachiopod collection at
the MNHN, Paris who provided the material of the MD 30 Cruise
tion. Chem. Geol., 359: 23-31.
for study. This is publication nr. 156 of the Huinay Scientific Field Brand U., Azmy K., Griesshaber E., Bitner M.A., Logan A.,
Station. Zuschin M., Ruggiero E. & Colin P.L. (2015) - Carbon
isotope composition in modern brachiopod calcite: a
References case of equilibrium with seawater? Chem. Geol., 411: 81-
96.
Buening N. & Carlson S.J. (1992) - Geochemical investigation
of growth in selected recent articulate brachiopods.
Angiolini L., Darbyshire D.P.F., Stephenson M.H., Leng M.J., Lethaia, 25: 331-345.
Brewer T.S., Berra F. & Jadoul F. (2008) - Lower Permi- Buschmann A.H., Riquelme V.A., Hernández-González M.C.,
an brachiopods from Oman: their potential as climatic Varela D., Jiménez J.E., Henríquez L.A., Vergara P.A.,
proxies. Earth. Env. Sci. T. R. So., 98: 327-344. Guíñez R. & Filún L. (2006) - A review of the impacts
Angiolini L., Jadoul F., Leng M.J., Stephenson M.H., Rusht- of salmon farming on marine coastal ecosystems in the
on J., Chenery S. & Crippa G. (2009) - How cold were southeast Pacific. ICES J. Marine Sci., 63: 1338-1345.
the Early Permian glacial tropics? Testing sea-surface Butler S., Bailey T., Lear C.H., Curry G.B., Cherns L. & Mc-
temperature using the oxygen isotope composition of Donald I. (2015) - The Mg/Ca temperature relationship
rigorously screened brachiopod shells. J. Geol. Soc., 166 in brachiopod shells: calibrating a potential palaeosea-
(5): 933-945. sonality proxy. Chem. Geol., 397: 106-117.
Angiolini L., Stephenson M., Leng M.J., Jadoul F., Millward Came R.E., Eiler J.M., Veizer J., Azmy K., Brand U. & Weid-
D., Aldridge A., Andrews J., Chenery S. & Williams G. man C.R. (2007) - Coupling of surface temperatures and
(2012) - Heterogeneity, cyclicity and diagenesis in a Mis- atmospheric CO2 concentrations during the Palaeozoic
sissippian brachiopod shell of palaeoequatorial Britain. era. Nature, 449: 198-202.
Terra Nova, 24: 16-26. Carpenter S.J. & Lohmann K.C. (1995) - δ18O and δ13C values
Auclair A.C., Joachimski M.M. & Lécuyer C. (2003) - Deci- of modern brachiopod shells. Geochim. Cosmochim. Acta,
phering kinetic, metabolic and environmental controls 59 (18): 3749-3764.
on stable isotopic fractionations between seawater and Casella L., Griesshaber E., Simonet Roda M., Ziegler A.,
the shell of Terebratalia transversa (Brachiopoda). Chem. Mavromatis V., Henkel D., Laudien J., Häussermann V.,
Geol., 202: 59-78. Neuser R.D., Angiolini L., Dietzel M., Eisenhauer A.,
Azmy K., Brand U., Sylvester P., Gleson S.A., Logan A. & Bit- Immenhauser A., Brand U. & Schmahl W.W. (2018) -
ner M.A. (2011) - Biogenic and abiogenic low-Mg calcite Micro- and nanostructures reflect the degree of diage-
(bLMC and aLMC): evaluation of seawater-REE com- netic alteration in modern and fossil brachiopod shell
position, water masses and carbonate diagenesis. Chem. calcite: a multi-analytical screening approach (CL, FE-
Geol., 280: 180-190. SEM, AFM, EBSD). Palaeogeogr., Palaeoclimatol., Palae-
Bajnai D., Fiebig J., Tomasovych A., Milner Garcia S., Rol- oecol., in press.
lion-Bard C., Raddatz J., Löffler N., Primo-Ramos C. & Crippa G., Ye F., Malinverno C. & Rizzi A. (2016a) - Which is
Brand U. (2018) - Assessing kinetic fractionation in bra- the best method to prepare invertebrate shells for SEM
chiopod calcite using clumped isotopes. Scientific Reports, analysis? Testing different techniques on recent and fos-
8: 1-12. sil brachiopods. Boll. Soc. Paleontol. Ital., 55: 111-125.
Brand U. (2004) - Carbon, oxygen and strontium isotopes in Crippa G., Angiolini L., Bottini C., Erba E., Felletti F., Friger-
Paleozoic carbonate components: an evaluation of orig- io C., Hennissen J.A.I., Leng M.J., Petrizzo M.R., Raffi
inal seawater-chemistry proxies. Chem. Geol., 204: 23-44. I., Raineri G. & Stephenson M.H. (2016b) - Seasonality
Brand U. & Veizer J. (1980) - Chemical diagenesis of a multi- fluctuations recorded in fossil bivalves during the early
component carbonate system: 1, trace elements. J. Sedi- Pleistocene: Implications for climate change. Palaeogeogr.,
ment. Petrol., 50: 1219-1236. Palaeoclimatol., Palaeoecol., 446, 234-251.
Brand U. & Veizer J. (1981) - Chemical diagenesis of a multi- Curry G.B. & Brunton C.H.C. (2007) - Stratigraphic distri-
component carbonate system: 2, stable isotopes. J. Sedi- bution of brachiopods. In: Selden P.A. (Ed.) - TreatiseYou can also read