Cracking the problem of neural representations of abstract words: grounding word meanings in language itself - bioRxiv
←
→
Page content transcription
If your browser does not render page correctly, please read the page content below
August 13, 2018
This is a preprint that has not undergone peer review yet.

Cracking the problem of neural representations of abstract words:
grounding word meanings in language itself
Annika Hultén1, 2* , Marijn van Vliet1 , Lotta Lammi1 , Sasa Kivisaari1 , Tiina Lindh-Knuutila1 , Ali Faisal1 , and Riitta Salmelin1
1 Department of Neuroscience and Biomedical Engineering, Aalto University, Finland
2 Aalto NeuroImaging, Aalto University, Finland
* Corresponding author: annika.hulten@aalto.fi

                                                                   Abstract
               In order to describe how humans represent meaning in the brain, one must be able to account for
               not just concrete words but, critically, also abstract words which lack a physical referent. Hebbian
               formalism and optimization are basic principles of brain function, and they provide an appealing
               approach for modeling word meanings based on word co-occurrences. Here, we built a model of the
               semantic space based on word statistics in a large text corpus, which was able to decode items from
               brain signals. In the model, word abstractness emerged from the statistical regularities of the language
               environment. This salient property of the model co-varied, at 280–420 ms after word presentation,
               with activity in the left-hemisphere frontal, anterior temporal and superior parietal cortex that have
               been linked with processing of abstract words. In light of these results, we propose that the neural
               encoding of word meanings is importantly grounded in language through statistical regularities.

               Keywords: MEG, abstract concepts, concreteness, word processing, semantics, machine learning, RSA

Introduction                                                                optimization [7, 8]. If we further assume that a large text corpus is
                                                                            a fair estimate of the natural language environment that our brains
Understanding abstract and concrete concepts is a fundamental as-           are immersed in, a statistical model of a text corpus could serve
pect of human language that enables us to discuss matters ranging           as a reasonable approximation of the organizational principles of
from everyday objects to fantastic stories of fiction. A common             word meanings also at the level of the brain. In this framework,
view is that word meanings are grounded in experiences with the             statistical regularities in the language environment are mirrored in
world [1–4]. For example, the word ‘tomato’ is linked with the look,        the semantic space of the brain, and neural representations of both
feel and taste of a tomato. This view of lexical semantics assert           abstract and concrete words are thus formed by the same general
that these types of physical associations form the building blocks          computational principles.
of how words are encoded in the brain. However, the grounding                  Systematic patterns in the language environment can give rise
framework fails to account for abstract words, which lack physical          to qualitative differences in the way concrete and abstract words
referents and, in many cases an emotion or an internal state to which       are represented or processed, even if those word types share the
the word meaning can be grounded. This issue can be overcome,               same organizational principles. Behaviorally, concrete words elicit
if word meanings can also be grounded in the experience of lan-             faster reaction times than abstract words [9]. Patient data suggest
guage. In this conceptualization, representations of both concrete          a double dissociation between abstract and concrete word types as
and abstract words will mirror, not merely physical, but any regu-          either one may be selectively impaired [10, 11]. Furthermore, nu-
larities in the environment. We address this question starting from         merous neuroimaging studies have shown that processing of abstract
the framework of statistical self-organization of the semantic space        and concrete words activate brain areas differently [12]. Gener-
and aim to demonstrate that both concrete and abstract words can            ally, processing of abstract words (nouns in particular) activates
be represented in the brain based on their statistical properties that      classical language areas, such as the inferior frontal gyrus and the
emerge directly from natural language.                                      middle/superior temporal gyrus, more strongly than processing of
   Computational models of in the field of natural language process-        concrete words. In contrast, concrete words seem to activate the pos-
ing (NLP) have demonstrated that a distributed representation of            terior cingulate, precuneus, fusiform gyrus, and parahippocampal
word meanings can be derived from the context in which the words            gyrus more strongly than abstract words (ibid). Electrophysiologi-
are used. The core idea of these models is to find an optimal decom-        cal evidence reports stronger and longer-lasting neural response for
position of semantics that can represent each unique concept without        concrete than abstract words at around 400 ms after word onset [13,
excessive use of memory or processing effort. Statistical regularities      14].
in the training data (typically a large text corpus) will drive the orga-      Here we will show that it is possible to explain cortical activation
nization of the semantic space, wherein categorical structures, such        to a wide selection of abstract and concrete words using a model
as that of abstract and concrete words, can emerge [5]. These mod-          derived only from the statistical relationships among words in our
els rely on the same general computational principles that underlie         natural language, without summoning qualitative differences in the
brain function, namely Hebbian learning [6] and basic principles of         acquisition of the words. A conceptually straightforward and com-

                                                                                                                                     page 1 of 11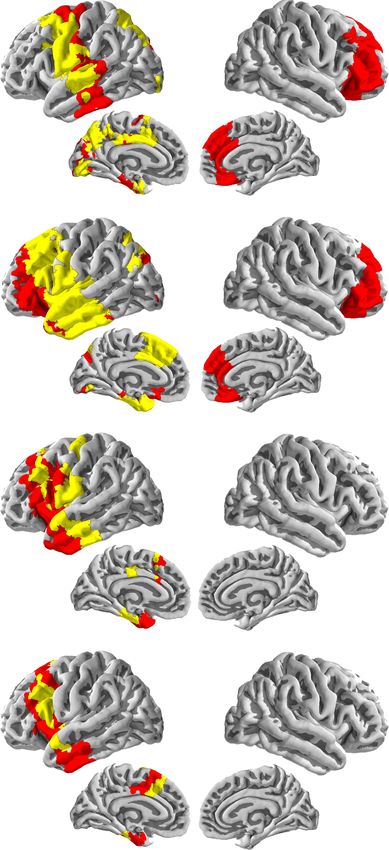
a b
police ideology logic
saw prisoner teacher democracy dominance
factory library freedom
sense
prison will
king artwork
priest church museum soldier play_(theater)
army book internet proof
temple fate history
benefit
phenomenon
castle music experience
tower bridge song poem speech background
park youth knowledge
merit meaning
Animal reputation
island
Body part rock road
beauty
money
attachment
estimate river
nature marking
mountain
Nature
Object sea referee change
duck lion
wave eagle team investment
Building cloud hunt problem
Human charac.
magic break amount
nest wind evening wolf game
Medium Abstract drill ring morning car child
size
age timing price
inflation
eruption
bear
Highly Abstract
apparence cat power friction
ball sheep dog weight pressure
finger lips bacteria
spoon back nose toe mouse
comb foot mouth horse gene oxygen
eye hand infection
ear
scissors
doctor
shovel
Figure 1: Self-organizing map of the Statistical model. The map is modeled on the surface of a toroid (A), with a continuous network of the
nodes. For visualization, the toroid is “cut” and unfolded into a two-dimensional sheet (B). The size of the each word denotes the distance to
the node center (the larger the font, the closer to the node center the word lies) and the color the predefined class of the stimulus words. The
grouping of the words in a SOM should be interpreted based on the size of the clusters and the relationship between a particular grouping and
other groups. The exact position of a word on a SOM visualization is generally not informative.
putationally explicit model is used to describe emergent categorical (e.g., music, song, poem) indeed appear to be situated between the
organization and the way in which the meaning of words can be concrete and highly abstract words in the Statistical model. The
represented in the brain. We focus on the emergent properties that map also shows that the organizational principle of the concrete
arise through self-organization (self-organizing map [15], SOM) in words does not strictly align with the six a priori defined taxonomic
an artificial neural network model of the language environment [16], categories. For example, the words in the Human character category
and use magnetoencephalography (MEG) to examine whether this (e.g., police, prisoner) are interleaved with words classified as be-
structure is mirrored in brain activity during word reading. longing to Building (e.g., prison) in a manner that seems to capture a
thematic association. Only the taxonomic categories Body parts and
Results Objects appeared as clearly distinct groups in the Statistical model.
The Statistical model of word meanings was built by applying the To determine whether the information in the Statistical model is
Word2vec algorithm to a large text corpus of the Finnish internet. mirrored in the brain activity during word reading, the activation
The algorithm was developed in the field of natural language pro- evoked by each word was measured with MEG from 20 volunteer
cessing [16, 17], and it bases its notion of semantic similarity on the participants. The participants read the words, which were presented
principle that two words are similar if they occur within a similar one at the time in a random order and repeated 20 times each over
linguistic context, even if they never directly co-occur. Word2vec the course of the experiment. Evoked responses were formed by
will discover thematic relationships (bear – zoo), i.e., concepts that averaging the neural response across the 20 presentations of each
either serve complementary roles or that co-occur in common situa- stimulus word, for epochs starting −200 ms before word onset until
tions, locations and/or times, but do not necessarily share perceptual 1000 ms after it.
or functional characteristics [18, 19].
An item-level decoding algorithm [21] was used to evaluate how
In order to assess the internal structure and emergent proper- well the corpus-derived Statistical model serves as a model of brain-
ties of the Statistical model, we visualized the relationships among level organization of word representations. This supervised machine-
118 MEG stimulus words (59 abstract and 59 concrete nouns) us- learning model tries to find an optimal linear mapping between the
ing an unsupervised SOM [15, 20]. This method provides a two- MEG data (204 sensors × 40 time bins) for each stimulus word
dimensional representation of the distances from each word to all and the corresponding feature decomposition of the word from the
other words in the semantic model. Statistical model [22]. The success of the machine-learning model is
The SOM visualization of the corpus-derived Statistical model evaluated using a leave-two-out cross-validation scheme, i.e., asking
(see Figure 1) revealed a clear division between abstract and concrete the model to distinguish between two words that it had not previously
words. The abstract words (e.g., freedom, ideology, democracy) encountered (116 words used to train the model, 2 words left out
group together and are distinct from the concrete words (e.g., cas- for testing, all permutations). The left-out words were successfully
tle, tower, bridge). Notably, the words rated as medium abstract discriminated in the majority of participants (15/20 participants),
page 2 of 11Item-level decoding accuracy (%) this information is related to the abstractness dimension, as shown
100
by the high correlation between the Abstractness model and the
Statistical model (Mantel test with Spearman’s ρ = 0.3, p < 0.001;
80 5000 permutations used). However, the RSA cannot distinguish if
the strength of brain activity is larger at one end of the spectrum (e.g.,
whether abstract words elicit greater brain activation than concrete
significance
60 threshold
or vice versa).
The earliest neural response that was significantly correlated
with the Statistical model was observed in the left precentral gyrus
40 (280 ms to 340 ms), with activation subsequently extending across
large parts of the frontal cortex, including the left inferior frontal
gyrus (320 ms to 420 ms) and medial superior frontal cortex (320 ms
20 to 360 ms). Activity patterns in the left temporal cortex were also
significantly correlated with the Statistical model; first in the middle
part of the superior temporal cortex (280 ms to 340 ms), followed by
0 the medial (300 ms to 240 ms; 380 ms to 420 ms) and lateral parts
Group
performance Individual subjects (320 ms to 420 ms) of the anterior temporal lobe.
There was substantial overlap between the Statistical model RSA
Figure 2: Item-level decoding accuracy. The box plot on the left shows
and the Abstractness model RSA starting from the inferior precentral
the quartiles and the variation in the group performance (percent of gyrus (300 ms and superior middle temporal cortex. In a later time
successful decoding across all item-set permutations). On the right window, the overlap between the two RSA analyses in frontal lobe
are the individual scores of each participant. The accuracy scores extended to the inferior, middle, superior and medial regions (320 ms
above 60 % were deemed statistically significantly above the chance to 400 ms). The Statistical model RSA additionally found correlation
Figure
level based on a permutation test. 2. in the left precuneus and superior parietal cortex (280 ms to 340 ms)
that partially overlapped with correlations in these areas found in
the Abstractness model RSA.
with a mean prediction accuracy across all participants at 63.6 % The only areas highlighted uniquely by the Statistical model
(s.d. 7.5) and a top score of 77.8 % (Figure 2). The adjusted chance RSA throughout the timeline were found in the right frontal cortex
level was determined statistically to be 60.1 % (p < 0.05). The algo- (280 ms to 340 ms). Activity in the left posterior temporal cortex and
rithm was thus able to find a mapping between the brain data and the temporo-parietal junction (280 ms to 380 ms) was only significantly
Statistical model, which implies that the information encoded in the correlated with the Abstractness model.
Statistical model is correlated with the information in the brain sig-
nal. A breakdown of the item pairs used in the evaluation showed no Discussion
between-category advantage compared to within-category compar- We showed that abstract and concrete words self-organize into dis-
isons, indicating that the decoding accuracy was not merely driven by tinct groups based on their occurrence in different sentential contexts.
the categorical structure of the stimulus words (see Supplementary Notably, this categorical organization principle emerges through
Figure S1). basic principles of association and optimization of the statistical
We proceeded to investigate when and where the information information present in the language environment. The alignment
expressed in the Statistical model is manifested in brain activation of words rated as medium abstract between the concrete and ab-
by using representational similarity analysis [23] (RSA) between stract words in the semantic space suggests the abstract-concrete
the MEG data and the semantic decompositions provided by the distinction is a continuum.
Statistical model (Figure 3A). The RSA aims to discover time bins The statistical properties of word meanings derived though co-
and cortical regions where the variation in the source estimate of the occurrences in the text corpus were successfully used to decode the
MEG signal is similar to the variation in the model. To determine identity of written words based on their MEG responses, thereby
associations that are consistent across the 20 participants, the signif- showing that a statistical model of semantics can be used to explain
icance of the RSA maps was evaluated using a cluster permutation the organization of word meanings in the brain. The main correla-
test [24]. tions between brain activity and the Statistical model were found in
Based on the SOM analysis, the dominant organizational principle the left precentral, frontal and anterior temporal cortex as well as in
of the Statistical model is the abstractness-concreteness dimension. superior and medial parietal areas. We interpret the findings in light
Therefore, to guide the interpretation of the RSA between the MEG of the complementary model that expresses the level of abstractness,
data and the Statistical model (henceforth, Statistical model RSA), focusing on the brain areas revealed by both the Statistical model
we additionally calculated a complementary RSA between the MEG RSA and the Abstractness model RSA.
data and a model used to quantify only the abstractness – concrete- The overlap discovered between the Statistical model RSA and
ness dimension based on independently collected questionnaire data Abstractness model RSA is in line with the common finding that
(see Methods; henceforth, Abstractness model RSA). The question- processing of abstract words (nouns in particular) activates classi-
naire data (Abstractness model) clearly dissociated between con- cal language areas, such as the inferior frontal gyrus and the mid-
crete, medium abstract and highly abstract words (see dissimilarity dle/superior temporal gyrus, more strongly than processing of con-
matrices in Figure 3B). The spatio-temporal overlap between the crete words (for a meta-analysis, see [12]). The left inferior frontal
Statistical model RSA and Abstractness model RSA (Figure 3A) sug- gyrus in particular, has been highlighted as an especially informative
gests that neural activity in the highlighted cortical regions contains area in decoding the abstract/concrete word class [25]. In the present
information incorporated in both model types. A large portion of study, overlap between the two RSA maps was observed both in the
page 3 of 11a. RSA maps
250–300 ms 250–300 ms
LEFT RIGHT
300–350 ms 300–350 ms
350–400 ms 350–400 ms
400–450 ms 400–450 ms
Statistical model RSA Abstractness model RSA
Overlap with Abstractness model RSA Overlap with Statistical model RSA
b. Dissimilarity matrices
Statistical model Abstractness model
Animal
Body part 1 5
Building
Human charac.
cosine distance
euclidean distance
Nature
Object
Medium Abstract
Highly Abstract
0 0
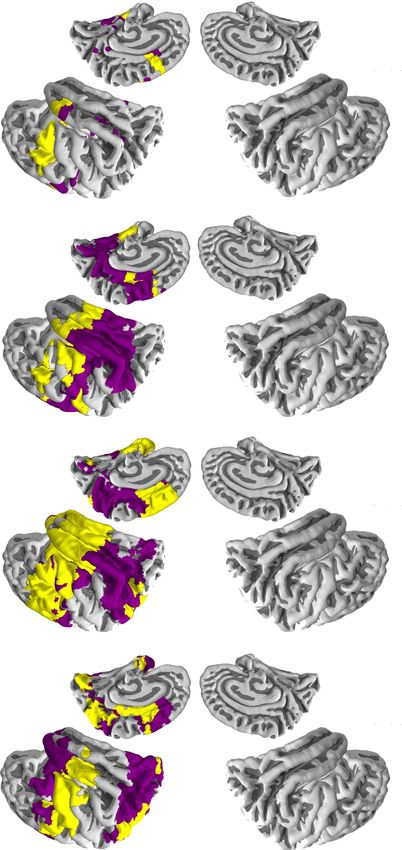
Figure 3: Comparison of the Statistical model and Abstractness model. (A) Representational similarity analysis (RSA) between the Statistical
model and the MEG data (red) on the left and between the Abstratcness model and the MEG data (purple) on the right. The overlap between
the two RSAs is plotted in yellow. The results show all regions and time windows with statistically significant findings. For visualization
purposes, the data was averaged over 50 ms time windows. (B) Dissimilarity matrices of the Statistical model and the Abstractness model.
page 4 of 11inferior/superior left frontal cortex (320 ms to 420 ms) and in the model RSA and the Abstractness model RSA, several areas were
superior temporal cortex (300 ms to 340 ms). In previous studies, uniquely highlighted by only one of the models. This suggests
more activity for abstract and concrete words in these areas was that the Statistical model does not capture all aspects of the abstract-
interpreted to reflect greater engagement of the verbal system for concrete dimension (or these aspects may remain below the statistical
processing of abstract concepts [12]. It is therefore not surprising significance threshold). Similarly, while the Word2vec model is
that the information processed in this classical language area mir- a well-argued model of item-level semantics, alternative models
rors both the statistically derived categorical structure and especially such as those based on behavioral feature descriptions may provide
the abstract-concrete dimension. The present RSA findings further complementary views to the semantic system.
suggest that the adjacent superior and medial parts of the frontal The present study provides a computationally explicit framework
cortex are also able to capture the abstractness dimension of word of how semantic representations can be expressed in the brain, in
meanings. the form of a statistical model that uses computational principles
The present RSA results also identified areas that in previous known to exist in the brain. We were able to link specific cortical
studies have shown stronger activation to concrete than abstract areas to semantic representations but also to describe the type of
words [12] or displayed strong linkage to item-specific semantics information that could be processed there and how it may have come
of concrete words [26], namely the posterior cingulate, precuneus, about. We show that a statistical model is sufficient to explain a
fusiform gyrus, and parahippocampal gyrus. In previous studies, substantial part (i.e., enough to enable successful encoding) of the
increased activation for concrete words has often been interpreted in semantic processing. This suggests that the experience of language
terms of grounding conceptual information to the perceptual system, can be seen as equivalent to any other sensory, motor, emotional or
particularly in the ventral or dorsal visual processing streams [12, perceptual experience. Abstract words could, therefore, be grounded
27]. The present findings show that the patterns of activation in in language itself, making second order grounding through, e.g.,
these areas is also correlated with the Statistical model derived from metaphors redundant.
corpus data.
Furthermore, the Statistical model RSA and Abstractness model Methods
RSA both revealed semantic encoding in the lateral and medial parts Participants
of the anterior temporal lobe at 320 ms to 420 ms (including ventro- MEG measurements were performed on 20 volunteers (mean age 21 years,
medial regions). The anterior temporal cortex is well-known for its sd 3.6, range 18–34; 50 % identified themselves as females). All participants
role in both semantic dementia [28] and associative semantics [29]. were native Finnish speakers, had normal or corrected to normal vision, and
In light of the associative nature of the statistical semantic model, were scored as highly right-handed on the Edinburgh handedness question-
naire. The participants were all healthy, reported no diagnosed neurological
the present results support the notion that this region is in some
disorders or reading disabilities and were compensated financially for their
manner also linked with processing of word meanings through their
participation. Informed consent was obtained from all participants. In
associative properties to other words. addition, a total of 408 respondents filled behavioral questionnaires, created
A prominent overlap between the Statistical model RSA and Ab- either for stimulus evaluation or to collect the behavioral feature sets (see
stractness model RSA was additionally observed in the left precentral more information below). All the respondents were volunteers who were
cortex (300 ms to 340 ms). This region has previously been linked reimbursed for the effort with movie tickets. All respondents had Finnish
to category-specific semantic activation related to body parts and as their first language, their mean age was 27 years (sd 7, range 19–63) and
shape [30]. Here we show that the activity pattern in this region also 65 % identified themselves as females.
aligns with the abstract-concrete structure in the Statistical model. The study was approved by the Aalto University Research Ethics Com-
Self-organization of the semantic space provides an account for mittee in agreement with the Declaration of Helsinki.
how differences along the abstract-concrete dimension can arise. As- Stimuli
suming that the neural representations of word meanings arise from The stimuli consisted of 118 nouns grouped into two main categories:
similar computational principles as the ones that govern the Statisti- concrete (59 words) and abstract (59 words). The two main categories did
cal model, words that co-occur in the environment will also share not differ significantly in lemma frequency [t(58) = −1.1, p = 0.28], based
some aspects of their neural representation. This could lead to cate- on the prevalence in Finnish-language internet pages (corpus size 1.5 billion
words). All words were within the 90th percentile of the corpus distribution
gorical groupings and thus explain the categorical differences that
and can thus be considered common, high frequent words. The length of
have been found in previous experimental and clinical studies [12].
the stimulus words ranged from 3 to 10 letters and did not differ between
Most of the cortical areas discovered in the RSA analyses align the abstract and concrete words [t(58) = −1.9, p = 0.065].
with classical language areas, outside of the primary motor or sen- All stimulus words were assessed on a scale from 1 to 7 on the level of
sory areas. This suggests that the abstractness dimension is more concreteness, estimated age of acquisition (AoA), imageability, concrete-
than a mere reflection of direct sensory-motor associations, put ness, emotionality and valence, in a web-based behavioral questionnaire.
forward by some advocates of the embodied cognition view [1, The assessment was done by thirteen naïve respondents that did not partake
2]. This finding would explain why previous attempts at decod- in any other part of the present study. The concrete words were judged as
ing abstract words based on sensory-motor attributes have been very concrete [mean rating: 6.5 (sd 0.5)]. The abstract category contained
unsuccessful [31] whereas even a crude nominal categorical classi- 30 highly-abstract words [mean concreteness: 2.0 (sd 0.9), mean imageabil-
fication of the abstractness dimension seems to work [25]. When ity: 2.3 (sd 1.0)] and 29 medium-abstract words [mean concreteness: 3.9 (sd
0.7); mean imageability: 4.1 (sd 0.8)]. Previous studies that highly imagin-
using a more detailed description of the semantic space, such as the
able word tend to be acquired earlier than words with low imageability [33].
present corpus-derived Statistical model, we were able to decode
Also in the present stimulus set the estimated AoA for concrete words [mean
MEG signals of individually presented written words; the written rating 1.2 (sd 0.3)] was significantly lower [t(58) = −9.2, p < 0.001] as
modality has previously proven to be challenging even in categorical compared to abstract words [mean rating 2.1 (sd 0.6)]. There was no differ-
classification of concrete words [32]. ence in valence between the word categories [t(58) = 1.20, p = 9.23].
The choice of semantic model used to describe the semantic The concrete words were sub-grouped according to categories that have
space matters. Despite the marked overlap between the Statistical been derived from specific impairments following brain damage [34–36],
page 5 of 11namely Animal (e.g., dog, bear), Body part (e.g., hand, foot), Building and behind the ears. The head position was measured at the beginning of
(e.g., brigde, hospital), Human character (e.g., child, princess), Nature (e.g., each 20 minute segment of the recording session. The position of the coils,
island, fire), and Object (e.g., hammer, ball). Each category contained as well as approx. 60 additional points along the surface of the head, were
10 items, with the exception of the Human character category that only determined in a coordinate system spanned by three anatomical landmarks
contained 9 items. The full list of the stimuli is reported in Supplementary (the left and right preauricular points and the nasion) using a 3D Polhemus
Table S1. digitizer (Polhemus, Colchester, VT). The MEG data was co-registered
Corpus-derived Statistical model of semantics to the anatomical MR images based on the anatomical landmarks and the
The corpus-derived Statistical model was created using a continuous skip- additional data points.
gram Word2vec-algorithm [16, 17] which looks for co-occurrences between Anatomical MR images were scanned on a separate day using a 3T
a particular word and the neighboring words (i.e., linguistic context) and MAGNETOM Skyra scanner (Siemens Healthcare, Erlangen, Germany), a
represents this information as a N-dimensional vector. The model was standard 20-channel head-neck coil and a T1-weighted MP-RAGE sequence.
trained on a corpus based on a large sample of internet sites in Finnish MEG data analysis
(1.5 billion words) with negative sampling to approximate the conditional The MEG data were preprocessed by aligning head positions from the dif-
log-likelihood of the model [37]. In the resulting vector space, words that ferent data segments and different days into one head position and removing
share a similar linguistic context are located close to each other. Here, the external noise sources using the spatiotemporal signal space separation
vector length used was 300, and a context window of 10 words before and method [38] in the Elekta Maxfilter software package. Artefactual signals
after the stimulus word was used to capture the co-occurrences. due to eye blinks were suppressed using a PCA approach where 1–2 main
In order to ensure that the SOM visualization of the corpus-derived components of the average MEG response to blinks were removed from the
Statistical model set on the 118 stimulus words reflects the general statistical raw data.
properties of the corpus data we trained an alternative version of the self- Event-related epochs were extracted from the gradiometer data from
organizing map on all the nouns in the corpus with a frequency > 50 but 200 ms before to 1000 ms after each word onset and averaged across the
excluded the 118 stimulus words. We then compared the internal structure multiple presentations of the same item. The event-related responses were
of this model to that of the 118-word Statistical model by comparing the baseline-corrected to the interval from -200 ms until the word onset and
location of the projected stimulus words in the SOM structure (see details low-pass filtered at 25 Hz. Any trials where the signal exceeded 3000 fT/cm
of the SOM analysis below). The general abstract–concrete dichotomy was were removed (max. 1 trial per word).
also visible in the visualization based on the much larger vocabulary, but Source-level estimates were computed using Minimum Norm Estimates
the taxonomic class structure was less salient. The results of this control (MNE) [39–41] constrained to the cortical surface. The volume conduction
analysis are depicted and described in further detail in the Supplementary model was based on the individual structural MRIs using the Freesurfer
Information. software package [42, 43] and modeled as a single-compartment bound-
SOM analysis ary element model with an icosahedron mesh of 2562 vertices in each
We used a self-organizing map [15, 20] (SOM) to evaluate how the differ- hemisphere for each participant.
ent word categories are clustered in the Statistical model. A SOM is an In the inverse solution, currents tangential to the cortical surface were
unsupervised artificial neural network, which produces a two dimensional favored by setting the loose orientation constraint parameter to 0.3, and
discretized representation of the data; here the respective semantic feature depth-weighting was used to reduce the bias towards superficial sources [44].
sets. The topography for the SOM was a toroidal grid with 72 nodes (lin- The source estimate regularization parameter lambda was set to 0.1. A
early initialized) that is best visualized as a two-dimensional rectangular noise-covariance matrix based on the baseline period across all stimuli was
lattice (9 × 8) where the nodes on opposite edges are connected. With these used for noise normalizing of the source estimates, resulting in dynamical
parameters, the topographic error (0.02) and quantization error (2.2) were statistical parametric maps (dSPMs) [44]. Lastly, the individual source
small, meaning that the map adequately captures the continuity of the input estimates were morphed onto FreeSurfer’s average template brain.
space with sufficient resolution.
Zero-shot decoding
Experimental design In order to determine whether the Statistical model of the semantic space is
During the MEG recording the stimulus words were presented in a black a good description of the neural responses during word reading, we used a
mono spaced font (Courier New) on a grey background. Each word was zero-shot decoding machine learning algorithm [21], which was evaluated
presented for 150 ms followed by a blank screen for 950 ms Between trials, using a leave-two-out discrimination task.
a fixation cross was presented for 1000 ms Each word was presented a total The zero-shot algorithm was used to learn a linear mapping between the
of 20 times, over the course of two one-hour long MEG sessions that took sensor-level MEG evoked responses and the Statistical model. To reduce
place on separate days. The sessions included breaks of a few minutes every the dimensionality of the input data, the MEG responses were downsampled
20 minutes. The order of the stimulus words was randomly determined for by creating 20-ms bins within the time window 0–800 ms relative to the
each day, so that each stimulus was repeated 10 times each day but words onset of the stimulus presentation, resulting in 40 bins. For each of the 118
were never repeated back to back. stimulus words, the averaged signals for each bin at each of the 204 sensor
In order ensure the compliance of the participants, 10 % of the trials locations (only the gradiometers were used for decoding) were concatenated
were followed by a catch trial, during which the end part of a sentence was into a single vector, yielding a (118 × 8160) input matrix. Ridge regression
presented on the screen and the subject was instructed to determine if the was used to create a linear mapping between the input matrix and target
preceding word would make sense as the first word of this sentence. For matrix, i.e., the Statistical model (118 × 300) [45]. The columns of both
example, the word ‘beauty’ might be followed by the phrase ‘. . . is in the the input and target matrices were z-transformed before being entered into
eyes of the beholder’ in which case the correct answer would be ‘yes’ as the linear regression.
the phrase ‘beauty is in the eyes of the beholder’ is a reasonable sentence. The resulting mapping was evaluated by attempting to match two previ-
MEG and MR measurements ously unseen segments of MEG data with two unseen stimulus words. To
MEG was measured using a whole-head Vectorview MEG device (Elekta do this, the zero-shot approach employs two steps. First, the algorithm uses
Oy, Helsinki, Finland) with 102 triplet sensor elements, each containing the learned mapping between the MEG- data and the individual features to
two planar gradiometers and one magnetometer. The data was filtered at translate the two MEG segments into two predicted feature vectors. The
0 Hz to 3 Hz sampled at 1000 Hz. Eye movements and blinks were recorded identity of the two unseen stimulus words is then determined by comparing
using an electro-oculogram (EOG), configured as pairs of electrodes placed the cosine distance between the predicted vectors and the original Statistical
vertically and horizontally around the eyes. The head position with respect model vectors for these items [22]. This binary discrimination task is carried
to the scanner was determined by four indicator coils placed on the forehead out for all possible pairs of two stimulus words, using the remaining 116
page 6 of 11words for training. For each participant, we report the mean accuracy across from the authors; the data is not publicly available as it contains information
all word pairs, which ranges between 50 % (algorithm fails to distinguish that could compromise the participant privacy and consent.
between words) and 100 % (successful discrimination between all stimulus
words). Acknowledgements
To test whether the obtained accuracy scores were significantly higher We would like to express our gratitude to Jenna Kanerva and Filip Ginter at
than chance level, the zero-shot classification procedure was repeated 1000 the University of Turku for development of the Finnish language Word2vec
times on randomly permuted data. Random data was produced by choosing model as well as to Enrico Glerean and Gus Sudre for sharing code used
the data of one subject at random and randomizing the assignment between in the study. This research was funded by the Academy of Finland (grant
the word labels and the MEG data segments. As p-value, we report the #287474 to A.H., #286070 to S. L. K., #310988 to MvV, and #255349,
percentage of accuracy scores for the random permutations that equaled or #256459 and #283071 to R.S.), the Aalto Brain Center (MvV and T.L-K.)
exceeded the accuracy score obtained on real data. as well as the Sigrid Jusélius Foundation (R.S.). Computational resources
RSA analysis were provided by the Aalto Science-IT project and the CSC - IT center for
Representational similarity analysis (RSA) [23] was performed between science Ltd..
the source localized MEG data and Statistical model. For the Statistical
References
model, a single word-to-word dissimilarity matrix (DSM) was created by
computing the Pearson correlation r across the feature vectors for each [1] J. R. Binder, L. L. Conant, C. J. Humphries, L. Fernandino, S. B.
possible word pair, and using (1 − r) as the dissimilarity score. The values Simons, M. Aguilar, and R. H. Desai. “Toward a brain-based com-
along the diagonal (the dissimilarity between a word and itself) were set to ponential semantic representation.” In: Cognitive Neuropsychology
zero. (2016), pp. 1–45. doi: 10.1080/02643294.2016.1147426.
The MEG data underwent the same downsampling and z-transformation [2] M. Kiefer and F. Pulvermüller. “Conceptual representations in mind
procedure used for the zero-shot learning. Then, for each subject, time and brain: theoretical developments, current evidence and future
bin and source-level vertex, a word-to-word DSM was formed using a directions.” In: Cortex 48.7 (2012), pp. 805–25. doi: 10.1016/j.
searchlight approach: the signal at all vertices within a 3 cm radius of the cortex.2011.04.006.
vertex under consideration were assembled into a vector. These vectors were
[3] A. Martin. “The representation of object concepts in the brain.” In:
then compared for all possible combinations of two words using Pearson
Annu. Rev. Psychol. 58 (2007), pp. 25–45. doi: 10.1146/annurev.
correlation, with (1 − r) as dissimilarity score.
psych.57.102904.190143.
The RSA maps for each subject and each feature set were obtained
by comparing the MEG-based DSMs with the feature-set DSMs using [4] G. Vigliocco and D. P. Vinson. “Semantic Representation.” In: The
Spearman rank correlation. Finally, the RSA maps were analyzed across Oxford handbook of psycholinguistics, ed. by M. G. Gaskell. Oxford
subjects using a cluster permutation test [24] with a cluster threshold of University Press, 2009, pp. 195–217.
p = 0.01 and the significance threshold for the permuted randomly shuffled [5] G. Hollis and C. Westbury. “The principals of meaning: Extracting
data distribution set to p = 0.05. The number of permutations used to semantic dimensions from co-occurrence models of semantics.” In:
create the random distribution of the data was 5000. Any clusters with a Psychon. Bull. Rev. 23.6 (2016), pp. 1744–1756. doi: 10.3758/
corresponding cluster-t-value that was lower than 95 % of the randomly s13423-016-1053-2.
obtained cluster-t-values were pruned from the RSA maps. The remaining [6] Donald O. Hebb. The organization of behavior. New York: Wiley,
clusters were deemed significant (p ≤ 0.05). 1949.
To aid the interpretation of the main RSA, an additional RSA was cal-
culated between the MEG data and a separate model quantifying only the [7] K. Friston. “The history of the future of the Bayesian brain.” In:
abstract – concrete dimension (Abstractness model; see below). This addi- Neuroimage 62.2 (2012), pp. 1230–3. doi: 10.1016/j.neuroimage.
tional RSA was computed in the same manner as the main RSA between the 2011.10.004.
MEG data and the Statistical model, with the exception that the Euclidean [8] George Zipf. Human Behavior and the Principle of Least Effort: An
distance was used as the distance metric in the word-to-word DSM of the Introduction to Human Ecology. Addison-Wesley Press, 1949.
one-dimensional Abstractness model. [9] Carlton T. James. “The role of semantic information in lexical de-
Abstractness model cisions.” In: J. Exp. Psychol. Hum. Percept. Perform. 1.2 (1975),
In the RSA analysis, the main results were interpreted in light of a comple- p. 130.
mentary RSA between the MEG data and an Abstractness model capturing [10] Jamie Reilly, Jonathan E. Peelle, and Murray Grossman. “A uni-
the abstract–concrete dimension of the stimulus words (Abstractness model tary semantics account of reverse concreteness effects in semantic
RSA). The Abstractness model was derived from a behavioral web-based dementia.” In: Brain. Lang. 103.1 (2007), pp. 86–87.
questionnaire answered by 10 naïve respondents (that did not take part of
[11] E. K. Warrington. “The selective impairment of semantic mem-
the stimulus assessment questionnaire). Each respondent judged the 118
ory.” In: Q J Exp Psychol 27.4 (1975), pp. 635–57. doi: 10.1080/
stimulus words with respect to six different taxonomic categories (Animal,
14640747508400525.
Body part, Building, Human character, Nature, Object) and abstractness
on a scale from 1–7 (1 = does not belong to this category, 7 = a typical [12] J. Wang, J. A. Conder, D. N. Blitzer, and S. V. Shinkareva. “Neural
example to this category). From this data set, we extracted the abstractness representation of abstract and concrete concepts: a meta-analysis
scale to be used as an Abstractness model. of neuroimaging studies.” In: Hum. Brain Mapp. 31.10 (2010),
pp. 1459–68. doi: 10.1002/hbm.20950.
Data and code availability
The text corpus containing 1.5 billion Finnish words used to derive the [13] Phillip J. Holcomb, John Kounios, Jane E. Anderson, and W. Caro-
statistical model cannot be publicly distributed due to the Finnish copyright line West. “Dual-coding, context-availability, and concreteness ef-
law limitations. It is available upon request for research purposed, for contact fects in sentence comprehension: An electrophysiological investiga-
information see http://bionlp.utu.fi/finnish-internet-parsebank.html. tion.” In: J. Exp. Psychol. Learn. Mem. Cogn. 25.3 (1999), pp. 721–
The word2vec models used in this study (derived from the abovementioned 742.
corpus), together with the custom code used in the study can be accessed [14] Hsu-Wen Huang, Chia-Lin Lee, and Kara D. Federmeier. “Imagine
from https://version.aalto.fi/gitlab/BrainDecode/zeroshotdecoding. that! ERPs provide evidence for distinct hemispheric contributions
The stimulus words are publicly available and listed in the supplementary to the processing of concrete and abstract concepts.” In: Neuroimage
information. The MEG and MRI data are available upon reasonable requests 49.1 (2010), pp. 1116–1123.
page 7 of 11[15] Teuvo Kohonen. “Self-organized formation of topologically correct [31] Leonardo Fernandino, Colin J. Humphries, Mark S. Seidenberg,
feature maps.” In: Biol. Cybern. 43.1 (1982), pp. 59–69. William L. Gross, Lisa L. Conant, and Jeffrey R. Binder. “Predicting
[16] Tomas Mikolov, Wen-tau Yih, and Geoffrey Zweig. “Linguistic brain activation patterns associated with individual lexical concepts
regularities in continuous space word representations.” In: Human based on five sensory-motor attributes.” In: Neuropsychologia 76
Language Technologies. Proceedings of the 2013 conference of (2015), pp. 17–26.
the North American chapter of the association for computational [32] I. Simanova, P. Hagoort, R. Oostenveld, and M. A. van Gerven.
linguistics. 2013, pp. 746–751. “Modality-independent decoding of semantic information from the
[17] Tomas Mikolov, Kai Chen, Greg Corrado, and Jeffrey Dean. “Effi- human brain.” In: Cereb. Cortex 24.2 (2014), pp. 426–34. doi: 10.
cient estimation of word representations in vector space.” In: arXiv 1093/cercor/bhs324.
preprint arXiv:1301.3781 (2013). [33] H. Stadthagen-Gonzalez and C. J. Davis. “The Bristol norms for age
[18] Simon De Deyne, Steven Verheyen, and Gert Storms. “Structure of acquisition, imageability, and familiarity.” In: Behav Res Methods
and organization of the mental lexicon: A network approach derived 38.4 (2006), pp. 598–605.
from syntactic dependency relations and word associations.” In: [34] Elizabeth K. Warrington and Tim Shallice. “Category specific se-
Towards a theoretical framework for analyzing complex linguistic mantic impairments.” In: Brain 107.3 (1984), pp. 829–853.
networks. Springer, 2016, pp. 47–79. [35] Alfonso Caramazza and Jennifer R. Shelton. “Domain-specific
[19] Emilie L. Lin and Gregory L. Murphy. “Thematic relations in adults’ knowledge systems in the brain: The animate-inanimate distinction.”
concepts.” In: J. Exp. Psychol. Gen. 130.1 (2001), p. 3. In: J. Cogn. Neurosci. 10.1 (1998), pp. 1–34.
[20] Timo Honkela, Ville Pulkki, and Teuvo Kohonen. “Contextual rela- [36] Giuseppe Sartori, Michele Miozzo, and Remo Job. “Category-
tions of words in Grimm tales analyzed by self-organizing map.” In: specific naming impairments? Yes.” In: The Quarterly Journal of
Proceedings of the International Conference on Artificial Neural Experimental Psychology Section A 46.3 (1993), pp. 489–504.
Networks (ICANN-95). Vol. 2. EC2 et Cie Paris, 1995, pp. 3–7. [37] Jenna Kanerva, Juhani Luotolahti, Veronika Laippala, and Filip
[21] Mark Palatucci, Dean Pomerleau, Geoffrey E. Hinton, and Tom Ginter. “Syntactic N-gram collection from a large-scale corpus of
M. Mitchell. “Zero-shot learning with semantic output codes.” In: internet Finnish.” In: Frontiers in Artificial Intelligence and Applica-
Advances in neural information processing systems. 2009, pp. 1410– tions. Vol. 268. IOS Press, 2014, pp. 184–191. isbn: 1-61499-442-0.
1418. doi: 10.3233/978-1-61499-442-8-184.
[22] G. Sudre, D. Pomerleau, M. Palatucci, L. Wehbe, A. Fyshe, R. [38] S. Taulu and J. Simola. “Spatiotemporal signal space separation
Salmelin, and T. Mitchell. “Tracking neural coding of perceptual and method for rejecting nearby interference in MEG measurements.”
semantic features of concrete nouns.” In: Neuroimage 62.1 (2012), In: Phys. Med. Biol. 51.7 (2006), pp. 1759–68. doi: 10.1088/0031-
pp. 451–63. doi: 10.1016/j.neuroimage.2012.04.048. 9155/51/7/008.
[23] Nikolaus Kriegeskorte, Marieke Mur, and Peter A. Bandettini. “Rep- [39] A. Gramfort, M. Luessi, E. Larson, D. A. Engemann, D. Strohmeier,
resentational similarity analysis-connecting the branches of systems C. Brodbeck, R. Goj, M. Jas, T. Brooks, L. Parkkonen, and M.
neuroscience.” In: Front. Syst. Neurosci. 2 (2008), p. 4. Hamalainen. “MEG and EEG data analysis with MNE-Python.” In:
[24] E. Maris and R. Oostenveld. “Nonparametric statistical testing Front. Neurosci. 7 (2013), p. 267. doi: 10.3389/fnins.2013.00267.
of EEG- and MEG-data.” In: J. Neurosci. Methods 164.1 (2007), [40] A. Gramfort, M. Luessi, E. Larson, D. A. Engemann, D. Strohmeier,
pp. 177–90. doi: 10.1016/j.jneumeth.2007.03.024. C. Brodbeck, L. Parkkonen, and M. S. Hamalainen. “MNE software
[25] Jing Wang, Laura B. Baucom, and Svetlana V. Shinkareva. “Decod- for processing MEG and EEG data.” In: Neuroimage 86 (2014),
ing abstract and concrete concept representations based on singlein- pp. 446–60. doi: 10.1016/j.neuroimage.2013.10.027.
validtrial fMRI data.” In: Hum. Brain Mapp. 34.5 (2013), pp. 1133– [41] M. S. Hämäläinen and R. J. Ilmoniemi. “Interpreting magnetic fields
1147. of the brain: minimum norm estimates.” In: Med. Biol. Eng. Comput.
[26] A. Clarke and L. K. Tyler. “Object-Specific Semantic Coding in 32.1 (1994), pp. 35–42.
Human Perirhinal Cortex.” English. In: J. Neurosci. 34.14 (2014), [42] A. M. Dale, B. Fischl, and M. I. Sereno. “Cortical surface-based anal-
pp. 4766–4775. doi: 10.1523/Jneurosci.2828-13.2014. ysis. I. Segmentation and surface reconstruction.” In: Neuroimage
[27] Jeffrey R. Binder, Chris F. Westbury, Kristen A. McKiernan, Ed- 9.2 (1999), pp. 179–94. doi: 10.1006/nimg.1998.0395.
ward T. Possing, and David A. Medler. “Distinct brain systems for [43] B. Fischl, A. Liu, and A. M. Dale. “Automated manifold surgery:
processing concrete and abstract concepts.” In: J. Cogn. Neurosci. constructing geometrically accurate and topologically correct mod-
17.6 (2005), pp. 905–917. els of the human cerebral cortex.” In: IEEE Trans. Med. Imaging.
[28] K. Patterson, P. J. Nestor, and T. T. Rogers. “Where do you know 20.1 (2001), pp. 70–80. doi: 10.1109/42.906426.
what you know? The representation of semantic knowledge in the [44] Anders M. Dale, Arthur K. Liu, Bruce R. Fischl, Randy L. Buckner,
human brain.” English. In: Nat. Rev. Neurosci. 8.12 (2007), pp. 976– John W. Belliveau, Jeffrey D. Lewine, and Eric Halgren. “Dynamic
987. doi: 10.1038/nrn2277. statistical parametric mapping: combining fMRI and MEG for high-
[29] C. J. Price. “A review and synthesis of the first 20 years of PET and resolution imaging of cortical activity.” In: Neuron 26.1 (2000),
fMRI studies of heard speech, spoken language and reading.” In: pp. 55–67.
Neuroimage 62.2 (2012), pp. 816–47. doi: 10.1016/j.neuroimage. [45] Fabian Pedregosa, Gaël Varoquaux, Alexandre Gramfort, Vincent
2012.04.062. Michel, Bertrand Thirion, Olivier Grisel, Mathieu Blondel, Peter
[30] F. Pulvermuller, F. Kherif, O. Hauk, B. Mohr, and I. Nimmo-Smith. Prettenhofer, Ron Weiss, and Vincent Dubourg. “Scikit-learn: Ma-
“Distributed cell assemblies for general lexical and category-specific chine learning in Python.” In: Journal of machine learning research
semantic processing as revealed by fMRI cluster analysis.” In: Hum. 12.Oct (2011), pp. 2825–2830.
Brain Mapp. 30.12 (2009), pp. 3837–50. doi: 10.1002/hbm.20811.
page 8 of 11Supplementary Information
Breakdown of decoding prediction
In order to understand if any underlying systematics in the stimulus selection was driving the performance of the zero-shot decoding
model, we looked at the pairwise comparisons in the leave-two-out cross validation scheme. Figure S1 shows the performance of each
combination of item-pairs averaged across all participants. As no clear categorical pattern emerges, we conclude that the prediction
accuracy is not driven by a specific category of the stimulus words.
play_(theater)
phenomenon
background
attachment
experience
democracy
dominance
expression
investment
knowledge
reputation
mountain
pressure
museum
art piece
meaning
estimate
infection
ideology
freedom
prisoner
scissors
morning
eruption
problem
bacteria
marking
evening
inflation
teacher
internet
amount
change
oxygen
speech
mouse
church
factory
temple
benefit
beauty
money
soldier
friction
history
shovel
weight
nature
mouth
bridge
doctor
sheep
prison
library
spoon
power
timing
magic
sense
castle
police
island
music
horse
finger
game
poem
break
judge
eagle
tower
priest
comb
youth
cloud
wave
proof
hand
army
team
gene
merit
nose
book
price
song
duck
back
child
wind
logic
bear
road
river
park
hunt
rock
nest
king
wolf
saw
size
dog
foot
ring
age
fate
eye
sea
Correct
lion
ball
drill
lips
ear
toe
car
will
cat
dog
horse
1
duck
eagle
cat
lion
mouse
bear
wolf
sheep
back
hand
eye
foot 0.9
ear
mouth
toe
finger
nose
lips
church
road
factory
castle
bridge
prison
tower 0.8
library
museum
temple
king
soldier
police
prisoner
priest
teacher
doctor
judge
child
wind 0.7
river
island
sea
park
mountain
rock
wave
cloud
nest
book
ball
saw
ring 0.6
scissors
drill
spoon
shovel
comb
car
morning
army
bacteria
oxygen
price
expression
evening 0.5
infection
internet
team
friction
size
song
game
attachment
nature
marking
hunt
music
play_(theater)
pressure
0.4
weight
speech
eruption
poem
background
art piece
proof
gene
ideology
timing
estimate
benefit
history
0.3
age
phenomenon
inflation
beauty
fate
experience
logic
reputation
merit
meaning
change
amount
youth
0.2
problem
freedom
money
democracy
investment
will
magic
break
power
knowledge
dominance
sense 0.1
False
Animal Building Nature Medium Abstract
Body part Human charac. Object Highly Abstract
Figure S1: Prediction accuracy for each stimulus-item pair, averaged across participants.
page 9 of 11SOM control analysis
In order to ensure that the SOM visualization of the corpus-derived Statistical model set (on 118 words) reflects the general statistical
properties of the corpus data, and is not dependent on the particular set of stimulus words used here, we trained a supplementary SOM on
a Corpus-wide statistical model. This model included all words with a frequency > 50 (N=319523 words), but omitted the 118 stimulus
words used in the MEG study. The SOM was trained using the same parameters as the main Statistical model SOM, i.e., on toroidal grid
with 72 nodes. For the Corpus-wide statistical model SOM the topographic error was 0.08 and the quantization error 2.8. The map was
evaluated by visualizing the location of the stimulus word in the model.
Similarly to the main Statistical model SOM (see Figure 1 in the main article) the abstract and concrete words largely formed distinct
groups also in the Corpus-wide statistical model SOM (Figure S2). Especially words classified as ‘Body part’ were clearly distinct from
the other word categories. Two nodes in the center of the map contained words from several taxonomic categories and included both
abstract and concrete words. These nodes seemed to be based on thematic relationships between the words.
doctor bacteria attachment
infection
oxygen mouse
weight pressure gene marking change
friction power
toe
foot ear timing internet price
mouth nose logic meaning estimate
lips hand finger amount benefit
problem knowledge
scissors comb inflation
drill
proof
money eruption
back size ideology nature
spoon will age phenomenon experience police
ball eye factory
shovel nest car sense background democracy child
cloud freedomspeech
dominance
fate hunt army
reputation investment
dog expression beauty youth history art piece
morning cat sheep break wolf book music
priest prisoner soldier church teacher
game wind horse beartemple tower
road prisonbridge park library
lion wave
mountain eagle island
rock
sea river
evening duck
magic merit king
ring play_(theater) castle museum saw
team
song
judge poem
Animal Building Nature Medium Abstract
Body part Human charac. Object Highly Abstract
Figure S2: Visualization of the stimulus words in a SOM trained on a Corpus-wide statistical model. The size of the each word denotes the
distance to the node center (the larger the font, the closer to the node center the word lies) and the color the predefined category class of the
stimulus words
page 10 of 11STIMULUS TRANSLATION CATEGORY STIMULUS TRANSLATION CATEGORY
koira dog Animal aamu morning Medium Abstract
hevonen horse Animal armeija army Medium Abstract
ankka duck Animal bakteeri bacteria Medium Abstract
kotka eagle Animal happi oxygen Medium Abstract
kissa cat Animal hinta price Medium Abstract
leijona lion Animal ilme expression Medium Abstract
hiiri mouse Animal ilta evening Medium Abstract
karhu bear Animal infektio infection Medium Abstract
susi wolf Animal internet internet Medium Abstract
lammas sheep Animal joukkue team Medium Abstract
selkä back Body part kitka friction Medium Abstract
käsi hand Body part koko size Medium Abstract
silmä eye Body part laulu song Medium Abstract
jalka foot Body part leikki game Medium Abstract
korva ear Body part liite attachment Medium Abstract
suu mouth Body part luonto nature Medium Abstract
varvas toe Body part merkintä marking Medium Abstract
sormi finger Body part metsästys hunt Medium Abstract
nenä nose Body part musiikki music Medium Abstract
huulet lips Body part näytelmä play (theater) Medium Abstract
kirkko church Building paine pressure Medium Abstract
tie road Building paino weight Medium Abstract
tehdas factory Building puhe speech Medium Abstract
linna castle Building purkaus eruption Medium Abstract
silta bridge Building runo poem Medium Abstract
vankila prison Building tausta background Medium Abstract
torni tower Building teos artwork Medium Abstract
kirjasto library Building todiste proof Medium Abstract
museo museum Building geeni gene Medium Abstract
temppeli temple Building aate ideology Highly Abstract
kuningas king Human character ajoitus timing Highly Abstract
sotilas soldier Human character arvio estimate Highly Abstract
poliisi police Human character etu benefit Highly Abstract
vanki prisoner Human character historia history Highly Abstract
pappi priest Human character ikä age Highly Abstract
opettaja teacher Human character ilmiö phenomenon Highly Abstract
lääkäri doctor Human character inflaatio inflation Highly Abstract
tuomari judge Human character kauneus beauty Highly Abstract
lapsi child Human character kohtalo fate Highly Abstract
tuli wind Nature kokemus experience Highly Abstract
joki river Nature logiikka logic Highly Abstract
saari island Nature maine reputation Highly Abstract
meri sea Nature meriitti merit Highly Abstract
puisto park Nature merkitys meaning Highly Abstract
vuori mountain Nature muutos change Highly Abstract
kallio rock Nature määrä amount Highly Abstract
aalto wave Nature nuoruus youth Highly Abstract
pilvi cloud Nature ongelma problem Highly Abstract
pesä nest Nature vapaus freedom Highly Abstract
kirja book Object raha money Highly Abstract
pallo ball Object demokratia democracy Highly Abstract
saha saw Object sijoitus investment Highly Abstract
sormus ring Object tahto will Highly Abstract
sakset scissors Object taika magic Highly Abstract
pora drill Object tauko break Highly Abstract
lusikka spoon Object teho power Highly Abstract
lapio shovel Object tieto knowledge Highly Abstract
kampa comb Object valta dominance Highly Abstract
auto car Object järki sense Highly Abstract
Table S1: Supplementary Table 1. Full list of stimuli
page 11 of 11You can also read