ELEVATED LEVELS OF MITOCHONDRIAL COQ10 INDUCE ROS MEDIATED APOPTOSIS IN PANCREATIC CANCER
←
→
Page content transcription
If your browser does not render page correctly, please read the page content below
www.nature.com/scientificreports
OPEN Elevated levels of mitochondrial
CoQ10 induce ROS‑mediated
apoptosis in pancreatic cancer
Tulin Dadali1,3, Anne R. Diers1,3, Shiva Kazerounian1, Senthil K. Muthuswamy2,
Pallavi Awate1, Ryan Ng1, Saie Mogre1, Carrie Spencer1, Katerina Krumova1,
Hannah E. Rockwell1, Justice McDaniel1, Emily Y. Chen1, Fei Gao1, Karl T. Diedrich1,
Vijetha Vemulapalli1, Leonardo O. Rodrigues1, Viatcheslav R. Akmaev1,
Khampaseuth Thapa1, Manuel Hidalgo2, Arindam Bose2, Vivek K. Vishnudas1,
A. James Moser2, Elder Granger1, Michael A. Kiebish1, Stephane Gesta1, Niven R. Narain1 &
Rangaprasad Sarangarajan1*
Reactive oxygen species (ROS) are implicated in triggering cell signalling events and pathways to
promote and maintain tumorigenicity. Chemotherapy and radiation can induce ROS to elicit cell
death allows for targeting ROS pathways for effective anti-cancer therapeutics. Coenzyme Q10 is
a critical cofactor in the electron transport chain with complex biological functions that extend
beyond mitochondrial respiration. This study demonstrates that delivery of oxidized Coenzyme Q10
(ubidecarenone) to increase mitochondrial Q-pool is associated with an increase in ROS generation,
effectuating anti-cancer effects in a pancreatic cancer model. Consequent activation of cell death
was observed in vitro in pancreatic cancer cells, and both human patient-derived organoids and
tumour xenografts. The study is a first to demonstrate the effectiveness of oxidized ubidecarenone
in targeting mitochondrial function resulting in an anti-cancer effect. Furthermore, these findings
support the clinical development of proprietary formulation, BPM31510, for treatment of cancers with
high ROS burden with potential sensitivity to ubidecarenone.
Dysregulated metabolism is considered a hallmark of cancer and is a consequence of adaptive responses to sup-
port unregulated proliferation. The Warburg Effect is one such adaptive response characterized by glycolysis
addiction for rapid non-mitochondrial ATP synthesis. This phenomenon further supports an increase in cancer
cell biosynthetic programs and maintenance of redox balance during uncontrolled proliferation1. A potential
advantage of aerobic glycolysis in cancer is the ability of cancer cells to reduce generation of mitochondrial
derived reactive oxygen species (ROS) to levels advantageous to support survival and proliferation. In fact,
strategies aimed at elevating ROS burden in cancer has been investigated as an attractive therapeutic approach
to elicit an anti-cancer e ffect2.
Coenzyme Q10 (CoQ10) is a key component of the mitochondrial electron transport chain (ETC)3 and plays
a critical role in mitochondrial redox potential and energy p roduction4. It is an ubiquitous molecule that exists
in all subcellular membranes and recently has been recognized to have more complex biological functions than
initially proposed5. In addition to its role in ETC function, C
oQ10 has phenolic antioxidant activity via its ability
to undergo hydrogen abstraction by free r adicals6. Paradoxically, C oQ10 also exhibits pro-oxidant activity that
occurs either due to a C oQ10 semiquinone r eaction5 or due to a reaction with oxygen when CoQ10 is in its oxi-
dized state7. In the mitochondria, 40–50% of CoQ10 lies in the inner membrane and exists in one of three states:
fully oxidized (ubiquinone, also known as Q or ubidecarenone), partially reduced (semiubiquinone), and fully
reduced (ubiquinol, CoQH2)8. In its fully oxidized state, CoQ10 accepts electrons from NADH-ubiquinone reduc-
tase (Complex I) and succinate-Q oxidoreductase (Complex II), and transfers them to Complex III. CoQ10 also
distributes electrons between various dehydrogenases, including mitochondrial glycerol 3-phosphate dehydro-
genase (mGPDH), electron-transferring flavoprotein (ETF:Q oxidoreductase, ETF:QOR), and dihydro-orotate
dehydrogenase (DHODH)8–10.
1
BERG LLC, 500 Old Connecticut Path, Bldg B, 3rd Floor, Framingham, MA 01710, USA. 2Department of Medicine,
Cancer Research Institute, Beth Israel Deaconess Medical Center, Harvard Medical School, Boston, MA 02215,
USA. 3These authors contributed equally: Tulin Dadali and Anne R. Diers. *email: Rangaprasad.Sarangarajan@
BergHealth.com
Scientific Reports | (2021) 11:5749 | https://doi.org/10.1038/s41598-021-84852-z 1
Vol.:(0123456789)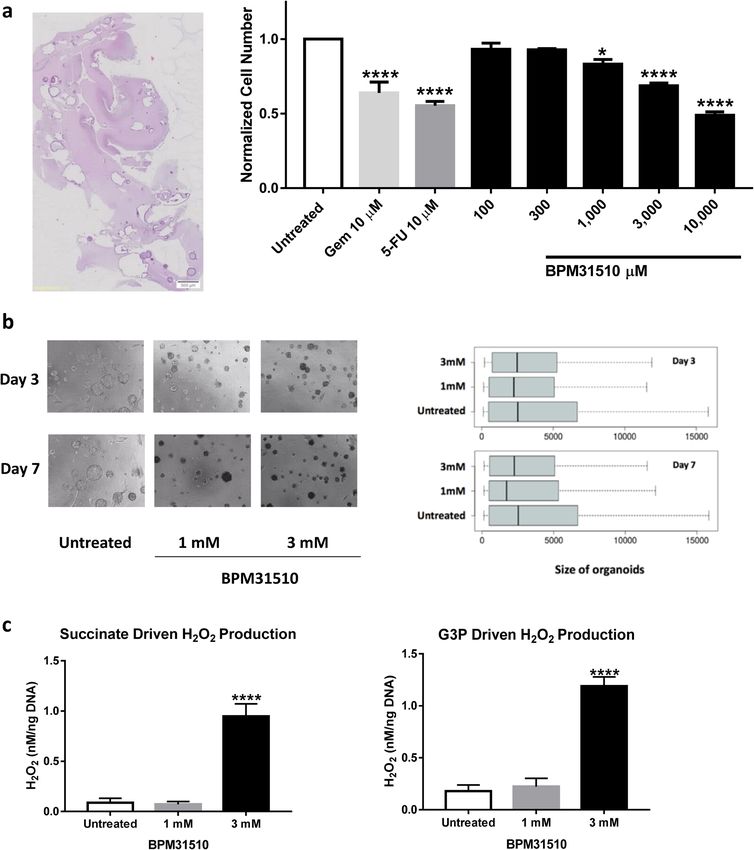
www.nature.com/scientificreports/
Moreover, studies using isolated mitochondria from rat skeletal muscle found that ROS production occurred
at 11 sites associated with substrate oxidation and oxidative p hosphorylation9. Five of the 11 substrates asso-
ciated with ROS production were connected to the Q pool, including substrates associated with DHODH,
ETF:QOR, mGPDH, and Complex II activity9. Under normal physiological conditions, substrates that feed
into mitochondrial Complexes I and II (site of CoQ10 binding and activity) produce low levels of ROS that are
essential for intracellular signalling9,11. Taken together, data support a central role for C oQ10 in mitochondrial
substrate utilization and generation of ROS; thus, increasing the ROS burden in cancer should be associated
with anti-cancer effect.
Although the biological benefits of CoQ10 including its anti-cancer potential has been recognized, its thera-
peutic utility has been hindered by (a) dearth in understanding the significance of anti-cancer potential of
oxidized CoQ10 and (b) formulation for delivery of oxidized CoQ10 to the target tissues and specifically to the
mitochondria. BPM31510 is a ubidecarenone-lipid conjugate nanodispersion optimized for delivery of supra-
physiologic concentrations of ubidecarenone in cells and tissues, preferentially to the mitochondria. At present,
BPM31510 is in clinical trials for solid tumours that exhibit a high glycolytic phenotype including pancreatic
cancer and glioma. Although clinical assessment of BPM31510 is underway, the effects of cellular delivery of
CoQ10 (via BPM31510) in intact cells and tissues has not yet been described. The goal of the study was to define
the mechanism by which supraphysiologic levels of C oQ10 regulate cell fate, particularly in a cancer model sys-
tem. Based on the established ability of CoQ10 in ROS generation, it was hypothesized that excess CoQ10 will
enhance mitochondrial ROS production and activate cell death in cancer cells. Pancreatic cancers are highly
glycolytic12 and serve as a good model system to test the hypothesis of the ability of CoQ10 to induce ROS and
activate apoptosis in eliciting an anticancer effect. Collectively, the role of CoQ10 in substrate utilization and
generation of ROS as well as the function of BPM31510 is a unique and novel therapeutic pathway to elicit an
anti-cancer effect in metabolically active tumors.
Results
Delivery of supraphysiologic levels of ubidecarenone via BPM31510 decreases oxygen con‑
sumption rates (OCR) in pancreatic cancer. Altering the dynamics of the Q pool and examining the
functional consequence of exogenous CoQ10 has been a challenge due to poor intracellular delivery. Thus, the
ability of BPM31510 to affect mitochondrial function as a consequence of CoQ10 accumulation in mitochondria
in pancreatic cancer model was assessed. BPM31510 treatment was associated with a decrease in oxygen con-
sumption rates in MIA PaCa-2 and PANC1 pancreatic cancer cell lines in a dose-dependent manner (Fig. 1a).
A formulation of BPM31510 consisting of a fluorescent analogue of C oQ10 was used to visualize the uptake and
mitochondrial localization in cancer cells using confocal microscopy. In the pancreatic cancer cell lines, fluores-
cent ubidecarenone accumulated in the mitochondria as indicated by its colocalization with the mitochondria
marker MitoTracker (Fig. 1b). CoQ10 accumulation occurred in a time-dependent manner: at 24 h, a > 100-fold
increase and at 48 h > 150-fold increase over endogenous levels was observed in MIA PaCa-2 and PANC1 cells
(Fig. 1c). Importantly, while CoQ10 was distributed within various cellular compartments, the greatest enrich-
ment was detected in the mitochondrial fractions (Supplemental Table 1). Together, the data demonstrate that
BPM31510 delivers supraphysiologic levels of C oQ10 into the mitochondrial Q-pool, and the increase in mito-
chondrial CoQ10 is associated with dose-dependent decrease in oxygen consumption rates.
Ubidecarenone selectively disrupts substrate‑dependent respiration in the mitochondria in
pancreatic cancer cells. Next, the effect of BPM31510 mediated increases in the mitochondrial Q pool
on specific substrate-driven respiration was assessed in MIA PaCa-2 and PANC1 cells. In these experiments, a
BPM31510 dose that resulted in a 50% decrease in OCR for each respective cell line (based on Fig. 1a) was used.
As expected, BPM31510 treatment at this dose induced a significant decrease in OCR (Fig. 2a), suggestive of
a disruption of the mitochondrial ETC function. Substrate specific respiration was characterized to determine
the site of ubidecarenone-induced disruption within the ETC. While we noted differential effects of BPM31510
between cell lines in pyruvate (Complex I)-driven respiration, BPM31510 significantly decreased succinate
(Complex II)-driven and mGPDH-driven respiration and had no effect on Complex IV-driven responses in
MIA PaCa-2 and PANC1 cells (Fig. 2b).
Previous research indicates that individual mitochondrial respiratory complexes are mutually linked, and
compensatory responses can be engaged to manage changes in substrate availability, metabolic flux, and ETC
component function to meet bioenergetic d emands13. Therefore, BPM31510-induced changes in succinate/
glycerol-3-phosphate-driven respiration were assessed to determine if it was sufficient to promote compensa-
tory respiratory responses. Oxygen consumption in response to treatment with respiratory complex inhibitors,
such as rotenone (Complex I), TTFA (Complex II), or iGP1 (mGPDH), to determine which sites supported
mitochondrial respiration were measured. Although MIA PaCa-2 and PANC1 cells exhibited different depend-
encies under basal conditions, both cell lines increased reliance on Complex I-dependent oxygen consumption
after BPM31510 treatment, with a smaller percentage of total oxygen consumption supported by Complex II
and mGPDH (Fig. 2c). Conjointly, these data indicate that supraphysiologic increases in mitochondrial CoQ10
levels by delivery of ubidecarenone alter mitochondrial respiration by impairing Q-pool dependent Complex
II–III-driven respiration.
Ubidecarenone enhances succinate‑dependent and glycerol‑3‑phosphate‑dependent ROS
generation, mitochondrial membrane depolarization, and regulated cell death. Impairments
to the mitochondrial ETC, in particular the loss of efficiency in electron transfer from Complex III or mGPDH
to oxygen (as reported above), can result in electron leakage and ROS g eneration10. If unresolved, ROS accu-
Scientific Reports | (2021) 11:5749 | https://doi.org/10.1038/s41598-021-84852-z 2
Vol:.(1234567890)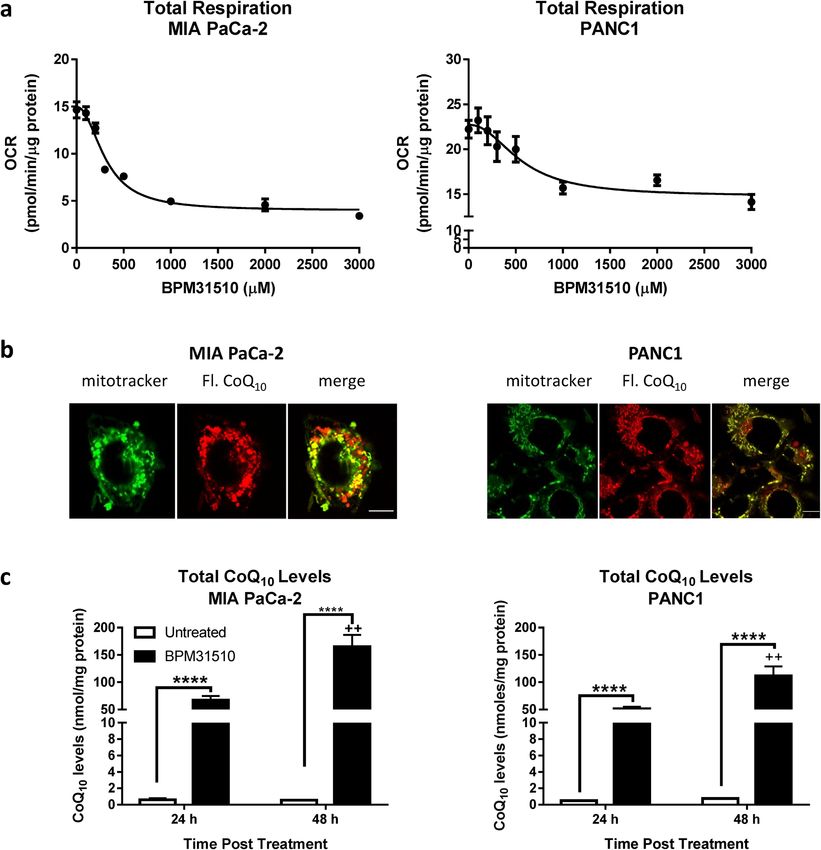
www.nature.com/scientificreports/
Figure 1. Delivery of CoQ10 into mitochondria by BPM31510 affects total respiration in MIA PaCa-2 and
PANC1. (a) Dose effect of BPM31510 on total respiration in MIA PaCa-2 and PANC1 cells. State 3 respiration
on pyruvate/malate + succinate + glycerol-3-phosphate of cells exposed to BPM31510 at 24 h. The data represent
the means ± SEM of three independent experiments with five replicates (n = 15). (b) Fluorescently tagged CoQ10
(red) from BPM31510 (200 μM) colocalized with the mitochondria (MitoTracker; green) in MIA PaCa-2 and
PANC1 cells after 24 h exposure. (c) BPM31510 treatment increased the total CoQ10 levels in MIA PaCa-2 and
PANC1 cells as measured by LC MS/MS after 24 h and 48 h exposures. The data represent the means + SEM
of total protein (nmol/mg) from six independent experiments. The data were analysed by Student’s t tests;
****=p < 0.0001 compared to untreated control; ++=p < 0.01 compared to the 24 h time point. The scale bar
present in each merged image represents 10 mM.
mulation promotes oxidative stress, cellular dysregulation, and subsequent cell death14. To examine whether
BPM31510-dependent impairment of substrate-driven respiration results in concomitant electron leakage and
ROS production, a method was established to measure substrate-dependent H2O2 production by initiating res-
piration with specific substrates and kinetically quantifying H2O2 production using Amplex Red reagent (Sup-
plemental Fig. 1). In both control and BPM31510-treated MIA PaCa-2 and PANC1 cells, pyruvate (Complex
Scientific Reports | (2021) 11:5749 | https://doi.org/10.1038/s41598-021-84852-z 3
Vol.:(0123456789)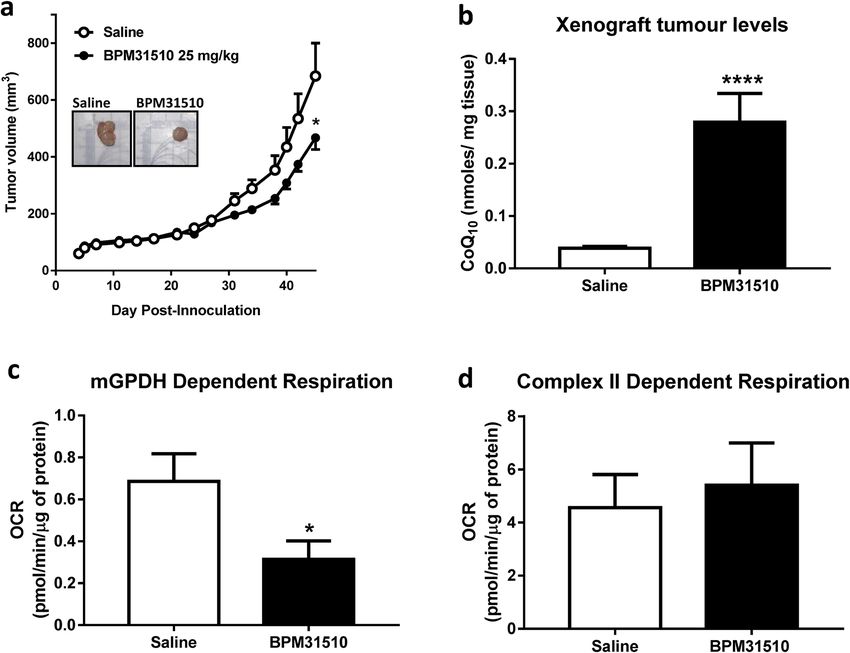
www.nature.com/scientificreports/

                                            Figure 2.  BPM31510 decreases Q-pool linked Complex II and mitochondrial glycerol-3-phosphate dependent
                                            respiration, resulting in shifts in respiratory dependency of specific mitochondrial complexes. (a) State 3
                                            respiration on pyruvate/malate + succinate + glycerol-3-phosphate in MIA PaCa-2 and PANC1 cells after
                                            BPM31510 treatment. (b) Effects of BPM31510 on electron transport chain complex (substrate-specific)
                                            respiration in MIA PaCa-2 and PANC1 cells. The data represent the means + SEM of three independent
                                            experiments. (c) BPM31510 shifts respiratory dependency in MIA PaCa-2 and PANC1 cells. Complex-specific
                                            respiration was assessed as described in the Methods section. The data report the percentage of total respiration.
                                            The data represent the means + SEM of three independent experiments. The data were analysed by Student’s
                                            t-tests; ***p < 0.001 compared to untreated cells.

          Scientific Reports |   (2021) 11:5749 |                https://doi.org/10.1038/s41598-021-84852-z                                                  4

Vol:.(1234567890)
www.nature.com/scientificreports/
Figure 3. BPM31510 induces oxidative stress via generation of mitochondrial reactive oxygen species (ROS)
in MIA PaCa-2 and PANC1 cells. (a) Mitochondrial H 2O2 generation during complex I, complex II and
GPDH-driven respiration in cells were after treatment with BPM31510 (EC50) for 24 h. The data represent the
means + SEM of three independent experiments. The data were analysed by Student’s t test; ***p < 0.001 and
****p < 0.0001 compared to untreated. UD = undetected (b) Oxidation of multiple redox probes, indicative of
oxidative stress, in MIA PaCa-2 and PANC1 cells after treatment with BPM31510 ( EC50) for 24 h. The data
represent the means + SEM of three independent experiments and report the fold change in mean fluorescence
intensity (MFI) normalized to untreated controls. The data were analysed by Student’s t test; **p < 0.01 and
****p < 0.0001 compared to the untreated group.
I)-specific H2O2 production was minimal, indicating that Complex I is an unlikely site for the exacerbated ROS
production observed after BPM31510 treatment (Fig. 3a, Supplemental Fig. 1).
However, in both cell lines, BPM31510 treatment significantly enhanced H2O2 production that was promoted
by succinate and glycerol-3-phosphate. The data suggest that increased ROS production due to BPM31510 treat-
ment arise from the mitochondrial complexes and dehydrogenases with a functional connection to the Q-pool,
specifically from Complex II and mGPDH. Furthermore, increased mitochondrial H2O2 production in MIA
PaCa-2 and PANC1 cells following BPM31510 treatment was sufficient to disrupt the cellular redox balance as
evidenced by increased oxidation of three distinct cellular redox probes (DCFDA, CellRox Green, and CellRox
Red) (Fig. 3b). In all, the data demonstrate that supraphysiologic increases in mitochondrial ubidecarenone
levels is sufficient to alter redox homeostasis as well as promote site-specific ROS production at the level of the
mitochondria at Complex II and mGPDH.
The ability of ubidecarenone to disrupt mitochondrial substrate-dependent respiration and induce ROS pro-
duction suggests mitochondrial dysfunction in the cancer cells. To assess the functional status of mitochondria
after BPM31510 treatment in these cell lines, mitochondrial membrane potential (ΔψΜ) was assessed using the
lipophilic cation fluorescent dye TMRE, which is sequestered in active (polarized) but not in inactive (depo-
larized) mitochondria15. The viable [propidium iodide (PI)-negative] cells were subgated into T MREhigh- and
low
TMRE -stained populations (Fig. 4 and Supplemental Fig. 3) and found that BPM31510 treatment led to a
significant decrease in the percentage of the TMREhigh population and a simultaneous increase in the TMRElow
population (Fig. 4a,b in MIA PaCa-2 and PANC1 cells, respectively). This demonstrates that mitochondrial
depolarization in response to BPM31510 treatment occurs downstream of changes in mitochondrial respiration
and ROS production.
Alterations in mitochondrial membrane potential direct the activation of mitochondrial cell death signalling
pathways16. As cancer cells are in a persistent state of oxidative stress with high levels of ROS production, they
have a low tolerance thresholds for additional ROS and activation of cell death p athways17. Treatment of both
pancreatic cancer cells lines with BPM31510 at doses that altered mitochondrial respiration, redox homeostasis,
and ΔψM was associated with a decrease in cell viability (Fig. 4a–c). Consistent with the decrease in cell viability,
BPM31510 decreased colony formation (Fig. 4d). There was a significant decrease in the percentage of viable MIA
PaCa-2 and PANC1 cells (Annexin Vneg and PIneg staining), with a concomitant increase in the percentage of total
Scientific Reports | (2021) 11:5749 | https://doi.org/10.1038/s41598-021-84852-z 5
Vol.:(0123456789)www.nature.com/scientificreports/
Scientific Reports | (2021) 11:5749 | https://doi.org/10.1038/s41598-021-84852-z 6
Vol:.(1234567890)www.nature.com/scientificreports/
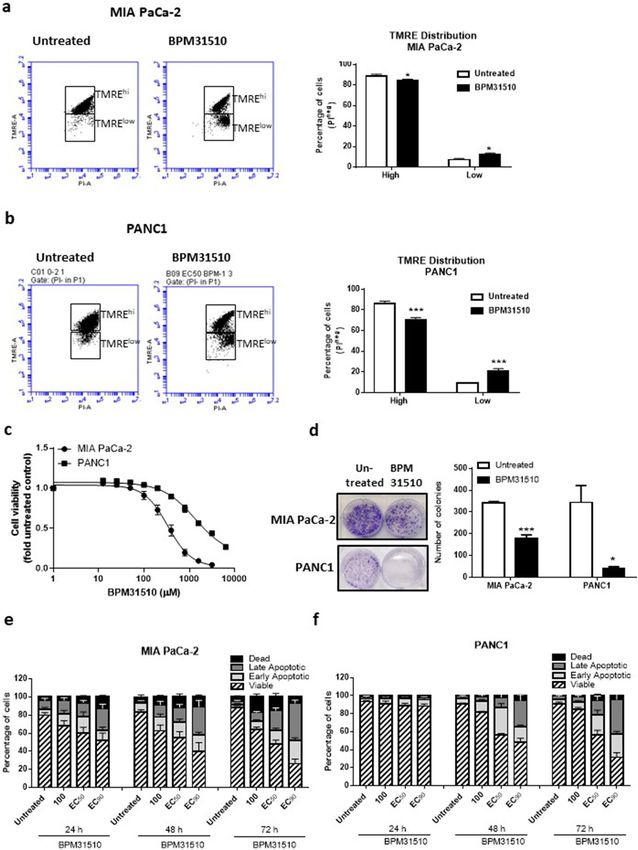
◂Figure 4. BPM31510 treatment hyperpolarizes the mitochondrial membrane potential prior to promoting
regulated cell death in MIA PaCa-2 and PANC1 cells. (a) Representative scatter plots of untreated and
BPM31510-treated MIA PaCa-2 cells illustrating the gating strategy used to measure the percentage and mean
fluorescent intensity of tetramethylrhodamine, ethyl ester (TMRE) high and low cells (Right panel). Percentage
of TMRE high-expressing and low-expressing MIA PaCa-2 cells 48 h after BPM31510 exposure. The data
represent the means + SEM of three independent experiments. (b) Representative scatter plots of untreated and
BPM31510-treated PANC1 (Right panel). Percentage of TMRE high-expressing and low-expressing PANC1
cells 48 h after BPM31510 exposure. The data represent the means + SEM of three independent experiments.
(Left panel) (c) Dose–response of BPM31510 on cell viability in MIA PaCa-2 and PANC1 cancer cells. The
data represent the means ± SEM of three independent experiments. (d) Colony formation after BPM31510
exposure (EC50) for 72 h. Representative images of colonies and corresponding quantitation are shown. The data
represent the means + SEM of three independent experiments. (e,f) Dose- and time-assessment of BPM31510 on
Annexin V and propidium iodide (PI) staining in MIA PaCa-2 (e) and PANC1 cells (f). The data represent the
means + SEM of three independent experiments. The data report the percentage of the population that is viable
(Annexin V negative and PI negative), early apoptotic (Annexin V positive and PI negative), late apoptotic
(Annexin V positive and PI positive), and dead/necrotic cells (Annexin V negative and PI positive). All data
were analysed by Student’s t test; *p < 0.05 and ***p < 0.001 compared to the untreated group.
non-viable Annexin V pos cells (Fig. 4e,f, respectively). Altogether, these data demonstrate that supraphysiologic
increases in the mitochondrial Q pool induce regulated cell death in pancreatic cancer cells in vitro.
Functional complex II and GPDH are sufficient for ubidecarenone‑induced ROS production
and cell death. As BPM31510 treatment affects the Q-pool between Complexes II and III, its effect in Rho0
cells was examined. Rho0 cells are depleted of mitochondrial (mt) DNA, and thus exhibit functional impair-
ments in Complexes I, III, IV, and V (protein subunits some of which are encoded by mtDNA), resulting in a
loss of mitochondrial respiration18. However, Complex II and GPDH are functional in Rho0 cells as they are fully
encoded by nuclear D NA19. Therefore, the Rho0 cells constitute an ideal model to study the requirement of Com-
plex II and GPDH in site-specific disruption of the ETC by ubidecarenone. As expected, compared to parental
MIA PaCa-2 cells, MIA PaCa-2 Rho0 cells displayed minimal basal respiration and higher levels of extracellular
acidification, suggesting increased glycolytic activity in the absence of functional mitochondria (Fig. 5a). In
addition, CoQ10 levels were higher in BPM31510 treated cells, compared to control, indicating that BPM31510
effectively delivered CoQ10 to these cells (Fig. 5b).
Interestingly, Rho0 cells were more sensitive to BPM31510-induced cell death than parental MIA PaCa-2,
as indicated by a lower I C50 (88.1 µM vs. 184.8 µM) for cell viability (Fig. 5c) and an increase in the percentage
of the total Annexin Vpos population (Fig. 5d). Also, consistent with earlier experiments in parental cell lines,
BPM31510 treatment significantly increased G3P-driven ROS production (Fig. 5e), which was substantiated
by an increase in total cellular pro-oxidant levels (Fig. 5f). Thus, these data indicate that functional Complex
II and GPDH are sufficient for ROS production and subsequent induction of regulated cell death induced by
supraphysiologic increases in the mitochondrial Q pool. This finding further supports that the mechanism of
cell death is independent of mitochondrial respiration.
Ubidecarenone affects tumour growth in vivo. Next, the effects of delivering ubidecarenone by
BPM31510 in vivo in an MIA PaCa-2 xenograft mouse model was determined. Intraperitoneal administration
of BPM31510 (25 mg/kg, b.i.d) resulted in a significant decrease in tumour growth by day 45 after inoculation
compared to saline-treated mice (Fig. 6a). In addition, C oQ10 tumour levels increased by six-fold over endog-
enous levels, indicating effective delivery of CoQ10 by BPM31510 after systemic administration (Fig. 6b). Nota-
bly, epithelial-enriched cancer cells (Supplemental Fig. 3) isolated from tumours of BPM31510-treated animals
exhibited significantly decreased glyercol-3-phosphate-driven respiration, but not succinate-driven respiration,
compared to saline-treated animals (Fig. 6c,d). These findings demonstrate that supraphysiologic increases in
ubidecarenone levels have anti-cancer effects in vivo via site-selective disruption of mitochondrial respiration.
Ubidecarenone decreases cell viability in patient‑derived organoids and promotes sub‑
strate‑specific ROS production. Due to limitations of cultured cell lines in vitro and cell line-derived
xenograft models in vivo as an adequate representation of human disease pathophysiology, the effects of ubide-
carenone was assessed in a primary ex vivo model using patient-derived pancreatic tumour organoids (PDO)20.
Specifically, the effect of BPM31510 treatment was assessed in organoids derived from a male patient with stage
3 primary pancreatic adenocarcinoma. The organoids were assessed initially for maintenance of morphol-
ogy, as assessed by haematoxylin and eosin staining (Fig. 7a). Consistent with the in vitro and in vivo models,
BPM31510 induced a dose-dependent decrease in cell viability up 49% at the highest dose of 1 mM (Fig. 7a).
Interestingly, BPM31510 treatment promoted changes in PDO size, as indicated by an increase in the appear-
ance of smaller and medium-sized PDOs and a decrease in larger PDOs at days 3 and 7 after treatment (Fig. 7b).
Importantly, BPM31510 treatment significantly enhanced H2O2 production in a succinate-dependent and G3P-
dependent manner in this ex vivo model (Fig. 7c). These data demonstrate that the cellular effects of BPM31510
(via increasing mitochondrial ubidecarenone levels) are readily translated from primary preclinical in vitro
models to human derived surrogate models of disease.
Scientific Reports | (2021) 11:5749 | https://doi.org/10.1038/s41598-021-84852-z 7
Vol.:(0123456789)www.nature.com/scientificreports/
Scientific Reports | (2021) 11:5749 | https://doi.org/10.1038/s41598-021-84852-z 8
Vol:.(1234567890)www.nature.com/scientificreports/
◂Figure 5. Rho0 cells are more sensitive to BPM31510 than MIA PaCa-2 parental cell lines. (a) Mitochondrial
DNA depletion in MIA PaCa-2 cells (Rho0) results in very low oxygen consumption rate (OCR) and elevated
glycolytic activity. ECAR, extracellular acidification rate. The data represent the means + SEM of three
independent experiments. (b) CoQ10 levels in Rho0 cells after BPM31510 treatment measured using LC/MS/
MS 24 h after BPM31510 exposure. The data represent the means + SEM of six independent experiments. (c)
Dose effect of BPM31510 on cell viability. (d) Annexin V and propidium iodide (PI) staining followed by flow
cytometry. The data represent the means ± SEM of three independent experiments. The data in (d) report the
percentage of the population that was viable (Annexin V neg, PIneg), early apoptotic (Annexin Vpos, PIneg), late
pos pos
apoptotic (Annexin V , PI ), and dead/necrotic cells (Annexin V neg, PIpos). (e) BPM31510 promotes the
generation of mitochondrial H2O2 during G3PDH-driven respiration in Rho0 cells as assessed by Amplex
Red assay. UD = undetected. The data represent the means + SEM of three independent experiments and
were analysed by Student’s t test; ***p < 0.001 compared to the untreated group. (f) BPM31510 promotes
cellular reactive oxygen species (ROS) production in Rho0 cells. The data represent the means + SEM of three
independent experiments and report the fold change normalized to the untreated control. The data were
analysed by Student’s t test; **p < 0.01 and ***p < 0.001 compared to the untreated control.
Discussion
This study demonstrates that mitochondrial delivery of supraphysiologic concentrations of oxidized C oQ10
using BPM31510 formulation disrupts ETC processes leading to significant increases in ROS generation. The
increase in ROS leads to induction of apoptosis in pancreatic cancer, which has been consistently reproduced and
translated from in vitro models through animal xenografts and human derived organoids. The study highlights
the therapeutically under-leveraged concept of the anti-cancer potential of ROS induction beyond physiological
threshold to activate cell death pathway in c ancer2. Findings from the current study validate the argument that if
the ROS levels in cancer cells are close to a threshold and are pushed over that threshold via a therapeutic modal-
ity, apoptosis can be triggered. Remarkably, normal cells with intrinsic lower levels of ROS compared to cancer
cells would be spared the same fate of undergoing apoptosis, ensuring potential safety profile of the therapeutic
modality21. Integrating these findings with the known molecular and biological consequences of CoQ10 and its
deficiency syndromes22, it can be concluded that supraphysiologic levels of CoQ10 in the mitochondria disrupts
redox homeostasis, activating cell death pathways in cancer while physiological CoQ10 levels maintain mitochon-
drial function and have potential to promote pro-survival responses and cellular growth (Fig. 8). Indeed, the
safety and tolerability of BPM31510 has been established in Phase 1 clinical trial of solid tumors and is currently
in clinical development for pancreatic cancer (NCT02650804), and in glioma (NCT03020602).
In this study, BPM31510 was used to delivery high concentrations of C oQ10, specifically within mitochondria
in pancreatic cancer models. Specifically, the observation in vitro in pancreatic cancer cells of an 80-fold increase
in mitochondrial levels of ubidecarenone compared to 0.2–0.3 nmol/mg concentration observed in untreated
cells highlights the impact of BPM31510 formulation in CoQ10 bioavailability. Few studies have been able to
achieve high C oQ10 concentrations in mitochondria. Using a water-soluble formulation of C oQ10 known as
Qter, Bergamini et al. achieved a CoQ10 concentration > 10 nmol/mg in mitochondria after treating T67 glioma
cells with 10 µM Q ter23. And, notably, co-administration of Qter with rotenone, a complex I inhibitor, appeared
to potentiate rotenone-induced ROS generation compared to rotenone alone. The current study demonstrates
that ubidecarenone induces an increase in ROS in a site-specific manner leading to disruption in mitochondrial
respiration and activation of cell death.
Moreover, we observed a decrease in oxygen consumption rates in response to ubidecarenone delivery to
the mitochondria. The data also demonstrated that the loss of electron transfer activity is coordinated with site-
selective enhanced mitochondrial electron leak and subsequent ROS production. In the pancreatic cancer cells
tested, delivery of supraphysiologic levels of ubidecarenone specifically affected succinate (Complex II) and
glycerol-3-phosphate (GPDH)-fuelled respiration, with non-inhibitory effects on pyruvate (Complex I)-fuelled
respiration. This functional impairment in respiration correlated with substrate-specific H 2O2 production. Prior
studies have indicated that succinate-driven H 2O2 is mediated via reverse electron transport (RET) when the
proton motive force (Δp) is high24.possibly due to an increase in levels of reduced CoQ109,25. Of interest, Guarás
et al. demonstrated that the balance of the C oQH2:CoQ ratio serves as a sensor for respiratory chain efficiency
and that an increase in this ratio underlies ROS generation via RET26. In the present study, increasing the mito-
chondrial Q pool with BPM31510 increased succinate-mediated ROS production, which was detected in the
presence of rotenone. Since this effect was not sensitive to rotenone in this study, it is unlikely that increasing
CoQ10 promotes ROS via RET.
While CoQ10 serves as the electron transfer molecule for Complex I/III and Complex II/III-mediated res-
piration, the disruption of Complex II and GPDH-fuelled respiration that was observed is consistent with the
known participation of Complex I in super-complexes with other ETC c omponents27. Thus, RET may be medi-
ated by a separate Q pool. Therefore, the observation that inhibiting Complex II and GPDH-fuelled respiration
and promoting ROS production was elicited by exogenous supraphysiologic levels of ubidecarenone suggests
an alteration in the C oQ10 pool that does not involve supercomplex-mediated electron transfer/respiration.
This finding suggests that delivering C oQ10 into cancer cells with low levels of super-complexes and elevated
FAD-oxidation and/or into highly metabolic tumours with increased TCA flux may be more susceptible to
BPM31510-mediated pro-oxidant production and cell death. Such tumour subsets have been previously reported.
For example, in a study of > 2000 breast cancer samples, Whitaker-Menezes et al. demonstrated transcriptional
upregulation of oxidative phosphorylation genes and, specifically, increases in Complex II subunits/activity28.
Scientific Reports | (2021) 11:5749 | https://doi.org/10.1038/s41598-021-84852-z 9
Vol.:(0123456789)www.nature.com/scientificreports/
Figure 6. BPM31510 affects tumour size and alters mitochondrial respiration in vivo in a MIA PaCa-2
xenograft mouse model of pancreatic cancer. (a) BPM31510 (25 mg/kg, i.p., B.I.D.) effects on tumour volume
in an MIA PaCa-2 xenograft pancreatic mouse model. Representative tumours from an untreated control and
BPM31510-treated mouse are shown (inset). The data were analysed by Student’s t test; *p < 0.05 compared to
control mice. (b) CoQ10 levels in tumours after BPM31510 treatment. Data represent n = 11 saline-treated mice
and n = 12 BPM31510-treated mice. Data were analysed by Student’s t test. *p < 0.05 vs control. (c,d) BPM31510
effects on (c) state 3 G3PDH respiration and (d) state 3 Complex II respiration in MIA PaCa-2-derived epithelial
cancer cells enriched from excised xenografts. N = 6 per group. The data represent the means + SEM and were
analysed by a Mann–Whitney non-parametric test; ****p < 0.0001 compared to saline.
That sample indicates a tumour subset with elevated FAD oxidation amenable to recapitulation of the C oQ10
effects observed in this study.
In the pancreatic cell models tested in the current study, State 3 respiration on glyercol-3-phosphate was
2.5–4.4 pmol/min/µg protein, comparable to respiratory rates on pyruvate, succinate, and ascorbate/TMPD.
In addition, even in the presence of multiple oxidizable substrates, GPDH-fuelled respiration accounted for
18–25% of total mitochondrial respiration. The effect of increased ubidecarenone on GPDH-fuelled respiration
was more extensive compared to Complex II responses in cells isolated from the tumours of treated mice. The
importance of GPDH was further substantiated from experiments in Rho0 cells, which showed greater sensi-
tivity to ubidecarenone than their parental counterparts. Of particular interest, increased activity of mGPDH
(G3PD) has been found in various t umours29. In addition, mGPDH links cytosolic glycolysis to mitochondrial
ETC function via the NAD:NADH redox couple. Given that a function of glycolysis is consistent with the con-
trol of redox homeostasis, the data is consistent with prior studies that demonstrated that glyercol-3-phosphate
can be a major contributor of substrate-fuelled mitochondrial ROS production29. However, while G3P/ROS
has been described and G3P coordinates metabolic pathways important in cancer, it has not been considered
as a relevant metabolic substrate in cancer to date. Results in this study emphasizes the underappreciated role
for glyercol-3-phosphate as a substrate for mitochondrial respiration in cancer. As cancer is a disease in which
metabolic substrate utilization is a distinct driver of disease progression and an emerging therapeutic target18,30,
dependence on glyercol-3-phosphate as a metabolic substrate and subsequent ROS production may represent a
ground-breaking anticancer target to be exploited in certain tumour types.
Furthermore, in this study the supraphysiologic effects of ubidecarenone were recapitulated in multiple
model systems (in vitro, in vivo, ex vivo PDO), albeit to varying magnitudes. It is important to take note of a few
limitations in the present study. The study demonstrates that Complex II and GPDH are sufficient for BPM31510-
mediated ROS production/cell death. However, this does not negate the critical attributes to their absence in
ubidecarenone effect. This is limited by the lack of genetic approaches to selective knockdown a mitochondrial
Scientific Reports | (2021) 11:5749 | https://doi.org/10.1038/s41598-021-84852-z 10
Vol:.(1234567890)www.nature.com/scientificreports/
Figure 7. BPM31510 decreases cell viability in patient-derived organoids (PDO) derived from pancreatic
tumours, alters G3PDH and Complex II-dependent respiration, and promotes substrate-specific reactive oxygen
species (ROS) production. (a) Haematoxylin and eosin-stained PDOs (left panel). PDO viability after treatment
with BPM31510 (right panel). PDOs were untreated or treated with either DMSO or a toxic mix of cyclohexane
(50 µg/mL) and puromycin (2 µg/mL), gemcitabine (1 or 10 µM), 5-FU (1 or 10 µM), or BPM31510 (100–
10,000 µM) for 72 h, and cell viability was assessed using a CytoTOX Glo cytotoxicity assay. The data represent
the means ± SEM of three biological replicates. (b) BPM31510 decreases PDO size after 72 h of treatment.
Representative images of PDO after 3 and 7 days of treatment with BPM31510 (left). The boxplots represent
the distribution of PDO size following treatment (right). (c) Mitochondrial H 2O2 generation during succinate-
driven (left) and G3PDH-driven (right) respiration in PDOs after BPM31510 treatment. The data represent
the means ± SEM of three independent experiments. All data were analysed by one-way ANOVA followed by
Dunnett’s or Tukey’s post hoc test; *p < 0.05, ***p < 0.01, ****p < 0.001 compared to the untreated control group.
Scientific Reports | (2021) 11:5749 | https://doi.org/10.1038/s41598-021-84852-z 11
Vol.:(0123456789)www.nature.com/scientificreports/
Dysfuncon/cell death
ROS level
ROS-induced
cell death threshold
Deficiency Homeostasis Surplus
Mitochondrial CoQ10 level
Figure 8. Relationship between mitochondrial CoQ10 level, reactive oxygen species (ROS) level, and ROS-
oQ10 deficiency22 and CoQ10 surplus increase ROS levels, resulting in
induced cell death threshold. Both C
mitochondrial dysfunction and cell death, while homeostatic levels of C oQ10 support cellular function and
survival. The ROS-induced cell death threshold likely differs between cell types.
complex or the availability of suitable compounds for site-selective pharmacological approach to prevent elec-
tron loading into the Q pool by GPDH. As such, one cannot determine the relative contributions of Complex
II compared to GPDH. While mathematical models have been developed to address these important questions,
they are theoretical and predicated on assumptions24. In addition, the findings reported here do not describe
the effects of BPM31510 on comparative healthy/non-tumorigenic cells. However, supraphysiologic concentra-
tions achieved in clinical trials of BPM31510 are associated with reliable and consistent safety and tolerability
profiles (NCT02650804, NCT03020602, NCT01957735), supporting non-deleterious effects in “normal” cells
compared to cancer.
In summary, the data demonstrates the potential of an anti-cancer therapeutic modality that builds upon
early strategies that have attempted to disrupt redox homeostasis. In addition, the study provides evidence that
the mitochondrial resident molecule has the ability to impact cancer outcomes by influencing key mitochondrial
function. Early approaches aimed to promote antioxidant activity for anti-cancer effect targeted antioxidants and
ROS-scavenging systems, such as superoxide dismutase (SOD), glutathione peroxidases, peroxidoxins, glutar-
edoxin, thioredoxin, catalase, and nuclear factor erythroid 2-related factor 2 (Nrf2). Unfortunately, antioxidant
treatments have been ineffective31. The data in this study clearly demonstrate that a pro-oxidant state induced
by enhancing pro-oxidant production is essential for an effective anti-cancer s trateg17,32. This study successfully
leveraged existing and emerging science to establish the ability of BPM31510 to deliver supraphysiologic levels
of CoQ10 to the mitochondria offers a distinct, novel, safe, and potentially effective therapeutic strategy aimed
at targeting ROS, oxidative stress, and activation of cell death pathways in the treatment cancer.
Methods
Antibodies and chemical reagents. The following antibodies were used in this study: Annexin V
FITC-conjugated (Molecular Probes), mouse fibroblast specific protein-1 (Abcam), mouse CD31 PE-con-
jugated (Militenyi), mouse CD14 PerCP Cy5.5-labelled (BD Biosciences), mouse B220 PE-Cy5-labelled (BD
Biosciences), and human CD44 APC-conjugated (Militenyi) antibodies. The goat anti-mouse IgG Alexa 488
secondary antibody was obtained from Invitrogen. The BPM31510 formulation is a colloidal nanodispersion
mixture containing CoQ10 in combination with dimyristoylphosphatidylcholine (DMPC) and the surfactant
poloxamer 188 in a fixed ratio that renders a relatively stable formulation. To produce BPM31510, CoQ10 was
mixed with sterile water and placed in a water bath at ~ 65 °C to melt. The melted C oQ10/water mixture was
mixed with DMPC and poloxamer 188 with constant stirring with a polytron homogeniser to form dispersed
particles. The mixture was then subjected to particle size reduction in a microfluidizer. The particle size distribu-
tion was measured after successive cycles of the microfluidization process using a particle size analyser until the
mean particle size of the formulation was < 200 nm.
Pancreatic cancer cell lines. The human pancreatic adenocarcinoma cell lines MIA PaCa-2 and PANC1
were obtained from Sigma-Aldrich and cultured at 37 °C with 5% C O2 in Dulbecco’s modified Eagle’s medium
(DMEM, Thermo Scientific) supplemented with 5% foetal bovine serum (FBS) (Gibco) and 1% penicillin–strep-
tomycin-amphotericin A (Lonza). Experimental procedures were performed within 20 passages after thawing,
and pancreatic cancer cells were discarded after 30 passages in culture.
Cytotoxicity assays. Cells were plated at a density of 1.0 × 10⁴ cells per well in 96-well black plates and
treated with BPM31510 (0–12,800 µM). Cells were incubated for 72 h, and relative cell viability was determined
based on relative protease activity using CellTiter-Fluor viability reagent (Promega) according to the manufac-
turer’s instructions. Briefly, the cell culture medium was replaced with DMEM without phenol red supplemented
with d-glucose, sodium pyruvate, Glutamax, sodium bicarbonate, and the fluorogenic, cell-permeant peptide
substrate Gly-Phe-AFC (1:2000, Promega). Cells were incubated for 1 h at 37 °C, and cleavage of the substrate
by active cell proteases was fluorometrically measured at an excitation of 390 nm and emission of 505 nm. The
Scientific Reports | (2021) 11:5749 | https://doi.org/10.1038/s41598-021-84852-z 12
Vol:.(1234567890)www.nature.com/scientificreports/
BPM31510 half maximal effective concentration (EC50) and EC90 90% effective concentration (EC90) values for
each cell line were determined by nonlinear regression analysis in GraphPad Prism.
Clonogenic survival assay. Cells were plated at a density of 1.0 × 10⁵ cells per well in 12-well plates in
growth media and then treated with BPM31510 at the indicated doses for 72 h at 37 °C. The cells were then
trypsinized and counted, and 1,000 cells from each treatment group were re-plated in 6-well plates in growth
media without drug treatment for 10 or 12 days for MIA PaCa-2 or PANC1 cells, respectively. The growth media
were aspirated from each well and the wells were washed in PBS before the cells were fixed in 70% ethanol for
5 min. To visualize colony formation, plates were counterstained with 1% crystal violet for 10 min, and the num-
ber of colonies (> 50 cells) was manually counted per treatment group.
Apoptosis measurements. Cells were plated at a density of 1.0 × 10⁵ cells in 24-well dishes and treated
with BPM31510 at the doses and times indicated. The cell culture supernatant (containing detached apoptotic
cells) and the adherent cells were harvested by trypsinization and centrifuged at 500×g for 5 min, before the
resulting pellets were washed in staining media (PBS, 0.5% FBS). The cells were co-stained with FITC-conju-
gated anti-Annexin-V (1:200, Molecular Probes) to detect phosphatidylserine (PS) exposure on the outer mem-
brane surface, and with propidium iodine (PI, 1:2000, Molecular Probes) in 200 μL binding buffer (Molecular
Probes). After a 15-min incubation in the dark, the percentage of Annexin Vpos and PIpos cells was analysed using
the FL-1 and FL-3 channels on an Accuri C6 Flow Cytometer (BD Biosciences).
Mitochondrial membrane potential. Cells were plated at a density of 1.0 × 10⁵ cells in a 12-well dish and
treated with BPM31510. At 48 and 72 h, the cells were stained with 200 nM tetramethylrhodamine ethyl ester
(TMRE; Abcam) for 20 min at 37 °C. The cells were then washed twice in PBS, trypsinized, and stained with
Annexin-V and PI to gate apoptotic cells. The sequestration of TMRE by polarized mitochondria was analysed
in the FL-2 channel using flow cytometry.
Coenzyme Q10 imaging and quantitation. Confocal imaging. A BPM31510 formulation containing a
fluorescent analogue closely resembling the CoQ10 structure was designed. The probe consists of three segments:
a phenol head group (CoQ10-like head group), a reporter (fluorescent dye), and a lipophilic segment (9 units
isoprenyl group). First, a solanesyl-α-formyl pyrrole adduct was prepared and then assembled to the asymmetric
BODIPY containing the solanesyl isoprenyl group. This was followed by the preparation of the dimethoxy phe-
nol head group. The last step of the synthesis relied on Knoevenagel condensation to couple the two segments.
Finally, the formulation was prepared containing 4% CoQ10 analogue, 3% DMPC, and 1.5% Poloxmer 188.
The cells were treated with 200 µM of the formulation for 24 h or 48 h and costained with MitoTracker Green
(Molecular Probes). Live cell images were captured using a confocal microscope (Olympus IX83) at excitation at
488 nm for MitoTracker Green and 543 nm for the red fluorescent CoQ10.
Quantitation of subcellular CoQ10 distribution by MS/MSall. Cells were plated at a density of 1.0 × 10⁶ cells/
well and treated with BPM31510 at the indicated doses and times. The cells were then washed once in ice-cold
PBS, trypsinized, pelleted, and then homogenized in mitochondrial isolation buffer (0.21 M mannitol, 0.07 M
sucrose, 0.1 mM EDTA, 1 mM EGTA, 10 mM Tris HCl, 0.5% BSA, pH 7.4 using KOH). Mitochondrial, cytosolic
and nuclear/plasma membrane fractions were obtained by sucrose gradient centrifugation. To quantify the accu-
mulation of BPM31510 in the subcellular fractions, an automated structural lipidomics platform was utilized as
previously described33. Briefly, to extract lipids, 4 mL CHCl3/MeOH (1:1, v:v) was added to each sample tube
and vortexed for 20 min. Another 2 mL of 50 mM LiCl was added, and the samples were mixed for 10 min and
centrifuged at 2000 rpm for 5 min. The bottom chloroform layer was then extracted, and 1.8 mL of CHCl3 was
added to the source tubes. Samples were mixed for 5 min and centrifuged again at 2000 rpm for an additional
5 min. The extraction method was repeated two more times prior to drying under nitrogen and reconstituted
and loaded onto a SCIEX 5600 + TripleTOF. CoQ10 measurements were quantitatively measured based on a
CoQ10 standard curve.
Mitochondrial complex activity in permeabilized cells. To test mitochondrial ETC complex activ-
ity in pancreatic cancer cells, 1.0 × 10⁴ cells/well were plated in specialized plates (Agilent Technologies) in the
corresponding growth media and incubated for 3 h prior to treatment with BPM31510. At 18 h post-treatment,
the cells were washed once in mitochondrial assay solution (MAS; 220 mM mannitol, 70 mM sucrose, 20 nM
H2KPO4, 5 mM M gCl2, 2 mM HEPES, 1 mM EGTA, pH 7.4) and immediately reconstituted with XF plasma
membrane permeabilization buffer (1 nM XF-PMP, 4 mM ADP, MAS buffer, Seahorse Biosciences). Complex I-,
II-, and IV-driven respiration was assessed by electron flow assay (Seahorse Biosciences). Briefly, the cells were
treated with 10 mM pyruvate and 1 mM malate (Complex I) followed by sequential treatment with rotenone
(2 µM), succinate (Complex (II), 10 mM), Antimycin A (1 µM), and ascorbate (10 mM) + TMPD (N,N,N′,N′-
tetramethyl-p-phenylenediamine, 100 µM). To measure GPDH-driven respiration, the cells were seeded at a
density of 1.0 × 10⁴ cells per well and treated with BPM31510. At 18 h post-treatment, the cells were washed once
in mitochondrial assay solution and immediately reconstituted with XF plasma membrane permeabilization
buffer supplemented with 5 mM glycerol-3-phosphate and 2 µM rotenone. Non-mitochondrial oxygen con-
sumption rate (OCR) was determined by injection with Antimycin A and rotenone, and residual oxygen con-
sumption was subtracted from the results to obtain mitochondrial-specific rates. Total mitochondrial oxidation
and complex-dependent OCR levels were measured as described, with modifications. After 18 h, the cells were
Scientific Reports | (2021) 11:5749 | https://doi.org/10.1038/s41598-021-84852-z 13
Vol.:(0123456789)www.nature.com/scientificreports/
washed once in 1× MAS buffer and immediately reconstituted with XF PMP buffer (1 nM XF PMP, 4 mM ADP,
1× MAS buffer, and a combination of pyruvate, malate, succinate, and G3P. To determine complex dependency,
rotenone (1 µM final, Complex I inhibitor), TTFA (250 µM, Complex II inhibitor) and i-GP1 (400 µM, mGPDH
inhibitor) were sequentially injected in different combinations. Complex dependency was determined by meas-
uring the decrease in OCR in the presence of inhibitors for the targeted complex expressed as the percentage of
oxidation of all three oxidizable substrates. All the data were normalized to total protein content measured using
separate plates set up in parallel.
ROS measurements. Approximately 1 × 10⁵ cells were seeded in 12-well dishes and treated with
BPM31510. After 24 h, the cells were washed in PBS and incubated with 5 µM CM-H2DCFDA (Life Tech-
nologies), 2.5 µM CellRox Red (Thermo Fisher), or 2.5 µM CellRox Green (Thermo Fisher) for 30 min prior
to analysis by flow cytometry. All samples were costained with PI to exclude the dead cell population from the
analysis. Complex-driven H2O2 production was measured using Amplex Red (Thermo Fisher), according to the
manufacturer’s instructions but with the following modifications: after 24 h of BPM31510 treatment, the media
were aspirated and the cells were washed with 1× MAS buffer. To measure complex-specific H2O2 production,
the cells were incubated with 10 mM pyruvate/1 mM malate, 10 mM succinate/2 µM rotenone, or 5 mM glycrol-
3-phosphate/2 µM rotenone diluted in MAS buffer containing 4 mM ADP and 1 nM XF PMP for 30 min at 37 °C
prior to the addition of Amplex Red. H2O2 production was kinetically monitored for 90 min at 37 °C using an
excitation of 530 and emission of 590. Total H2O2 production was quantitated based on a H2O2 standard curve
(Supplemental Fig. 1).
Generation of Rho0 Cells. Mitochondria were depleted by culturing MIA PaCa-2 cells in the presence
of 100 ng/mL ethidium bromide for 6–8 weeks. The growth culture media were supplemented with 4.5 mg/mL
glucose, 50 μg/mL uridine, and 100 μg/mL pyruvate to compensate for respiratory metabolism defects. After
establishing Rho0 cells, the media was supplemented with 50 μg/mL uridine for cell growth and expansion. To
validate the successful generation of Rho0 cells, OCR and extracellular acidification rate (ECAR) levels were
tested using a Seahorse XF96 Analyzer (Agilent).
In vivo xenograft studies and cancer cell extraction. Animals. All animal experiments were
conducted in compliance with the relevant laws and institutional guidelines of the Charles River Laboratory.
Seven-week-old athymic nude mice from Charles River Laboratory were inoculated with MIA PaCa-2 tumour
cells (ECACC). Each mouse was inoculated subcutaneously on the right flank with MIA PaCa-2 tumour cells
(5 × 10⁶) in 100 µL of Dulbecco’s modified Eagle’s medium with 50% Matrigel (Corning Catalogue No. 47743-
715) for tumour development. Two days after tumour cell inoculation, the mice were assigned to one of two
groups consisting of 18 animals each to receive either vehicle (saline) or 25 mg/kg BPM31510 intraperitoneally
in a volume of 10 mg/kg. Treatment continued for 47 days until the largest tumour in the control group reached
2000 mm3. Tumour dimensions and body weights were recorded three times per week with a gap of 2–4 days
between the two measurements. The tumour volume was calculated as 0.5 × Long Diameter × Short Diameter.
Cancer cell extraction. The protocol for extraction of the enriched cancer cell population was based on previ-
ously described m ethods34. Briefly, tumour xenografts were minced into small m
m3 pieces and digested in colla-
genase (850 units/mL collagenase type II, 2.5 mg/mL trypsin, 5 mg/mL albumin resuspended in PBS) for 20 min.
After 20 min, the collagenase solution was removed by straining samples through a 100 µM cell strainer, and
tumour tissues were again digested for an additional 20 min. The single cell suspension was then collected, and
the samples were incubated for 20 min to allow for the epithelial cancer cells and fibroblasts to separate (as per
the sedimentation technique described by Lanari et al.30). After incubation, 10 mL cell media was removed, gen-
erating the first wash. The washing steps were repeated a further four times. After the final wash, all tubes were
centrifuged at 250×g for 10 min, and the supernatant was removed. Cells were resuspended in growth media and
counted using trypan blue exclusion to determine the percentage of viable cells prior to mitochondrial measure-
ments. Complex II (succinate) and GPDH-driven respiration was measured as described above. Briefly, 100 µL
of cell suspension containing approximately 300,000 cells was plated per well in technical replicates. The plates
were then spun for 20 min at 4 °C at 2200 rpm. The media was removed, and the plates were washed in 1× MAS
buffer to remove residual media. The plates were then replenished with 10 mM pyruvate + 1 mM malate or 5 mM
glycerol-3-phsophate + 2 µM rotenone in 1× MAS buffer supplemented with 4 mM ADP and 1 nM XF-PMP. An
additional plate was set up in parallel to determine protein levels. Cancer cell enrichment was measured using
the following cell surface expression markers: fibroblast specific protein-1 (mouse 1:400, secondary goat anti-
mouse IgG Alexa 488 1:2000), CD31 (mouse PE-conjugated, 1:200), CD14 (mouse PerCP Cy5.5, 1:200), B220
(mouse PE-Cy5, 1:200), and CD44 (human, APC conjugated), and the percentage of CD44pos cancer cells was
measured by flow cytometry (Supplemental Fig. 2).
Generation of patient‑derived organoids. Patient-derived tumour organoid (PDO) cultures were gen-
erated from a primary pancreatic adenocarcinoma tumour obtained from a Caucasian male patient (age 69) with
Stage 3 cancer and no evidence of local or distant metastasis. The patient harboured the following genetic point
mutations: KRAS (G61H), SMAD4 (Asn107Lys), BRCA2 (Arg2034Cys), and PRSS (Cys171Tyr). The following
screened genes were normal: GNAS, BRAF, FGFR1, MYC, MDM2, GATA6, AKT2, TP53, CDKN2A, RNF43,
RREB1, BRCA1, ATM, PALB2, ARID1A, PBRM1, MLL3, MLL4, KDM6A, and NF1. The generation of the PDO
was performed as described p reviously20. Briefly, tissue from tumour resections was minced into DMEM con-
taining 1% of each BSA and penicillin/streptomycin. The digested tissue was plated using specialized media
Scientific Reports | (2021) 11:5749 | https://doi.org/10.1038/s41598-021-84852-z 14
Vol:.(1234567890)www.nature.com/scientificreports/
developed for organoid development into a single well of a 12-well plate coated with Matrigel. After 10–15 days
to allow for generation, the organoids were cultured and maintained at 37 °C in 5% C O2.
Organoids from a 12-well plate were first seeded into a Matrigel-coated 96-well assay plate (Corning) in
pancreatic tumour organoid development media at a density of 5.0 × 10⁴ cells/well (day 0). On day 4, PDOs were
treated with varying concentrations of BPM31510, gemcitabine, or DMSO control using a TECAN D300e auto
drug dispenser and kept at 37 °C for 4 days in a CO2 incubator. Each drug concentration was added into three
different wells per organoid line, and three independent trials were performed that produced nine different
replicates. On day 8, cell survival was analysed using a CytoTOX Glo cytotoxicity/cell survival assay (Promega)
following the manufacturer’s instructions, using a BioTek synergy H1 microplate reader. Data were finalized by
normalizing the cell survival in drug-treated wells with respect to the carrier control.
PDO image analysis. For analysis of PDO size, images were captured under a light microscope and pro-
cessed and quantified using Open Source Computer Vision Library (https://opencv.org/). The images were pro-
cessed using a python script (Supplemental Fig. 3) that automatically detects and segments PDOs from the
background. Specifically, images were first converted to greyscale and then Gaussian blurred to fill breaks in the
organoid edges, and the edges were detected by a Canny edge filter. The edges were Gaussian blurred to start
the smearing. The smearing was further processed with a morphologically close operation. Small noise particles
were denoised with a morphological open operation. Unsegmented bubbles in the middle of the organoids,
especially in organoids with dark black centres, were flood filled to complete the segmentations. A connected
component filter was used to count and measure the pixel areas of all segmented organoids. The mean intensities
of each organoid were calculated by taking the intensities from the original images using the PDO segmentation
images to obtain the pixel locations.
After segmenting the organoids, the size of organoids was defined by pixel areas. The pixel areas of all orga-
noids were plotted in a histogram to determine the signal from noise. The area histogram identified mostly
smaller areas with a long sparse tail, indicative of large areas. Areas after the contiguous tail were considered
noise and excluded from the analysis by thresholding objects above 40,000 pixels in area for the area analysis. At
this point in the analysis, information for each organoid, treatment, area and time point was retained.
Statistics and reproducibility. Data are presented as the means ± standard error of the mean from 3 to 5
biological replicates with least three independent experiments for cell and PDO models. Statistical testing was
performed using two-tailed t-tests for comparisons between two groups and ANOVA for comparisons among
three or more groups. Post hoc tests for multiple comparisons are specified in the figure legends. For data that
were not normally distributed, non-parametric tests were used and described in the figure legends. To test for
the effect of treatment on PDO size, organoids treated with 1 mM or 3 mM BPM31510 were labelled as ‘treated’,
while organoids that were not treated were labelled ‘untreated’. Regression models (‘PDO size’ × ‘Treatment’)
were built in R for each time point to determine the relationship between treatment and PDO size. The detailed
linear regression models are shown in Supplemental Fig. 4. A p < 0.05 was considered statistically significant. All
statistical analyses were performed using GraphPad Prism version 7 (GraphPad).
Data availability
The data that support the findings of this study are not publicly available due to their propriety nature. Inquiries
should be directed to the corresponding author [RS].
Received: 31 August 2020; Accepted: 22 February 2021
References
1. Liberti, M. V. & Locasale, J. W. The warburg effect: How does it benefit cancer cells?. Trends Biochem. Sci. 41, 211–218 (2016).
2. Ippolito, L., Giannoni, E., Chiarugi, P. & Parri, M. Mitochondrial redox hubs as promising targets for anticancer therapy. Front.
Oncol. 10, 256–267 (2020).
3. Crane, F. L., Hatefi, Y., Lester, R. L. & Widmer, C. Isolation of a quinone from beef heart mitochondria. Biochim. Biophys. Acta 25,
220–221 (1957).
4. Mitchell, P. The protonmotive Q cycle: a general formulation. FEBS Lett. 59, 137–139 (1975).
5. Linnane, A. W., Kios, M. & Vitetta, L. Coenzyme Q(10)–its role as a prooxidant in the formation of superoxide anion/hydrogen
peroxide and the regulation of the metabolome. Mitochondrion 7(Suppl), S51-61 (2007).
6. Littarru, G. P. & Tiano, L. Bioenergetic and antioxidant properties of coenzyme Q10: recent developments. Mol. Biotechnol. 37,
31–37 (2007).
7. Treberg, J. R., Quinlan, C. L. & Brand, M. D. Evidence for two sites of superoxide production by mitochondrial NADH-ubiquinone
oxidoreductase (complex I). J. Biol. Chem. 286, 27103–27110 (2011).
8. Wang, Y. & Hekimi, S. Understanding ubiquinone. Trends Cell Biol. 26, 367–378 (2016).
9. Quinlan, C. L., Perevoshchikova, I. V., Hey-Mogensen, M., Orr, A. L. & Brand, M. D. Sites of reactive oxygen species generation
by mitochondria oxidizing different substrates. Redox Biol. 1, 304–312 (2013).
10. Brand, M. D. Mitochondrial generation of superoxide and hydrogen peroxide as the source of mitochondrial redox signaling. Free
Radic. Biol. Med. 100, 14–31 (2016).
11. St-Pierre, J., Buckingham, J. A., Roebuck, S. J. & Brand, M. D. Topology of superoxide production from different sites in the mito-
chondrial electron transport chain. J. Biol. Chem. 277, 44784–44790 (2002).
12. Daemen, A. et al. Metabolite profiling stratifies pancreatic ductal adenocarcinomas into subtypes with distinct sensitivities to
metabolic inhibitors. Proc. Natl. Acad. Sci. U.S.A. 112, E4410-4417 (2015).
13. Brown, G. C. Control of respiration and ATP synthesis in mammalian mitochondria and cells. Biochem. J. 284(Pt 1), 1–13 (1992).
14. Schieber, M. & Chandel, N. S. ROS function in redox signaling and oxidative stress. Curr. Biol. CB 24, R453-462 (2014).
Scientific Reports | (2021) 11:5749 | https://doi.org/10.1038/s41598-021-84852-z 15
Vol.:(0123456789)You can also read