The Development and Validation of a Scale to Measure University Teachers' Attitude towards Ethical Use of Information Technology for a Sustainable ...
←
→
Page content transcription
If your browser does not render page correctly, please read the page content below
sustainability

Article
The Development and Validation of a Scale to
Measure University Teachers’ Attitude towards
Ethical Use of Information Technology for a
Sustainable Education
Liliana Mât, ă 1 , Otilia Clipa 2, *          and Katerina Tzafilkou 3, *
 1    Teacher Training Department, Vasile Alecsandri University of Bacău, 600115 Bacau, Romania;
      liliana.mata@ub.ro
 2    Educational Sciences Department, S, tefan cel Mare University of Suceava, 720029 Suceava, Romania
 3    Department of Information System, University of Macedonia, 54006 Thessaloniki, Greece
 *    Correspondence: otiliac@usv.ro (O.C.); tzafilkou@uom.edu.gr (K.T.);
      Tel.: +40-7448128886 (O.C.); +30-2310891768 (K.T.)

 Received: 13 July 2020; Accepted: 31 July 2020; Published: 4 August 2020

 Abstract: A self-administered measurement tool was developed and validated to provide data
 regarding ethical attitude of university teachers for a sustainable education. The research was
 based on several factors involved in forming attitudes towards the unethical information technology
 use. The sample: 334 Romanian teachers’ respondents who teach in the higher education system
 contributed to this research. A successions of factor analyses and structural equation modeling
 showed that a second-order model is a good fit for experimental data (χ2/df = 1.75, comparative fit
 index = 0.958, root mean square error of approximation = 0.045), however the partial least square
 (PLS-SEM) CFA approach revealed higher scores of factor loadings, implying the best fit to the model.
 This research suggested a structural model of ethical attitude of university teachers, composed by
 four factors measured by 13 indices. The results demonstrated that PLS-SEM CFA is appropriate for
 creating a valid structural model to measure university teachers’ ICT ethical attitude. The current
 research predicted a theoretical contribution to the field of ethical attitude of university teachers
 within a sustainable education context.

 Keywords: CBA factor analysis; ICT ethics; PLS-SEM factor analysis; scale validation; teachers’
 ethical attitude

1. Introduction
     The university has very important roles in education for sustainability [1] and for development
of future active teachers and citizens, including cognitions, behavioral and attitudinal domain [2].
The purposes of the university training are in continuous (re)sizing and change, according to the
transformation and challenges from society, with development of new technology, and they also
determine the perspective modifications [3–5]. In the academic area, education for sustainability
proposed purposes is various and implies the cognitive (critical thinking, anticipatory thinking,
metacognitive abilities), as well as the affective and ethical formation, as the university could be
considered the one which completes the formation of the human personality and accomplishes the
personality of the next generation who wants to find the different ways of living for living better [6–10].
     In the documents drawn up by the institutions of the UNESCO report and European Commission,
there are guidelines which make it possible to harmonize the systems of education and to establish some
action directions regarding the aim of sustainable development. These issues can be obtained through

Sustainability 2020, 12, 6268; doi:10.3390/su12156268                       www.mdpi.com/journal/sustainability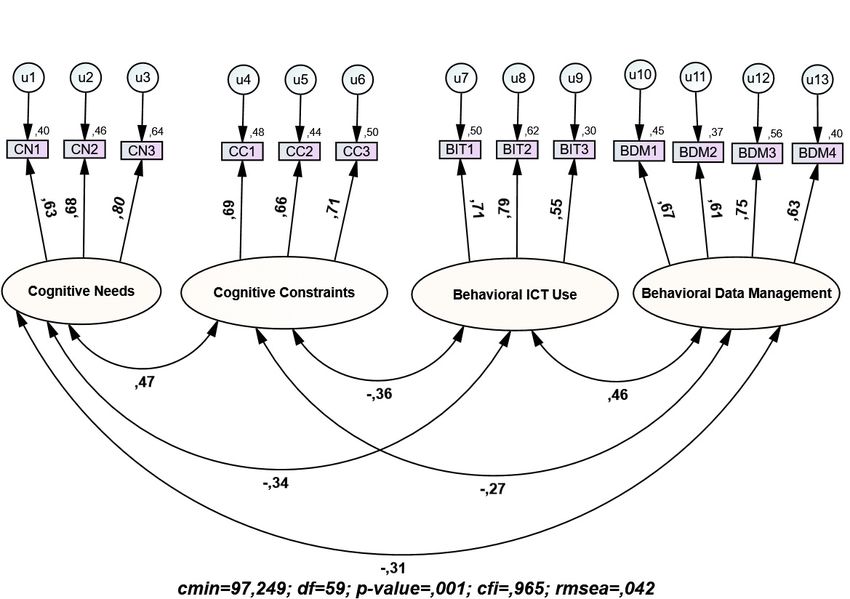
Sustainability 2020, 12, 6268                                                                         2 of 19

the ethical use of information and communication technologies (ICT) in education for preparing a
positive perspective for use with respect for limited resources and for an ethical and ecological attitude
of new technology. In the UNESCO documents, it is specified that one of the better ways to improve
quality of education is sustainable development, which must be implemented in all levels and all
social contexts [1]. All these reports underline important issues such as: the progress for realizing
lifelong learning and education for all, the balance between fairness and excellence in education,
training of people for ICT master and use, enhance the use of enabling technologies in particular
ICT [11,12]. This document [1] underlines the necessity of developing cross-cutting competence
(transversal competence) as: systems thinking competency, integrated problem-solving competency,
and normative competency, which is the ability to transform the value in action. These competences are
represented as an aggregate of information, cognitive skills and attitudes of learning contexts with ICT
tools [13–15] and became an important part of delivering the modern university curriculum for training
in all fields, but especially for teacher education [9,16]. The actual curriculum is combined between
pedagogical approaches [17] and ethical competences regarding using ICT by university teachers and
they are the powerful factor for transforming the next generation for sustainable development [2].
We note that between these complex competences, there is also a complex digital competence training
involving the adaptation of a certain epoch, where most of the activities are carried out through
assistance with technical means [6,18].
      We could notice that the experts took into consideration the necessity of training skills to
work with technology and they have the ability to integrate it into their training and life with the
appropriate values and skills needed for effective human–machine collaboration in life [9,19], learning
and teaching [5,17,20], work [11,21], and for sustainable development [12]. The developments of
ICTs are a high impact for functionality of computer programs in an informational society and for
sustainability of environments [22,23]. The key competences should be formed through both initial and
continuous training for teachers [5,15] and the university teachers increase the academic achievement
of students [6] and positive and responsible attitude for using electronically tools [17]. This involved
adapting university education through curricular reform and continuous training of those who
can be actors of the university education: teachers, students, and others academic persons [14,24].
Implementation of ICT in educational settings such as universities could bring out the pedagogical
point of view with some question marks: “what is the added value of technology in learning?; What
is ethical and unethical use of ICT? [4,11,25–27]. This is a challenge for social, cultural level and
supposes an ethical attitude [10,28,29]. Regarding the moral attitude of using ICT, the dishonesty is
considerable high in the academic field [22,26,27,30–32]. With the advance of computer technology,
the terms of the moral field involved new concepts in addition to cheating and plagiarism [26,27,30,33].
The terminology is changing and it refers to ethics of computer use and are very important issues for
legacy, for respect of power and functionality of computer programs in an informational society and for
sustainability of environments [22,23]. The most important challenges for ethical attitude of technology
use in university are [34]: digital identity in education, critical and judicious use of information,
ICT-related abuse and online security and privacy, in school and family contexts, intellectual property
in this context, dissemination of information and the sharing of knowledge on the Internet.
      The university must discover and proactively identify this process to increase academic integrity
through strict procedures and punishments and, at the same time, develop the culture of academic
responsibility and good faith for using virtual tools [33]. In a document of research “Mapping major
changes to education and training in 2025”, Stoyanov et al. [35] declared that in the future (next 5 years),
the major changes in the education field will be in rapport between formal and informal training and
integration of learning styles with the new technologies and how to deliver these information [17].
These challenges for pre-service and in-service professional training determined very different attitudes
from positive, such as enthusiasm, enjoyment, satisfaction, flow [36,37] to anxious—stress, frustration,
fear, experience feeling of discomfort [6,14,38,39]. This attitude about innovation in the technology
field influences the educational process at cognitive or moral levels and the use of ICT depends on this
Sustainability 2020, 12, 6268 3 of 19
attitude for using electronical tools [5,6,13,14,24,25,40]. Charki et al. [41] proposed, as a sustainable
and mitigating solution, the legal intervention by influencing the cost-benefit analysis in determining
the decision to commit unethical use of information technology.
The examination indicated that the existing studies only tackled ethical attitudes, identifying
challenges in ICT usage and teaching practices by university teachers. None of the mentioned studies
have employed the factor analysis methodology to develop and validate a common scale for ICT
ethical attitude factors. Drawing from the above, this study develops and validates a scale to measure
university teachers’ ethical attitude towards ICT usage. A measurement and structural model are
proposed according to the literature and the hybrid factor analysis methodology (is traced. This
research is innovative, since it includes both a partial least square (PLS-SEM) and a covariance-based
SEM (CB-SEM) approach using different software, to develop and validate the suggested model.
Finally, group-based differences (gender, age, specialization, and frequency of IT use) are examined
across the four extracted factors of university teachers’ ICT ethical attitude.
2. Theoretical Background
2.1. Attitude Towards Unethical Information Technology Use
Attitude significantly affects a person’s intention to behave ethically or unethically [42]. Defining
the notion of attitude towards the unethical use of information technology is difficult, as there
is confusion and lack of clarity in regards to the conceptualizing of ethics in the field of digital
resources [43]. If, at a general level, the attitude refers to “the evaluation by the individual of how
favorable an unfavorable act is” [44], in a specific aspect, the attitude towards the unethical information
technology use aims at the appreciation by the individual of what is right or wrong in the case of digital
instruments vehicles. The unethical information technology use (UITU) is defined by Chatterjee [45]
as “the violation of privacy, property, accuracy, and access of any individual, group, or organization
by any other individual, group, or organization”. Privacy, accuracy, property, and access are the
four ethical aspects of the information age discovered by Mason [46]. Other authors [47] identified
five main factors of attitudes towards computer use: ownership, access, motivation, responsibility,
and confidentiality.
The ethical attitude towards UITU is dynamic, because it depends on “the evaluated situation
and changes as society changes” [48]. The formation of the attitude towards the use of information
technology depends on many factors, both internal, which concern the personal values, the system of
beliefs, as well as external, which refer to the social environment, the legal environment, etc. Therefore,
it is very important to explore these attitudes over time to observe that the factors influencing their
formation could change. As a result of the increasingly frequent use of information technology in the
academic environment, it is all the more important to investigate the ethical attitudes of teachers.
2.2. Unethical Attitudinal Model in the Context of IT Use
The attitude depends on the individual characteristics of the people, on the moral development [49],
on the beliefs of the individual, or on the judgments regarding the ethics of an act [50]. Two basic
theories of attitudes have been harnessed to create the new model of unethical attitude towards the
UITU: the technology acceptance model [51] and the cognitive-affective model [52]. At the base of the
elaboration of the new approach is the model of acceptance of the technology, according to which the
attitude is influenced by the beliefs of a person regarding the utility of the technology and the ease
of use.
The cognitive component of the ethical attitude is an evaluation of concrete situations in higher
education, which is the belief or disbelief of the teacher about the use of information technology. From
a cognitive point of view, the attitude includes a storage section in which an individual organizes
useful information on ethical aspects of the use of technological resources. The affective component
is the emotional response manifested by pleasure or displeasure regarding the ethical aspects ofSustainability 2020, 12, x FOR PEER REVIEW 4 of 20
with the cognitive process. As Agarwal and Malhotra [53] pointed out, emotions and faith-based
evaluative judgment are mixed to obtain an integrated model of attitude. The behavioral component
involves the
Sustainability favorable
2020, 12, 6268 or unfavorable response regarding the action of ethical use of information 4 of 19
technology. Jain [54] emphasized that the degree of consistency is different in the occurrence of
attitude responses. At the behavioral level, the intention of ethical use of information technology
using information
comprises technology. The
two sub-components: on attitude towards
the one hand, unethical
it aims informationoftechnology
at the acquisition information use cannot be
technology,
determined by simply identifying the beliefs, because the emotion
and on the other hand, it refers to the transmission and manipulation of data. works simultaneously with the
cognitive
At the process.
base ofAs theAgarwal andmodel
theoretical Malhotra [53]attitude
of the pointedtowards
out, emotions and faith-based
the unethical evaluative
use of information
judgment are mixed to obtain an integrated model of attitude. The behavioral component
technology are the three components, cognitive, affective, and behavioral. The behavior of university involves the
favorable or unfavorable response regarding the action of ethical use of information
teachers regarding the use of information technology is determined by the level of training and technology. Jain [54]
emphasized that
development the degree
of each of consistency
component is different
of attitudes, as wellinasthethe
occurrence of attitude
correlation responses.
and articulation ofAt the
these
behavioral
components. level, the intention of ethical use of information technology comprises two sub-components:
on the one hand, it aims at the acquisition of information technology, and on the other hand, it refers to
theMaterials
3. transmission and manipulation of data.
and Methods
At the base of the theoretical model of the attitude towards the unethical use of information
3.1. Researchare
technology Model
the three components, cognitive, affective, and behavioral. The behavior of university
teachers regarding the use of information technology is determined by the level of training
The development of the model was based on experimental validated theoretical concepts
and development of each component of attitudes, as well as the correlation and articulation of
developed in other research [55]. A four-dimensional model (Figure 1) was proposed for this
these components.
research. The attitude was measured using a multidimensional construct (first and second order)
with four specific
3. Materials dimensions of first order, which were manifestations of it. The multidimensional
and Methods
and hierarchical representation of university teachers ' attitude towards the UITU is primarily based
on
3.1.theoretical
Research Modelarguments, as outlined in the previous paragraphs.
The new model is analyzed in correlation with the factors that influence the attitude towards the
The development of the model was based on experimental validated theoretical concepts developed
unethical use of information technology. Regarding the unethical use of information technology in
in other research [55]. A four-dimensional model (Figure 1) was proposed for this research. The
the academic environment, the attitude of university teachers is influenced by a number of individual
attitude was measured using a multidimensional construct (first and second order) with four specific
factors, such as gender, age, but also by a number of external factors, such as the specialization,
dimensions of first order, which were manifestations of it. The multidimensional and hierarchical
scientific title, academic degree, the frequency of use of information technology during the courses
representation of university teachers ’ attitude towards the UITU is primarily based on theoretical
and seminars.
arguments, as outlined in the previous paragraphs.
Figure 1.
Figure (Un)Ethical attitudinal
1. (Un)Ethical attitudinal model
model in
in the
thecontext
context of
ofinformation
information and
andcommunication
communication technologies
technologies
use by university teachers.
use by university teachers.
The new model is analyzed in correlation with the factors that influence the attitude towards the
unethical use of information technology. Regarding the unethical use of information technology in the
academic environment, the attitude of university teachers is influenced by a number of individualSustainability 2020, 12, 6268 5 of 19
factors, such as gender, age, but also by a number of external factors, such as the specialization,
scientific title, academic degree, the frequency of use of information technology during the courses
and seminars.
3.1.1. Gender
Several authors [22,56–65] have observed that gender, as an individual factor, could be an important
indicator of the ethical attitude regarding the use of information technology. The results of the studies
showed that the female subjects adopted a more ethical attitude when using information technology than
the male ones. According to the results of the research conducted by Akdemir et al. [66], the probability
of the occurrence of ethical behaviors in virtual environments is higher in men than in women, as
opposed to the real environment, in which no difference was found. There are studies [15,67,68] that
have shown that gender does not have a significant influence on ethical behaviors.
3.1.2. Age
In some research [56,69,70], it has been shown that age is an important factor in ethical decision
making and that older people are less influenced by external factors. The results of some studies [71]
have shown that there is no interaction between age and ethical use of information technology.
3.1.3. Specialization
The ethical response at the cognitive, affective, and behavioral level may be different for university
teachers depending on their specialization. There are studies [25,58,60,72,73] in the field of the use
of information technology that have explored the influence of specialization on ethical attitude or
behavior. The analysis of previous research has led to the finding that specialization was a factor
investigated only in students in higher education. For specialization and ICT roles in teaching and
learning in university, there are positive relations between study field and computer experience [5] and
technical and humanistic domain [7,22,29,74].
3.1.4. Frequency Use of Information Technology
While the results of some studies [32,56,58,73,75,76] have shown that frequent use of information
technology influences ethical behavior, data from other studies [37] have shown that the time of using
digital resources does not influence a person’s decision-making process.
3.2. Participants
Research was carried out on the basis of the application of a questionnaire developed in the context
of thorough research on the subject of ethics. In the period July and October 2019, the questionnaire
was administered online. The questionnaire items were measured on a Likert scale with 5 degrees of
intensity (1 “total disagreement”, 7 “total agreement”). The questionnaire asked for information on the
profile of teachers (gender, age, scientific title (e.g., PhD student, assistant, lecturer, associate professor,
professor), highest academic degree (e.g., master, PhD, postdoctoral), IT usage frequency during course
(e.g., never, only a few times per semester, once per module/chapter, on each course, IT usage frequency
during seminar (e.g., never, only a few times per semester, once per module/chapter, on each course),
specialization (e.g., Arts, Communication Sciences, Economic Sciences and Business Management,
Educational Sciences, Engineering, History and Cultural Studies, Informatics, Information Technology,
Kine to therapy, Legal Sciences, Philology, Philosophy, Physical Education and Sport, Political and
Administrative Sciences, Psychology, Science, Sociology, Geography). In this study, only part of the
influence of the variable categories on the attitude of teachers on the ethics of IT use in higher education,
namely the gender category, was examined. Of the 1500 emails sent, 380 replies were received, which
were analyzed for understanding the perception of the unethical use of IT. After eliminating the
answers appreciate being outliers resulted in a working sample (N = 334). The respondents’ averageSustainability 2020, 12, 6268 6 of 19
age was 45 years old (min = 20, max = 70, stdev = 9.6) and most of them were women. Respondents’
socio-demographic characteristics are presented in Table 1.
Table 1. Respondents’ socio-demographic characteristics (N = 334).
Frequency of
Gender n% Academic Title n% Specialization n% n%
IT Use
Female 62.6% Assistant 12.0% Informatics 11.4 Very often 65.9
Education Sciences/
Male 37.4% Lecturer 36.8% 21.0 Quite often 11.7
Psychology
Associate
30.2% Philology 15.9 Pretty rare 17.1
Professor
Physical Education/ Physical
Professor 18.66% 3.9 Never 5.4
Therapy
PhD Student 2.4% Engineering 12.9
Sciences 13.5
Sociology/ Political sciences 10.5
Economics 11.1
3.3. The Survey Instrument
The initial scale comprised 35 items distributed on 4 dimensions, consistent with the ethical
attitude model towards the use of information technology (IT).
• Dimension 1: Associated with the cognitive component-needs.
• Dimension 2: Associated with cognitive component-constraints.
• Dimension 3: Associated with behavioral component-acquisition of computer technologies.
• Dimension 4: Associated with behavioral component-data management.
For the needs factor associated with the cognitive component, in Dimension 1, 17 items were
developed, of which items CN1, CN2, CN7 were adapted after Sondhi [77], the item CN5 after Gregory
and Noto [78], the CN6 item after Pérez-Rodríguez et al. [79], items CN9, CN10, CN11, CN12, CN13,
CN14, CN15, CN16, CN17 after Hashim and Hassan [80], and items CN3, CN4, CN8 are original.
For the constraints factor associated with the cognitive component, within dimension 2, 6 items were
developed, of which all items CC1, CC2, CC3, CC4, CC5, and CC6 are original. Regarding dimensions
3 and 4, the behavioral component (acquisition of information technologies and data management),
we formulated 15 items, of which the BA1, BA2, BA8, BA12 are adapted after Namlu and Odabasi [81],
items BA3, BA5, BA7, BA11, BA13, BA15 are original, the BA4 item is adapted after Hashim and
Hassan [80], the item BA6 after Ozair [82] and the items BA9, BA10, BA14 after Etter et al. [83]. Items
are renamed to BIT and BDM after the confirmation of the two factors they belong to, which are
extracted from the exploratory factor analysis.
The questionnaire was used to assess teachers’ attitudes towards the unethical use of information
technology in higher education. Information technology involved physical resources (computers,
laptops, and tablets), software resources (applications, educational software), virtual resources (web
pages, e-mail, etc.), and telecommunication services (telephone or Internet) used to store, retrieve,
transmit, and manipulate data in educational context. The completion of the questionnaire confirmed
the agreement to participate in the research. This study respects the Helsinki Declaration on the Rights
of Human Rights of Research Participants. The data were used exclusively for research purposes.
3.4. Analytical Procedures
In this research, the conditions for the applicability of multivariate analysis methods have been
verified in accordance with the recommendations in the literature [84]. The general validity testing of
the model was carried out in the framework of the SEM (structural equation modeling) approach by
applying the CFA method of comparing alternative models: A CFA model of order one (measurement
model) and a second-order CFA model (model structural). Our scale validation included also aSustainability 2020, 12, 6268 7 of 19
PLS-SEM analysis mainly because of the non normal distribution of the sample data, as suggested by
Afthanorhan [85]. That is, in the order one model, we applied two iterations of CFA, one PLS-SEM
approach, and one CB-SEM approach using different software: SmartPLS for the first and AMOS for
the latter.
The testing of the one order model one included the following tests:
• analysis of the unidimensionality and internal consistency of the measurement scale;
• the testing of convergent validity;
• the testing of discriminatory validity.
The second order model was evaluated for the purpose of identifying and characterizing the links
(associations) between the ordinal factor two and the other four factors of order one. The second-order
test was conducted with the AMOS 26.0 version using the covariance matrix as input and the maximum
verosimility method for estimating parameters.
In this study, the following indices for the quality assessment of a model are used: Tucker–Lewis
index (TLI), comparative fit index (CFI), root mean square error of an (RMSEA), and root mean
square residual (SRMR). For a model with acceptable quality, it was recommended (Ref) the following
threshold values: RMSEA ≤ 0.08, SRMR ≤ 0. 08, TLI ≥ 0.95, CFI ≥ 0.95 [84]. For the purpose of
testing the equivalence (invariance) of the model in the two groups of teachers (men and women),
the method of multi-group confirmatory (MGCFA) factorial analysis was used in a succession of test
levels. To examine for group-based potential differences cross the extracted factors, we used non
parametric methods, because of the not normally distributed data of the sample [86].
4. Results
4.1. Exploratory Factor Analysis
Before conducting the exploratory factor analysis (EFA), we performed the Kaiser–Meyer–Olkin
(KMO) test [87] to measure the sampling adequacy and the Bartlett’s test of sphericity [88] to investigate
the factorability of the data. As depicted in Table 2, KMO results of high value (almost 0.85) implied the
suitability of the data for EFA and a significant test statistic was indicated by Bartlett’s test of sphericity
(p < 0.001).
Table 2. Kaiser–Meyer–Olkin (KMO) sample adequacy test.
KMO and Bartlett’s Test
Kaiser-Meyer-Olkin Measure of Sampling Adequacy 0.844
Approx. Chi-Square 3,479,346
Bartlett’s Test of Sphericity df 703
Sig. 0.000
In the EFA, all 35 items were subjected to principal component analysis (PCA) with Promax with
Kaiser rotation. The initial analyses showed 11 factors with eigenvalue over 1, however, as depicted in
the scree plot in Figure 2, there is a break after the third component, and several items showed small
variances and close to each other.
A second iteration of EFA use was then performed and several items were removed, because they
performed communality scores below 0.4 [89,90]. Then, a third extraction cycle was performed, clearly
revealing four factors and the items performing lower than the 0.5 factor load [91] were also removed.
The final four-factor model with the remaining 14 items accounted for 62% of the total variance.
The first factor called ‘Cognitive Needs’, with an eigenvalue of 1.40, included three items. The second
factor called ‘Cognitive Constraints, with an eigenvalue of 1.30, included three items. The third factor
called ‘Behavioral ICT’, with an eigenvalue of 3.99, included three items, and the fourth factor called
‘Behavioral Data Management’, with an eigenvalue of 1.98, included four items.nability 2020, 12, x FOR PEER REVIEW 8 o
Sustainability 2020, 12, 6268 8 of 19
Figure 2. Scree plot output indicating that the data have four factors [89].
Figure 2. Scree plot output indicating that the data have four factors [89].
Table 3 below, presents the item wordings, factor loadings, eigenvalue, variance explained, and
Cronbach’s alpha for each factor. As depicted, the factor loadings ranged from 0.50 to 0.85, meaning
A second iteration ofwere
that all items EFA use
good was ofthen
measures performed
their respective factors and several
[91]. As indicated items werealphas
by Cronbach’s removed, beca
that were above the threshold value of 0.70, all factors were internally consistent and well defined by
performed communality
their items [92]. scores below 0.4 [89,90]. Then, a third extraction cycle was perform
y revealing four factors and the items performing lower than the 0.5 factor load [91] were a
Table 3. Results of exploratory factor analysis (EFA) on the 13-item ICT ethical attitude scale.
ved.
Factor/Item 1 Factor Loading Eigen Value Variance Explained Cronbach’s Alpha
The final four-factor model
CN: Cognitive
with the remaining 14 items accounted for 62% of the total varian
3.995 28.535 0.747
irst factor called ‘Cognitive
Needs
CN1
Needs’,0.805
with an eigenvalue of 1.40, included three items. The seco
r called ‘CognitiveCN2 Constraints, with 0.832 an eigenvalue of 1.30, included three items. The third fac
CN3 0.789
d ‘Behavioral ICT’, with an eigenvalue of 3.99,
CC: Cognitive
1.982
included three 14.161
items, and0.728 the fourth factor cal
Constraints
avioral Data Management’,
CC1 with0.846an eigenvalue of 1.98, included four items.
CC2 0.812
Table 3 below, presentsCC3
the item0.712 wordings, factor loadings, eigenvalue, variance explained, a
bach’s alpha for each
BDM: factor. As depicted, the
Behavioral
Data Management
1.411factor loadings 10.007 ranged from 0.709 0.50 to 0.85, mean
all items were good BDM1measures of0.776 their respective factors [91]. As indicated by Cronbach’s alp
BDM2 0.759
were above the threshold
BDM3 value of 0.7200.70, all factors were internally consistent and well defined
BDM4 0.706
items [92]. BIT: Behavioral ICT 1.298 9.274 0.783
BIT1 0.795
BIT2 0.887
Table 3. Results BIT3
of exploratory 0.660
factor analysis (EFA) on the 13-item ICT ethical attitude scale.
1 All the items are measured on a 5-point Likert scale (1: strongly disagree to 5: strongly agree).
Factor Eigen Variance Cronbach’s
Factor/Item1
Loading Value Explained Alpha
CN: Cognitive Needs 3.995 28.535 0.747
CN1 0.805
CN2 0.832
CN3 0.789Sustainability 2020, 12, x FOR PEER REVIEW 9 of 20
Sustainability 2020, 12, 6268 9 of 19
4.2. Confirmatory Factor Analysis
A PLS-SEM confirmatory factor analysis (CFA) was performed using the SmartPLS software, to
4.2. Confirmatory Factor Analysis
establish the structural validity of the scale. By examining the absolute values of skewness and
kurtosis as well asconfirmatory
A PLS-SEM the normal distribution
factor analysis of the data,
(CFA) was weperformed
observed an approximately
using the SmartPLS nonsoftware,
normal
distribution
to establish the [86]structural
cross all validity
the measured variables.
of the scale. Hence, PLS-SEM
By examining was chosen
the absolute values of forskewness
the primaryand
iteration of the confirmatory analysis mainly because it is appropriate
kurtosis as well as the normal distribution of the data, we observed an approximately non normal for non normally distributed
data [93], and
distribution is suitable
[86] for measured
cross all the complex models
variables. with numerous
Hence, PLS-SEM endogenous
was chosen andforexogenous
the primary constructs
iteration
and
of theindicator variables
confirmatory [93,94].
analysis In addition,
mainly becauseour it issample
appropriatesize exceeds
for non the recommended
normally distributedvalue
dataof[93],
50,
i.e., 10 times larger than the number of items for the most complex construct
and is suitable for complex models with numerous endogenous and exogenous constructs and indicator [95].
The [93,94].
variables EFA extractedIn addition,four-factor
our sample PLS-SEM
size exceedsmodelthecomprises
recommended of unidirectional
value of 50, i.e., predictive
10 times
relationships
larger than the between
numbereach of thefor
of items latent construct
the most that is
complex linked with
construct [95].the observed indicator [91]. PLS-
SEM Theresults
EFAsuggested
extracted afour-factor
good fit ofPLS-SEM
the model (SRMR
model = 0.075,of
comprises NFI = 0.726) according
unidirectional to the
predictive criteria of
relationships
acceptance
between each suggested in Bryne
of the latent [96], that
construct Hairisetlinked
al. [91],
with andtheKline [97]. indicator
observed In addition,
[91].byPLS-SEM
examining the
results
suggested a good fit of the model (SRMR = 0.075, NFI = 0.726) according to the criteria of acceptance
latent variable correlations, the results showed that significant correlations existed between the
factors
suggested (p < in
0.01).
Bryne [96], Hair et al. [91], and Kline [97]. In addition, by examining the latent variable
As depicted
correlations, in Figure
the results showed3,that thesignificant
loading correlations
factors’ performance
existed between comply (p < 0.01).[98]
with Awang
the factors
recommendation of at least 0.5. In addition, t values (depicted in the constructs’
As depicted in Figure 3, the loading factors’ performance comply with Awang [98] recommendation relationship paths)
and
of at pleast
values
0.5. In areaddition,
all accepted
t valuesand significant.
(depicted in theAdditionally, Table 4 depicts
constructs’ relationship that pall
paths) and composite
values are all
reliability
accepted and (CR) values areAdditionally,
significant. above 0.7, indicating
Table 4 depicts internal
that consistency
all composite[99]. All average
reliability variance
(CR) values are
extracted
above 0.7,(AVE) are above
indicating internal 0.5, indicating[99].
consistency convergent
All averagereliability
variance[100]. Finally,(AVE)
extracted the values Rho_A
are above 0.5,
reliability
indicatingcoefficients
convergent are all above
reliability 0.7,Finally,
[100]. complying with Rho_A
the values the suggestions
reliabilityofcoefficients
Dijkstra and are Henseler
all above
[101].
0.7, complying with the suggestions of Dijkstra and Henseler [101].
PLS-SEM confirmatory
Figure 3. PLS-SEM
Figure confirmatory factor
factor analysis
analysis and
and structural
structural model
model of
of the
the teachers’
teachers’ ICT
ICT ethical
ethical
attitude, with SmartPLS.
attitude, with SmartPLS.Sustainability 2020, 12, 6268 10 of 19
Table 4. Reliability, validity, and internal consistency results for the CFA SEM measurement model.
Factor/ Item CR AVE Rho_A
CN: Cognitive Needs 0.853 0.660 0.765
CN1
CN2
CN3
CC: Cognitive Constraints 0.844 0.631 0.757
CC1
CC2
CC3
BDM: Behavioral Data
0.837 0.644 0.708
Management
BDM1
BDM2
BDM3
BDM4
BIT: Behavioral ICT 0.845 0.525 0.794
BIT1
BIT2
BIT3
The discriminant validity was assessed using Fornel and Larcker [102] by comparing the square
root of each AVE in the diagonal with the correlation coefficients (off-diagonal) for each construct in the
relevant rows and columns. As depicted in Table 5, this measurement model supports the discriminant
validity between the constructs.
Table 5. Discriminant validity.
Cognitive Behavioral Data
Cognitive Needs Behavioral ICT
Constraints Management
Cognitive Needs 0.813
Cognitive
0.356 0.802
Constraints
Behavioral Data
−0.265 −0.287 0.795
Management
Behavioral ICT −0.240 −0.203 0.368 0.725
A replication of CFA was conducted based on the covariance-based SEM (CB-SEM) approach
and using the AMOS 26.0 software and the maximum likelihood estimation. The CB-SEM analysis
validated the fitness of the model: χ2/df = 1.64, probability level = 0.001, comparative fit index (CFI) =
0.965, the Tucker–Lewis fit index (TLI) = 0.946, and RMSEA = 0.042 [103–107].
However, as depicted in Figure 4, the CB-SEM CFA revealed valid scores of factor loadings (>0.05)
but several meet lower scores compared to the loadings generated through the PLS-SEM analysis.
In that case, we perceive the PLS-SEM extracted model as the more accurate one according to the
findings of Afthanorhan [85] who conducted a cooperative CBA analysis using both SmartPLS and
AMOS software and concluded that PLS-SEM path modeling using SMARTPLS is appropriate to carry
on the confirmatory factor analysis which is more reliable and valid. As the author explains, the lower
factor loading scores in the CBA output, show that the PLS-SEM method is more appropriate to
maximize the explained variance of endogenous latent constructs (dependent variable) and minimize
the unexplained variances.Sustainability 2020, 12, x FOR PEER REVIEW 11 of 20
Sustainability 2020, 12, 6268 11 of 19
Figure 4.Figure
CB-SEM confirmatory
4. CB-SEM factor
confirmatory analysis
factor of of
analysis the teachers’
the teachers’ ICT ethicalattitude
ICT ethical attitude with
with AMOS.
AMOS.
Unstandardized and standardized parameter estimates are all provided in Table 6 and are
Unstandardized and standardized parameter estimates are all provided in Table 6 and are
statistically significant at the alpha level of 0.001. The R2 values show the amount of variance of the
statistically significant
items explained by at
thethe alpha level
respective of 0.001. The R2 values show the amount of variance of the
constructs.
items explained by the respective constructs.
Table 6. Results of CFA of the 13-item ICT ethical attitude scale (Appendix A).
Table 6. Unstandarized
Results of CFA of the 13-item ICT ethical attitude scale (Appendix A1).
Standarized
Item R2 S.E. C.R. p
Estimate Estimate
Unstandarized Standarized
ItemCA14 1.000 0.635 R20.40 S.E. C.R. p
CA15 Estimate
1.560 Estimate
0.679 0.46 0.170 9.193 ***
CA17
CA14 1.529
1.000 0.799
0.635 0.400.64 0.163 9.410 ***
SA2 1.000 0.690 0.48
CA15SA3 1.560
1.000 0.679
0.663 0.460.44 0.1700.113 9.193
8.867 ******
CA17SA4 1.075
1.529 0.706
0.799 0.640.50 0.1630.119 9.032
9.410 ***
***
BA1 1.000 0.709 0.50
SA2 BA2 1.000
1.232 0.690
0.790 0.480.62 0.131 9.437 ***
SA3 BA4
BA9
0.849
1.000
1.000
0.547
0.663
0.674
0.440.30
0.45
0.1130.104 8.179
8.867 ***
***
SA4BA10 1.075
0.641 0.706
0.611 0.500.37 0.1190.072 9.032
8.930 ******
BA11 0.957 0.749 0.36 0.095 10.084 ***
BA1BA12 1.000
0.773
0.709
0.629
0.500.40 0.085 9.126 ***
BA2 1.232 *** = the 0.790 0.62
values are statistically 0.131
significance. 9.437 ***
BA4 0.849 0.547 0.30 0.104 8.179 ***
4.3.BA9 1.000
Second Order Confirmatory Analysis 0.674 0.45
BA10 0.641 0.611 0.37 0.072 8.930 ***
A second order confirmatory factor analysis (CFA) was evaluated with the AMOS 26.0 version
BA11
using the covariance0.957
matrix as input and0.749
the maximum 0.36 verosimility 0.095
method for10.084 ***
estimating parameters.
BA12
The 0.773 was conducted
second order analysis 0.629
to test whether 0.40the four0.085 9.126to a single broader
factors belonged ***
latent factor of teachers’ ICT***ethical attitude.
= the values are The second order
statistically CFA results suggested a good fit
significance.
according to the criteria suggested in Muthen and Muthen [107] and Bandalos [103], as depicted in
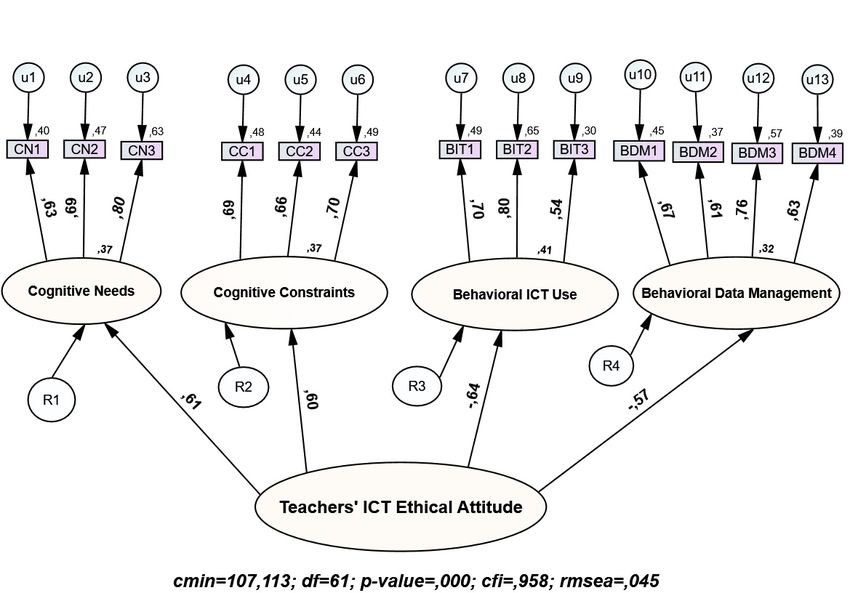
Figure 5. In particular, χ2/df = 1.75, the p value is significant, the CFI is above 0.95, and the RMSEA is
4.3. Second Order Confirmatory Analysis
below the threshold of 0.80.
A second order confirmatory factor analysis (CFA) was evaluated with the AMOS 26.0 version
using the covariance matrix as input and the maximum verosimility method for estimating
parameters. The second order analysis was conducted to test whether the four factors belonged to a
single broader latent factor of teachers’ ICT ethical attitude. The second order CFA results suggestedSustainability 2020, 12, x FOR PEER REVIEW 12 of 20
Sustainability 2020, 12, 6268 12 of 19
Figure
Figure 5. Model
5. Model diagram
diagram of the
of the 2nd2nd order
order confirmatory
confirmatory factors
factors of the
of the teachers’
teachers’ ICTICT ethical
ethical attitude.
attitude.
4.4. Group Differences
4.4. Group Differences
This study also examined the potential gender, age, specialization, and frequency of IT use
This study also examined the potential gender, age, specialization, and frequency of IT use
differences in the means scores cross the four factors. As depicted in Tables 7–10, gender showed some
differences in the means scores cross the four factors. As depicted in Tables 7–10, gender showed
significant differences in the factor of data management, while age and frequency of IT use showed a
some significant differences in the factor of data management, while age and frequency of IT use
correlation with the factors of cognitive constraints and behavioral ICT use. Specialization revealed no
showed a correlation with the factors of cognitive constraints and behavioral ICT use. Specialization
significant differences for the examined sample.
revealed no significant differences for the examined sample.
Table 7. Mann–Whitney U test, grouping variable: gender.
Table 7. Mann–Whitney U test, grouping variable: gender.
CN CC BIT BDM
CN CC BIT BDM
Mann–Whitney U 12,546,500 12,596,000 12,261,500 11,576,000
Wilcoxon WMann–Whitney U
20,421,500 12,546,500 12,596,000
20,471,000 12,261,500
20,136,500 11,576,000
33,521,000
Z Wilcoxon W−0.660 20,421,500 −0.407
20,471,000 −0.943
20,136,500 −1.984
33,521,000
Asymp. Sig. (2-tailed) 0.509 0.684 0.345 0.047
Z −0.660 −0.407 −0.943 −1.984
Asymp. Sig. (2-tailed) 0.509 0.684 0.345 0.047
Table 8. Kruskal Wallis test, grouping variable: the main field of specialization.
Table 8. KruskalCN CC
Wallis test, grouping variable: the main BIT BDM
field of specialization.
Chi-Square 10.935 8.905 6.751 8.786
CN CC BIT BDM
df 7 7 7 7
Asymp. Sig. Chi-Square
0.141 10.935 8.905
0.260 6.7510.455 8.786 0.268
df 7 7 7 7
Table 9. Spearman correlation
Asymp. Sig.test between
0.141 age and the
0.260 four factors
0.455 of university
0.268 teachers’ ICT
ethical attitude.
Age CN CC BIT BDM
Correlation Coefficient 1.000 0.064 0.144 1 −0.138 2 −0.059
Spearman’s rho Age Sig. (2-tailed) 0.243 0.009 0.012 0.282
N 334 334 332 334 334
1 Correlation is significant at the 0.01 level (2-tailed); 2 Correlation is significant at the 0.05 level (2-tailed).Sustainability 2020, 12, 6268 13 of 19
Table 10. Kruskal Wallis test, grouping variable: frequency of IT use.
CN CC BIT BDM
Chi-Square 8.850 6.287 3.386 9.077
df 3 3 3 3
Asymp. Sig. 0.031 0.098 0.336 0.028
5. Discussion
The main objective of this study was to develop and validate a scale to measure unethical attitude
towards ICT use from university teachers. The four-factor and 13 items scale that was extracted through
EFA, has been validated using a hybrid approach mainly because of the non normal distribution found
in the data. Results interestingly indicate that a PSL-SEM CFA produced the best fit to the model, in
terms of factor loadings, while the CB-SEM approach generates a good model fit, however, scoring
lower values of factor loadings.
The findings are in accordance with the work of Afthanorhan [85] who predicted for this issue
since most the value of factor loading obtained in CB-SEM was lower than PLS-SEM even author
use the same scales when apply the unidimensionality procedure. As explained, PLS-SEM is more
appropriate for a CFA where not normal distributions are met and also, its application is aimed to
maximize the explained variance of the endogenous latent constructs and minimize the unexplained
variances. Contrarily, the CB-SEM approach is used to evaluate focuses on goodness of fit, which
is focusing on minimization of the discrepancy between the observed covariance matrix and the
estimated covariance matrix [91]. For this reason, its application suggests that the prior theory is strong.
Similar to, in our, the value of factor loadings/outer loadings in PLS-SEM is better than CB-SEM CFA
for the university teachers’ attitude towards the ethical attitude of ICT.
As expected, the second order model, implemented via a CB-SEM approach and the AMOS
software, revealed a good fit of the model, pertaining to the lower scores (compared to PLS-SEM
CFA) factor loadings. The final model is valid, and our results strongly suggest the implementation
of PLS-SEM CFA for the validation of the suggested model. From the group-based differences
that were examined, it was interesting that gender expressed significant differences only in one
factor (data management), while it did not show to affect any one of the four factors. This finding
is in accordance with previous works [15,67,68] that stated no significant differences towards the
unethical use of ICT between the two genders, however further investigation is needed. Another
important finding was the differences detected among different groups of ICT use frequency in the
two factors of cognitive constraints and behavioral data management. This is in accordance with
previous studies [32,56,58,73,75,76] outlining that frequent use of information technology influences
ethical behavior.
The developed and validated scale can serve as a tool to evaluate the university teachers’ ethical
attitude towards the use of digital technologies and support the development of the academic
responsibility and good faith for using virtual tools. In addition, by revealing the important items and
constructs of the scale, this study sheds light on the policies that should be made from the university
management and authorities to preserve or endorse the ethical attitude towards ICT use inside the
higher education institutions.
Adequate training of university teachers in accordance with the ethical requirements of digital
education is becoming one of the essential conditions for sustainable development. The training of
the future teachers or professionals should be done in the light of sustainable development [1,11,12],
with the emphasis on the formation of ethical attitudes towards the use of ICT. In this way, the digital
resources will be used efficiently in accordance with human and environmental needs, both now and
in the future. The manifestation of an appropriate ethical attitude towards the use of information
technology indicates responsibility on the part of teachers and students in the academic environment.Sustainability 2020, 12, 6268 14 of 19
6. Conclusions
This study brings theoretical and practical contributions by developing and validating a scale to
measure unethical attitude towards ICT use from university teachers. The ethical attitudinal model in
the context of information technology use by university teachers provides the conceptual basis for
understanding the cognitive, affective, and behavioral components involved in the moral positioning
towards the integration of new technologies. The four-factor generated model revealed a good fit,
demonstrating that cognitive needs and constraints as well as behavioral ICT use and data management
are adequate components to measure the university teachers’ (un)ethical attitude towards the use of
technology. The resulted 13 items showed valid factors loadings and high values of consistency and
reliability through both CFA procedures (PLS-SEM and CB-SEM), reinforcing the validity of the model.
A number of limitations of the study can be highlighted. The generalization of results is not possible
due to the specific context and the small number of university teachers who participated in the study.
Nevertheless, research efforts should be expanded on testing and the scale in a variety of educational
contexts or countries in order to enhance its robustness and flexibility. Another limitation of the research
derives from the small number of items obtained from the statistical processing of the data, rendering
possible difficulties to future researchers if item elimination is needed in their adjusted studies.
A future research direction will be to expand the research group to investigate the attitude towards
the ethical use of information technology and among students, master students, and doctoral students.
The application of the validated instrument on a sample of teachers from the pre-university education
system would contribute to the comparative analysis of teachers’ attitudes. In addition, further factors
can be examined, like for instance, personality traits or social influence regarding the use of ICT. Along
with these future research directions, two important components will be developed at the level of
educational practice in the academic space. On the one hand, the emphasis will be on the training
component of university teachers in the context of the ethical use of information technology. On the
other hand, the introduction of the ethical component of the use of information technology at the level
of the curriculum in higher education will be pursued.
Author Contributions: Conceptualization, L.M. and O.C.; methodology, K.T.; software, K.T.; validation, K.T.;
formal analysis, K.T.; investigation, L.M. and O.C.; resources, L.M.; data curation, K.T.; writing—original draft
preparation, L.M., O.C. and K.T.; writing—review and editing, L.M.; visualization, O.C.; supervision, L.M.; project
administration, L.M.; funding acquisition, L.M. All authors have read and agreed to the published version of
the manuscript.
Funding: This research was funded by a grant of Ministry of Research and Innovation, CNCS - UEFISCDI, project
number PN-III-P1-1.1-TE-2016-0773, within PNCDI III.
Conflicts of Interest: The authors declare no conflict of interest.
Appendix A
Table A1. Scale of attitudes towards the unethical use of information technology.
Totally Partially Partially Totally
Type Items Neutral
Disagree Disagree Agree Agree
Cognitive needs
CN1 It is necessary to select retransmitted messages.
Attribution of authorship, without his permission, violates
CN2
the ethical rules of using IT.
Distributing information in online environment without
CN3
indicating the source violates ethical rules for the use of IT.
Cognitive Constraints
The teacher must check whether or not the students use
CC1
information technology ethically.
The guide on the ethical aspects of using IT is explained to
CC2
students before starting activities.
Sanctions are required for non-compliance with the ethical
CC3
use of IT by students.Sustainability 2020, 12, 6268 15 of 19
Table A1. Cont.
Totally Partially Partially Totally
Type Items Neutral
Disagree Disagree Agree Agree
Behavioral ICT use
BIT1 "Crack" programs can be used to purchase and process data.
An unlicensed educational software can be used in current
BIT2
educational activities.
Images and content in the online environment may be used
BIT3 in current educational activities without the permission of
the authors.
Behavioral Data Management
Phrases can be processed from an online source, in research
BDM1
work, without mentioning the source.
Papers can be purchased online and presented as original, if
BDM2
the form in which they are presented changes.
It is not necessary to specify all the sources from where the
BDM3
information was taken, in the elaboration of a course support.
A digital tool (eg software) can be presented to others as
BDM4
original if minor changes are made to the interface.
References
1. Education for Sustainable Development Goals. Learning Objectives. Available online: http://unesdoc.unesco.
org/images/0024/002474/247444e.pdf (accessed on 14 November 2019).
2. Zamora-Polo, F.; Sánchez-Martín, J. Teaching for a Better World. Sustainability and Sustainable Development
Goals in the Construction of a Change-Maker University. Sustainability 2019, 11, 4224. [CrossRef]
3. Gibbs, G.; Coffey, M. The impact of training of university teachers on their teaching skills, their approach to
teaching and the approach to learning of their students. Act. Learn. High. Educ. 2004, 5, 87–100. [CrossRef]
4. Lennie, S. Ethical Complexities in the Virtual World: Teacher Perspectives of ICT Based Issues and Conflicts.
Ph.D. Thesis, Department of Curriculum, Teaching and Learning, Ontario Institute for Studies in Education,
University of Toronto, Toronto, ON, Canada, 2013.
5. Liaw, S. An Internet survey for perceptions of computers and the World Wide Web: Relationship, prediction,
and difference. Comput. Hum. Behav. 2002, 18, 17–35. [CrossRef]
6. Celik, V.; Yesilyurt, E. Attitudes to technology, perceived computer self-efficacy and computer anxiety as
predictors of computer supported education. Comput. Educ. 2013, 60, 148–158. [CrossRef]
7. Clipa, O.; Colomeischi, A. University Teaching—The Use of Social Media in Teacher Education. In Web 2.0 in
Education and Politics: The Social Media Revolution; Pătrut, , M., Pătrut, , B., Eds.; Lambert Academic Publishing:
Saarbrücken, Germany, 2013; pp. 187–203.
8. Bullough, R.V., Jr. Ethical and moral matters in teaching and teacher education. Teach. Teach. Educ. 2011, 27,
21–28. [CrossRef]
9. Maisiri, E. Information ethics and use of social media in higher education: Faculty member’s perspectives.
Libr. Inf. Sci. Publ. 2013, 47, 44–69.
10. Miñano, R.R.; Uribe, D.; Moreno-Romero, A.; Yáñez, S. Embedding Sustainability Competences into
Engineering Education. The Case of Informatics Engineering and Industrial Engineering Degree Programs
at Spanish Universities. Sustainability 2019, 11, 5832. [CrossRef]
11. Artificial Intelligence in Education: Challenges and Opportunities for Sustainable Development. Available
online: https://unesdoc.unesco.org/ark:/48223/pf0000366994 (accessed on 16 November 2019).
12. Issues and Trends in Education for Sustainable Development. Available online: http://unesdoc.unesco.org/
images/0026/002614/261445e.pdf (accessed on 14 November 2019).
13. Abdullah, F.; Ward, R. Developing a General Extended Technology Acceptance Model for E-Learning
(GETAMEL) by analyzing commonly used external factors. Comput. Hum. Behav. 2016, 56, 238–256.
[CrossRef]
14. Cazan, A.-M.; Cocoradă, E.; Măican, C.I. Computer anxiety and attitudes towards the computer and the
internet with Romanian high-school and university students. Comput. Hum. Behav. 2016, 55, 258–267.
[CrossRef]
15. Marcial, D.E. ICT social and ethical competency among teacher educators in the Philippines. Inf. Technol.
Learn. Tools 2017, 57, 96–103. [CrossRef]Sustainability 2020, 12, 6268 16 of 19
16. Paechter, M.; Maier, B.; Macher, D. Students’ expectations of, and experiences in e-learning: Their relation to
learning achievements and course satisfaction. Comput. Educ. 2010, 54, 222–229. [CrossRef]
17. Lozano, R.; Merrill, M.Y.; Sammalisto, K.; Ceulemans, K.; Lozano, F.J. Connecting Competences and
Pedagogical Approaches for Sustainable Development in Higher Education: A Literature Review and
Framework Proposal. Sustainability 2017, 9, 1889. [CrossRef]
18. Ahrens, A.; Zaščerinska, J.; Melnikova, J.; Ramar, H.; Clipa, O.; Andreeva, N. Use of Webinars in Higher
Education: A Comparative Study of Educators’ Experience. In Applied Research in Studies and Practice,
Proceedings of the III International Scientific Practical Conference “Trends in Science and Studies Under Conditions of
Globalisation” Scientific Articles; Panevėžio Kolegija: Panevėžys, Lithuania, 2015; Volume 11, pp. 22–30.
19. Shroder, J.; Sautier, L.; Kriston, L.; Berger, T.; Meyer, B.; Spath, C.; Kother, U.; Nestoriuc, Y.; Klein, J.P.; Moritz, S.
Development of a questionnaire measuring Attitudes towards Psychological Online Interventions–the APOI.
J. Affect. Disord. 2015, 187, 136–141. [CrossRef] [PubMed]
20. Digital Education at School in Europe. Available online: https://eacea.ec.europa.eu/national-policies/
eurydice/content/eurydice-brief-digital-education-school-europe_en (accessed on 23 March 2020).
21. Future of Work. Future of Society, European Group on Ethics in Science and New Technology. Available
online: https://ec.europa.eu/info/publications/future-work-future-society_en (accessed on 23 March 2020).
22. Akbulut, Y.; Uysal, O.; Odabaşi, H.F.; Kuzu, A. Influence of gender, program of study and PC experience on
unethical computer using behaviors of Turkish undergraduate students. Comput. Educ. 2008, 51, 485–492.
[CrossRef]
23. Rodríguez-García, A.-M.; López, B.J.; Agreda, M.M.; Moreno-Guerrero, A.-J. Productive, Structural and
Dynamic Study of the Concept of Sustainability in the Educational Field. Sustainability 2019, 11, 5613.
[CrossRef]
24. Sharma, S.K.; Chandel, J. Technology acceptance model for the use of learning through websites among
students in Oman. Int. Arab J. Inf. Technol. 2013, 3, 44–49.
25. Jamil, M.; Tariq, R.; Shah, J.H. Ethical attitudes towards the use of computer and information technology. Int.
Res. J. Arts Soc. Sci. 2013, 2, 72–78.
26. Kuzu, A. Problems related to computer ethics: Origin of the problems and suggested solutions. Turk. Online
J. Educ. Technol. 2009, 8, 91–110.
27. Mellar, H.; Peytcheva-Forsyth, R.; Kocdar, S.; Karadeniz, A.; Yovkova, B. Addressing cheating in e-assessment
using student authentication and authorship checking systems: Teachers’ perspectives. Int. J. Educ. Integr.
2018, 14. [CrossRef]
28. Li, N.; Kirkup, G. Gender and cultural differences in Internet use: A study of China and the UK. Comput.
Educ. 2007, 48, 301–317. [CrossRef]
29. Pinar, R.I.; Cakirel, Y.; Toker, K. The ethical behavior of academics regarding informatics: A comparative
assessment between state and foundation universities. Procedia Soc. Behav. Sci. 2013, 75, 542–552. [CrossRef]
30. Husain, F.M.; Al-Shaibani, G.K.S.; Mahfoodh, O.H.A. Perceptions of and Attitudes toward Plagiarism and
Factors Contributing to Plagiarism: A Review of Studies. J. Acad. Ethics 2017, 15, 167–195. [CrossRef]
31. McCabe, D.L. It takes a village: Academic dishonesty & Educational Opportunity. Lib. Educ. 2005, 91, 26–31.
32. Underwood, J.; Szabo, A. Academic offences and e-learning: Individual propensities in cheating. Br. J. Educ.
Technol. 2003, 34, 467–477. [CrossRef]
33. Akin, I.; Johnson, E. Cultivating Academic Integrity in a Digital Learning Environment. Int. J. Digit. Soc.
2018, 9, 1359–1366. [CrossRef]
34. Cheung, S.K.S. Information Security Management for Higher Education Institutions. In Intelligent Data
Analysis and Its Applications; Pan, J.S., Snasel, V., Corchado, E., Abraham, A., Wang, S.L., Eds.; Volume I;
Advances in Intelligent Systems and Computing; Springer: Cham, Switzerland, 2014; Volume 297, pp. 11–19.
[CrossRef]
35. Stoyanov, S.; Hoogveld, B.; Kirschner, P. Mapping Major Changes to Education and Training in 2025. In
JRC Technical Note JRC59079; Redecker, C., Punie, Y., Eds.; Publications Office of the European Union:
Luxembourg, 2010; pp. 1–52. Available online: https://www.researchgate.net/deref/http%3A%2F%2Fipts.jrc.
ec.europa.eu%2Fpublications%2Fpub.cfm%3Fid%3D3419 (accessed on 15 November 2019).
36. Cheng, Y. Effects of quality antecedents on e-learning acceptance. Internet Res. 2012, 22, 361–390. [CrossRef]
37. Park, E.J. The development and implications of a case-based computer program to train ethical
decision-making. Nurs. Ethics 2013, 20, 943–956. [CrossRef]You can also read