Determinants of Serum Immunoglobulin Levels: A Systematic Review and Meta-Analysis - Frontiers
←
→
Page content transcription
If your browser does not render page correctly, please read the page content below
SYSTEMATIC REVIEW
                                                                                                                                            published: 07 April 2021
                                                                                                                                   doi: 10.3389/fimmu.2021.664526

                                          Determinants of Serum
                                          Immunoglobulin Levels: A Systematic
                                          Review and Meta-Analysis
                                          Samer R. Khan 1,2, Anna C. van der Burgh 1,3, Robin P. Peeters 1,4, P. Martin van Hagen 2,5,
                                          Virgil A. S. H. Dalm 2,5 and Layal Chaker 1,4*
                                          1 Department of Epidemiology, Erasmus University Medical Center, Rotterdam, Netherlands, 2 Department of Internal

                                          Medicine, Division of Clinical Immunology, Erasmus University Medical Center, Rotterdam, Netherlands, 3 Department of
                                          Internal Medicine, Division of Nephrology, Erasmus University Medical Center, Rotterdam, Netherlands, 4 Department of
                                          Internal Medicine, Division of Endocrinology, Erasmus University Medical Center, Rotterdam, Netherlands, 5 Department
                                          of Immunology, Erasmus University Medical Center, Rotterdam, Netherlands

                           Edited by:
                                Rui Li,   Background: An up-to-date overview of determinants of serum immunoglobulins in
           University of Pennsylvania,    adults is pivotal for clinical practice and research, but currently lacking. We therefore
                         United States
                                          performed a systematic review and meta-analysis to identify determinants of serum
                      Reviewed by:
                       Hanane Touil,      immunoglobulin levels.
   Columbia University Irving Medical
                                          Methods: Embase, Web of Science, Medline, Cochrane, and Google Scholar were
              Center, United States
                         Hongwei Xu,      searched from inception to July 11th, 2019 for articles reporting on determinants of serum
    Harbin Medical University, China      immunoglobulin A, G or M (IgA, IgG or IgM) in adult humans. Random and fixed effect
                  *Correspondence:        models were applied to obtain pooled mean differences (MDs) and 95% confidence
                        Layal Chaker
              l.chaker@erasmusmc.nl       intervals (CIs) for the association of age and sex with serum immunoglobulins.
                                          Results: We retrieved 117 articles reporting on determinants of serum immunoglobulins,
                  Specialty section:
        This article was submitted to
                                          of which 28 could be meta-analyzed. Older compared to younger individuals had higher
                         Inflammation,     IgA (MD: 0.38; CI: 0.18 – 0.58), but lower IgM levels (MD: -0.40; 95%: -0.66 – -0.14). Men
              a section of the journal    had higher IgA (MD: 0.22; CI: 0.03 – 0.42), but lower IgM levels (MD: -0.21; CI: -0.32 –
             Frontiers in Immunology
                                          -0.10) than women. Age and sex did not influence IgG. Caucasian ethnicity was
        Received: 05 February 2021
         Accepted: 19 March 2021          associated with lower IgA, IgG, and IgM. Smoking and corticosteroid use were
          Published: 07 April 2021        associated with lower IgG. Positive associations were reported of probiotics with IgG,
                          Citation:       alcohol with IgA, hypertension with IgA and IgG, and acute psychological stress with IgA,
       Khan SR, van der Burgh AC,
        Peeters RP, van Hagen PM,
                                          IgG, and IgM.
   Dalm VASH and Chaker L (2021)          Conclusions: Older age and male sex are associated with higher IgA, but lower IgM, and
             Determinants of Serum
Immunoglobulin Levels: A Systematic       urge investigation of age- and sex-specific reference ranges of immunoglobulins. Other
         Review and Meta-Analysis.        identified determinants were ethnicity, diet, lifestyle and cardio-metabolic factors.
        Front. Immunol. 12:664526.
  doi: 10.3389/fimmu.2021.664526          Keywords: serum immunoglobulins, adult human beings, determinants, systematic review, meta-analysis

Frontiers in Immunology | www.frontiersin.org                                    1                                          April 2021 | Volume 12 | Article 664526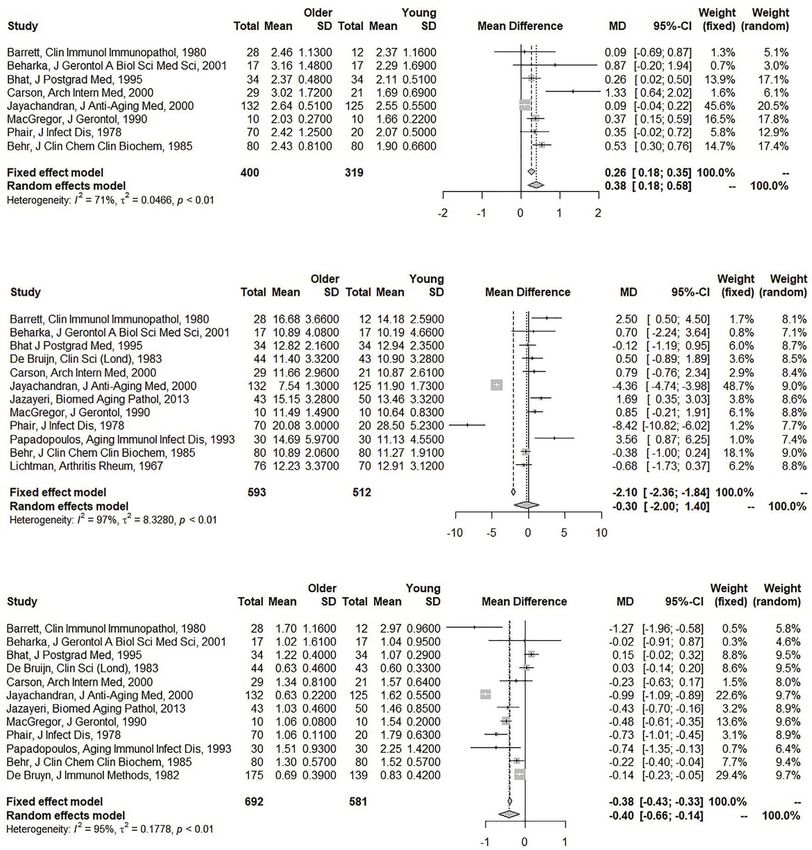
Khan et al.                                                                                                 Determinants of Serum Immunoglobulins

INTRODUCTION                                                               human beings. The definition of a determinant was deliberately
                                                                           kept broad and encompassed a variety of factors, such as
Serum immunoglobulins are part of the adaptive immune system               demographic features, lifestyle related factors, and
and comprise five classes, including immunoglobulin A, G, and               interventions. No language or date restrictions were applied
M (IgA, IgG, and IgM). IgM provides a rapid immune response                during the search.
and is involved in tissue homeostasis, whereas IgG and IgA are                 We included all study types with the exception of case series,
long-lasting high-affinity antibodies, the latter mainly providing          case reports, and conference papers. Relevant reviews were
mucosal immunity (1). Immunoglobulin measurements are used                 included to screen the reference list for potential additional
for diagnosis and monitoring of various diseases, including                articles of interest. We excluded articles performed solely in a
primary immunodeficiencies and autoimmune diseases.                         specific patient population (e.g. studies that correlated specific
Reference ranges of immunoglobulins are based on the 2.5th                 diseases or treatments to serum immunoglobulin levels),
and 97.5th percentiles in healthy adults. However, several                 genetic or family studies, studies conducted in pregnant or
potential determinants of serum immunoglobulins, including                 lactating women, and studies focusing on rare occupational
age and sex, are not generally considered in the interpretation of         exposures as determinant, as these would limit extrapolation
immunoglobulin levels.                                                     of results to the general adult population. A detailed search
    Aging is associated with an increased ratio of memory to               strategy and full in- and exclusion criteria can be found in the
naive B-cells (2), which may lead to lower IgM and higher IgA              Supplementary Material.
and IgG levels in older compared to younger individuals (3).
Furthermore, previous population-based studies have                        Study Selection, Data Extraction, and
demonstrated lower IgG (4, 5) and IgM (4), but higher IgA (4,              Quality Assessment
5) levels in men compared to women. Among others, body                     Titles and abstracts of the retrieved articles were screened in
mass index (BMI) and lifestyle related factors such as alcohol             Endnote based on predefined in- and exclusion criteria
consumption and smoking may impact serum immunoglobulin                    (Supplementary Material). Similarly, full text articles were
levels as well (6, 7).                                                     screened and if full texts were not available, we contacted first
    However, studies performed thus far have various limitations,          authors. We used a predefined data extraction form to extract
limiting interpretability for the general population. Most studies         relevant information of included studies on study design and
were cross-sectional (3–7), had a small sample size (3, 5), did not        setting, participants, included determinants, immunoglobulin
adjust for possible confounders (4, 5, 7), or had conflicting results       assessment and serum levels, and study quality. For cross-
(3, 6, 7). The last overview of factors possibly influencing serum          sectional studies an adapted version of the Newcastle Ottawa
immunoglobulin levels dates back to 1976 (8). However, this                Scale was used, as previously described by Modesti et al. (9). The
review only described a limited number of determinants, was not            Cochrane risk of bias tool was implemented for (non)
performed in a systematic manner, and additional literature has            randomized controlled clinical trials (RCTs), whereas we used
been published since.                                                      the NIH quality assessment tool for before-after studies (10, 11).
    In this systematic review and meta-analysis, we aim to                 Screening and extraction were performed by two independent
provide an overview of determinants of serum IgA, IgG, and                 reviewers (SRK, ACB) and discussed with a third reviewer (LC)
IgM for adequate interpretation of immunoglobulin levels in                in case of disagreement.
clinical practice. This could aid in defining different reference
ranges for certain populations, thus changing the universal cut-           Meta-Analyses
off, which is currently applied to all adults. Our overview                When ≥2 comparable studies assessed the association of a certain
of determinants can furthermore facilitate selection of                    determinant with immunoglobulins, and when means and
potential confounders and mediators in immunoglobulin-                     standard deviations (SDs) were provided or could be calculated
related research.                                                          and converted to grams per liter (g/l) based on the given
                                                                           information, we included these in subsequent meta-analyses.
                                                                           Both random (DerSimonian-Laird) and fixed effect models were
METHODS                                                                    used to pool mean differences (MDs) and 95% confidence
                                                                           intervals (CIs), and the random effect models were reported as
This systematic review and meta-analysis was performed in                  main results. Pooled results were shown in forest plots, and an I2
accordance with the Preferred Reporting Items for Systematic               statistic was calculated for heterogeneity. Publication bias was
Reviews and Meta-Analyses (PRISMA) guidelines. We have                     assessed through funnel plots and the Egger test. All analyses
provided the PRISMA checklist in Supplementary Table S1.                   were performed in R [metacont and metafor packages, R-project,
                                                                           The R Foundation for Statistical Computing (2019),
Search and Eligibility Criteria                                            version 3.5.3].
We searched Embase, Web of Science, Medline, Cochrane, and
Google Scholar from inception to July 11th, 2019 with the help of          Sensitivity and Stratified Analyses
the Erasmus MC medical library, for articles reporting on the              We performed predefined sensitivity analyses by excluding
association between specific determinants (i.e. factors that                outliers in the funnel plots and stratification analyses by mean
influence) and serum levels of IgA, IgG, or IgM in adult                    publication year, ethnicity, World Health Organization (WHO)

Frontiers in Immunology | www.frontiersin.org                          2                                   April 2021 | Volume 12 | Article 664526
Khan et al. Determinants of Serum Immunoglobulins
region, and older vs younger age groups provided that these were 18, 26, 28, 31, 33, 35, 39, 43, 44, 48, 51–54, 56–64). Most studies
possible based on the retrieved information. reported lower IgM levels in men compared to women (6, 15, 19,
24, 28, 31, 33–35, 39, 40, 42, 43, 48, 54, 57, 60, 61).
Twenty-eight studies reporting on age and/or sex were
suitable for inclusion in the meta-analysis (Supplementary
RESULTS Figure S1).
Study Selection Association of Diet With Serum Immunoglobulins
We identified 9742 records after removing duplicates and added The association of a dietary determinant with serum
16 articles identified through the references of retrieved reviews. immunoglobulin levels was assessed in 23 studies. The
Of these, 226 were eligible for full text screening. Finally, 117 majority reported on supplementation of a micro-/
articles were included in the systematic review and 28 could be macronutrient or probiotic (22, 29, 65–80), and few on
meta-analyzed (Supplementary Figure S1). nutritional status or fasting in relation to immunoglobulin
levels (56, 81–84).
Study Characteristics Five studies assessed the association of probiotics with serum
The included 117 articles were published between 1966 and 2019, immunoglobulins and generally found higher immunoglobulin
with sample sizes ranging between 2 and 12 373 and mean age levels (mostly IgG) after probiotic use compared to baseline
ranging between 21 and 74 years. Participants were either (Supplementary Table S2) (71–73, 78, 80). Ascorbate (vitamin
randomly drawn from the community, blood donors, or C) supplementation did not affect serum IgA and IgG, however
university/hospital employees, although population source was one study reported an increase in serum IgM (29, 66, 74, 77).
not always reported. Most studies were cross-sectional, 18 were Ramadan fasting was associated with lower IgG levels compared
RCTs, and 24 were before-after studies. Included studies were to the preceding month (83, 84). Most dietary components were
performed in Europe (n=48), Asia (n=28), North-America not or positively associated with immunoglobulin levels
(n=25), Australia (n=5), Africa (n=4), and South-America (Supplementary Table S2) (22, 67–69, 79). Consumption of
(n=3). Remaining studies combined geographical sites (Table 1). Lycium Barbarum juice (65), resistant corn starch (75), or saffron
Most studies assessed the association of age or sex with serum tablets (70) was associated with higher IgG levels, whereas
immunoglobulin levels. Other determinants included diet, saffron supplementation and roots of North American ginseng
ethnicity, smoking, alcohol consumption, cardio-metabolic risk were associated with lower IgM and IgA levels respectively (70,
factors, and other lifestyle related factors, with most studies 76). Three observational studies assessed the relation between
including multiple determinants. A summary of characteristics dietary components and serum immunoglobulins (56, 81, 82)
of the included studies is provided in Table 1 and a complete and only established a positive correlation of dietary energy and
overview including quality scores is provided in Supplementary carbohydrates with IgA (81), and a negative association between
Table S2. 25-hydroxyvitamin D levels and IgA (82).
Association of Age and Sex with Serum Association of Ethnicity With Serum
Immunoglobulins Immunoglobulins
Age was included in 41 of the identified studies (4, 6, 12–50). Eighteen studies described the influence of ethnicity on serum
Studies compared means or medians with SDs/ranges between immunoglobulin levels (17, 28, 33, 42, 45, 47, 50, 55, 59, 63, 85–
older and younger age groups, or provided a correlation 92). Caucasians had lower immunoglobulin levels than Africans,
coefficient/beta for the relationship between age and Asians, Amazonians, or Melanesians (17, 33, 42, 50, 59, 63, 86–
immunoglobulins. Studies used different cut-off values for their 89, 91, 92). An Afghan study reported higher immunoglobulin
younger (19 to 54 years) and older (40 to >100 years) age groups. levels in the Hazaras compared to other tribes (85). Two studies
Some studies employed multiple age groups with varying compared immunoglobulin levels between inhabitants of large
intervals (4, 19, 21, 23, 25, 30, 33, 39, 40, 43, 46, 49). Asian (28) or European (45) cities, but did not find any
Most studies reported higher serum IgA in the older differences. One study compared mean immunoglobulin levels
compared to younger individuals (4, 6, 13–16, 20, 22, 23, 25– between inhabitants of various cities throughout the world and
28, 33, 36, 39, 40, 42, 43, 45–49). Results were heterogeneous for found highest IgG and IgM levels in Nigeria, and lowest IgM
IgG, with 19 studies not reporting an association between age levels in Mexico city (90). Two studies reported different
and IgG (14–18, 20, 22, 26, 28, 31–34, 38, 41, 44–46, 50), and 15 immunoglobulin levels in various ethnic groups stratified by
studies reporting higher IgG levels (4, 6, 12, 25, 27, 30, 35–37, 40, sex (Supplementary Table S2) (47, 55).
42, 43, 47–49) in older compared to younger individuals. Overall,
no association was found between age and serum IgM (6, 14–18, Association of Smoking With Serum
20, 25, 26, 28, 30, 31, 35, 36, 44–46, 48, 49). Immunoglobulins
Thirty-six articles assessed differences in serum Twelve studies assessed the association of smoking with serum
immunoglobulin levels between men and women (4–6, 13, 15, immunoglobulin levels (6, 51, 89, 93–101). The definition of
16, 18, 19, 24, 26, 28, 31, 33–35, 39, 40, 42–44, 48, 50–64). Most smoking was self-reported and heterogeneous (Supplementary
studies did not report an association of sex with IgA or IgG (16, Table S2).
Frontiers in Immunology | www.frontiersin.org 3 April 2021 | Volume 12 | Article 664526Khan et al. Determinants of Serum Immunoglobulins
TABLE 1 | Summarized descriptive statistics of included studies.
Determinant N Design Continentsa Ethnicitiesa Range N Range age Included
studies participants participants immunoglobulins
Age 41 Cross-sectional (39), before-after North America (12), Caucasian (18), 20-3213 18-106 IgA (34), IgG (37),
study (1), non-randomized Europe (22), Asia (7), African (5), Asian (4), IgM (36)
controlled clinical trial (1) South America (1) Other (3), NR (17)
Sex 36 Cross-sectional (35), before-after North America (7), Europe Caucasian (16), 12-3213 18-98 IgA (30), IgG (30),
study (1) (19), Asia (6), African (7), Asian (5), IgM (32)
South America (3), Africa Other (5), NR (10)
(3)
Diet 23 Cross-sectional (3), before-after North America (4), Europe Caucasian (2), Asian 5-1291 18-90 IgA (20), IgG (21),
study (10), non-randomized (8), Asia (9), Africa (2) (8), Other (1), NR IgM (19)
controlled clinical trial (2), RCT (8) (12)
Ethnicity 18 Cross-sectional (18) North America (4), Caucasian (14), 30-1799 18-95 IgA (17), IgG (17),
Europe (9), Asia (5), South African (9), Asian (6), IgM (16)
America (1), Africa (2), Other (6)
Australia (2)
Smoking 12 Cross-sectional (12) North America (2), Europe Caucasian (3), 23-3508 18-92 IgA (8), IgG (11),
(5), Asia (4), Australia (1) African (1), Asian (2), IgM (9)
Other (1), NR (6)
Hormones 8 Cross-sectional (2), before-after North America (3), Europe Caucasian (1), 9-200 18-69 IgA (7), IgG (7),
(endogenous study (3), non-randomized (3), South America (1), African (1), Other (1), IgM (6)
and exogenous) controlled clinical trial (1), RCT (2) Africa (1) NR (5)
Alcohol 6 Cross-sectional (3), before-after Europe (3), Asia (2), Caucasian (2), Asian 5-3508 18-92 IgA (3), IgG (4),
consumption study (2), RCT (1) Australia (1) (2), NR (2) IgM (3)
Cardiometabolic 4 Cross-sectional (4) Europe (2), Asia (2) Caucasian (2), Asian 174-12 373 18-92 IgA (3), IgG (4),
risk factors (2) IgM (4)
Other life style 12 Cross-sectional (1), before-after North America (2), Europe Asian (3), Other (1), 2-76 19-63 IgA (9), IgG (12),
factorsb study (7), RCT (4) (2), Asia (6), South NR (8) IgM (10)
America (1), Australia (1)
Miscellaneousc 8 Cross-sectional (5), before-after North America (1), Europe Caucasian (3), NR 15-927 18-94 IgA (8), IgG (8),
study (2), longitudinal (1) (6), Asia (1) (4), Asian (1) IgM (8)
a
Some studies included multiple countries/ethnicities.
b
Comprises relaxation techniques (n=1), aromatherapy (n=1), massage (n=1), Tai Chi (n=1), exercise (n=1), psychological stress (n=4), and sleep deprivation (n=3).
c
Comprises intelligence (n=1), amoxicillin/clavulanic acid (n=1), air pollution (n=1), external temperature (n=2), and blood group (n=3).
NR, not reported; IgA, immunoglobulin A; IgG, immunoglobulin G; IgM, immunoglobulin M; RCT, randomized controlled trial.
Three studies reported lower IgA levels in smokers compared were heterogeneous, with alcohol consumption being associated
to controls (98, 100) or compared to secondhand smokers (97). with lower (96) or higher (103) serum IgM, or not having an
Five studies did not report an association of smoking with IgA (6, effect at all (6).
51, 93, 99, 101). Seven studies reported lower IgG levels in
smokers compared to non-smokers (6, 89, 94, 95, 98–100) or Association of Hormones With Serum
compared to ex-smokers (94), regardless of the number of daily Immunoglobulins
cigarettes smoked and smoking duration (89). Although nicotine Eight studies assessed the association of hormones, either
replacement therapy was associated with lower IgG levels than endogenous or exogenous (predominantly contraceptives or
smokeless tobacco, there were no differences between these and corticosteroids) with immunoglobulin levels (15, 53, 105–110).
the non-nicotine using control group (101). Three studies did The association of contraceptives with serum immunoglobulins
not report an association between smoking and IgG (61, 93, 97). was heterogeneous (Supplementary Table S2) (15, 108, 109).
Seven studies did not find an association between smoking and Menstrual phase did not affect serum immunoglobulins (53).
serum IgM (6, 51, 93, 97, 99–101), whereas two studies reported Dehydroepiandrosterone (DHEA) did not affect immunoglobulin
lower IgM levels in smokers compared to non-smokers (96, 98). levels either (107). Oral corticosteroids were associated with lower
IgG levels (105, 110), and a longer treatment duration led to a
Association of Alcohol With Serum Immunoglobulins slower recovery of serum IgG afterwards (105). The prostaglandin
The relation between alcohol consumption and serum E1 analog misoprostol did not change serum immunoglobulin
immunoglobulins was described in six studies (6, 95, 96, 102– levels (106).
104). A positive association was found between alcohol
consumption and IgA levels (6, 102, 103). Two studies Association of Cardio-Metabolic Risk Factors With
established lower IgG levels in drinkers compared to non- Serum Immunoglobulins
drinkers (6, 95), one study found no association (104), and Four studies described the association of cardio-metabolic
another study reported higher IgG levels after alcohol risk factors (blood pressure and anthropometric measures
consumption compared to abstention (103). Results for IgM such as weight and BMI) with serum immunoglobulin levels
Frontiers in Immunology | www.frontiersin.org 4 April 2021 | Volume 12 | Article 664526Khan et al. Determinants of Serum Immunoglobulins
(6, 18, 56, 111). Although different definitions of high blood Pooled Association of Age With Immunoglobulins
pressure were applied (Supplementary Table S2), high compared Nineteen studies reporting on age were included in the meta-
to normal blood pressure was generally associated with higher IgA analysis. We included 13 studies that reported MDs in serum
and IgG levels (6, 111) and no difference in IgM levels (6, 18). Two immunoglobulins in older versus younger individuals (12, 14–16,
studies reported on the association of various anthropometric 18–20, 29, 30, 32, 37, 38, 50). To ensure minimum overlap
measures with serum immunoglobulins (Supplementary Table between the older and younger age groups as defined in the
S2) and found positive associations of obesity with IgA and IgG included studies, we employed a cut-off of 45 years. Estimates of
(6), abdominal obesity with IgA (6), and triceps skinfold thickness multiple age groups were combined into overall estimates for the
with IgM (56). older and younger age groups. In addition, we separately meta-
analyzed the results of six other studies that provided correlation
Association of Other Lifestyle Factors With Serum coefficients for age and serum immunoglobulins (22, 26, 31, 35,
Immunoglobulins 39, 45).
Twelve studies described among others, the influence of physical Older individuals had higher IgA (pooled MD: 0.38; 95%
activity, psychological stress, or sleep (112–123). Psychological CI: 0.18 – 0.58), but lower IgM levels (pooled MD: -0.40; 95%
stress, either due to blood donation (117) or a university CI: -0.66 – -0.14) compared to the younger individuals.
examination (118, 119), was associated with increased levels of There was a trend for lower IgG levels (pooled MD: -0.30; 95%
IgA (117–119), IgG, and IgM (117, 119). Furthermore, a positive CI: -2.00 – 1.40), but this only reached significance in the fixed-
association was established between job strain and serum IgG (120). effect model (pooled MD: -2.10; 95% CI: -2.36 – -1.84)
Sleep deprivation (SD) was associated with increased serum IgA, (Figure 1). There was a substantial amount of heterogeneity
IgG, and IgM levels in one study (121), while no differences were for IgG (I2: 97%) and IgM (I2: 95%), and in lesser extent for IgA
observed in another study (122), and serum IgA even decreased (I2: 71%) as well. The fixed-effect meta-analyses for a pooled
during rapid eye movement SD (REM-SD) in a third study (123). correlation coefficient for age and serum immunoglobulins,
While various relaxation techniques and tai chi increased all serum yielded comparable results. We found a positive correlation of
immunoglobulin levels (112, 115), and an increase in IgA and IgG age with IgA, no correlation with IgG, and a negative correlation
was seen after combined aerobic and resistance exercise respectively with IgM (Supplementary Figure S2).
a full body Swedish massage (114, 116), aromatherapy did not
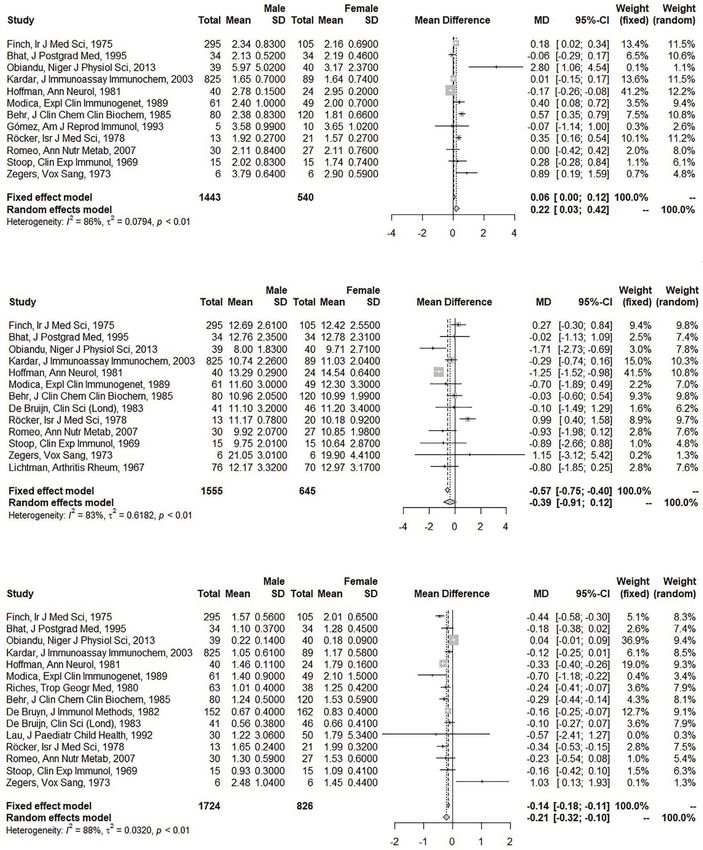
influence serum immunoglobulins (113). Pooled Association of Sex With Immunoglobulins
Seventeen articles were included to obtain pooled MDs for men
Association of Miscellaneous Determinants With compared to women (5, 15, 16, 18, 19, 26, 31, 35, 50, 52–54, 57,
Serum Immunoglobulins 58, 63, 64, 103).
Eight studies included determinants that could not be combined Men had higher IgA (pooled MD: 0.22; 95% CI: 0.03 – 0.42),
into demographic or lifestyle related groups (35, 44, 46, 58, 81, 94, but lower IgM levels (pooled MD: -0.21; 95% CI: -0.32 – -0.10)
124, 125). Three studies described the influence of a than women. No difference was observed for IgG (pooled
hematological factor on serum immunoglobulins and found a MD: -0.39; 95% CI: -0.91 – 0.12) (Figure 2). In the fixed effect
positive association between transferrin and IgM (81), and lower model, the association of sex and IgA was lost (pooled MD: 0.06;
IgA levels in HLA-B8 DR+ compared to HLA-B8 DR- subjects 95% CI: 0.00 – 0.12), while IgG became lower in men compared
(35), while no association was found between AB0 blood group to women (pooled MD: -0.57; 95% CI: -0.75 – -0.40). A large
and immunoglobulins (44). Two studies investigated the amount of heterogeneity was observed (I2: 86% for IgA; 83% for
influence of outside temperature and concluded that serum IgA IgG; 88% for IgM).
and IgM were lowest in samples that were stored at -20C for three
months compared to fresh sera or sera stored for three or four Assessment of Publication Bias
weeks (46), while sauna heat exposure increased immunoglobulin The Egger test was significant for the association of age (P =
levels (58). Although mean immunoglobulin levels were 0.002) and sex (P = 0.013) with IgA. No statistical indications of
comparable between inhabitants of city areas with different publication bias were found for IgG and IgM. The funnel plots
degrees of air pollution, IgA levels of ≥300 mg/dl (≥3.0 g/l) indicated three outliers for the association between age and IgA
were more prevalent in the more polluted areas (94). Two weeks (15, 20, 29). For the association between age and IgG six outliers
after treatment with the antibiotic amoxicillin/clavulanic acid, were found (12, 29, 30, 32, 37, 38), whereas for age and IgM there
serum IgG was lower compared to the level two weeks before start were seven outliers (12, 15, 16, 18, 19, 29, 38) (Supplementary
of treatment (124). Intelligence, as measured by the Wechsler Figure S3). In the funnel plots for sex, there were five outliers for
adult intelligence scale (WAIS) score was negatively associated IgA (5, 15, 16, 26, 31), four for IgG (5, 26, 52, 58), and five for
with serum IgG, even after adjustment for age, sex, and race (125). IgM (5, 26, 35, 52, 63) (Supplementary Figure S4).
Meta-Analyses Sensitivity and Stratified Analyses
Due to the large amount of heterogeneity in the definition of Employing a Different Cut-off for Age
included determinants or a limited number of studies Using a cut-off of 60 instead of 45 years to compare older vs
investigating a certain determinant, we could only meta- younger individuals, yielded similar results and did not impact
analyze results for age and sex. heterogeneity (Table 2A).
Frontiers in Immunology | www.frontiersin.org 5 April 2021 | Volume 12 | Article 664526Khan et al. Determinants of Serum Immunoglobulins
A
B
C
FIGURE 1 | Forest plots for the association between age and serum immunoglobulin levels. (A) Association of age with serum immunoglobulin A (IgA) (g/l).
(B) Association of age with serum immunoglobulin G (IgG) (g/l). (C) Association of age with serum immunoglobulin M (IgM) (g/l). The closed squares with horizontal
lines depict the mean differences in serum immunoglobulin levels between older (≥45 years) and young (Khan et al. Determinants of Serum Immunoglobulins
A
B
C
FIGURE 2 | Forest plots for the association between sex and serum immunoglobulin levels. (A) Association of sex with serum immunoglobulin A (IgA) (g/l).
(B) Association of sex with serum immunoglobulin G (IgG) (g/l). (C) Association of sex with serum immunoglobulin M (IgM) (g/l). The closed squares with horizontal
lines depict the mean differences in serum immunoglobulin levels between men and women with 95% confidence intervals. The diamonds depict the pooled mean
differences between men and women. The random effect model was taken as primary model.
Stratifying by WHO Region and IgM only remained in North America (pooled MD: -0.55;
Age was not associated with IgG in any WHO region. The 95% CI: -0.81 – -0.29) (Table 2A). No relation was found
positive association of age with IgA was lost in Asia (pooled MD: between sex and IgA in Asian and other regions (excluding
0.15; 95% CI: -0.01 – 0.30) and the negative association of age North America and Europe). In Europe however, men compared
Frontiers in Immunology | www.frontiersin.org 7 April 2021 | Volume 12 | Article 664526Khan et al. Determinants of Serum Immunoglobulins
TABLE 2A | Sensitivity and stratified meta-analyses for effect of age: older vs younger age groups.
Immunoglobulin N Total N older Total N young Fixed Effect Mean Difference Random Effect Mean Difference I2 t2
studies (≥45y)a (Khan et al. Determinants of Serum Immunoglobulins
TABLE 2B | Continued
Immunoglobulin N studies Total N Males Total N Females Fixed Effect Mean Difference Random Effect Mean Difference I2 statistic t2 statistic
(95% CI) (95% CI)
IgM 6 1019 289 -0.01 (-0.05 - 0.04) -0.15 (-0.31 - 0.01) 75% 0.0219
Stratified by region: North America
IgA 1 40 24 -0.17 (-0.26 - -0.08) -0.17 (-0.26 - -0.08) NA NA
IgG 2 116 94 -1.22 (-1.48 - -0.96) -1.22 (-1.48 - -0.96) 0% 0
IgM 1 40 24 -0.33 (-0.40 - -0.26) -0.33 (-0.40 - -0.26) NA NA
Stratified by region: Europe
IgA 6 494 337 0.32 (0.22 - 0.41) 0.32 (0.16 - 0.48) 53% 0.0182
IgG 7 535 382 0.17 (-0.12 - 0.47) -0.03 (-0.56 - 0.51) 62% 0.2876
IgM 9 750 583 -0.24 (-0.30 - -0.19) -0.26 (-0.35 - -0.17) 58% 0.0103
Stratified by region: Asia
IgA 2 859 123 -0.01 (-0.15 - 0.12) -0.01 (-0.15 - 0.12) 0% 0
IgG 2 859 123 -0.25 (-0.67 - 0.17) -0.25 (-0.67 - 0.17) 0% 0
IgM 3 889 173 -0.14 (-0.25 - -0.03) -0.14 (-0.25 - -0.03) 0% 0
Stratified by region: Other
IgA 3 50 56 0.83 (0.27 - 1.38) 1.03 (-0.22 - 2.27) 74% 0.8711
IgG 2 45 46 -1.56 (-2.55 - -0.57) -1.06 (-3.41 - 1.28) 39% 1.5794
IgM 2 45 46 0.04 (-0.01 - 0.10) 0.43 (-0.52 - 1.38) 78% 0.3834
Stratified by ethnicity: Caucasian
IgA 3 371 169 0.23 (0.09 - 0.37) 0.23 (0.09 - 0.37) 0% 0
IgG 5 449 254 -0.09 (-0.52 - 0.34) -0.12 (-0.59 - 0.34) 6% 0.0194
IgM 5 475 253 -0.28 (-0.37 - -0.20) -0.28 (-0.45 - -0.12) 71% 0.0238
Stratified by ethnicity: Other
IgA 5 124 114 -0.13 (-0.22 - -0.05) 0.19 (-0.20 - 0.59) 80% 0.1130
IgG 5 158 135 -1.21 (-1.46 - -0.96) -1.09 (-1.67 - -0.50) 40% 0.1692
IgM 5 149 154 -0.09 (-0.13 - -0.05) -0.08 (-0.35 - 0.20) 95% 0.0615
Stratified by ethnicity: NR
IgA 4 948 257 0.24 (0.14 - 0.34) 0.25 (-0.03 - 0.53) 84% 0.0658
IgG 4 948 256 0.05 (-0.25 - 0.34) -0.00 (-0.71 - 0.70) 81% 0.3992
IgM 5 1100 419 -0.19 (-0.25 - -0.13) -0.20 (-0.28 - -0.13) 30% 0.0024
NA, not applicable; NR, not reported.
to women had higher IgA levels (pooled MD: 0.32; 95% CI: Summary of Identified Determinants
0.16 – 0.48). The opposite association was found in North A graphic overview of identified determinants per
America (pooled MD: -0.17; 95% CI: -0.26 – -0.08) although immunoglobulin, both through the systematic review and
only one study was performed in that region. IgG was lower in meta-analyses, has been provided in Supplementary Figure S5.
men compared to women in the North American studies (pooled
MD: -1.22; 95% CI: -1.48 – -0.96), whereas no association
between sex and IgG was found in the other WHO regions.
IgM was lower in men than women in all North American, DISCUSSION
European and Asian studies (pooled MDs ranging from -0.33 to
In this study we have provided an up-to-date overview of
-0.14). Only one study was performed in another WHO region
published determinants of serum immunoglobulins, while also
and did not report a relation between sex and IgM (Table 2B).
being the first to meta-analyze reported results. Age, sex,
Stratifying by Ethnicity ethnicity, smoking, and psychological stress were identified as
The positive association of age with IgA was not impacted by potentially important determinants. Heterogeneous and
ethnicity, although most studies did not report the ethnicity of inconclusive results were found for the effect of diet, alcohol,
participants. While the effect estimates for the association of age hormones, and cardio-metabolic risk factors.
with IgG and IgM were opposite in Caucasians vs subjects of Pooled results showed 0.38 g/l higher IgA, but 0.40 g/l lower
other ethnicities, none of these associations reached significance. IgM levels in older compared to younger individuals. Our
IgM levels were lower in older compared to younger subjects of findings could be explained by a decline in IgM-producing B-
no reported ethnicity (pooled MD: -0.53; 95% CI: -0.83 – -0.23) cells at older age (3), although studies included in a recent review
(Table 2A). Stratification by ethnicity only yielded an association have shown a decline of naïve, IgM-memory, and switched-
between sex and IgA in Caucasians (pooled MD: 0.23; 95% memory B-cells in the elderly (126). Increased immunoglobulin
CI: 0.09 – 0.37). Men compared to women of non-Caucasian levels in elderly could indicate inflammatory disorders (e.g.
ethnicity had lower IgG levels (pooled MD: -1.09; 95% Sjögren syndrome or rheumatoid arthritis) (127) or
CI: -1.67 – -0.50). Men furthermore had lower IgM levels than monoclonal gammopathy of undetermined significance
women, expect for the ones of non-Caucasian ethnicity (MGUS), an asymptomatic premalignant condition whose
(Table 2B). prevalence increases with age (128).
Frontiers in Immunology | www.frontiersin.org 9 April 2021 | Volume 12 | Article 664526Khan et al. Determinants of Serum Immunoglobulins
Furthermore, in our meta-analyses we showed 0.22 g/l damage of the intestinal mucosa and disruption of the intestinal
higher IgA and 0.21 g/l lower IgM levels in men compared to barrier function (146).
women. This could partly be explained by hormonal differences, Studies reporting on the association of hypertension with
as testosterone application to human peripheral blood serum immunoglobulins generally showed a positive association.
mononuclear cells led to decreased IgG and IgM production, Hypertension can activate the adaptive immune system, possibly
whereas estradiol application had the opposite effect (129, 130). through formation of neoantigens (147). Mouse models
IgM-regulating properties of the X-chromosome were furthermore showed an increase in plasma cell count and
hypothesized to lead to higher levels in women, but results of serum IgG after angiotensin II administration (148). However,
family studies were inconclusive (131, 132). A recent study showed various immunological pathways have been described in the
a positive effect of testosterone and a negative effect of estradiol on pathophysiology of hypertension, suggesting a bidirectional
mucosal immunity in Amazonian adolescents, which could association (147, 149).
explain the higher IgA levels we found in men (133). Our biggest strength lies in provision of an up-to-date
Caucasians had lower serum immunoglobulin levels than qualitative (systematic review) and quantitative (meta-analysis)
Africans, Asians, Native Americans, or Melanesians. This could overview of serum immunoglobulin determinants. We were
be explained by environmental (lower microbial exposure) (134, therefore able to present coherent and comparable data,
135) or genetic differences, as a study of black and white families indicating consistent associations of age, sex, and key
from Richmond showed high heritability values for serum environmental factors with serum immunoglobulin levels. Our
immunoglobulins, especially in white subjects (136). results will furthermore encourage clinicians and researchers to pay
Furthermore, in admixed Latin-Americans, ancestry-specific close attention to factors that influence serum immunoglobulin
single nucleotide polymorphisms regulated innate and adaptive levels in healthy adults and possibly in the context of
immune responses (137). Genetic differences could also explain immunosenescence. However, our study also knows some
the higher immunoglobulin levels in Hazaras compared to other limitations. Most included studies had a moderate quality, small
large Afghan tribes. Extensive genome analyses on worldwide sample size (nKhan et al. Determinants of Serum Immunoglobulins
immunoglobulin levels in healthy adults. In total, 117 articles (supporting). VD: Conceptualization (equal), funding acquisition
published over a time span of 53 years were included. The meta- (lead), supervision (equal), and writing—review and editing
analysis indicated higher serum IgA, but lower serum IgM levels (equal). LC: Conceptualization (equal), supervision (equal), and
in older individuals and in males. Other identified determinants writing—review and editing (equal). All authors contributed to the
of serum IgA, IgG, and/or IgM were ethnicity, smoking, alcohol article and approved the submitted version.
consumption, probiotics, corticosteroid use, hypertension, and
acute psychological stress.
FUNDING
DATA AVAILABILITY STATEMENT This work was supported by Takeda [grant number IIR-NLD-
002671 to VD].
The original contributions presented in the study are included in
the article/Supplementary Material. Further inquiries can be
directed to the corresponding author.
ACKNOWLEDGMENTS
We would like to thank Elise Krabbendam, biomedical
AUTHOR CONTRIBUTIONS information specialist at the medical library of the Erasmus
MC, for her contribution to the online literature search.
SK: Conceptualization (equal), data curation (equal), formal
analysis (lead), methodology (lead), validation (equal),
visualization (lead), writing—original draft (lead), and writing—
review and editing (equal). AB: Data curation (equal), validation SUPPLEMENTARY MATERIAL
(equal), and writing—review and editing (supporting). RP:
Conceptualization (equal), supervision (equal), and writing— The Supplementary Material for this article can be found online
review and editing (supporting). MH: Conceptualization at: https://www.frontiersin.org/articles/10.3389/fimmu.2021.
(equal), supervision (equal), and writing—review and editing 664526/full#supplementary-material
REFERENCES 10. Sterne JAC, Savovic J, Page MJ, Elbers RG, Blencowe NS, Boutron I, et al.
RoB 2: a revised tool for assessing risk of bias in randomised trials. BMJ
1. Hoffman W, Lakkis FG, Chalasani G, Cells B. Antibodies, and More. Clin J (2019) 366:l4898. doi: 10.1136/bmj.l4898
Am Soc Nephrol (2016) 11:137–54. doi: 10.2215/CJN.09430915 11. N.H. Nih, Lung, and I. Blood. Quality assessment tool for before-after (pre-
2. Agarwal S, Busse PJ. Innate and adaptive immunosenescence. Ann Allergy post) studies with no control group. (2014). Available at: https://www.nhlbi.
Asthma Immunol (2010) 104:183–90; quiz 190-2, 210. doi: 10.1016/ nih.gov/health-topics/study-quality-assessment-tools (Accessed July 21, 2020).
j.anai.2009.11.009 12. Barrett DJ, Stenmark S, Wara DW, Ammann AJ. Immunoregulation in aged
3. Listi F, Candore G, Modica MA, Russo M, Di Lorenzo G, Esposito-Pellitteri humans. Clin Immunol Immunopathol (1980) 17:203–11. doi: 10.1016/0090-
M, et al. A study of serum immunoglobulin levels in elderly persons that 1229(80)90088-4
provides new insights into B cell immunosenescence. Ann N Y Acad Sci 13. Batory G, Jancso A, Puskas E, Redei A, Lengyel E. Antibody and
(2006) 1089:487–95. doi: 10.1196/annals.1386.013 immunoglobulin levels in aged humans. Arch Gerontol Geriatr (1984)
4. Cassidy JT, Nordby GL, Dodge HJ. Biologic variation of human serum 3:175–88. doi: 10.1016/0167-4943(84)90009-8
immunoglobulin concentrations: sex-age specific effects. J Chronic Dis 14. Beharka AA, Paiva S, Leka LS, Ribaya-Mercado JD, Russell RM, Nibkin
(1974) 27:507–16. doi: 10.1016/0021-9681(74)90026-5 Meydani S. Effect of age on the gastrointestinal-associated mucosal immune
5. Obiandu C, Okerengwo AA, Dapper DV. Levels of serum immunoglobulins response of humans. J Gerontol A Biol Sci Med Sci (2001) 56:B218–23. doi:
in apparently healthy children and adults in Port Harcourt, Nigeria. Niger J 10.1093/gerona/56.5.B218
Physiol Sci (2013) 28:23–7. 15. Behr W, Schlimok G, Firchau V, Paul HA. Determination of reference
6. Gonzalez-Quintela A, Alende R, Gude F, Campos J, Rey J, Meijide LM, et al. intervals for 10 serum proteins measured by rate nephelometry, taking into
Serum levels of immunoglobulins (IgG, IgA, IgM) in a general adult consideration different sample groups and different distribution functions.
population and their relationship with alcohol consumption, smoking and J Clin Chem Clin Biochem (1985) 23:157–66. doi: 10.1515/cclm.1985.23.3.157
common metabolic abnormalities. Clin Exp Immunol (2008) 151:42–50. doi: 16. Bhat GA, Mubarik M, Bhat MY. Serum immunoglobulin profile in normal
10.1111/j.1365-2249.2007.03545.x Kashmiri adults. J Postgrad Med (1995) 41:66–9.
7. McMillan SA, Douglas JP, Archbold GP, McCrum EE, Evans AE. Effect of 17. Bowden M, Crawford J, Cohen HJ, Noyama O. A comparative study of
low to moderate levels of smoking and alcohol consumption on serum monoclonal gammopathies and immunoglobulin levels in Japanese and
immunoglobulin concentrations. J Clin Pathol (1997) 50:819–22. doi: United States elderly. J Am Geriatr Soc (1993) 41:11–4. doi: 10.1111/j.1532-
10.1136/jcp.50.10.819 5415.1993.tb05940.x
8. Maddison SE, Reimer CB. Normative values of serum immunoglobulins by 18. De Bruijn AM, Geers FC, Hylkema RS, Vermeeren R, Hofman A. Blood
single radial immunodiffusion: a review. Clin Chem (1976) 22:594–601. doi: pressure and immunoglobulins. Clin Sci (Lond) (1983) 65:665–7. doi:
10.1093/clinchem/22.5.594 10.1042/cs0650665
9. Modesti PA, Reboldi G, Cappuccio FP, Agyemang C, Remuzzi G, Rapi S, 19. De Bruyn AM, Klein F, Neumann H, Sandkuyl LA, Vermeeren R, Le Blansch
et al. Settings, Panethnic Differences in Blood Pressure in Europe: G. The absolute quantification of human IgM and IgG: standardization and
A Systematic Review and Meta-Analysis. PloS One (2016) 11:e0147601. normal values. J Immunol Methods (1982) 48:339–48. doi: 10.1016/0022-
doi: 10.1371/journal.pone.0147601 1759(82)90334-9
Frontiers in Immunology | www.frontiersin.org 11 April 2021 | Volume 12 | Article 664526Khan et al. Determinants of Serum Immunoglobulins
20. Carson PJ, Nichol KL, O’Brien J, Hilo P, Janoff EN. Immune function and 39. Quintiliani L, Taggi F, Giuliani E, Buzzonetti A, D’Amico F. IgG, IgA and
vaccine responses in healthy advanced elderly patients. Arch Intern Med IgM concentration in human sera from different age groups: statistical
(2000) 160:2017–24. doi: 10.1001/archinte.160.13.2017 evaluation. Boll Ist Sieroter Milan (1976) 55:241–8.
21. Challacombe SJ, Percival RS, Marsh PD. Age-related changes in 40. Radl J, Sepers JM, Skvaril F, Morell A, Hijmans W. Immunoglobulin
immunoglobulin isotypes in whole and parotid saliva and serum in patterns in humans over 95 years of age. Clin Exp Immunol (1975) 22:84–90.
healthy individuals. Oral Microbiol Immunol (1995) 10:202–7. doi: 41. Reen DJ, Murphy MB, O’Connor A, FitzGerald MX. IgG sub-class levels in
10.1111/j.1399-302X.1995.tb00143.x healthy Irish adults–a population study. Ir J Med Sci (1981) 150:265–9. doi:
22. Farges MC, Minet-Quinard R, Walrand S, Thivat E, Ribalta J, Winklhofer- 10.1007/BF02938252
Roob B, et al. Immune status is more affected by age than by carotenoid 42. Rowe DS, McGregor IA, Smith SJ, Hall P, Williams K. Plasma
depletion-repletion in healthy human subjects. Br J Nutr (2012) 108:2054– immunoglobulin concentrations in a West African (Gambian)
65. doi: 10.1017/S0007114512000177 community and in a group of healthy British adults. Clin Exp Immunol
23. De Greef GE, Van Tol MJ, Van Den Berg JW, Van Staalduinen GJ, Janssen (1968) 3:63–79.
CJ, Radl J, et al. Serum immunoglobulin class and IgG subclass levels and the 43. Stoica G, Macarie E, Michiu V, Stoica RC. Biologic variation of human
occurrence of homogeneous immunoglobulins during the course of ageing immunoglobulin concentration. I. Sex-age specific effects on serum levels of
in humans. Mech Ageing Dev (1992) 66:29–44. doi: 10.1016/0047-6374(92) IgG, IgA, IgM and IgD. Med Interne (1980) 18:323–32.
90071-K 44. Toshkov A, Abrashev I, Prodanov P. Quantity of serum immunoglobulins
24. Grundbacher FJ. High IgM levels in women coincide with reproductive IgG, IgA and IgM in Bulgarian blood-donors. Folia Haematol Int Mag Klin
phase. Experientia (1980) 36:1360–1. doi: 10.1007/BF01960097 Morphol Blutforsch (1974) 101:269–71.
25. Hallgren HM, Buckley CE3rd3rd, Gilbertsen VA, Yunis EJ. Lymphocyte 45. Vasson MP, Farges MC, Goncalves-Mendes N, Talvas J, Ribalta J,
phytohemagglutinin responsiveness, immunoglobulins and autoantibodies Winklhofer-Roob B, et al. Does aging affect the immune status? A
in aging humans. J Immunol (1973) 111:1101–7. comparative analysis in 300 healthy volunteers from France, Austria and
26. Hoffman PM, Robbins DS, Oldstone MB, Gibbs CJJr., Gajdusek DC. Spain. Immun Ageing (2013) 10:38. doi: 10.1186/1742-4933-10-38
Humoral immunity in Guamanians with amyotrophic lateral sclerosis and 46. Veys EM, Wieme RJ. Serum IgG, IgM and IgA concentration
parkinsonism-dementia. Ann Neurol (1981) 10:193–6. doi: 10.1002/ determined by the “linear plate” immunodiffusion technique in a normal
ana.410100210 population. Clin Chim Acta (1973) 47:295–306. doi: 10.1016/0009-8981(73)
27. Hrncir Z, Nerad V, Skaunic V, Tichy M. Effect of aging on the levels of the 90327-6
main classes of serum immunoglobulins in active chronic hepatitis and in 47. Yodfat Y, Keren L, Zlotnick A. Serum immunoglobulin levels in healthy
clinically healthy subjects. Rev Czech Med (1973) 19:215–22. adults of various ethnic groups in a rural family practice in Israel. J Fam
28. Ichihara K, Itoh Y, Min WK, Yap SF, Lam CW, Kong XT, et al. Diagnostic Pract (1975) 2:419–22.
and epidemiological implications of regional differences in serum 48. Kalff MW. A population study on serum immunoglobulin levels. Clin Chim
concentrations of proteins observed in six Asian cities. Clin Chem Lab Acta (1970) 28:277–89. doi: 10.1016/0009-8981(70)90092-6
Med (2004) 42:800–9. doi: 10.1515/CCLM.2004.133 49. Haferkamp O, Schlettwein-Gsell D, Schwick HG, Storiko K. Serum protein
29. Jayachandran M, Rani PJA, Arivazhagan P, Panneerselvam C. Neutrophil in an aging population with particular reference to evaluation of immune
phagocytic function and humoral immune response with reference to globulins and antibodies. Gerontologia (1966) 12:30–6. doi: 10.1159/
ascorbate supplementation in aging humans. J Anti-Aging Med (2000) 000211530
3:37–42. doi: 10.1089/rej.1.2000.3.37 50. Lichtman MA, Vaughan JH, Hames CG. The distribution of serum
30. Jazayeri MH, Pourfathollah AA, Rasaee MJ, Porpak Z, Jafari ME. The immunoglobulins, anti-gamma-G globulins (“rheumatoid factors”)
concentration of total serum IgG and IgM in sera of healthy individuals and antinuclear antibodies in White and Negro subjects in Evans
varies at different age intervals. Biomed Aging Pathol (2013) 3:241–5. doi: County, Georgia. Arthritis Rheum (1967) 10:204–15. doi: 10.1002/
10.1016/j.biomag.2013.09.002 art.1780100306
31. Kardar GA, Shams SH, Pourpak Z, Moin M. Normal value of 51. Bell DY, Haseman JA, Spock A, McLennan G, Hook GE. Plasma proteins of
immunoglobulins IgA, IgG, and IgM in Iranian healthy adults, measured the bronchoalveolar surface of the lungs of smokers and nonsmokers.
by nephelometry. J Immunoassay Immunochem (2003) 24:359–67. doi: Am Rev Respir Dis (1981) 124:72–9.
10.1081/IAS-120025774 52. Finch AP, Whelan CA, de Azavedo J, Greally JF. Immunoglobulin levels and
32. MacGregor RR, Shalit M. Neutrophil function in healthy elderly subjects. auto-antibodies in normal healthy adults. Ir J Med Sci (1975) 144:463–8. doi:
J Gerontol (1990) 45:M55–60. doi: 10.1093/geronj/45.2.M55 10.1007/BF02939055
33. Maddison SE, Stewart CC, Farshy CE, Reimer CB. The relationship of race, 53. Gomez E, Ortiz V, Saint-Martin B, Boeck L, Diaz-Sanchez V, Bourges H.
sex, and age to concentrations of serum immunoglobulins expressed in Hormonal regulation of the secretory IgA (sIgA) system: estradiol- and
international units in healthy adults in the USA. Bull World Health Organ progesterone-induced changes in sIgA in parotid saliva along the menstrual
(1975) 52:179–85. cycle. Am J Reprod Immunol (1993) 29:219–23. doi: 10.1111/j.1600-
34. Memeo SA, Piantanelli L, Mazzufferi G, Guerra L, Nikolitz M, Fabris N. Age 0897.1993.tb00590.x
related patterns of immunoglobulin serum levels in the Quechua Indians of 54. Lau YL, Jones BM, Yeung CY. Biphasic rise of serum immunoglobulins G
Andean Mountains. Int J Biometeorol (1982) 26:49–52. doi: 10.1007/ and A and sex influence on serum immunoglobulin M in normal Chinese
BF02187616 children. J Paediatr Child Health (1992) 28:240–3. doi: 10.1111/j.1440-
35. Modica MA, Freddi S, Caruso C. Blood IgA, IgM and IgE levels are 1754.1992.tb02654.x
influenced by sex and HLA phenotype. Exp Clin Immunogenet (1989) 55. Melamed I, Kark JD, Zakuth V, Margalit G, Spirer Z. Serum
6:251–7. immunoglobulin A levels and ethnicity in an Israeli population sample.
36. Paganelli R, Quinti I, Fagiolo U, Cossarizza A, Ortolani C, Guerra E, et al. Clin Immunol Immunopathol (1987) 42:259–64. doi: 10.1016/0090-1229
Changes in circulating B cells and immunoglobulin classes and subclasses in (87)90013-4
a healthy aged population. Clin Exp Immunol (1992) 90:351–4. doi: 10.1111/ 56. Pongpaew P, Tungtrongchitr R, Phonrat B, Supawan V, Lertchawanakul A,
j.1365-2249.1992.tb07954.x Tawprasert S, et al. Serum proteins and nutritional status of free-living Thai
37. Papadopoulos NG, Lianou PE, Papavassiliou Th J. Strain-dependent elderly. Arch Gerontol Geriatr (1995) 20:219–27. doi: 10.1016/0167-4943(94)
alterations of polymorphonuclear leukocyte phagocytosis and bactericidal 00616-F
function in healthy elderly subjects. Aging Immunol Infect Dis (1993) 4:223–9. 57. Riches PG, Quakyi IA, Gibbs MR, Addison AE. Normal serum
38. Phair JP, Kauffman CA, Bjornson A, Gallagher J, Adams L, Hess EV. Host immunoglobulin and albumin levels in adult Ghanaians compared with
defenses in the aged: evaluation of components of the inflammatory and levels in adults in Europe. Trop Geogr Med (1980) 32:151–7.
immune responses. J Infect Dis (1978) 138:67–73. doi: 10.1093/infdis/ 58. Rocker L, Kirsch KA, Stoboy H. Sex-dependent changes in plasma globulins
138.1.67 in women and men exposed to heat stress. Isr J Med Sci (1978) 14:212–7.
Frontiers in Immunology | www.frontiersin.org 12 April 2021 | Volume 12 | Article 664526Khan et al. Determinants of Serum Immunoglobulins
59. Shiddo SA, Huldt G, Jama H, Nilsson LA, Ouchterlony O, Warsame M, et al. salivarius CECT5713 to healthy adults. Anaerobe (2010) 16:195–200. doi:
Reference ranges for IgG, IgM and IgA in the serum of urban and rural 10.1016/j.anaerobe.2010.02.001
Somalis. Trop Geogr Med (1994) 46:27–31. 79. Song HJ, Grant I, Rotondo D, Mohede I, Sattar N, Heys SD, et al. Effect of
60. Sinkov D, Tolev V, Stereva T. Concentration of IgG, IgA, and IgM in terms CLA supplementation on immune function in young healthy volunteers.
of international units in the sera of healthy individuals. Bull World Health Eur J Clin Nutr (2005) 59:508–17. doi: 10.1038/sj.ejcn.1602102
Organ (1973) 49:217–8. 80. Zhang H, Yeh C, Jin Z, Ding L, Liu BY, Zhang L, et al. Prospective study of
61. White AG, Al-Riyami HA, Kuchipudi P, Daar AS. Immunoglobulins, probiotic supplementation results in immune stimulation and improvement
immunoglobulin G subclasses and complement in adult Omanis. Ann of upper respiratory infection rate. Synth Syst Biotechnol (2018) 3:113–20.
Saudi Med (1997) 17:39–42. doi: 10.5144/0256-4947.1997.39 doi: 10.1016/j.synbio.2018.03.001
62. Zegers BJ, Stoop JW, Reerink-Brongers EE, Sander PC, Aalberse RC, 81. Kim SH, Kim HY, Kim WK, Park OJ. Nutritional status, iron-deficiency-
Ballieux RE. Serum immunoglobulins in healthy children and adults. related indices, and immunity of female athletes. Nutrition (2002) 18:86–90.
Levels of the five classes, expressed in international units per millilitre. doi: 10.1016/S0899-9007(01)00663-3
Clin Chim Acta (1975) 65:319–29. doi: 10.1016/0009-8981(75)90257-0 82. Sakem B, Nock C, Stanga Z, Medina P, Nydegger UE, Risch M, et al. Serum
63. Zegers BJ, Geerdink RA, Sander PC. Serum immunoglobulin levels in Trio concentrations of 25-hydroxyvitamin D and immunoglobulins in an older
and Wajana indians of Surinam. Vox Sang (1973) 24:457–67. doi: 10.1111/ Swiss cohort: results of the Senior Labor Study. BMC Med (2013) 11:176. doi:
j.1423-0410.1973.tb03486.x 10.1186/1741-7015-11-176
64. Stoop JW, Zegers BJ, Sander PC, Ballieux RE. Serum immunoglobulin levels 83. Bahijri SM, Ajabnoor GM, Borai A, Al-Aama JY, Chrousos GP. Effect of
in healthy children and adults. Clin Exp Immunol (1969) 4:101–12. Ramadan fasting in Saudi Arabia on serum bone profile and
65. Amagase H, Sun B, Nance DM. Immunomodulatory effects of a immunoglobulins. Ther Adv Endocrinol Metab (2015) 6:223–32. doi:
standardized Lycium barbarum fruit juice in Chinese older healthy 10.1177/2042018815594527
human subjects. J Med Food (2009) 12:1159–65. doi: 10.1089/jmf.2008.0300 84. Develioglu ON, Kucur M, Ipek HD, Celebi S, Can G, Kulekci M. Effects of
66. Anderson R, Oosthuizen R, Maritz R, Theron A, Van Rensburg AJ. The Ramadan fasting on serum immunoglobulin G and M, and salivary
effects of increasing weekly doses of ascorbate on certain cellular and immunoglobulin A concentrations. J Int Med Res (2013) 41:463–72. doi:
humoral immune functions in normal volunteers. Am J Clin Nutr (1980) 10.1177/0300060513476424
33:71–6. doi: 10.1093/ajcn/33.1.71 85. Agarwal DP, Goedde HW, Benkmann HG, Flatz G, Rahimi AG, Kaifie S, et al.
67. Dlouhy P, Kucera P, Kraml P, Pompachova A, Potockova J, Smejkalova V, Genetic polymorphism of C3 and serum levels of immunoglobulins, C3, C4
et al. Short-term dietary intake of C18:1 trans fatty acids decreases the components of complement and C3-proactivator in four different populations
function of cellular immunity in healthy young men. Ann Nutr Metab (2008) of Afghanistan. Hum Genet (1976) 33:67–72. doi: 10.1007/BF00447288
53:129–36. doi: 10.1159/000162679 86. Wright EP, Vlug A, Geertzen HG, Hoang TL, Nguyen DH. Serum
68. Hartoma TR, Sotaniemi EA, Maattanen J. Effect of zinc on some biochemical immunoglobulins, including IgG subclasses, in Vietnamese leprosy
indices of metabolism. Nutr Metab (1979) 23:294–300. doi: 10.1159/ patients. Int J Lepr Other Mycobact Dis (1985) 53:225–32.
000176268 87. Wang DY, Goodwin PR, Bulbrook RD, Hayward JL, Abe O, Utsunomiya J,
69. Kelley DS, Taylor PC, Nelson GJ, Mackey BE. Dietary docosahexaenoic acid et al. Possible relationship of plasma IgA, IgG and IgM to breast cancer in
and immunocompetence in young healthy men. Lipids (1998) 33:559–66. British and Japanese women. Eur J Cancer (1977) 13:1405–9. doi: 10.1016/
doi: 10.1007/s11745-998-0240-8 0014-2964(77)90153-0
70. Kianbakht S, Ghazavi A. Immunomodulatory effects of saffron: a 88. Grove DI, McGregor A, Forbes IJ. Impaired humoral immunity in PNG
randomized double-blind placebo-controlled clinical trial. Phytother Res Highlanders. P N G Med J (1975) 18:1–7.
(2011) 25:1801–5. doi: 10.1002/ptr.3484 89. Tollerud DJ, Brown LM, Blattner WA, Weiss ST, Maloney EM, Kurman CC,
71. Kim HS, Park H, Cho IY, Paik HD, Park E. Dietary supplementation of et al. Racial differences in serum immunoglobulin levels: relationship to
probiotic Bacillus polyfermenticus, Bispan strain, modulates natural killer cigarette smoking, T-cell subsets, and soluble interleukin-2 receptors. J Clin
cell and T cell subset populations and immunoglobulin G levels in human Lab Anal (1995) 9:37–41. doi: 10.1002/jcla.1860090107
subjects. J Med Food (2006) 9:321–7. doi: 10.1089/jmf.2006.9.321 90. Rowe DS. Concentration of serum-immunoglobulins in healthy young adult
72. Lomax AR, Cheung LV, Tuohy KM, Noakes PS, Miles EA, Calder PC. beta2- males estimated by assay against the international reference preparation.
1 Fructans have a bifidogenic effect in healthy middle-aged human subjects Lancet (1972) 2:1232–3. doi: 10.1016/S0140-6736(72)92277-5
but do not alter immune responses examined in the absence of an in vivo 91. Turner MW, Voller A. Studies on immunoglobulins of Nigerians. I. The
immune challenge: results from a randomised controlled trial. Br J Nutr immunoglobulin levels of a Nigerian population. J Trop Med Hyg (1966)
(2012) 108:1818–28. doi: 10.1017/S0007114511007276 69:99–103.
73. Marteau P, Vaerman JP, Dehennin JP, Bord S, Brassart D, Pochart P, et al. 92. Wells JV. Serum immunoglobulin levels in tropical splenomegaly syndrome
Effects of intrajejunal perfusion and chronic ingestion of Lactobacillus in New Guinea. Clin Exp Immunol (1968) 3:943–51.
johnsonii strain La1 on serum concentrations and jejunal secretions of 93. Aral M, Ekerbicer HC, Celik M, Ciragil P, Gul M. Comparison of effects of
immunoglobulins and serum proteins in healthy humans. Gastroenterol Clin smoking and smokeless tobacco “Maras powder” use on humoral immune
Biol (1997) 21:293–8. system parameters. Mediators Inflammation (2006) 2006:85019. doi:
74. O’Brien BC, McMurray DN. Human plasma lipid and immunologic 10.1155/MI/2006/85019
responses to eggs and ascorbic acid. Nutr Res (1988) 8:353–66. doi: 94. van Larebeke N, Husson B, De Coen W, Pluygers E. Immunologic and other
10.1016/S0271-5317(88)80030-7 biological parameters as a function of smoking status and of residence in
75. Park OJ, Kang NE, Chang MJ, Kim WK. Resistant starch supplementation areas differing in terms of air pollution. Int J Environ Health Res (2003)
influences blood lipid concentrations and glucose control in overweight 13:55–69. doi: 10.1080/0960312021000063313
subjects. J Nutr Sci Vitaminol (Tokyo) (2004) 50:93–9. doi: 10.3177/ 95. Liao M, Ye F, Zhang B, Huang L, Xiao Q, Qin M, et al. Genome-wide
jnsv.50.93 association study identifies common variants at TNFRSF13B associated with
76. Predy GN, Goel V, Lovlin RE, Basu TK. Immune modulating effects of daily IgG level in a healthy Chinese male population. Genes Immun (2012)
supplementation of COLD-fX (a proprietary extract of North American 13:509–13. doi: 10.1038/gene.2012.26
ginseng) in healthy adults. J Clin Biochem Nutr (2006) 39:162–7. doi: 96. Yang M, Wu Y, Lu Y, Liu C, Sun J, Liao M, et al. Genome-wide scan
10.3164/jcbn.39.162 identifies variant in TNFSF13 associated with serum IgM in a healthy
77. Prinz W, Bortz R, Bregin B, Hersch M. The effect of ascorbic acid Chinese male population. PloS One (2012) 7:e47990. doi: 10.1371/
supplementation on some parameters of the human immunological journal.pone.0047990
defence system. Int J Vitam Nutr Res (1977) 47:248–57. 97. Mahassni SH, Ali EYI. The Effects of Firsthand and Secondhand Cigarette
78. Sierra S, Lara-Villoslada F, Sempere L, Olivares M, Boza J, Xaus J. Intestinal Smoking on Immune System Cells and Antibodies in Saudi Arabian Males.
and immunological effects of daily oral administration of Lactobacillus Indian J Clin Biochem (2019) 34:143–54. doi: 10.1007/s12291-018-0739-9
Frontiers in Immunology | www.frontiersin.org 13 April 2021 | Volume 12 | Article 664526You can also read