How do red deer react to increased visitor numbers? A case study on human-deer encounter probability and its effect on cortisol stress responses ...
←
→
Page content transcription
If your browser does not render page correctly, please read the page content below
A peer-reviewed open-access journal
Nature Conservation 43: 55–78 (2021)
doi: 10.3897/natureconservation.43.56266           Conservation In Practice
https://natureconservation.pensoft.net                                                                   Launched to accelerate biodiversity conservation

   How do red deer react to increased visitor numbers?
    A case study on human-deer encounter probability
         and its effect on cortisol stress responses

                       Gabriel Dixon1, Andrew S. Marriott1, Graham Stelfox1,
                                 Chris Dunkerley2, Sven P. Batke1

1 Edge Hill University, Ormskirk, UK 2 National Trust, Stockport, UK

Corresponding author: Gabriel Dixon (dixong@edgehill.ac.uk)

Academic editor: J. Tzanopoulos | Received 7 July 2020 | Accepted 24 December 2020 | Published 26 February 2021

                               http://zoobank.org/C74DAEA8-C67E-4964-81A3-BED1C5C7C25F

Citation: Dixon G, Marriott AS, Stelfox G, Dunkerley C, Batke SP (2021) How do red deer react to increased
visitor numbers? A case study on human-deer encounter probability and its effect on cortisol stress responses. Nature
Conservation 43: 55–78. https://doi.org/10.3897/natureconservation.43.56266

Abstract
The numbers of visitors to greenspaces in the United Kingdom has increased over the last few years as the
health benefits of spending time in greenspaces have become better known. This has led to problems for
conservation ecologists due to increased numbers of reported human-wildlife encounters. Deer are often
found in public spaces and are of particular concern. Previous research suggests elevated levels of stress
hormones (e.g., cortisol) in deer is a result of increased human activity. This has been linked to several neg-
ative effects on the deer’s health. From a practitioner’s point of view, it is therefore important to implement
effective management strategies that are based on scientific evidence to help ensure the welfare of managed
deer populations. In an effort to identify the impact of visitor numbers on faecal cortisol concentrations,
samples from 2 red deer (Cervus elaphus) herds in Lyme Park (Cheshire), United Kingdom, were collected
and analysed. A predictive spatial model was developed based on logistic regression to identify areas within
the park of low and high human-deer encounter probability. The faecal cortisol levels were found to be sig-
nificantly higher on days with a high number of visitors. In addition, landscape features such as buildings
and roads increased the probability of human-deer encounters, whereas woodland and scrub decreased
the probability. However, human-deer encounter probability changed with distance to the features. By
providing local park managers with this scientific data, these findings can directly inform current manage-
ment efforts to reduce deer stress levels in Lyme Park. In addition, the spatial modelling method has the
capacity to be implemented in other parks across the country with minimal cost and effort.

Copyright Gabriel Dixon et al.. This is an open access article distributed under the terms of the Creative Commons Attribution License (CC
BY 4.0), which permits unrestricted use, distribution, and reproduction in any medium, provided the original author and source are credited.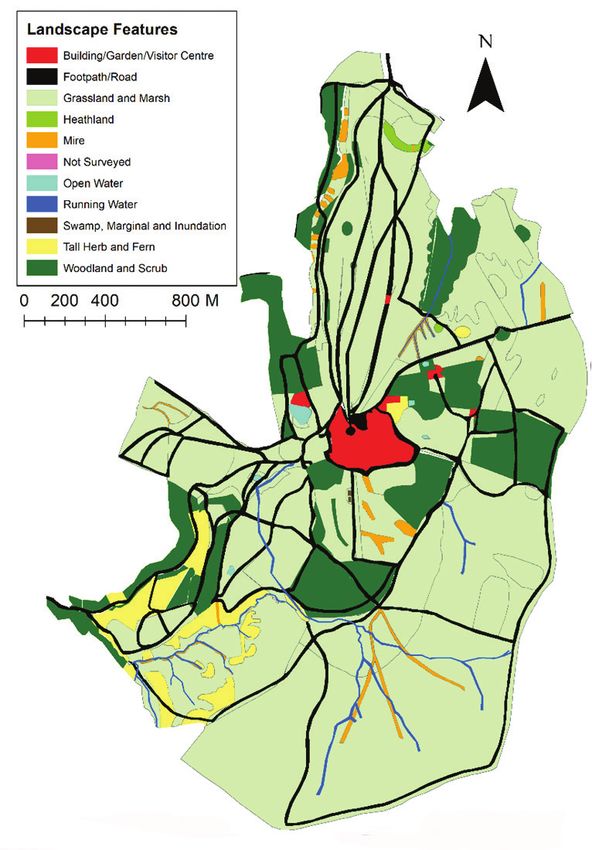
56                    Gabriel Dixon et al. / Nature Conservation 43: 55–78 (2021)

Keywords
Assay, Cervus elaphus, cortisol, modelling, red deer, visitors

Introduction

A Natural England report found that over a seven-year period there has been a 4%
increase in the number of adults visiting a greenspace at least once a week; up to 28
million people or 58% of England’s adult population (Natural England 2011; Natural
England 2017). Recreational use of green spaces has been promoted due to the physical
and mental health benefits it offers such as lowering rates of depression, anxiety, and
high blood pressure (Sandifer et al. 2015; Shanahan et al. 2016; Cox et al. 2017), as well
as reducing brain activity in areas linked to increased mental illness risk (Bratman et al.
2015). The importance of these health-related services has been identified in UK policy,
which highlights them as vital components of nature conservation (DEFRA 2011). This
has resulted in the proportion of health motivated visits to nature rising from approxi-
mately a ⅓ (0.97 billion) of all visits in 2009–2010, to approximately ½ (1.51 billion)
of all visits in 2015–2016 in England (Natural England 2011; Natural England 2017).
     This increase in visitors has led to problems for conservation ecologists, as intensity
of visitors to a habitat has been found to negatively impact various different organisms,
most notably by directing their habitat selection to areas which are less desirable. The
richness and distribution of plants were found to be reduced in highly visited areas
(Jägerbrand and Alatalo 2015; Malavasi et al. 2016); invertebrates, such as Bathyporeia
pelagica, have found to be absent from their preferred and expected habitat solely due
to trampling resulting from human activity (Reyes-Martínez et al. 2015). Both birds
(Thiel et al. 2008; Coppes et al. 2017b, D’Acunto et al. 2018). Mammals were also
found to avoid areas with high human activities which may prevent them from utilis-
ing their optimal habitat (Haigh et al. 2017; Reilly et al. 2017.) Deer are a common
parkland species in the UK, found in over 90 public accessible parks across Britain
(British Deer Society 2018). Previous studies have investigated the differing impacts of
human activity on deer habitat usage (George and Crooks 2006; Sibbald et al. 2011;
Bonnot et al. 2013; Scholten et al. 2018), diet composition (Jayakody et al. 2011) and
behavioural responses (Reimoser 2012). Each of these impacts were found to be linked
to human-induced stress.
     Deer stress is an important management consideration as it is a contributing fac-
tor for the general welfare of a herd. When stressed, the ability of the deer to react
quickly to changes in their environment is hampered and how the deer react to these
changes may be altered (Broom 1991). These altered reactions as a response to stress
could be behavioural: for example, a stressed deer being more likely to respond ag-
gressively to additional stressors, such as a visitor or dog who gets too close – an issue
for parkland sites where the safety of visitors is under constant scrutiny (Hubbard and
Nielson 2009). The reaction could also be physiological, with higher stress levels being
Red Deer: landscape stress probability 57
linked to a decrease in immune system function, reproduction and metabolic processes
(Cherry et al. 2016; Sapolsky et al. 2000).
Site managers are faced with the challenges of mitigating negative impacts to their
deer populations; this includes the growing issue of rising human utilisation of these
greenspaces. This study was carried out in response to this challenge and it was hoped
that the work we carried out could help to bridge the gap between understanding the
impact of human activity on deer stress, and the predicted occurrence of stress events
across a landscape. The results of this study were readily applicable to the herds of red
deer (Cervus elaphus) at a specific site, Lyme Park in Cheshire, UK. The methods and
findings of this study can then be used to inform management in a broader context
and can be utilised at other similar sites. Thus, the main aims of this study were to (a)
explore whether an increase in stress hormones can be attributed to increased visitor
numbers, and to (b) inform the current management practices through the develop-
ment of a spatial model that can predict the chance of a human-deer encounter occur-
ring. Throughout this paper the term human-deer encounter probability will be used to
describe the likelihood of human activity occurring within close proximity to the deer.
Study area
The study was conducted at Lyme Park, Disley, Cheshire, United Kingdom (53.338041,
-2.0547761). The site covers approximately 590 hectares; the native, wild red deer were
enclosed in the park during the 14th century. The site is a large natural area just outside
of Greater Manchester and is popular with visitors from this built-up urban area, and
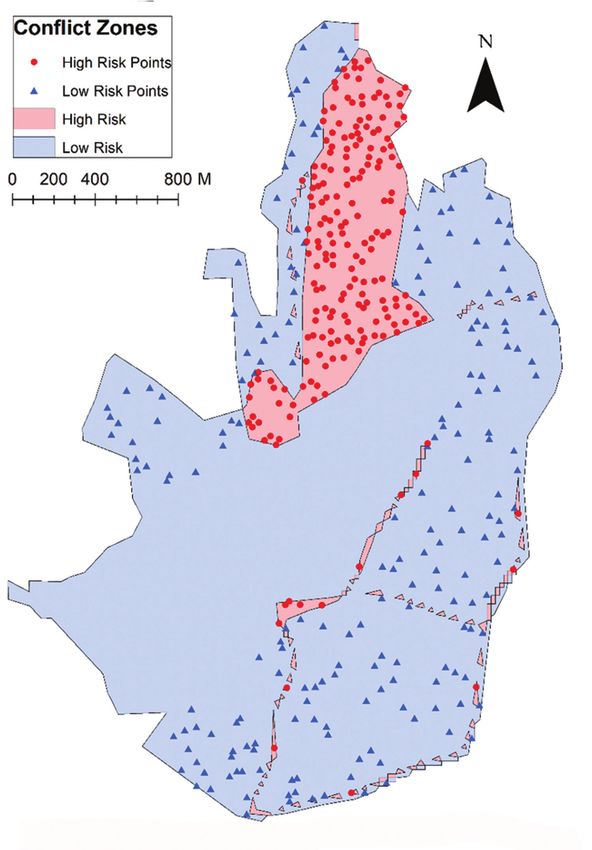
from further afield. Lyme Park is open to visitors around the year. The site vegetation
is predominantly grassland, but the park also contains a range of habitats typical of
Northern England (Fig. 1). Grazing by sheep (Ovis aries), highland cattle (Bos taurus)
and red deer occurred throughout the park with the objective of promoting plant di-
versity. Prior to 2002 deer were able to graze in the whole park until they were fenced
out of a central zone (Fig. 2) due to concerns that increasing visitor numbers would
generate greater disturbance for the deer. When the deer were excluded from the cen-
tral zone they were separated into two herds: one herd was located closer to the main
visitor attractions of the park (the “Park Herd”) and the other was in the less visited
moorland area (the “Moor Herd”). During study period the Park Herd consisted of
approximately 160 animals, and the Moor Herd of approximately 90 animals (Fig. 2).
Over the last 5 years the number of visitors to Lyme Park has risen by approxi-
mately 150,000 individuals based on the number of vehicles entering the site. The
number of total visitors in 2018 is likely closer to 750,000 when accounting for visitors
taking public transport to the site, or walking into the park through alternate entrances
(National Trust 2018a, b). The site is well developed for tourism and is visited all year
round; a large number of these visitors are brought to the park to see its historical fea-
tures. These features include the 16th century mansion house and associated gardens, a
hunting lodge named “the cage” and the deer park (and by extension the deer) itself.
Aside from tourists, the site is frequently visited by local walkers, families and hikers.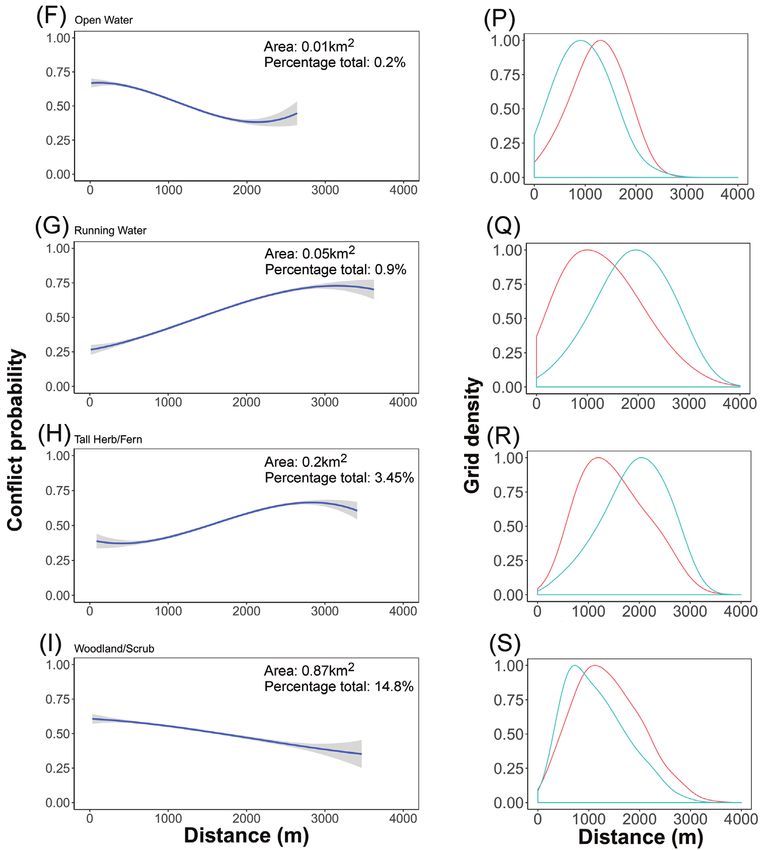
58                   Gabriel Dixon et al. / Nature Conservation 43: 55–78 (2021)

Figure 1. Map of landscape features. Each landscape feature is shown as a different colour. Data collected
from Lyme Park, Disley, UK, in 2018.

Methods
Identifying areas of shared habitat use and landscape features
The experienced park ranger team, made up of four rangers, work in the park every
day of the week for nine hours per day. During the study the rangers had 20 years of
experience visually tracking the movements of the deer daily throughout the year to
carry out management tasks such as feeding and culling the herds. Attention is paid
to which areas of the park the deer use to ensure that the management of the habitat
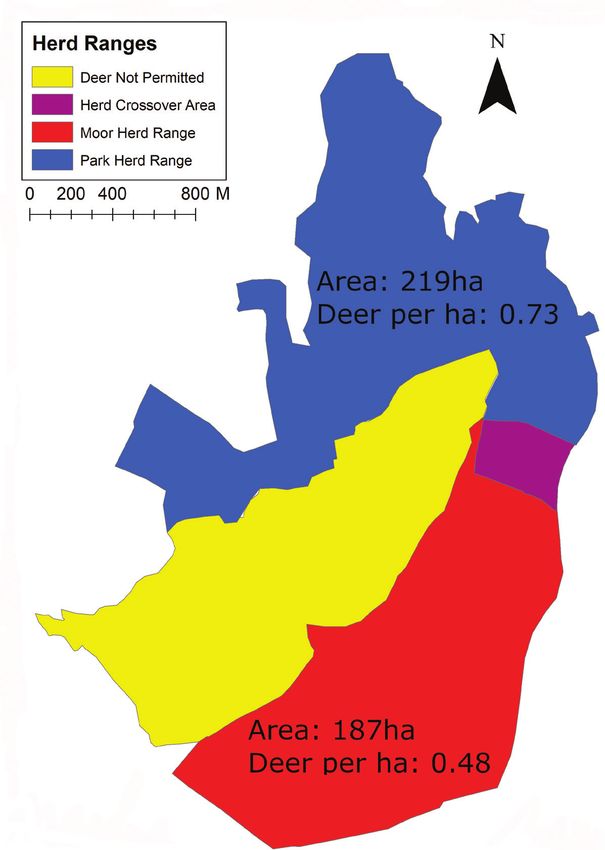
Red Deer: landscape stress probability                              59

Figure 2. Map showing the area open to each of the herds. The herd crossover area (area accessible to
both herds) is included in the total area of both herds. Area where deer are excluded also shown. Data
collected from Lyme Park, Disley, UK, in 2018.

is well informed. We used these historic space-use observations to compile and create
two qualitative maps; one which displayed the areas of the park which were heavily
utilised by the two herds of deer and one which displayed the areas of the park most
heavily utilised by the human visitors. To ensure that the deer and visitor movements
were accurately represented by these maps, observations were visually confirmed by
the authors over approximately 100 hours between June and August in 2018. This was
done by counting the number of visitors and deer in each area of the park for a mini-
60                Gabriel Dixon et al. / Nature Conservation 43: 55–78 (2021)

mum of three hours per day, four days a week over the seven-week study period. This
method was chosen because observational data is usually the only data available to park
managers, due to the high costs and specialised knowledge required to install GPS tags.
Although GPS tracking data would have been desirable, we were not given permission
to tag the deer during the period the study took place. Similarly, our activity data for
visitors relied on observational accounts of the park managers and on visual confirma-
tion of these accounts by the authors of this study.
     The two sets of activity data, human and deer, were used to create two maps;
these maps split the park into areas of high activity (where the visitors/deer were
most often found) and areas of low activity (areas where visitors/deer rarely visited).
The two separate activity maps were overlaid to identify the areas of the park which
are shared and utilised by both the deer herds and human visitors; these areas were
categorised as areas of “High likelihood of encounter”. Conversely, the areas where
deer and human usage did not overlap were categorised as areas of “Low likelihood
of encounter” (Fig. 3).
     Geographical landscape feature information was obtained from the National Trust
as a shapefile (National Trust 2018c). The footpaths and roads were digitised and add-
ed to the maps manually using ArcGIS (2011) and the highest resolution aerials images
available. There was a total of nine landscape features, which could affect the likelihood
of human-deer encounters, identified (Table 1). The area covered by each landscape
feature within each of the herds’ range is presented in Table 2.

Generating distance matrix data
To create a dataset from which encounter probability could be modelled, information pro-
vided by two maps were used to generate a distance matrix. Two hundred random points
were selected from both the low and high encounter zones (Fig. 3) using the ArcGIS (Envi-
ronmental Systems Research Institute, Inc., Redlands, CA, USA) ‘Create Random Points’
tool from the ‘Sampling Toolset’. This resulted in 5,494,400 probability calculations, which
was also the maximum number of calculations that we were able to run on our computer
systems. No points were selected from the deer exclusion zone in the park (Fig. 3).
     The distance matrix required the landscape feature shapefile to be converted into
a raster file; this conversion was carried out using ArcGIS and resulted in the map be-
ing divided into 20×20 m grid cells. Each cell was assigned a landscape cover feature
(Table 1), based on the highest proportion of each feature in a cell. Cells containing
footpaths or roads were prioritised during this assignment, as they are important ac-
cess routes for visitors. This was necessary due to the long, narrow nature of footpaths
and roads, resulting in a low relative area within each of the grid cells. In the case of
running water, we did not prioritise this feature during our assignment because it was
mainly located in areas that visitors did not utilise and because the few small streams
that were in the study area, were mostly seasonal.
     The distance matrix calculated the distance from each selected low and high-risk
points (Fig. 3) to each separate landscape feature in the raster file using the ‘Point Dis-
tance’ tool in ArcGIS.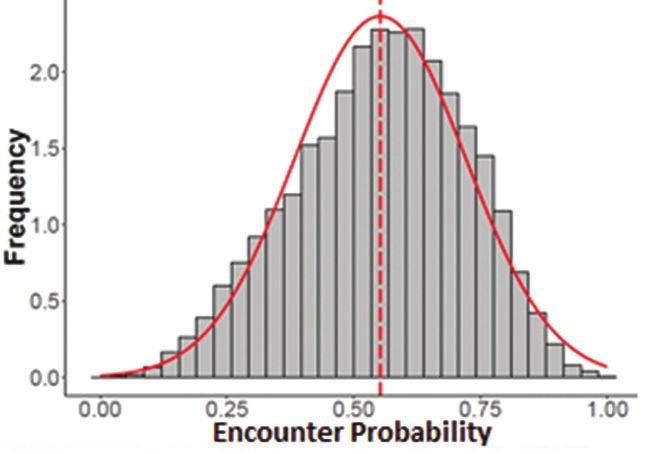
Red Deer: landscape stress probability                                61

Figure 3. Map showing zones where human-deer (Cervus elaphus) encounters have occurred. Locations
of randomly sampled points are shown as red dots (high risk points) and blue triangles (low risk points).
Data collected from Lyme Park, Disley, UK, in 2018.

Mapping encou1nter probability
To determine how landscape features influenced the probability of human-deer en-
counters, a binary logistic regression model was built using the data provided by the
distance matrix as described by Miller et al. (2016). Low and high-encounter points
were used as the binary responses (Fig. 3). The feature predictor variables used in the
model are shown in Table 1. The ‘Not surveyed’ and ‘Swamp, Marginal and Inundation’
features covered only a small area in the two herd ranges (>0.01%) and thus did not
62                         Gabriel Dixon et al. / Nature Conservation 43: 55–78 (2021)

provide enough sample points to include them in any further analysis. Starting with a
global model, ranked models were generated using all combinations of habitat variables
(Table 2); this was carried out using the “gmulti” package in R (R Core team, 2013. R
Version 3.5.1, www.r-project.org, Accessed 12 Dec 2019)
     Akaike’s Information Criterion (AIC) was used to select the best fit model. As
the highest scoring model did not reach an Akaike weight > 0.90, the top 8 models
(Table 3) were averaged to produce the final model. The sum of the AIC scores also
allowed a comparison between the contribution of each habitat variable to the best
fit model using relative importance. Relative importance ranged from 0 to 1, with 1
indicating that the variable made a strong contribution to the model.

Table 1. Predictor variables used in the study. Showing evidence of importance in relation to human-
ungulate encounters.

    Category               Predictor variable – landscape feature (unit)             Evidence of effect on encounter probability
Human Presence            Distance to buildings/gardens/visitor centres (m)           Increased human activity stresses deer. a,b,c,d
                          Distance to recreational routes (roads/paths) (m)
Land Use                         Distance to woodland/scrub (m)                Provide refuge spacec,e and effects vigilance levels of deer. f
                                 Distance to grassland/marsh (m)               Human disturbance can affect foraging.c alongside other
                                     Distance to heathland (m)                                     deer habitat uses.f
                                        Distance to mire (m)
                                   Distance to tall herb/fern (m)
                                  Distance to running water (m)                      Drinking requires the entry to high risk areas,
                                    Distance to open water (m)                               prioritised over vigilance. g
a
  D’Amico et al. 2016; b Sibbald et al. 2011; c Coppes et al. 2017a; d Scholten et al. 2018; e Torres 2012; f Ciuti et al. 2012; g Crosmary
et al. 2012

Table 2. Landscape features in Lyme Park and their relative percentage covered and area, separated for
the Park and Moore deer herd.

           Landscape feature                              Area (hectares)                                       Area (%)
                                                 Moor                        Park                     Moor                      Park
Building/Garden/Visitor centre                    0,52                       1,47                     0,28                      0,67
Footpath/Road                                     8,28                      23,81                     4,43                      10,87
Grassland/Marsh                                  146,38                     146,42                    78,28                     66,86
Heathland                                           0                        1,27                       0                        0,58
Mire                                              2,23                       2,93                      1,19                      1,34
Open water                                          0                        0,83                        0                       0,38
Running water                                     2,56                        0,7                      1,37                      0,32
Tall herb/Fern                                    11,93                      0,35                      6,38                      0,16
Woodland/Scrub                                    15,09                      41,22                     8,07                     18,82

Table 3. Explanatory variables which were included in each of the top 8 models produced. All explana-
tory variables were included in the final average model.

    Explanatory variable         Model 1     Model 2      Model 3    Model 4     Model 5      Model 6      Model 7      Model 8      Average
Build./Gard./Visitors centre       P           P            P          P           P            P            P            P            P
Footpath/Road                      P           P                                   P            P                                      P
Grassland/Marsh                    P           P             P          P                                                              P
Heathland                          P           P             P          P            P            P            P            P          P
Mire                               P                         P                       P                         P                       P
Open water                         P            P            P          P            P            P            P           P           P
Running water                      P            P            P          P            P            P            P           P           P
Tall herb/Fern                     P            P            P          P            P            P            P           P           P
Woodland/Scrub                     P            P            P          P            P            P            P           P           P
Red Deer: landscape stress probability 63
The relationship of each predictor variable to the encounter probability was exam-
ined by holding all variables constant at their mean. To measure the performance of this
binary classifier, a receiver operating characteristic (ROC) curve was generated by plot-
ting the true positive rate (TPR) against the false positive rate (FPR) at various thresh-
old settings. The area under the curve (AUC) was then calculated to assess the model
performance. The probability data of deer-human encounters was then mapped for each
20×20 m grid using ArcGIS. Encounter risk ranged from 0 to 1 and was divided into
five categories (0–0.19, 0.2–0.39, 0.4–0.59, 0.6–0.79, 0.8–1) for mapping purposes.
Determining high and low visitor days
The relative proportion of visitors on each day of the week was retrieved from Google
Visitor Data which uses aggregated and anonymised data from users who have opted in
to Google Location History. This data was used to calculate the percentage of visitors a
day visiting the park: Wednesdays and Thursdays were identified to be days of low visi-
tor numbers (5–8% of total weekly visitors) and Saturdays and Sundays of high visitor
numbers (21–27% of total weekly visitors) (Table 4).
Sample collection
Fresh faecal samples were collected in Lyme Park between June and August 2018. Sam-
ples were determined to be fresh primarily based on direct observation of defecation
events; in cases where the event was not witnessed, pellets in the area immediately va-
cated by the deer were assessed for freshness based on three metrics; level of moistness,
pellet being intact, and resting atop ground flora (Goode et al. 2014). Only samples
which matched all three metrics were collected. To compare cortisol levels between the
Park and Moor herd, we collected ten faecal samples from each herd, every day over a
seven-day period: 25 Jun 2018–1 July 2018 (n = 140). To compare deer cortisol levels
between days that experienced low and high number of visitors (Table 4) 20 additional
samples were collected four times a week on the days following the expected highest
and lowest visitor numbers (Thursday, Friday, Sunday and Monday). This comparison
was only done between individual days. This second set of samples was only collected
from the Park herd over the period 5 July 2018–6 August 2018 (n = 400). These
samples were collected between 5am and 7am, 18 hours after peak visitor hours; a
Table 4. Weekly number of visitors (%) in the summer who visit Lyme Park. Values are based on relative
numbers of visitors extracted from Google analytics (see methodology for further detail).
Day Weekly number of visitors (%)
Monday 16
Tuesday 10
Wednesday 5
Thursday 8
Friday 13
Saturday 21
Sunday 2764 Gabriel Dixon et al. / Nature Conservation 43: 55–78 (2021)
timeframe that has been shown to fall within the gut passage time of cortisol in deer
(Millspaugh et al. 2002).
In order to reduce the effect of different metabolic rates between individual ani-
mals, samples were collected over a short time frame each day and homogenised when
processed in the laboratory (Goymann 2012). The time of the year and the duration
of the collection of the samples (June-August), fell before the rut and before the
females came into esterus. This limited the impact the sex of the deer, and the repro-
ductive state of females, would have over the short six-week period (Gordon 1997;
Huber et al. 2003). To further limit these possible impacts, we avoided the collection
of samples from male deer who tended to isolate themselves from the main group and
from female deer with foals. The fresh samples were stored following standard proto-
col at -20 °C, to prevent further metabolisation, until the extraction and assay analysis
were conducted (Touma and Palme 2005; Konjević et al. 2011; Pavitt et al. 2016).
Hormone extraction and assay analysis
We used the DetectX Steroid Immunoassay Kit from Arbor Assays for the cortisol
analysis (catalogue #K003-H5). This kit was validated for dried faecal extracts by the
manufacturer and had been used to measure cortisol in a number of previous stud-
ies (Brand et al. 2016; Chen et al. 2017; Endo et al. 2018). The hormone extraction
and assay analysis followed the manufacturer’s guidelines (Arbor Assays 2009) with 2
alterations: all samples were processed wet and methanol was used in place of ethanol
during the extraction procedure. These changes were based on the recommendations
of a steroid extraction review (Palme 2012).
All samples were defrosted and all samples from a single day were homogenised.
Two 0.5g amounts of wet homogenised sample were weighed out (treated as replicates
for each weekday). We added 5 mL of 90% (v/v) methanol and incubated the samples
at room temperature on an orbital shaker overnight. To remove any insoluble material
the samples were centrifuged at 500 g for 20 minutes; solvents were removed from the
supernatant in a SpeedVac at 60 °C until dry. All the dried homogenised pellets from
each day were resuspended in a total volume of 500 µL 90% (v/v) methanol.
Resuspended samples were diluted in assay buffer at a 1:20 ratio. 50 µL of samples
and standards were pipetted into the relevant wells; 75 µL of assay buffer were pipetted
into each of the non-specific binding (NSB) wells. 50 µL of assay buffer was pipetted into
the maximum binding (B0) wells. 25 µL of cortisol conjugate was added to each well,
followed by 25 µL of cortisol antibody to each well (except the NSB wells). The plate was
covered with a plate sealer and rotated on an orbital shaker at room temperature for 1
hour. The wells were aspirated before being washed four times with 300 µL wash buffer.
100 µL of the TMB Substrate was added to each well and the plates were incubated at
room temperature for 30 minutes. 50 µL of the stop solution was added to each well.
The optical density generated from each well was read using an ASYS UVM340 plate
reader at 450 nm. Cortisol concentrations were determined from these readings us-
ing the manufacturers’ online data analysis tool (MyAssays Ltd., https://www.myassays.
com/arbor-assays-detectx-cortisol (extended-range) assay, Accessed 12 Dec 2019).Red Deer: landscape stress probability 65
Statistical analysis of the cortisol levels
To test for data normality a Shapiro-Wilk test was used. To test homogeneity a Bar-
tlett test was used. A t-test was used to test for difference in cortisol levels between
the two herds. A Kruskal Wallis test was used to test for differences between visitor
days. Significance threshold was set at p = 0.05. All statistical analysis was carried
out in R (2013).
Results
Model validation and feature probability
The power and accuracy of the best fit model (Table 5) to predict the probability of an
encounter occurring within a grid square, based on landscape features, was validated
using a ROC curve (Fig. 4). The high AUC (AUC = 0.92) suggests that the model had
Table 5. Results from best fit model. All explanatory variables were included in this model.
Feature Estimate Standard Error t Value
(Intercept) 7.49×10⁻¹ 2.4×10⁻² 31.194**
Building/Garden/Visitors centre 1.44×10⁻⁴ 8.35×10⁻⁶ -17.292**
Footpath/Road -2.91×10⁻⁵ 5.24×10⁻⁶ -5.546**
Grassland/Marsh 2.98×10⁻⁵ 4.87×10⁻⁶ 6.118**
Heathland 2.21×10⁻⁴ 4.09×10⁻⁶ -53.91**
Mire -1.06×10⁻⁵ 4.93×10⁻⁶ -2.153*
Open water -1.52×10⁻⁴ 7.62×10⁻⁶ -19.992**
Running water 1.59×10⁻⁴ 5.12×10⁻⁶ 31.044**
Tall Herb/Fern 1.28×10⁻⁴ 5.67×10⁻⁶ 22.656**
Woodland/Scrub -6.97×10⁻⁵ 5.88×10⁻⁶ -11.839**
*Significant at p66 Gabriel Dixon et al. / Nature Conservation 43: 55–78 (2021) Figure 51. A–E human-deer (Cervus elaphus) encounter probability modelled with distance to each feature. The 95% confidence intervals are shown in grey K–O Density distribution of randomly sampled high-encounter points (blue) and low-encounter points (red) modelled with distance to each feature. Data collected from Lyme Park, Disley, UK, in 2018.
Red Deer: landscape stress probability                               67

Figure 511. Continued. F–I human-deer (Cervus elaphus) probability modelled with distance to each
feature. The 95% confidence intervals are shown in grey P–S Density distribution of randomly sampled
high-encounter points (blue) and low-encounter points (red) modelled with distance to each feature. Data
collected from Lyme Park, Disley, UK, in 2018.

a good predictability (Robertson et al. 1983; Swets 1988). For each modelled landscape
feature, the encounter risk probability was plotted in relation to geographical distance.
Running water, grassland/marsh, and tall herb/fern exhibited a positive correlation
between encounter probability and increased distance. Building/garden/visitor centre,
footpath/road, heathland, mire, open water and woodland/scrub exhibited a negative
correlation between encounter probability and increased distance. Encounter prob-
ability was highest close to Building/Garden/Visitor Centre landscape features (Fig. 5).
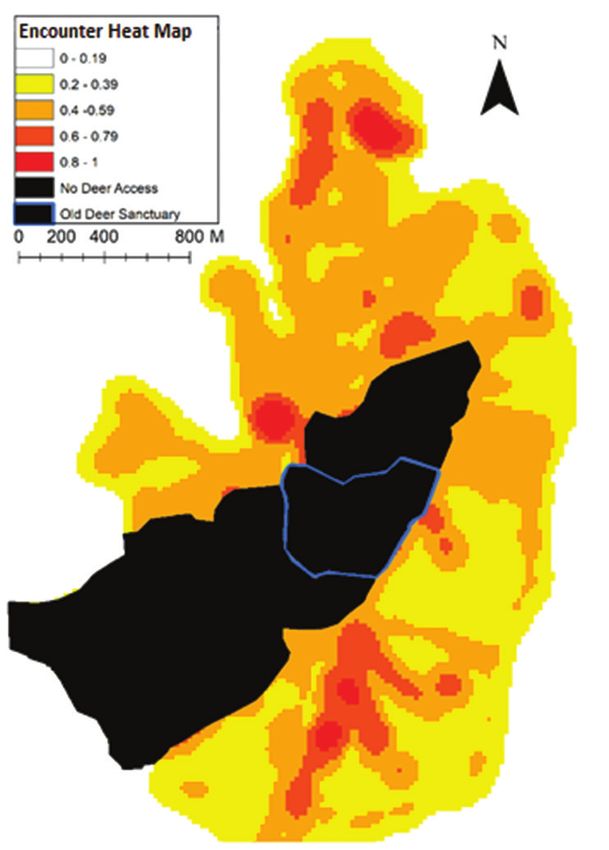
68                  Gabriel Dixon et al. / Nature Conservation 43: 55–78 (2021)

Encounter heatmap
The encounter heatmap takes the results of the model and applies them to create a
visualisation of the spatial distribution of encounter probability (Fig. 6). The map
shows high-encounter probabilities were predicted in the central areas of the park,
generally aligning with areas where high visitor activity has been observed, most
notably around the main visitor attraction of the house and lake. Low probability
of encounter was predicted in areas of predominately Grassland/Marsh which were
not close to other landscape features. The south of the park had the greatest pro-
portion of low-encounter area. Five percent (0.29 km2) of Lyme Park fell into the
highest risk category (0.8–1), with a mean encounter probability across the park of
0.55 (Fig. 7).

Figure 6. Modelled probability of human-deer (Cervus elaphus) encounters based on landscape features.
Spatial grain= 20 m. The darker the colour, the greater the probability of encounters occurring. The
hatched area is currently not accessible by deer but was included for the mapping of the spatial model.
Area outlined in blue is an old deer refuge area that may be reopened in future. Data collected from Lyme
Park, Disley, UK, in 2018.
Red Deer: landscape stress probability                                  69

Figure 7. Frequency histogram showing encounter probability for all spatial grains (n=66,902). The y-axis
is a proportional scale (2=3000). Data collected from Lyme Park, Disley, UK, in 2018.

Faecal cortisol
The assay results showed that cortisol levels differed significantly between the herds (t
= 2.27, df = 26, P = 0.03), with the Moor Herd (M = 8329.14, SD = 4142.2) being
significantly higher than the Park Herd (M = 5135.29, SD = 3266.05). The cortisol
levels were only found to be significantly higher on Sundays compared to Wednesdays;
comparisons between the other days found no significant differences (Fig. 8).

Figure 8. Mean faecal cortisol concentrations and 95% confidence interval from samples collected at
different days of the week. Different letters indicate significant differences at p=0.05. The grey box above
the figure shows the weekly percentage (of the total) visitor numbers during the period when the samples
were collected. Data collected from Lyme Park, Disley, UK, in 2018.
70                Gabriel Dixon et al. / Nature Conservation 43: 55–78 (2021)

Discussion
The study found a link between the numbers of visitors in the park and the amount
of cortisol found in the faecal matter of the deer. This was a notable finding for the
rangers at the site who could use these results to strengthen the argument that visitors
are indeed having an impact on the wellbeing of the herd. The impact of human activ-
ity in green spaces is an issue that is likely to increase in the future, as the pressure on
British green spaces will grow with an increase in population. Our encounter prob-
ability map can become a useful tool for rangers to inform their management practices
on the ground. Although the map presented here used Lyme Park as a study system,
the methodology used can be applied by other, different sites, or species of conserva-
tion/malmanagement concern, in order to better understand encounter probability
between humans and wildlife.
     Previous studies used several different methods to measure deer stress levels, in-
cluding blood sampling (Jones and Price 1992; Huber et al. 2017), hair sampling
(Caslini et al. 2016) and clinical assessments (Montane et al. 2002). A non-invasive
technique, which did not require the capture of the deer, was prioritised for this study.
The measurement of cortisol levels in faecal samples provided an insight into deer stress
levels whilst avoiding additional stress from the collection of this data. This method
had been used successfully by several other studies (Millspaugh et al. 2002; Jayakody
et al. 2011; Landry et al. 2016; Zbyryt et al. 2018).
     The mean cortisol levels of the herd were related to the percentage of weekly visi-
tors to the park on each of the days. Post Hoc, pairwise comparisons using the Tukey
and Kramer (Nemenyi) test with Tukey-Dist approximation for independent samples
indicated that the cortisol levels were only found to be significantly higher on Sundays
compared to Wednesdays; comparisons between the other days found no significant
differences (Fig. 8). The large error bars displayed for the combined Saturday reading
were due to this day containing the largest variance in result values. This could poten-
tially be explained by either abnormal stress events affecting the deer on individual
Saturdays, or by fluctuations in visitor numbers due to external factors. Lyme Park is
free of large predators, leaving humans (and their dogs) as the primary predator-related
stress factor for the deer. Zbyryt et al. (2018) also showed in their work that proximity
to humans increased the frequency of stressful events and, as a result, the intensity of
the animals’ hormonal response also increased.
     In addition, faecal cortisol levels were also compared between the two herds pre-
sent in the park. The result was unanticipated as we found the moor herd, which is ex-
posed to fewer visitors, was found to have significantly higher cortisol levels compared
to the park herd and was located in the area with the lower probability of encounter.
     Habituation is a possible explanatory factor for why cortisol levels in the park herd
were lower. Repeated exposure to the stressor is a requirement for habituation to oc-
cur (Romero 2004). As the Park Herd is exposed to many visitors moving within their
range every day, they are likely to have acclimated to visitor presence to a greater degree
compared to the Moor herd. This acclimatisation may result in the park herd avoiding
Red Deer: landscape stress probability 71
areas of high disturbance, which they can recognise through repeated exposure. This
type of avoidance behaviour has been highlighted as a result of habituation occurring
(Bonnot et al. 2013).
In the case of Lyme Park these high disturbance areas may be the areas surrounding
the gates and the car parks which are extremely busy. The possibility that the park herd
has habituated to the visitors may have mitigated the stress response but it has not been
eliminated completely, hence this is why the busier visitor days still had an impact on
them. During the study the deer were observed being extremely wary of humans and
would flee if approached, suggesting that the herd has not been completely habituated.
As the moor herd was not subjected to the same level of visitor numbers with the same
regularity and predictability, they may not have developed the same avoidance strate-
gies as the park herd, meaning less mitigation of their stress response.
A second explanatory factor may be the differences in habitat types found in each of
the herd’s ranges. The map generated allows for the visualisation of how each landscape
feature interacts across the spatial frame of Lyme Park. This allows the role of habitat
to be examined in greater depth. The main feature which was comparatively sparse
in the moor herds range was woodland and scrub. Studies have indicated this type of
landscape provides refuge areas where ungulates can avoid stressors, particularly preda-
tors (Torres et al. 2012). As humans are perceived by deer as potential predators, tree
cover could be utilised in much the same way (Ciuti et al. 2012). This refuge-seeking
response to human activity has been found to be most prevalent during summer days
(Coppes et al. 2017a) during a similar time when we collected our data. The increased
need to maintain constant vigilance is a behaviour intrinsically linked to disturbance
and has been correlated with decreasing time spent feeding and increased stress levels
(Torres et al. 2012). The effects of lacking refuge could be exacerbated by the weather
such as wind and precipitation in the winter, and as shelter from the heat and sun in
summer. Exposure to these types of weather conditions due to a lack of cover has been
found to result in higher cortisol levels in ungulates (Landry et al. 2016). Whilst this
possibility has been supported by the aforementioned papers, it is important to note
that the quantification of vegetation cover was not carried out as part of this study.
Doing so could offer a greater insight into the suitability of the habitats at Lyme Park
to act as sufficient cover.
The importance of the woodland/scrub landscape feature as a refuge can also
be looked at across the entirety of the park. Our model found that the closer a
point was to woodland/scrub, the lower the expected encounter probability was.
This again supports its utilisation by deer as a refuge in areas where human activity
is prevalent (Ciuti et al. 2012; Torres et al. 2012; Coppes et al. 2017a). Red deer in
less forested sites have also been found to exhibit a stronger reaction to disturbance
than those in more densely forested sites (Jarnemo and Wikenros 2014). The cur-
rent management at Lyme Park reflects this thinking: a section of woodland within
the park herd range is closed to the public, providing a refuge area for the herd. A
similar refuge area is not present in the moor herds’ range: this offers an opportunity
for management to be altered to reduce the probability of human-deer encounters.72 Gabriel Dixon et al. / Nature Conservation 43: 55–78 (2021)
Opening the old deer sanctuary area (Fig. 6), would likely be a good option. This
area is wooded, a feature which is currently lacking in the Moor Herds’ range. It
would be preferable to restrict human access to this area. If this is not possible it
could be considered only for peak visiting hours. This would provide additional
refuge area for the deer, as well as providing a buffer between the busier central area
of the park and the rest of the herds’ range.
To try to reduce deer cortisol levels across the entire park the map and model
we produced is useful as it outlined the relationship between encounter probability
and the distance to individual landscape features (Figs 5, 6). As human presence is a
required factor for human deer encounters to occur, it is not surprising that the areas
in the park which attract many of the visitors increase the probability of humans and
deer encounters. This is especially true in the case of Lyme Park, where the deer are
considered a visitor attraction and as a result are actively sought out by some visitors.
An example of an area where visitors were abundant and encounter risk was high is
the main house, gardens, and particularly the lake. Open water is an essential habitat
resource, which has been found to be a strong driver for habitat selection by deer (Wu
et al. 2016; Coppes et al. 2017a). Our model predicted that the closer to open water a
point was, the higher the encounter probability. The map also shows this relationship
with the lake falling into a red, high encounter probability zone (Fig. 6). The lake is
a popular destination for visitors due to its location beside the café. It is also popular
with deer whenever there are no visitors in the park, e.g. early morning. Despite run-
ning water similarly being an essential habitat resource it exhibits the opposite relation-
ship; this is likely because it falls outside of the high visitor areas. Providing alternate
open water accessible to the deer but not to visitors may help reduce deer stress levels.
Similarly, low-encounter areas can also be useful as they can provide a template
for low stress deer habitat which can then be emulated in other areas of the park, par-
ticularly in identifying areas that can improve alternate areas of deer refuges (Torres et
al. 2012; Coppes et al. 2017a). Not all landscape features showed a clear relationship
between distance and encounter probability: the most notable example is the grass-
land/marsh feature. This covered the largest habitat area in both the high and low risk
zones (Table 2). The encounter probability remained relatively stable as risk points
from either encounter zones are generally near to this feature. At the greatest distances
encounter probability increased as the confidence intervals widened (Fig. 8).
Conclusion and management implications
Finding ways to reduce the probability of human-deer encounters is an important con-
sideration for the management of this site, and, by extension, other similar sites. The
site managers want to reduce the stress responses these encounters cause, as it has the
potential to impair biological functions and lower survival rates of their deer popula-
tions (Sapolsky et al. 2000). The impact the visitors are having on deer stress levels isRed Deer: landscape stress probability 73
an inherent problem due to the nature of the site. Restricting visitor access to larger
areas of the park where the herds are primarily situated would also greatly reduce the
risk of human-deer encounters. However, this would need to be balanced against the
loss of potential visitors and the funds they bring. A more realistic aim which would
keep the majority of the park open, whilst giving the deer relief from human activity
would be to mitigate the risk of human-deer encounters occurring specifically close to
deer refuge areas. This mitigation of deer stress could be further supported through the
creation of more deer refuge areas, particularly the old deer sanctuary in moor herds’
range; the creation of alternate open water sources away from high visitor areas and the
emulation of low encounter habitat in other higher risk areas of the park.
The methods used in this study could be adapted and transferred to inform local
conservation management elsewhere. The results of our cortisol experiment support
other studies which found that human disturbance can negatively impact deer stress
levels. This alone should give reason for managers at sites which contain deer to con-
sider the impact visitor numbers may be having on their herds. As the visitor pressure
increases across British greenspaces this is likely to become a more prevalent problem.
Although some of these negative effects may be reduced by increased habituation of
the deer to visitors, this paper has shown that even herds exposed to human activity
over a period of decades still exhibit an increase in cortisol levels on days when visitor
numbers are highest. The mapping and modelling systems used in this paper could
readily be adapted for other sites to help modify deer management to help limit the
impact of human disturbance. The model and map would allow for the identification
of high encounter zones which would require mitigated or low encounter zones to
be promoted. Although the management recommendations are linked to the unique
landscape of Lyme Park, they are rooted in the findings of other papers, making them
generally applicable. In particular, the importance of refuge areas is something manag-
ers should not overlook as it is a valuable resource highlighted in our own paper and
supported by other studies.
Acknowledgements
This collaboration came about through the Knowledge Transfer Partnership, initiated
by the University of Manchester and the National Trust. We thank the National Trust
for giving us site access and collection permits for Lyme Park and the Biology Depart-
ment at Edge Hill University for their financial and facility support. Specifically, we
would like to thank B. Wilcock for his support during this project.
Compliance with ethical standards
All applicable international, national, and/or institutional guidelines for the care and
use of animals were followed.74 Gabriel Dixon et al. / Nature Conservation 43: 55–78 (2021)
References
ArcGIS (2011) Environmental Systems Research Institute, Inc., Redlands, CA, USA
Arbor Assays (2009) Arbor Assays, Ann Arbor, MI, USA, https://www.arborassays.com/docu-
mentation/inserts/K003-H.pdf [Accessed 12 Dec 2019]
Bonnot NC, Morellet N, Verheyden H, Cargnelutti B, Lourtet B, Klein F, Hewison AJM
(2013) Habitat use under predation risk: Hunting, roads and human dwellings influence
the spatial behaviour of roe deer. European Journal of Wildlife Research 59(2): 185–193.
https://doi.org/10.1007/s10344-012-0665-8
Brand CM, Boose KJ, Squires EC, Marchant LF, White FJ, Meinelt A, Snodgrass JJ (2016)
Hair plucking, stress, and urinary cortisol among captive bonobos (Pan paniscus). Zoo
Biology 35(5): 415–422. https://doi.org/10.1002/zoo.21320
Bratman GN, Hamilton JP, Hahn KS, Daily GC, Gross JJ (2015) Nature reduces rumination
and sgPFC activation. Proceedings of the National Academy of Sciences of the United
States of America 112(28): 8567–8572. https://doi.org/10.1073/pnas.1510459112
British Deer Society (2018) BDS Captive Deer Survey. https://www.bds.org.uk/index.php/
documents/233-bds-captive-deer-survey-public-sites-forbds-website-as-at-10-may-18 [Ac-
cessed 12 Dec 2019]
Broom DM (1991) Animal welfare: Concepts and measurement. Journal of Animal Science
69(10): 4167–4175. https://doi.org/10.2527/1991.69104167x
Caslini C, Comin A, Peric T, Prandi A, Pedrotti L, Mattiello S (2016) Use of hair cortisol analy-
sis for comparing population status in wild red deer (Cervus elaphus) living in areas with
different characteristics. European Journal of Wildlife Research 62: 713–723. https://doi.
org/10.1007/s10344-016-1049-2
Chen H, Yao H, Yang W, Fan P, Xiang Z (2017) Assessing the utility of urinary and fecal corti-
sol as an indicator of stress in golden snub-nosed monkeys (Rhinopithecus Roxellana). PeerJ
5: e3648. https://doi.org/10.7717/peerj.3648
Cherry M, Morgan K, Rutledge B, Conner L, Warren R (2016) Can coyote predation risk
induce reproduction suppression in white‐tailed deer? Ecosphere 7(10). https://doi.
org/10.1002/ecs2.1481
Ciuti S, Northrup JM, Muhly TB, Simi S, Musiani M, Pitt JA, Boyce MS (2012) Effects of
humans on behaviour of wildlife exceed those of natural predators in a landscape of fear.
PLoS One 7(11): e50611. https://doi.org/10.1371/journal.pone.0050611
Coppes J, Burghardt F, Hagen R, Suchant R, Braunisch V (2017a) Human recreation af-
fects spatio-temporal habitat use patterns in red deer (Cervus elaphus). PLoS One 12(5):
e0175134. https://doi.org/10.1371/journal.pone.0175134
Coppes J, Ehrlacher J, Thiel D, Suchant R, Braunisch V (2017b) Outdoor recreation causes
effective habitat reduction in capercaillie Tetrao urogallus: A major threat for geographi-
cally restricted populations. Journal of Avian Biology 48(12): 1583–1594. https://doi.
org/10.1111/jav.01239
Cox DTC, Shanahan DF, Hudson HL, Plummer KE, Siriwardena GM, Fuller RA, Anderson K,
Hancock S, Gaston KJ (2017) Doses of neighborhood nature: Тhe benefits for mental health
of living with nature. Bioscience 67(2): 147–155. https://doi.org/10.1093/biosci/biw173Red Deer: landscape stress probability 75
D’Acunto LE, Spaul RJ, Heath JA, Zollner PA (2018) Simulating the success of trail closure
strategies on reducing human disturbance to nesting Golden Eagles. The Condor 120(3):
703–718. https://doi.org/10.1650/CONDOR-17-223.1
DEFRA (2011) The natural choice: securing the value of nature. https://www.gov.uk/government/
uploads/system/uploads/attachment_data/file/228842/8082.pdf [Accessed 12 Dec 2019]
Endo N, Yamane H, Rahayu LP, Tanaka T (2018) Effect of repeated adrenocorticotropic hor-
mone administration on reproductive function and hair cortisol concentration during the
estrous cycle in goats. General and Comparative Endocrinology 259: 207–212. https://
doi.org/10.1016/j.ygcen.2017.11.027
George SL, Crooks KR (2006) Recreation and large mammal activity in an urban nature reserve.
Biological Conservation 133(1): 107–117. https://doi.org/10.1016/j.biocon.2006.05.024
Goode MJ, Beaver JT, Muller LI, Clark JD, van Manen FT, Harper CA, Basinger PS (2014)
Capture–recapture of white‐tailed deer using DNA from fecal pellet groups. Wildlife Biol-
ogy 20(5): 270–278. https://doi.org/10.2981/wlb.00050
Gordon IR (1997) Controlled reproduction in horses, deer, and camelids. CABI, New York,
New York, USA.
Goymann W (2012) On the use of non‐invasive hormone research in uncontrolled, natural en-
vironments: The problem with sex, diet, metabolic rate and the individual. Methods in Ecol-
ogy and Evolution 3(4): 757–765. https://doi.org/10.1111/j.2041-210X.2012.00203.x
Haigh A, Butler F, O’Riordan R, Palme R (2017) Managed parks as a refuge for the threatened
red squirrel (Sciurus vulgaris) in light of human disturbance. Biological Conservation 211:
29–36. https://doi.org/10.1016/j.biocon.2017.05.008
Hubbard RD, Nielson CK (2009) White-tailed deer attacking humans during the fawning sea-
son: a unique human-wildlife conflict on a university campus. Human-Wildlife Conflicts
3: 129–135. https://www.jstor.org/stable/24875694
Huber S, Palme R, Zenker W, Möstl E (2003) Non-invasive monitoring of the adrenocortical
response in red deer. The Journal of Wildlife Management 67(2): 258–266. https://doi.
org/10.2307/3802767
Huber N, Vetter GG, Evans AL, Kjellander P, Küker S, Bergvall UA, Arnemo JM (2017)
Quantifying capture stress in free ranging European roe deer (Capreolus capreolus). BMC
Veterinary Research 13(1): 127. https://doi.org/10.1186/s12917-017-1045-0
Jägerbrand AK, Alatalo JM (2015) Effects of human trampling on abundance and diversity
of vascular plants, bryophytes and lichens in alpine heath vegetation, Northern Sweden.
SpringerPlus 4(1): 95. https://doi.org/10.1186/s40064-015-0876-z
Jarnemo A, Wikenros C (2014) Movement pattern of red deer during drive hunts in Sweden.
European Journal of Wildlife Research 60(1): 77–84. https://doi.org/10.1007/s10344-
013-0753-4
Jayakody S, Sibbald AM, Mayes RW, Hooper RJ, Gordon IJ, Lambin X (2011) Effects of hu-
man disturbance on the diet composition of wild red deer (Cervus elaphus). European Jour-
nal of Wildlife Research 57(4): 939–948. https://doi.org/10.1007/s10344-011-0508-z
Jones AR, Price SE (1992) Measuring the responses of fallow deer to disturbance. In: Brown RD
(Ed.) The biology of deer. Springer, New York, 211–216. https://doi.org/10.1007/978-1-
4612-2782-3_4976 Gabriel Dixon et al. / Nature Conservation 43: 55–78 (2021)
Konjević D, Janicki Z, Slavica A, Severin K, Krapinec K, Božić F, Palme R (2011) Noninvasive
monitoring of adrenocortical activity in free-ranging fallow deer (Dama dama L.). Eu-
ropean Journal of Wildlife Research 57(1): 77–81. https://doi.org/10.1007/s10344-010-
0401-1
Landry DW, Metcalf C, Breuner W (2016) Recreational aviation and wildlife: Тhe physiologi-
cal stress response in deer and associated user perceptions. Intermountain Journal of Sci-
ences 22(4).
Malavasi M, Santoro R, Cutini M, Acosta ATR, Carranza ML (2016) The impact of human
pressure on landscape patterns and plant species richness in Mediterranean coastal dunes.
Plant Biosystems 150(1): 73–82. https://doi.org/10.1080/11263504.2014.913730
Miller JRB, Jhala YV, Jena J (2016) Livestock losses and hotspots of attack from tigers and
leopards in Kanha Tiger Reserve, Central India. Regional Environmental Change 16(1):
17–29. https://doi.org/10.1007/s10113-015-0871-5
Millspaugh JJ, Washburn BE, Milanick MA, Beringer J, Hansen LP, Meyer TM (2002) Non-
invasive techniques for stress assessment in white-tailed deer. Wildlife Society Bulletin 30:
899–907. https://www.jstor.org/stable/3784245
Montane J, Marco I, Lopez-Olvera J, Manteca X, Lavin S (2002) Transport stress in roe deer
(Capreolus capreolus): Effect of a short-acting antipsychotic. Animal Welfare (South
Mimms, England) 11: 405–417.
MyAssays Ltd (2010) “Four Parameter Logistic Curve” online data analysis tool, MyAssays
Ltd. https://www.myassays.com/how-to-reference-myassays.html [Accessed 12 Dec 2019]
National Trust (2018a) Busy days and planning your visit to Lyme. https://www.nationaltrust.
org.uk/lyme/features/busy-days-at-lyme [Accessed 12 Dec 2019]
National Trust (2018b) Exciting times ahead – major improvements are coming to Lyme! htt-
ps://www.nationaltrust.org.uk/lyme/features/exciting-times-ahead---major-improvement-
sto-lyme-are-coming [Accessed 12 Dec 2019]
National Trust (2018c) National trust open data: land – limited access. https://uknationaltrust.
opendata.arcgis.com/datasets/f3cd21fd165e4e3498a83973bb5ba82f_0 [requires permis-
sions, Accessed 12 Dec 2019]
Natural England (2011) monitor of engagement with the natural environment: The national
survey on people and the natural environment. Annual Report from the 2009–2010 sur-
vey. http://publications.naturalengland.org.uk/file/72039 [Accessed 12 Dec 2019]
Natural England (2017) Monitor of engagement with the natural environment the national
survey on people and the natural environment. Technical Report from the 2015–2016
survey. https://assets.publishing.service.gov.uk/government/uploads/system/uploads/at-
tachment_data/file/612705/mene-technical-report-2015-16.pdf [Accessed 12 Dec 2019]
Palme R (2012) Monitoring stress hormone metabolites as a useful, non-invasive tool for wel-
fare assessment in farm animals. Animal Welfare (South Mimms, England) 21(3): 331–
337. https://doi.org/10.7120/09627286.21.3.331
Pavitt AT, Pemberton JM, Kruuk LEB, Walling CA (2016) Testosterone and cortisol concen-
trations vary with reproductive status in wild female red deer. Ecology and Evolution 6(4):
1163–1172. https://doi.org/10.1002/ece3.1945Red Deer: landscape stress probability 77
R Core Team (2013) R: A language and environment for statistical computing. R Foundation
for Statistical Computing, Vienna, Austria. http://www.R-project.org/
Reilly ML, Tobler MW, Sonderegger DL, Beier P (2017) Spatial and temporal response of wild-
life to recreational activities in the San Francisco Bay ecoregion. Biological Conservation
207: 117–126. https://doi.org/10.1016/j.biocon.2016.11.003
Reimoser S (2012) Influence of anthropogenic disturbances on activity, behaviour and heart
rate or roe deer (Capreolus capreolus) and red deer (Cervus elaphus), in context of their
daily and yearly patterns, Vienna. Nova Science Publishers.
Reyes-Martínez MJ, Ruíz-Delgado MC, Sánchez-Moyano JE, García-García FJ (2015) Re-
sponse of intertidal sandy-beach macrofauna to human trampling: An urban vs. natu-
ral beach system approach. Marine Environmental Research 103: 36–45. https://doi.
org/10.1016/j.marenvres.2014.11.005
Robertson EA, Zweig MH, Van Steirteghem AC (1983) Evaluating the clinical efficacy of
laboratory tests. American Journal of Clinical Pathology 79(1): 78–86. https://doi.
org/10.1093/ajcp/79.1.78
Romero LM (2004) Physiological stress in ecology: Lessons from biomedical research trends.
Ecology and Evolution 19(5): 249–255. https://doi.org/10.1016/j.tree.2004.03.008
Sandifer PA, Sutton-Grier AE, Ward BP (2015) Exploring connections among nature, bio-
diversity, ecosystem services, and human health and well-being: Opportunities to en-
hance health and biodiversity conservation. Ecosystem Services 12: 1–15. https://doi.
org/10.1016/j.ecoser.2014.12.007
Sapolsky RM, Romero LM, Munck AU (2000) How do glucocorticoids influence stress re-
sponses? Integrating permissive, suppressive, stimulatory, and preparative actions. Endo-
crine Reviews 21(1): 55–89. https://doi.org/10.1210/er.21.1.55
Scholten J, Moe SR, Stein RM, Hegland SJ (2018) Red deer (Cervus elaphus) avoid mountain
biking trails. European Journal of Wildlife Research 64(1): 8. https://doi.org/10.1007/
s10344-018-1169-y
Shanahan DF, Bush R, Gaston KJ, Lin BB, Dean J, Barber E, Fuller RA (2016) Health ben-
efits from nature experiences depend on dose. Scientific Reports 6: 28551. https://doi.
org/10.1038/srep28551
Sibbald AM, Hooper RJ, McLeod JE, Gordon I (2011) Responses of red deer (Cervus ela-
phus) to regular disturbance by hill walkers. European Journal of Wildlife Research 57(4):
817–825. https://doi.org/10.1007/s10344-011-0493-2
Swets JA (1988) Measuring the Accuracy of Diagnostic Systems. Science 250(4857): 1285–
1293. https://doi.org/10.1126/science.3287615
Thiel D, Jenni‐Eiermann S, Braunisch V, Palme R, Jenni L (2008) Ski tourism affects habi-
tat use and evokes a physiological stress response in capercaillie Tetrao urogallus: A new
methodological approach. Journal of Applied Ecology 45(3): 845–853. https://doi.
org/10.1111/j.1365-2664.2008.01465.x
Torres RT, Virgós E, Santos J, Linnell JDC, Fonseca C (2012) Habitat use by sympatric red
and roe deer in a Mediterranean ecosystem. Animal Biology (Leiden, Netherlands) 62(3):
351–366. https://doi.org/10.1163/157075612X63121378 Gabriel Dixon et al. / Nature Conservation 43: 55–78 (2021) Touma C, Palme R (2005) Measuring fecal glucocorticoid metabolites in mammals and birds: the importance of validation. Annals of the New York Academy of Sciences 1046(1): 54– 74. https://doi.org/10.1196/annals.1343.006 Wu W, Li Y, Wu J (2016) Simulation of potential habitat overlap between red deer (Cervus elaphus) and roe deer (Capreolus capreolus) in northeastern China. PeerJ 4: e1756. https:// doi.org/10.7717/peerj.1756 Zbyryt A, Bubnicki JW, Kuijper DPJ, Dehnhard M, Churski M, Schmidt K (2018) Do wild ungulates experience higher stress with humans than with large carnivores? Behavioral Ecology 29(1): 19–30. https://doi.org/10.1093/beheco/arx142
You can also read