Density-dependent marine survival of hatchery-origin Chinook salmon may be associated with pink salmon
←
→
Page content transcription
If your browser does not render page correctly, please read the page content below
Density-dependent marine survival of hatchery-origin Chinook
              salmon may be associated with pink salmon
                       NEALA W. KENDALL,1,         BENJAMIN W. NELSON            ,2   AND JAMES   P. LOSEE1
               1
                 Washington Department of Fish and Wildlife, 1111 Washington St. SE, Olympia, Washington 98501 USA
 2
 Institute for the Oceans and Fisheries, University of British Columbia, 2202 Main Mall, Vancouver, British Columbia V6T 1Z4 Canada

     Citation: Kendall, N. W., B. W. Nelson, and J. P. Losee. 2020. Density-dependent marine survival of hatchery-origin
     Chinook salmon may be associated with pink salmon. Ecosphere 11(4):e03061. 10.1002/ecs2.3061

     Abstract. Understanding how protected species influence the population dynamics of each other is an
     essential part of ecosystem-based management. Chinook salmon (Oncorhynchus tshawytscha) are critical
     prey for endangered southern resident killer whales (SRKWs; Orcinus orca), and increasing releases of
     hatchery Chinook salmon has been proposed to aid SRKW recovery. We analyzed 30 yr of data and found
     that density-dependent survival of hatchery Chinook salmon released into the central and southern parts
     of the Salish Sea (Washington, USA; and British Columbia, Canada) may be associated with the presence
     of naturally produced pink salmon (O. gorbuscha), which are highly abundant as juveniles only in even-
     numbered years. We first modeled hatchery Chinook salmon marine survival as a function of the numbers
     of juvenile Chinook released and the presence of emigrating juvenile pink salmon between 1983 and 2012.
     Then, we related reconstructed numbers of hatchery Chinook salmon returning to Puget Sound to the
     abundance of juvenile Chinook released in even (pink emigration) and odd (non-pink emigration) years
     from 1980 to 2010. We found that in some regions of the Salish Sea, both hatchery Chinook salmon marine
     survival and adult Chinook returns varied depending on the number of hatchery Chinook released and
     the presence of juvenile pink salmon. Specifically, in some regions survival of hatchery Chinook salmon
     decreased when greater numbers of juveniles were released into the Salish Sea in even years, when large
     numbers of pink salmon were present, but increased or remained stable when pink salmon were not pre-
     sent in large numbers (in odd years). This suggests lower, density-dependent survival of juvenile Salish
     Sea Chinook salmon during even outmigration years. Our analyses suggest that scientists and managers
     should further investigate potential mechanisms for density-dependent survival of hatchery Chinook sal-
     mon from Salish Sea hatcheries when designing strategies to maximize adult returns.

     Key words: aquaculture; Chinook salmon; density dependence; hatcheries; marine survival; Oncorhynchus; pink
     salmon.

     Received 4 September 2019; revised 31 December 2019; accepted 7 January 2020. Corresponding Editor: Hunter S. Lenihan.
     Copyright: © 2020 The Authors. This is an open access article under the terms of the Creative Commons Attribution
     License, which permits use, distribution and reproduction in any medium, provided the original work is properly cited.
      E-mail: Neala.Kendall@dfw.wa.gov

INTRODUCTION                                                        actions related to multiple species can be difficult
                                                                    to implement when they affect individual species
   Ecosystem-based management has shown pro-                        in different ways, there are demands on
mise in improving the management of protected                       resources from multiple entities, and/or environ-
marine species affected by anthropogenic influ-                      mental conditions are compromised by decades
ences and natural factors (Levin et al. 2009, Tallis                of impacts (Leslie and McLoed 2007, Casazza
et al. 2010). At the same time, it is important to                  et al. 2016, Marshall et al. 2016, Samhouri et al.
understand the population dynamics of individ-                      2017, Springer et al. 2018). Species recovery can
ual components of an ecosystem. Management                          be informed by understanding the linkages

                   ❖ www.esajournals.org                        1                 April 2020   ❖ Volume 11(4) ❖ Article e03061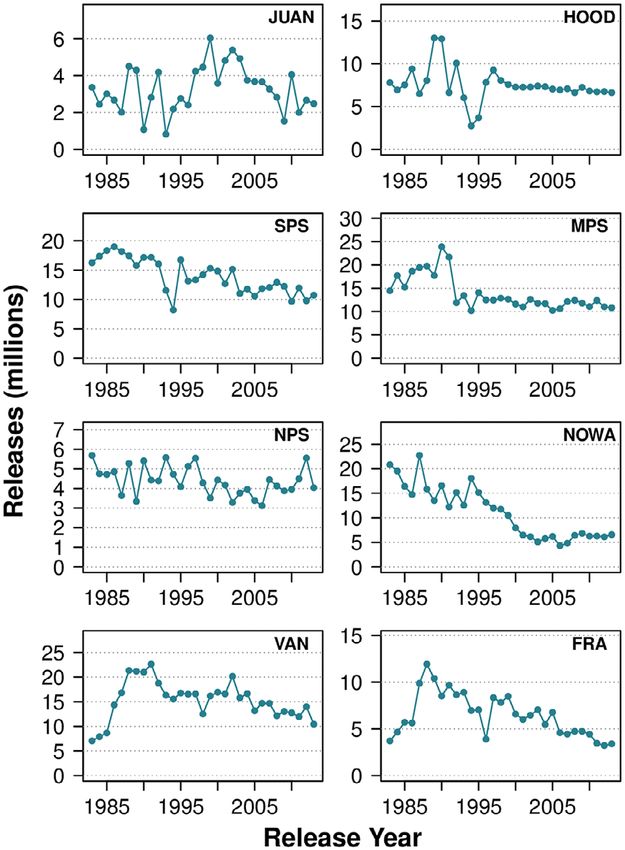
KENDALL ET AL.

between the components in an ecosystem (Sam-                  In the central and southern parts of the Salish
houri et al. 2017), such as density-dependent              Sea, almost all pink salmon (>99% of all recorded
interactions (Deriso et al. 2008), apparent compe-         abundance data; Washington Department of Fish
tition (Holt and Bonsall 2017), and evaluating the         and Wildlife’s [WDFW] Salmon Conservation
success of previously implemented restoration              Reporting Engine [SCoRE] database; https://f
and recovery actions (Jones et al. 2018).                  ortress.wa.gov/dfw/score/score/species/pink.jsp?
   Despite challenges, conservation and manage-            species=Pink) spawn in odd-numbered years and
ment of Pacific salmon (Oncorhynchus sp.) has               juveniles emigrate in even-numbered years. Juve-
increasingly sought to include ecosystem consid-           nile Chinook and pink salmon are both found
erations (Malick et al. 2017) given that salmon            there between April through July of even years
are influenced by climate change (Crozier et al.            (Duffy et al. 2005; B. Berejikian, NOAA Fisheries,
2008), the abundance of other (non-salmonid)               unpublished data). During this time, both species
species in the system (Wells et al. 2017), and the         are opportunistic and generalized consumers but
abundance of other salmonids (Ruggerone and                feed on different prey (Kaczynski et al. 1973, Bol-
Connors 2015). Of particular recent interest have          lens et al. 2010, Duffy et al. 2010, Osgood et al.
been pink salmon (O. gorbuscha), the dominant              2016). Because pink salmon arrive to marine
adult salmonid species in the North Pacific                 waters first, often in very large numbers in even-
Ocean (48% of total biomass since 1990; Rug-               numbered years, they may indirectly alter the
gerone and Irvine 2018).                                   prey composition that is later available to Chi-
   Density-dependent effects between pink sal-             nook salmon. A positive relationship between
mon and other species, including salmon, have              growth during the first summer at sea and subse-
been documented by a number of studies. Den-               quent adult survival has been observed for Puget
sity dependence can affect survival when                   Sound Chinook salmon (Duffy and Beauchamp
resources are limited or predators are responsive          2011), suggesting the importance of local, bot-
to increased prey (Wells et al. 2017), and it can          tom-up factors in the Sound (Claiborne et al., in
be associated with reduced growth and                      press). Additionally, predators of juvenile fishes
increased age at maturation (Ruggerone and                 in the Salish Sea, including other fishes, birds,
Nielsen 2004, Cline et al. 2019, Grossman and              and mammals, may cue more on Chinook sal-
Simon 2019). In the North Pacific Ocean, high               mon when greater numbers of pink salmon are
pink salmon abundance has been thought to                  in the system (sensu Wells et al. 2017), an exam-
decrease zooplankton biomass, inducing trophic             ple of an indirect interaction known as apparent
cascades down to the phytoplankton level (Shio-            competition (Holt and Bonsall 2017).
moto et al. 1997, Batten et al. 2018) that can                Chinook salmon are a vital part of the Salish
depress the availability of prey resources for             Sea ecosystem, of great cultural importance, and
numerous species including salmon (Ruggerone               an important component of fisheries (TCW
et al. 2003, Ruggerone and Nielsen 2004, Kaga              Economics 2008). At present, Salish Sea Chinook
et al. 2013) and seabirds (Toge et al. 2011,               salmon are at low abundance (WDFW’s SCoRE
Springer et al. 2018). High pink salmon abun-              database; https://fortress.wa.gov/dfw/score/score/),
dance can also depress Pacific herring (Clupea              return at smaller sizes, and exhibit reduced
pallasii) stocks through competition or predation          diversity in life history and return timing com-
(Deriso et al. 2008, Pearson et al. 2012), though          pared to historical levels (Ohlberger et al. 2018,
this is not always the case (Boldt et al. 2019).           Losee et al. 2019, Nelson et al. 2019). In Puget
Density-dependent interactions between pink                Sound (USA), Chinook salmon are listed under
and Chinook salmon (O. tshawytscha) have also              the U.S. Endangered Species Act and multiple
been previously hypothesized to occur during               stocks in the Strait of Georgia (Canada) receive
the first ocean year of the salmon in the Salish            protection under the Committee on the Status of
Sea (Ruggerone and Goetz 2004, Ruggerone                   Endangered Wildlife in Canada (COSEWIC).
et al. 2019; Claiborne et al., in press), a rich and       Additionally, previous work has identified Salish
diverse but highly impacted inland sea in Wash-            Sea Chinook salmon as the primary summer
ington State and British Columbia.                         prey of endangered southern resident killer

              ❖ www.esajournals.org                    2               April 2020   ❖ Volume 11(4) ❖ Article e03061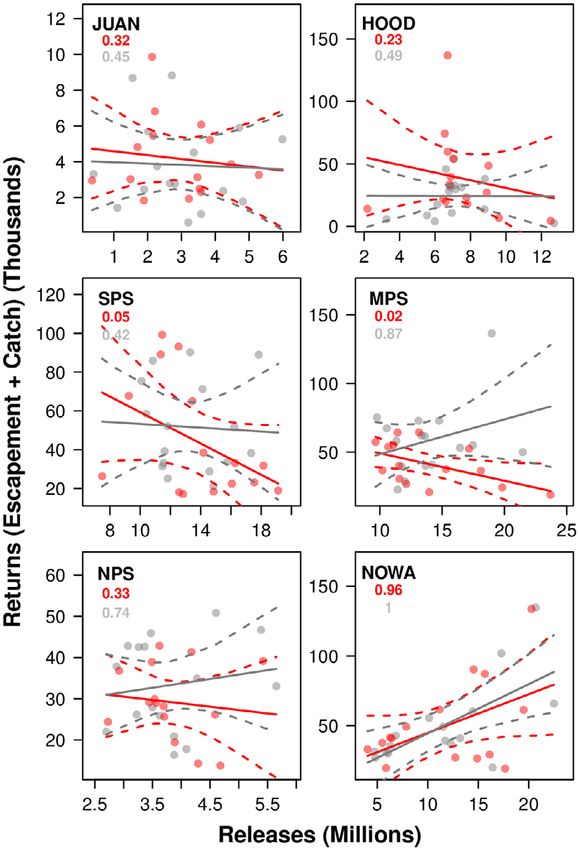
KENDALL ET AL.

whales (SRKWs; Orcinus orca; Hanson et al.              been released into the central and southern Sal-
2010, Ford et al. 2016).                                ish Sea in years when juvenile pink salmon are
   Increasing the abundance of adult Chinook            and are not also emigrating, has there been an
salmon in the Salish Sea is currently an ecosys-        associated increase in the number of hatchery
tem management priority, and hatchery supple-           Chinook salmon that have survived during
mentation is a predominant management                   their migration in the ocean and returned as
strategy (Riddell et al. 2013, Southern Resident        adults? We also identify the need for future
Orca Task Force 2018). Chinook salmon have              work examining the mechanisms behind our
been produced by hatcheries for over 100 yr             observations.
(Beamish et al. 1997), and increased production
has been proposed under the premise that this           METHODS
will result in more adult fish for SRKWs to con-
sume (Southern Resident Orca Task Force 2018,           Study species
WDFW 2019). While numerous studies have                    Sub-yearling hatchery Chinook salmon are
examined factors related to marine survival for         released into Salish Sea marine waters starting in
Salish Sea Chinook salmon (including Coronado           April and peaking in late May to early June at
and Hilborn 1998, Sharma et al. 2013), the rela-        lengths of ~80–100 mm (WDFW 2018a, b; B. Bere-
tionship between the number of hatchery Chi-            jikian, NOAA Fisheries, unpublished data). Year-
nook salmon released into the natural                   ling hatchery Chinook also enter marine waters
environment and their subsequent marine sur-            starting in April at larger sizes (~165–185 mm).
vival has not been quantitatively evaluated and         Chinook salmon that leave the Salish Sea for the
published in the peer-reviewed literature. Given        Pacific Ocean tend to do so the following spring
the potential for density-dependent interactions        (i.e., after approximately one year in the Salish
with conspecifics (Greene and Beechie 2004) and          Sea; Trudel et al. 2009).
pink salmon (Ruggerone and Goetz 2004) and a               Pink salmon, almost all of which are of wild
less-productive North Pacific Ocean marine envi-         origin, spawn in the central and southern Salish
ronment since the mid- to late 1980s (Wolter and        Sea in odd-numbered years; very few (
KENDALL ET AL.

Table 1. List of Salish Sea Chinook salmon coded-wire-tagged hatchery stocks included in this study and their
  associated region, their release strategy (sub-yearling, SY; yearling, Y), the range of juvenile release years, and
  the total number of years in which juveniles were released (n) during that time period.

           Region                            Stock                 Release strategy   Release year range   Release years (n)

Strait of Juan de Fuca (JUAN)          Dungeness (DUN)                   SY               1997–2003                7
                                           Elwha (ELW)                   SY               1986–1995                9
                                           Hoko (HOK)                    SY               1986–2012               26
Hood Canal (HOOD)                    George Adams (GAD)                  SY               1986–2012               27
Northern Washington (NOWA)               Nooksack (NSF)                  SY               1987–1997               10
                                    Nooksack Spring (NKS)                 Y               1990–2012               21
                                          Samish (SAM)                   SY               1986–2012               27
Northern Puget Sounds (NPS)             Skykomish (SKY)                  SY               2001–2012               12
                                       Stillaguamish (STL)               SY               1987–2012               23
                                   Snohomish Yearling (SNY)               Y               1989–2012               11
                                       Skagit Spring (SKS)                Y               1986–2012               23
                                         Skagit Fall (SKF)               SY               2000–2009               10
                                  Skagit Spring Fingerling (SSF)         SY               1986–2012               20
                                       Skagit Summ (SFF)                 SY               1995–2012               18
                                     Tulalip Summer (TUL)                SY               1986–2012               11
Middle Puget Sound (MPS)                   Green (GRN)                   SY               1986–2012               27
                                      Grovers Creek (GRO)                SY               1986–2012               27
                                      Issaquah Creek (ISS)               SY               1986–1988                3
                                         Puyallup (PUY)                  SY               1998–2012                9
                                   White River Yearling (WRY)             Y               2004–2012                9
South Puget Sound (SPS)                  Garrison (GAR)                  SY               1988–2012               13
                                         Nisqually (NIS)                 SY               1986–2012               27
                                    South Puget Sound (SPS)              SY               1986–2012               27
                                South Puget Sound Yearling (SPY)          Y               1988–2012               21
Fraser River (FRA)                       Harrison (HAR)                  SY               1983–2012               28
                                           Nicola (NIC)                   Y               1987–2012               26
                                         Shuswap (SHU)                   SY               1985–2012               28
                                        Chilliwack (CHI)                 SY               1983–2012               30
East Vancouver Island (VAN)              Quinsam (QUI)                   SY               1983–2012               30
                                         Puntledge (PPS)                 SY               1983–2012               29
                                      Big Qualicum (BQR)                 SY               1983–2012               30
                                        Cowichan (COW)                   SY               1986–2012               25
                                         Nanaimo (NAN)                   SY               1983–2005               17

3 months) or age 3 yr for those released as year-             in the ocean to at least age 2 or 3 to return as
lings (at 13–14 months). Much of the natural,                 adults.
density-dependent mortality of salmon in marine                 For the Ruff et al. (2017) analysis, stocks were
waters occurs early in their marine residence (be-            selected for inclusion based on the accuracy of
fore age 2 or 3; Parker 1962, 1968, Furnell and               their survival data (as noted by regional experts)
Brett 1986, Beamish and Mahnken 2001, Loren-                  and the length of their time series (minimum
zen and Camp 2019). Survival rates were esti-                 20 yr). In our analysis, we used only data from
mated using a backward cohort reconstruction                  fish released into Puget Sound, Strait of Georgia,
(Ruff et al. 2017; Eq. 1). Survival to (an immature           or Strait of Juan de Fuca. We included additional
state at) age 2 or 3 in the ocean does not include            stocks with shorter time series than were
fishing mortality, which makes it difficult to esti-            included in the Ruff et al. (2017) analysis due to
mate total mature adult return abundance to the               our use of a random-effects model. This resulted
Salish Sea with these data. However, we utilized              in a list of 33 stocks with release numbers and
these data because Chinook salmon must survive                marine survival rates to age 2 or 3 over ocean

                 ❖ www.esajournals.org                    4                April 2020   ❖ Volume 11(4) ❖ Article e03061
KENDALL ET AL.

  Fig. 1. Map of the eight central and southern Salish Sea regions from which hatchery Chinook salmon were
assessed. The red dashed line indicates the border between the United States and Canada.

entry years (OEY) 1983–2012 (Table 1, Fig. 1).            two juvenile life-history types observed in the
This starting point follows the large 1982–1983 El        Salish Sea. Sub-yearling release groups greatly
Ni~no event (Wolter and Timlin 1998), and Strait          outnumber yearling release groups; typically
of Georgia hatchery Chinook salmon marine sur-
KENDALL ET AL.

(Ebbesmeyer et al. 1988, Moore et al. 2008) and          expand those numbers to account for areas not
be consistent with other studies that used similar       surveyed.
groupings (Ruff et al. 2017). Regions included              Numbers of hatchery Chinook salmon har-
Hood Canal (HOOD), Strait of Juan de Fuca                vested by commercial, sport, ceremonial, and
(JUAN), northern Washington (NOWA), north-               subsistence fisheries in Puget Sound marine
ern Puget Sound (NPS; also known as Whidbey              and fresh waters have been estimated annually.
Basin), middle Puget Sound (MPS), southern               For commercial catch, Washington State and
Puget Sound (SPS), east Vancouver Island                 Treaty Indian Tribes use a system that reports
(VAN), and Fraser River (FRA; Fig. 1).                   catch on fish tickets. Information includes land-
   Hatchery Chinook salmon release numbers and           ing location, landing date, total landed weight,
run reconstruction of adults returning to Puget          and total number of fish landed. For sport
Sound.—The number and mark status of juvenile            catch, Washington State relies on a system of
hatchery salmonids released on the west coast of         self-reporting in the form of Catch Record
North America have been aggregated online by             Cards (CRCs; ttps://wdfw.wa.gov/licenses/fish
species and hatchery in the Regional Mark Infor-         ing/catch-record-card). CRC reports include the
mation System (RMIS) database (https://www.              date, total number of fish captured by species,
rmpc.org/). All sub-yearling Chinook salmon              mark status, and catch location of harvested
released into the central and southern parts of          fish. Reported catches of hatchery- and natural-
the Salish Sea between 1980 and 2010 were quer-          origin Chinook salmon were then expanded to
ied in the RMIS database. We organized them              account for unreported catch and other fishing-
into regions based on their release location             related mortality (E. Kraig, WDFW, unpublished
(Fig. 1). The resulting dataset included >1.5 bil-       data). WDFW allocates annual mixed-stock esti-
lion Chinook salmon released from >150 hatch-            mates of Chinook salmon caught by Washing-
eries at >1200 locations.                                ton fishers in Puget Sound to specific stocks
   We also used, as an index of abundance, esti-         using proportional escapement-based catch allo-
mates of the numbers of adult hatchery Chinook           cation. These estimates do not include sport
salmon returning to the entrance of the Strait of        catch in marine waters of Puget Sound. For
Juan de Fuca (i.e., total run size; before any fish       freshwater sport, commercial, and ceremonial/
were caught in the Salish Sea) that were com-            subsistence fisheries, catch is allocated to the
piled from WDFW Run Reconstruction Reports               river or hatchery where catch occurred unless
(J. Haymes, WDFW, unpublished data) and                  empirical data suggest a proportion of catch is
WDFW databases (SCoRE) from brood years                  comprised of stocks from other rivers.
1980 to 2010. These adult run reconstruction                Estimated total numbers of adult Chinook sal-
index estimates are comprised of two parts—              mon returning to Puget Sound were assigned to
escapement to Puget Sound hatcheries or spawn-           a year of ocean emigration based on age compo-
ing grounds (fish not harvested) and stock-speci-         sition estimates for marked and unmarked Chi-
fic estimates of harvest by commercial,                   nook sampled from commercial and sport
freshwater sport, and tribal ceremonial and sub-         fisheries in terminal areas of each of the six U.S.
sistence fisheries in American, but not Canadian,         regions (Fig. 1). These data are based on scales
waters of the Salish Sea.                                sampled from >2 million Chinook salmon
   Chinook salmon escapement numbers to                  between 1985 and 2014 (Appendix S1: Table S1).
hatcheries and spawning grounds in Puget                 For years 1980–1984, we applied the average age
Sound were calculated using a variety of meth-           composition from 1985 to 1989.
ods depending on the fishes’ river of origin. The            Pink salmon.—The inclusion of pink salmon in
numbers of hatchery-origin adults returning to           our analyses was based on previous findings that
hatcheries are available in post-season hatchery         the presence of emigrating pink salmon has been
escapement reports (https://wdfw.wa.gov/hatche           associated with hatchery Chinook salmon mar-
ries/escapement/) and WDFW’s SCoRE database.             ine survival in Puget Sound (Ruggerone and
River surveys, trap counts, and remote counting          Goetz 2004, Claiborne et al., in press). Ideally,
methods were assessed to estimate the numbers            annual estimates of emigrating fry from major
of hatchery fish on the spawning grounds and              pink-producing basins around the Salish Sea

              ❖ www.esajournals.org                  6              April 2020   ❖ Volume 11(4) ❖ Article e03061
KENDALL ET AL.
would be evaluated as a potential explanatory function of multiple covariates. We explored 18
variable in our study. However, such data were model formulations that included six possible
currently not available for many Puget Sound covariates: juvenile Chinook life history (sub-
basins, so we followed Ruggerone and Goetz yearling vs. yearling release), release region, the
(2004) and designated years as pink (even-num- number of hatchery releases per region, presence
bered) or non-pink (odd-numbered) emigration of pink salmon in the Salish Sea, and release year
years, depending on whether emigrating juvenile (Table 2).
pink salmon from the much more plentiful odd- Preliminary model selection was completed by
year spawners were present. comparing widely applicable information criteria
(WAIC; Gelman et al. 2013, Vehtari et al. 2017)
and Bayesian R2 values of the candidate models
Modeling CWT hatchery Chinook marine (Gelman et al. 2019; Table 2). The eight best-per-
recovery (survival) rates forming models were then compared using an
Model specifications and comparison and approximation of leave-one-out (LOO) cross-val-
parameter estimation.—To evaluate factors associ- idation from the loo package in R (Appendix S1:
ated with marine survival of hatchery Chinook Table S2; Vehtari et al. 2017). Here, the candidate
salmon, we fit multiple hierarchical regression model that maximizes the expected log of the
models to survival rates from CWT data. Specifi- predictive density (ELPD) over all observed data
cally, we modeled instantaneous mortality rate points is considered superior. Should the stan-
(log e(Survival)) from release to age 2 or 3 for dard error of the ELPD exceed the absolute value
each stock i in region r in year t (Mi,r,t) as a of the difference between ELPDs among
Table 2. Summary of model formulations, selection criteria (widely applicable information criteria [WAIC]), and
fit (Bayes R2) for all candidate models evaluated.
Model WAIC Bayes
number Formula (SE) R2
1 Null 2069 (46)KENDALL ET AL.
competing models, the model with the lowest these cohort-specific values for each of the six
number of effective parameters is favored (Veh- regions in Puget Sound (we did not include the
tari et al. 2017). two Canadian regions as WDFW does not per-
We estimated model parameters in a Bayesian form run reconstructions for them) and used sim-
framework using Markov chain Monte Carlo ple linear regression to estimate trends between
(MCMC) from Stan’s (Stan Development Team pink- and non-pink-year emigration cohorts for
2018a) rstanarm package (Stan Development each region. The regressions used here followed
Team 2018b) in R (R Development Core Team the same Bayesian approach described above.
2019). To estimate the posterior distributions for
each parameter, we generated eight separate RESULTS
MCMC chains of 1000 iterations and discarded
the first half of each chain. The remaining sam- CWT hatchery Chinook recovery (marine survival)
ples were used to calculate posterior means, rates
quantiles, and predictive distributions. We Sub-yearling Salish Sea Chinook salmon mar-
assessed model convergence of the MCMC ine instantaneous mortality rates to age 2 were
chains by visual inspection of trace plots and typically between 3 and 7 (90% of Chinook over the period of this study (Fig. 2).
Chinook hatchery releases in the central and Model comparison, MCMC model convergence,
southern parts of the Salish Sea have typically and posterior predictive checks.—Based on model
been released as this life-history type (Nelson selection criteria that considered model fit and
et al. 2019; RMIS database). complexity, the best-performing model was
(Model 11; Table 2):
Relationship between hatchery Chinook releases
and adult returns to Puget Sound for even- vs. Mi;j;r;t ¼ b0i þ b1 LifeHistj þ b2 Regionr þ b3 Hatchr;t
odd-year cohorts þ b4 Pinkt þ b5 ðPinkt Hatchr;t Þ þ i
We examined the relationship between the (1)
numbers of juvenile hatchery Chinook salmon
released in pink years (even-numbered, when where b0i is the stock-specific random effect that
many pink salmon also emigrate from the central is assumed to be exchangeable and drawn from a
and southern parts of the Salish Sea) vs. non- common global distribution; LifeHistj is a binary
pink years (odd) and the associated total run-re- factor coded 0 or 1 for sub-yearling and yearling
constructed index numbers of adult Chinook sal- releases, respectively; Hatchr,t is the total number
mon that returned to Puget Sound. We plotted of hatchery releases in region r in year t, which
❖ www.esajournals.org 8 April 2020 ❖ Volume 11(4) ❖ Article e03061KENDALL ET AL.
MCMC chains during the sampling process.
Visual inspection of the trace plots showed all
MCMC chains were sufficiently well mixed, sug-
gesting the chains had successfully converged.
Additionally, the Gelman-Rubin diagnostic
statistics for all estimated parameters did not
exceed 1.00, and all had effective sample sizes of
at least 1400. Posterior predictive checks compar-
ing the posterior predictive distributions to
observed data did not suggest any systematic
errors associated with the model predictions
(Appendix S1: Fig. S2). 95.3% of the observed
data points (653/685) fell within the 95% poste-
rior predictive intervals (Appendix S1: Fig. S3),
which suggests the model is capable of reproduc-
ing the observed data.
Factors associated with Chinook marine survival
rates.—Model coefficients were regarded as hav-
ing significant explanatory power, by conven-
tional (frequentist) interpretation, when the 95%
Bayesian credible intervals of their marginal pos-
terior distribution did not overlap with zero.
Accordingly, regional effects appeared to be
important in explaining marine survival to age 2
or 3 of hatchery Chinook salmon, specifically the
Fig. 2. Annual releases of hatchery yearling and Strait of Juan de Fuca (JUAN), middle and north-
sub-yearling Chinook salmon in the southern Salish ern Puget Sound (MPS and NPS), and Fraser
Sea, by region, from 1983 to 2012. River (FRA; Table 3). Only four of 33 stocks (ran-
dom effects) were different from the mean region
were standardized by subtracting the mean and effect (Appendix S1: Fig. S4): South Puget Sound
dividing by two standard deviations (Gelman Yearling (SPY) and Issaquah Creek (ISS) had sig-
and Hill 2007); and Pinkt is a binary factor for the nificantly lower mortality rates than other stocks
presence of juvenile pink salmon (0 or 1) in year within their region, while Nooksack Spring
t. The error terms, which were assumed to be (NKS) and Big Qualicum River (BQR) were sig-
normally distributed N ð0; ri Þ; accounted for nificantly higher.
all other factors and processes that influenced The interaction between the presence of juve-
survival during this time period. This model nile pink salmon in the Salish Sea and juvenile
explained 41% of the variation in the observed hatchery Chinook release numbers was also
survival rates from release to age 2 or 3 (Table 2). found to have significant explanatory power in
Of note, candidate models that included random the best-performing model (Fig. 3, Table 3). The
effects on independent variables other than the coefficient value suggested a significant negative
intercept (e.g., Hatch, Pink, Pink 9 Hatch) pro- interaction between juvenile pink salmon and
vided better fit to the data than Model 11, but the hatchery release number. Therefore, in even-
increase in predictive power was not meaningful numbered years, greater hatchery Chinook sal-
according to our cross-validation approach. This mon releases were associated with decreased
result could suggest that the effects of pink sal- marine survival. Predicted mean marine survival
mon presence and regional hatchery releases are rates in these pink years were lower than those
comparable (i.e., similar in magnitude) over the in non-pink years (Table 4).
entire ecosystem. The estimated hatchery release abundance
Diagnostic outputs did not indicate any issues model coefficient (0.12) suggested strong sup-
with convergence or autocorrelation in the port (though not statistically significant) for a
❖ www.esajournals.org 9 April 2020 ❖ Volume 11(4) ❖ Article e03061KENDALL ET AL.
Table 3. Summary of posterior distributions for regression coefficients in the best-performing model (Model 11;
see Table 2).
Parameter Mean SD 2.5% CI 97.5% CI
Intercept (Region 1 [JUAN]) 5.46 0.36 4.72 6.18
Region 2 (HOOD) 0.81 0.73 2.20 0.67
Region 3 (SPS) 0.81 0.49 1.76 0.17
Region 4 (MPS) 1.19 0.47 2.09 0.27
Region 5 (NPS) 1.07 0.43 1.91 0.22
Region 6 (NOWA) 0.80 0.53 1.87 0.25
Region 7 (VAN) 0.79 0.45 1.66 0.13
Region 8 (FRA) 1.99 0.49 2.95 0.99
Life history 0.07 0.31 0.68 0.56
Juvenile hatchery Chinook salmon abundance 0.12 0.10 0.31 0.07
Juvenile pink salmon presence 0.12 0.07 0.01 0.25
Juvenile pink salmon presence x juvenile hatchery Chinook salmon abundance 0.54 0.13 0.28 0.80
Notes: Included are the estimates for the posterior mean, standard deviation, and 95% credible intervals (CIs). Parameter
estimates and credible intervals shown in bold do not overlap with zero.
associated with increased marine survival
(Appendix S1: Fig. S5). Finally, the model did not
show a significant difference in survival between
sub-yearling and yearling Chinook salmon
(Table 3).
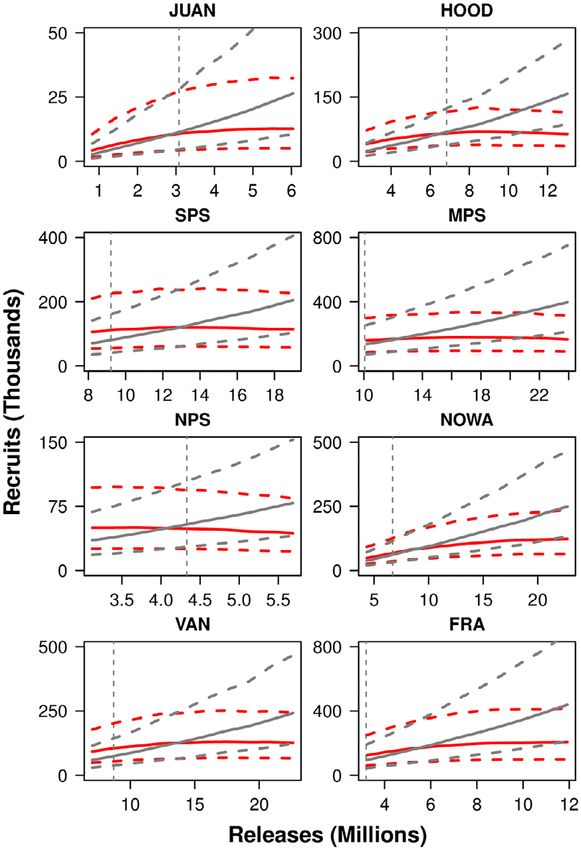
Predicted numbers of age-2 recruits in the North
Pacific Ocean.—The relationship between the
numbers of sub-yearling hatchery Chinook sal-
mon predicted to survive to age 2 in the North
Pacific Ocean (recruits) and the numbers of juve-
niles released was different for juveniles released
in pink and non-pink years. Across regions, in
non-pink (odd-numbered) emigration years,
increases in hatchery Chinook production were
associated with linear increases in age-2 recruits
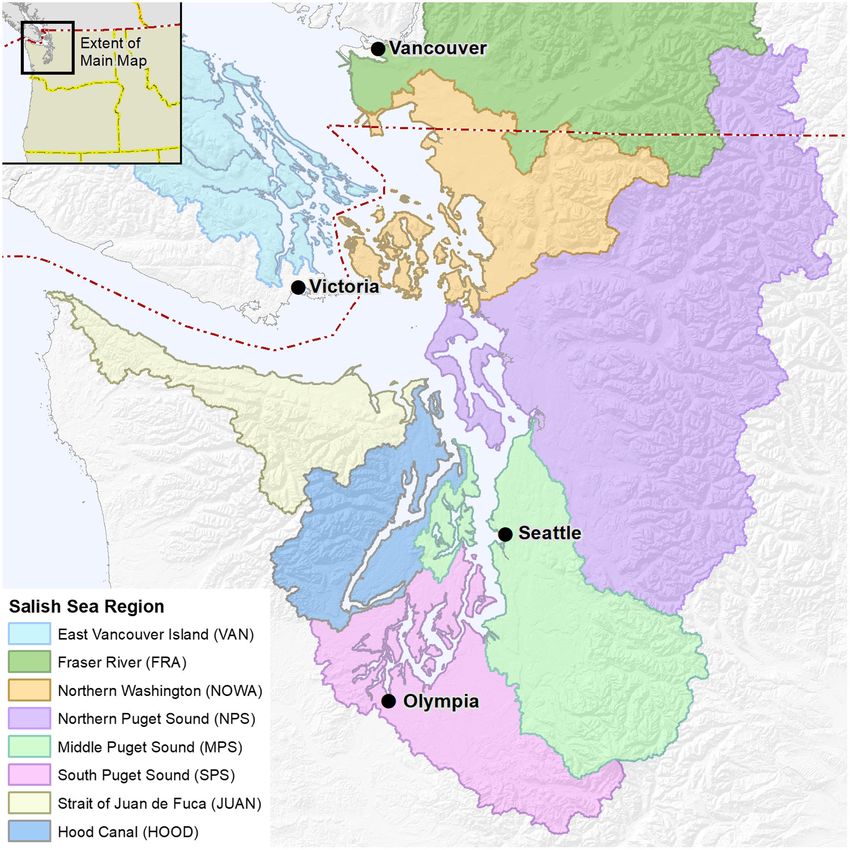
(Fig. 4). However, in pink years, increases in Chi-
nook hatchery production were associated with a
leveling off or a diminishing number of recruits,
which suggests the presence of density-depen-
dent survival. The uncertainty associated with
these estimates is considerable in both pink and
non-pink years, and the overlap of the predictive
Fig. 3. Marginal posterior distributions of regression intervals—a measure of uncertainty in the esti-
coefficients for hatchery releases, pink salmon, and the mated parameters and the observed data—sug-
interaction between pink salmon and hatchery gests observable differences between pink and
releases. Posterior distributions are based on 4000 Mar- non-pink years only when moderate-to-high
kov chain Monte Carlo samples. The proportion of numbers of hatchery Chinook salmon were
draws from the posterior distribution that are >0 is released (Fig. 4).
shown in the upper-left corner of each histogram.
Relationship between hatchery Chinook releases
positive relationship between survival and hatch- and adult returns to Puget Sound for even- vs.
ery releases in non-pink years (Table 3). There- odd-year cohorts
fore, in these odd emigration years, greater The relationship between hatchery Chinook
releases of hatchery Chinook salmon were salmon releases in pink (even-numbered) years
❖ www.esajournals.org 10 April 2020 ❖ Volume 11(4) ❖ Article e03061KENDALL ET AL.
Table 4. Best-performing model (Model 11; see
Table 2) posterior mean percent survival rates and
95% credible intervals (CI) for Salish Sea hatchery
Chinook salmon by region and stock in pink and
non-pink salmon years.
% Survival (95% CI)
Non-pink year (odd- Pink year (even-
Region Stock numbered) numbered)
JUAN DUN 0.12 (0.07–0.22) 0.11 (0.06–0.20)
ELW 0.38 (0.24–0.60) 0.34 (0.21–0.54)
HOK 1.15 (0.83–1.60) 1.02 (0.74–1.42)
HOOD GAD 1.00 (0.72–1.41) 0.89 (0.64–1.25)
NOWA NSF 1.00 (0.51–1.99) 0.89 (0.46–1.78)
NKS 0.65 (0.41–1.04) 0.58 (0.37–0.94)
SAM 1.37 (0.99–1.90) 1.22 (0.89–1.68)
NPS SKY 0.87 (0.55–1.35) 0.77 (0.49–1.21)
STL 1.51 (1.07–2.10) 1.35 (0.95–1.84)
SNY 2.39 (1.14–4.99) 2.13 (1.03–4.48)
SKS 2.07 (1.06–4.08) 1.84 (0.94–3.63)
SKF 1.44 (0.99–2.06) 1.28 (0.90–1.84)
SSF 1.05 (0.71–1.54) 0.94 (0.64–1.37)
SFF 0.63 (0.38–1.03) 0.56 (0.34–0.92)
TUL 0.97 (0.60–1.56) 0.86 (0.53–1.39)
MPS GRN 1.22 (0.88–1.70) 1.09 (0.79–1.53)
GRO 2.17 (1.60–2.93) 1.93 (1.41–2.63)
ISS 1.33 (0.60–2.85) 1.18 (0.53–2.55)
PUY 1.53 (0.92–2.58) 1.37 (0.82–2.28)
WRY 1.03 (0.49–2.16) 0.91 (0.44–1.90)
SPS GAR 0.68 (0.43–1.05) 0.60 (0.38–0.93)
NIS 1.34 (0.97–1.83) 1.19 (0.87–1.63) Fig. 4. Projected sub-yearling Chinook salmon
SPS 1.79 (1.31–2.45) 1.59 (1.18–2.19) recruits (age 2) in the ocean (y-axis) vs. the total num-
SPY 0.54 (0.27–1.04) 0.48 (0.25–0.91) ber of juveniles released in each region (x-axis). Release
FRA HAR 2.07 (1.51–2.80) 1.85 (1.34–2.51) number minimums and maximums on the x-axes
NIC 2.13 (1.07–4.07) 1.89 (0.96–3.63) reflect the observed range of total hatchery Chinook
SHU 2.70 (1.97–3.65) 2.40 (1.77–3.26) released in each region (Appendix S1: Fig. S5). Gray
CHI 8.62 (6.30–11.78) 7.67 (5.59–10.47)
lines show projected values in non-pink (odd-num-
VAN QUI 0.95 (0.71–1.31) 0.85 (0.63–1.16)
PPS 0.54 (0.40–0.72) 0.48 (0.35–0.64) bered) years, while red lines show values in pink
BQR 0.63 (0.46–0.87) 0.56 (0.41–0.77) years. Dashed lines for each depict 95% posterior pre-
COW 1.40 (1.00–1.96) 1.24 (0.89–1.74) dictive intervals. The vertical dashed lines show the
NAN 1.68 (1.13–2.48) 1.50 (1.01–2.22) average annual number of releases for the most recent
Notes: DUN, Dungeness; ELW, Elwha; HOK, Hoko; GAD, five years in each region.
George Adams; NSF, Nooksack; NKS, Nooksack Spring;
SAM, Samish; SKY, Skykomish; STL, Stillaguamish; SKF, Ska-
git Fall; SNY, Snohomish Yearling; SKS, Skagit Spring; SKF, the 0.05 level for two regions (SPS and MPS). On
Skagit Fall; SSF, Skagit Spring Fingerling; SFF, Skagit Sum- the other hand, this relationship was significantly
mer; TUL, Tulalip Summer; GRN, Green; GRO, Grovers
Creek; ISS, Issaquah Creek; PUY, Puyallup; WRY, White River positive for NOWA. For non-pink-year (odd-
Yearling; GAR, Garrison; NIS, Nisqually; SPS, South Puget numbered) emigrants, the slope of the regression
Sound; SPY, South Puget Sound Yearling; HAR, Harrison;
NIC, Nicola; SHU, Shuswap; CHI, Chilliwack; QUI, Quinsam; line was positive for three regions (MPS, NPS,
PPS, Puntledge; BQR, Big Qualicum; COW, Cowichan; NAN, and NOWA [significantly so for this region]) and
Nanaimo. negative for the three others. In five regions, the
linear trend in pink years was more negative
vs. the number of adult Chinook returns was than it was in non-pink years, though not statisti-
negative in five of the six regions in Puget Sound cally significantly so at the 95% level. Notably,
(Fig. 5). The trend was statistically significant at there was only one region (NOWA) where the
❖ www.esajournals.org 11 April 2020 ❖ Volume 11(4) ❖ Article e03061KENDALL ET AL.
most regions. Our findings suggest that the pres-
ence of emigrating juvenile pink salmon may
somehow alter the relationship between the
abundance of juvenile Chinook hatchery released
and their marine survival. Therefore, hatchery
Chinook salmon may have experienced density-
dependent survival in years when there were
higher total numbers of Chinook and pink sal-
mon in the Salish Sea. Opposite patterns were
found in odd-numbered years (when few pink
salmon juveniles were present in the central and
southern parts of the Salish Sea): A positive rela-
tionship was found between the numbers of
hatchery Chinook released and the numbers of
these fish that survived in the ocean.
It is important to note that there was consider-
able uncertainty in the estimates of age-2 hatch-
ery Chinook salmon recruits in the ocean in pink
vs. non-pink years at lower and moderate levels
of hatchery releases. It was only at the higher
release numbers in the various regions that
strong differences in the numbers of recruits are
apparent. In the most recent five years, Chinook
hatchery release numbers have been in the low-
to-moderate ranges relative to historical releases.
Proposed increases in hatchery releases associ-
ated with SRKW recovery (WDFW 2019) could
Fig. 5. Run reconstruction of the total numbers of achieve hatchery Chinook salmon abundance
adult hatchery Chinook salmon from each region values that have not been seen since the late
returning to Puget Sound (y-axis) vs. the number of 1980s and early 1990s in some regions. It is not
juveniles released that produced those adults (x-axis). reasonable to directly extrapolate future hatchery
The gray line is the regression trend line of data from Chinook salmon release numbers onto our his-
non-pink years (odd emigration years), while the red torical results. However, our work does highlight
line is the best-performing regression line of pink-year the importance of further evaluations and studies
data (even years). Dashed lines depict 95% credible to implement hatchery release strategies that
intervals for each series. The red and gray numbers are maximize adult returns.
the probability of each slope being > zero. Despite considerable inter-annual variability in
the hatchery Chinook marine survival rates, the
relationship between hatchery releases and addition of a year effect or the interaction
returns was significantly positive (≥95% proba- between release year and release region did not
bility of slope parameter being >zero) in either meaningfully improve model performance (rela-
pink or non-pink years (Fig. 5). tive to the increase in model complexity). While
these spatiotemporal effects were not included in
DISCUSSION our best-performing model, they likely do
explain much of the variation in the year-to-year
Our results show that since the early 1980s, in Chinook salmon early marine survival (Satterth-
even-numbered years when pink salmon juve- waite et al. 2014). Future work could evaluate
niles emigrated into marine waters, higher levels the association between the abundance of hatch-
of hatchery supplementation of Chinook salmon ery Chinook salmon juveniles released, pink sal-
in the Salish Sea have been associated with stable mon presence, and hatchery Chinook marine
or decreased marine survival to age 2 or 3 in survival rates during different time periods in
❖ www.esajournals.org 12 April 2020 ❖ Volume 11(4) ❖ Article e03061KENDALL ET AL.
the past. Additionally, the effects of certain dependent interactions occurring beyond their
covariates like pink salmon presence and hatch- first year of ocean residence is lacking for Chi-
ery release abundance values on individual nook salmon compared to other species such as
stocks may differ from the global or mean effect sockeye salmon (Ruggerone and Nielsen 2004,
inferred from the best-performing model. Ruggerone et al. 2005). Additionally, Salish Sea
When we compared the abundance of hatch- hatchery Chinook salmon marine survival trends
ery Chinook salmon juveniles released into Puget were found to be significantly different than
Sound in pink (even-numbered) years to the those for northern and southern coastal hatchery
reconstructed adult run size of each emigration Chinook salmon (Ruff et al. 2017), emphasizing
cohort, five of the six regions showed moderate- the need to examine factors influencing survival
to-strong support for a negative relationship. within the Salish Sea (Andersen et al. 2017). All
This result also supports the potential for den- told, greater understanding of potential density-
sity-dependent survival of hatchery Chinook sal- dependent interactions focused within in the Sal-
mon in the Salish Sea in some years; on average, ish Sea in the past may help inform Chinook sal-
when higher numbers of hatchery Chinook juve- mon hatchery production and encourage future
niles emigrate with juvenile pink salmon, fewer work evaluating potential mechanisms behind
of them survive their ocean migration and return the findings.
as adults to Puget Sound. In contrast, this pattern Several potential mechanisms could explain
was not consistently observed for non-pink-year the decreased Chinook salmon survival observed
juvenile Chinook salmon emigrants. in years when juvenile pink salmon emigrate.
It is noteworthy that we have typically not Evaluation of these mechanisms may shed light
observed a strong positive relationship between on the spatial and temporal scales of the interac-
the numbers of juvenile Chinook released from tions between Chinook and pink salmon in the
hatcheries and the number of adults that Salish Sea.
returned over the time period assessed—only the First, juvenile Chinook salmon in the Salish
northern Washington region (NOWA) had a Sea may experience indirect competition from
strong positive relationship between hatchery juvenile pink salmon in even-numbered years,
Chinook releases and returns. This was similar to when large numbers of pink salmon enter the
what Beamish et al. (1992) showed for coho and Salish Sea earlier than Chinook salmon and alter
Chinook salmon released from Strait of Georgia the preyscape within shared habitats. Pink sal-
hatcheries between the early 1970s and mid- mon are known to feed more heavily on zoo-
1980s. Fishing in the North Pacific Ocean and plankton (especially epibenthic harpacticoid
other sources of marine mortality are likely vari- copepods and calanoid copepods) than Chinook
able over the study period and likely affect the salmon, who consume mostly insects and gam-
adult returns to Puget Sound, influencing the marid amphipods in the nearshore environ-
observed patterns. However, it is unlikely that ments, then focus initially on decapods (crab
there would consistently have been more fishing larvae in particular) as they move offshore, and
or greater natural mortality on even-emigration- then become progressively more piscivorous by
year cohorts, especially given the overlapping late summer or early fall (Kaczynski et al. 1973,
age cohorts of Chinook salmon when they were Duffy et al. 2010, Osgood et al. 2016). A trophic
subjected to fishing mortality in the ocean. cascade may occur between the copepods preyed
Previous work has suggested that Puget upon in some years by pink salmon that would
Sound Chinook salmon growth and survival otherwise be consumed by young-of-year (age-0)
during their first year in the ocean (i.e., when Pacific herring, insects, amphipods, and deca-
they are within the Salish Sea) have been pods, which support Chinook salmon (Boldt
impacted by the presence of high pink salmon et al. 2019). Chinook salmon marine survival is
abundance (Ruggerone and Goetz 2004, Clai- especially related to their feeding in offshore
borne et al., in press). While studies have also habitats of the Salish Sea in June–July (Duffy and
documented density-dependent interactions Beauchamp 2011), and changes in the prey base
between Pacific salmon and pink salmon in the at lower trophic levels have been directly linked
North Pacific Ocean, evidence for density- to Chinook salmon survival in the coastal ocean
❖ www.esajournals.org 13 April 2020 ❖ Volume 11(4) ❖ Article e03061KENDALL ET AL.
(Losee et al. 2014). Further studies on zooplank- research on Chinook salmon predators is needed
ton abundance and predation in the Salish Sea to shed light on this mechanism.
throughout the spring and summer months An additional possible mechanism behind Chi-
would be needed to better evaluate this hypothe- nook salmon density-dependent survival is
sized mechanism. related to higher total densities of salmon in the
Pink salmon diets are similar to those of for- Salish Sea. Rhodes et al. (2011) studied bacterial
age fishes like young-of-year Pacific herring kidney disease (BKD) in recently emigrated juve-
(Osgood et al. 2016, Boldt et al. 2019), which nile Chinook salmon in Puget Sound during one
are very abundant in the offshore environment outmigration year and found that increased juve-
of the Salish Sea (Therriault et al. 2009, Siple nile Chinook salmon density was an important
and Francis 2016). Young-of-year herring are factor associated with higher BKD infection
key prey for juvenile Chinook salmon in the prevalence and intensity across the Sound. The
Salish Sea in the summer and fall (Duffy et al. authors did not examine how the abundance of
2010). A recent study showed that young-of- pink salmon was related to hatchery Chinook
year herring abundance was positively associ- salmon BKD infection, which is an area of further
ated with juvenile pink (competitors of herring) study that would support an ecosystem-based
and Chinook (predators of herring) salmon strategy to understanding Chinook salmon mar-
abundance between 1992 and 2016 (Boldt et al. ine survival.
2019), indicating that environmental conditions Regional differences were seen in the relation-
favorable for young-of-year herring (and poten- ships between the numbers of hatchery Chinook
tially numerous other fish species) also bene- salmon released into the Salish Sea, their marine
fited their competitors and predators. Thus, survival, and the presence of emigrating juvenile
competition and predation should be consid- pink salmon. This may be due to hatchery Chi-
ered across the entire Salish Sea epipelagic nook salmon from different regions using coastal
community. areas for different periods of time and varying
This competition-related mechanism is also per- environmental and habitat conditions within the
tinent to a recent study by Claiborne et al. (in Salish Sea, including differences in prey compo-
press). They examined the relationship between sition, predator abundance, and other factors
Puget Sound Chinook salmon first-year marine (Jeffries et al. 2003, Rice et al. 2011, Khangaonkar
growth and survival between 1976 and 2008 and et al. 2012).
found that when juvenile Chinook salmon emi- Our work builds upon a study by Ruggerone
gration cohorts experienced above-average and Goetz (2004) that examined marine growth
growth, lower numbers of juvenile pink salmon and survival of hatchery juvenile Chinook sal-
were documented emigrating through the Salish mon emigrating with and without pink salmon
Sea. in even- vs. odd-numbered years, respectively,
Second, apparent competition (Holt and Bon- from Salish Sea rivers between 1972 and 1997.
sall 2017) may be occurring wherein predation Our study differs from that of Ruggerone and
on juvenile Chinook may be increased when Goetz (2004) as we modeled marine survival/
higher numbers of pink salmon were present. mortality rates specifically considering the abun-
Predator responses from marine mammal (e.g., dance of hatchery Chinook salmon juveniles
harbor seals; Thomas et al. 2016), avian (e.g., released; our goal was not to replicate Ruggerone
Caspian terns [Sterna caspia], double-crested cor- and Goetz’s analysis with an additional 15 yr of
morants [Phalacrocorax auritus], and glaucous- data—though that is a study worthy of future
winged and western gulls [Larus glaucescens and analysis. Together, these studies and ours sug-
L. occidentalis]) (Collis et al. 2002), and fish (e.g., gest the need for hatchery practices to consider
spiny dogfish [Squalus acanthias]) (Beamish 1992) ecosystem-based interactions to benefit Chinook
species may be possible. Cannibalism by age 1–3 salmon abundance and species recovery in the
resident Puget Sound Chinook salmon on juve- Salish Sea (Pikitch et al. 2004, Marshall et al.
nile Chinook salmon has also been documented 2016, Samhouri et al. 2017, Levin et al. 2018).
as a potentially significant source of mortality on The Salish Sea ecosystem has changed over the
these fish (Beauchamp and Duffy 2011). Further last half-century (Preikshot et al. 2013), and
❖ www.esajournals.org 14 April 2020 ❖ Volume 11(4) ❖ Article e03061KENDALL ET AL. exploring how the various changes have been (resulting in many hungry mouths in the same associated with Chinook marine survival is an time and place), hatchery-origin juvenile Chi- important undertaking. Such exploration is cur- nook salmon might be expected to experience rently being facilitated by the Salish Sea Marine higher feeding competition with pink salmon Survival Project (https://marinesurvivalproject.c already resident in the Salish Sea. In fact, while om/) and so is not a part of our current analyses. this and other studies (Ruggerone and Goetz With regard to changing hatchery practices over 2004, Claiborne et al., in press) documented odd time, records show that large numbers (~10–30% vs. even year differences in hatchery Chinook of total releases) of hatchery Chinook fry releases salmon marine survival, Greene et al. (2005) (
KENDALL ET AL.

salmon in the past years will not be the same as                     relation to large-scale, natural shifts in the produc-
those faced in the future. However, by consider-                     tivity of the marine environment. ICES Journal of
ing potential density-dependent interactions of                      Marine Science 54:1200–1215.
hatchery Chinook salmon with pink salmon in                      Beamish, R. J., B. L. Thomson, and G. A. McFarlane.
                                                                     1992. Spiny dogfish predation on chinook and coho
the Salish Sea and exploring the ecosystem pat-
                                                                     salmon and the potential effects on hatchery-pro-
terns and mechanisms behind these findings,
                                                                     duced salmon. Transactions of the American Fish-
hatchery management practices and research can                       eries Society 121:444–455.
be further informed to benefit Chinook salmon                     Beauchamp, D. A., and E. J. Duffy. 2011. Stage-specific
and SRKW conservation.                                               growth and survival during early marine life of
                                                                     Puget Sound Chinook salmon in the context of
ACKNOWLEDGMENTS                                                      temporal-spatial environmental conditions and
                                                                     trophic interactions. Final report to the Pacific Sal-
   This is Publication Number 40 from the Salish Sea                 mon Commission. Washington Cooperative Fish
Marine Survival Project: an international, collaborative             and Wildlife Research Unit, Seattle, Washington,
research effort designed to determine the primary fac-               USA.
tors affecting the survival of juvenile Chinook, coho,           Boldt, J. L., M. Thompson, C. N. Rooper, D. E. Hay, J.
and steelhead survival in the combined marine waters                 F. Schweigert, T. J. Quinn II, J. S. Cleary, and C. M.
of Puget Sound and Strait of Georgia (www.marinesur                  Neville. 2019. Bottom-up and top-down control of
vivalproject.com). Funding for this project was received             small pelagic forage fish: factors affecting age-0
from the Pacific Salmon Commission Southern Fund.                     herring in the Strait of Georgia, British Columbia.
Thank you to Dale Gombert of WDFW for creating the                   Marine Ecology Progress Series 617–618:53–66.
map in Fig. 1. We received helpful data, insights,               Bollens, S. M., R. vanden Hooff, M. Butler, J. R. Cor-
reviews, and comments from Jameal Samhouri, Barry                    dell, and B. W. Frost. 2010. Feeding ecology of juve-
Berejikian, Kathryn Sobocinski, Correigh Greene, Eric                nile Pacific salmon (Oncorhynchus spp.) in a
Ward, and Kristin Marshall of NOAA-NWFSC; Mike                       northeast Pacific fjord: diet, availability of zoo-
Haggarty and Morgan Robinson of NOAA NMFS; Joe                       plankton, selectivity for prey, and potential compe-
Anderson, Todd Sandell, Marisa Litz, Jeff Haymes, and                tition for prey resources. Fisheries Bulletin
Jon Carey of WDFW; Mike Hawkshaw of DFO-Pacific;                      108:393–407.
Dave Beauchamp of USGS; Galen Johnson and Chris                  Casazza, M., et al. 2016. Endangered species manage-
James of NWIFC; and Tom Chance of Lummi Nation.                      ment and ecosystem restoration: finding the com-
                                                                     mon ground. Ecology and Society 21:19.
LITERATURE CITED                                                 Cederholm, C. J., M. D. Kunze, T. Murota, and A. Siba-
                                                                     tani. 1999. Pacific salmon carcasses: essential con-
Andersen, K. H., N. S. Jacobsen, T. Jansen, and J. E.                tributions on nutrients and energy for aquatic and
    Beyer. 2017. When in life does density dependence                terrestrial ecosystems. Fisheries 24:6–15.
    occur in fish populations? Fish and Fisheries                 Claiborne, A. M., L. Campbell, B. Stevick, T. Sandell, J.
    18:656–667.                                                      P. Losee, M. Litz, and J. Anderson. In press. Corre-
Bailey, C. J., D. C. Braun, D. McCubbing, J. D. Rey-                 spondence between scale growth, feeding condi-
    nolds, B. Ward, T. D. Davies, and J. W. Moore.                   tions, and survival of adult Chinook salmon
    2018. The roles of extrinsic and intrinsic factors in            returning to the southern Salish Sea: implications
    the freshwater life-history dynamics of a migratory              for forecasting. Progress in Oceanography.
    salmonid. Ecosphere 9:e02397.                                Cline, T. J., J. Ohlberger, and D. E. Schindler. 2019.
Batten, S. D., G. T. Ruggerone, and I. Ortiz. 2018. Pink             Effects of warming climate and competition in the
    Salmon induce a trophic cascade in plankton popu-                ocean for life-histories of Pacific salmon. Nature
    lations in the southern Bering Sea and around the                Ecology & Evolution 3:935–942.
    Aleutian Islands. Fisheries Oceanography 27:548–             Collis, K., D. D. Roby, D. P. Craig, S. Adamany, J. Y.
    559.                                                             Adkins, and D. E. Lyons. 2002. Colony size and
Beamish, R. J., and C. Mahnken. 2001. A critical size                diet composition of piscivorous waterbirds on the
    and period hypothesis to explain natural regula-                 lower Columbia River: implications for losses of
    tion of salmon abundance and the linkage to cli-                 juvenile salmonids to avian predation. Transac-
    mate and climate change. Progress in                             tions of the American Fisheries Society 131:537–
    Oceanography 49:423–437.                                         550.
Beamish, R. J., C. Mahnken, and C. M. Neville. 1997.             Coronado, C., and R. Hilborn. 1998. Spatial and tem-
    Hatchery and wild production of Pacific salmon in                 poral factors affecting survival in coho and fall

                ❖ www.esajournals.org                       16                April 2020   ❖ Volume 11(4) ❖ Article e03061
KENDALL ET AL.
Chinook salmon in the Pacific Northwest. Bulletin recovery of ocean-type chinook salmon (Oncor-
of Marine Science 62:409–425. hynchus tshawytscha). Canadian Journal of Fisheries
Crozier, L. G., A. P. Hendry, P. W. Lawson, T. P. Quinn, and Aquatic Science 61:590–602.
N. J. Mantua, J. Battin, R. G. Shaw, and R. B. Huey. Greene, C. M., D. W. Jensen, G. R. Pess, E. A. Steel, and
2008. Potential responses to climate change in E. M. Beamer. 2005. Effects of environmental condi-
organisms with complex life histories: evolution tions during stream, estuary, and ocean residency
and plasticity in Pacific salmon. Evolutionary on Chinook salmon return rates in the Skagit River,
Applications 1:252–270. Washington. Transactions of the American Fish-
Deriso, R. B., M. N. Maunder, and W. H. Pearson. eries Society 134:1562–1581.
2008. Incorporating covariates into fisheries stock Grossman, G. D., and T. N. Simon. 2019. Density-
assessment models with application to Pacific her- dependent effects on salmonid populations: a
ring. Ecological Applications 18:1270–1286. review. Ecology of Freshwater Fish. https://doi.org/
Duffy, E. J., and D. A. Beauchamp. 2011. Rapid growth 10.1111/eff.12523
in the early marine period improves the marine Hanson, M. B., et al. 2010. Species and stock identifica-
survival of Chinook salmon (Oncorhynchus tsha- tion of prey consumed by endangered southern
wytscha) in Puget Sound, Washington. Canadian resident killer whales in their summer range.
Journal of Fisheries and Aquatic Sciences 68:232– Endangered Species Research 11:69–82.
240. Healey, M. C. 1980. The ecology of juvenile chinook
Duffy, E. J., D. A. Beauchamp, and R. M. Buckley. salmon in Georgia Strait, British Columbia. Pages
2005. Early marine life history of juvenile Pacific 203–229 in W. J. McNeil and D. C. Himsworth, edi-
salmon in two regions of Puget Sound. Estuarine, tors. Salmonid ecosystems of the North Pacific.
Coastal and Shelf Science 64:94–107. Oregon State University Press, Corvallis, Oregon,
Duffy, E. J., D. A. Beauchamp, R. M. Sweeting, R. J. USA.
Beamish, and J. S. Brennan. 2010. Ontogenetic diet Healey, M. C. 1991. Life history of Chinook salmon
shifts of juvenile Chinook salmon in nearshore and (Oncorhynchus tshawytscha). Pages 313–394 in C.
offshore habitats of Puget Sound. Transactions of Groot and L. Margolis, editors. Pacific salmon life
the American Fisheries Society 139:803–823. histories. University of British Columbia Press,
Ebbesmeyer, C. C., J. Q. Word, and C. A. Barnes. 1988. Vancouver, B.C., Canada.
Puget Sound: a fjord system homogenized with Heard, W. R. 1991. Life history of pink salmon (Oncor-
water recycled over sills by tidal mixing. In B. hynchus gorbuscha). Pages 119–230 in C. Groot and
Kjerfbe, editor. Hydrodynamics of estuaries: estu- L. Margolis, editors. Pacific salmon life histories.
arine case studies. CRC Press, Boca Raton, Florida, University of British Columbia Press, Vancouver,
USA. B.C., Canada.
Ford, M. J., J. A. Hempelmann, M. B. Hanson, K. L. Holt, R. D., and M. B. Bonsall. 2017. Apparent compe-
Ayres, R. W. Baird, C. K. Emmons, J. I. Lundin, G. tition. Annual Review of Ecology, Evolution, and
S. Schorr, S. K. Wasser, and L. K. Park. 2016. Esti- Systematics 48:447–471.
mation of a killer whale (Orcinus orca) population's Jeffries, S., H. Huber, J. Calambokidis, and J. Laake.
diet using sequencing analysis of DNA from feces. 2003. Trends and status of harbor seals in Washing-
PLOS ONE 11:e0144956. ton State: 1978–1999. Journal of Wildlife Manage-
Furnell, D. J., and J. R. Brett. 1986. Model of monthly ment 67:208–219.
marine growth and natural mortality for Babine Jones, H. P., P. C. Jones, E. B. Barbier, R. C. Blackburn,
Lake sockeye salmon (Oncorhynchus nerka). Cana- J. M. R. Benayas, K. D. Holl, M. McCrackin, P. Meli,
dian Journal of Fisheries and Aquatic Sciences D. Montoya, and D. M. Mateos. 2018. Restoration
43:999–1004. and repair of Earth's damaged ecosystems. Pro-
Gelman, A., J. B. Carlin, H. S. Sterm, D. B. Dunson, A. ceedings of the Royal Society of London B
Vehtari, and D. B. Rubin. 2013. Bayesian data anal- 285:20172577.
ysis. CRC Press, Boca Raton, Florida, USA. Kaczynski, V. W., R. J. Feller, J. Clayton, and R. J.
Gelman, A., B. Goodrich, J. Gabry, and A. Vehtari Gerke. 1973. Trophic analysis of juvenile pink and
2019. R-squared for Bayesian regression models. chum salmon (Oncorhynchus gorbuscha and O. keta)
The American Statistician 73:307–309. in Puget Sound. Journal of the Fisheries Research
Gelman, A., and J. Hill. 2007. Data analysis using Board of Canada 30:1003–1008.
regression and multilevel/hierarchical models. Kaeriyama, M., H. Seo, and H. Kudo. 2009. Trends in
Cambridge University Press, Cambridge, UK. run size and carrying capacity of Pacific salmon in
Greene, C. M., and T. J. Beechie. 2004. Consequences of the North Pacific Ocean. North Pacific Anadro-
potential density-dependent mechanisms on mous Fish Commission Bulletin 5:293–302.
❖ www.esajournals.org 17 April 2020 ❖ Volume 11(4) ❖ Article e03061You can also read