Hepatocyte-specific IL11 cis-signaling drives lipotoxicity and underlies the transition from NAFLD to NASH
←
→
Page content transcription
If your browser does not render page correctly, please read the page content below
ARTICLE
                  https://doi.org/10.1038/s41467-020-20303-z                OPEN

                  Hepatocyte-specific IL11 cis-signaling drives
                  lipotoxicity and underlies the transition from
                  NAFLD to NASH
                  Jinrui Dong1, Sivakumar Viswanathan1, Eleonora Adami1, Brijesh K. Singh1, Sonia P. Chothani 1, Benjamin Ng1,2,
                  Wei Wen Lim 2, Jin Zhou1, Madhulika Tripathi1, Nicole S. J. Ko1, Shamini G. Shekeran1, Jessie Tan1,2,
                  Sze Yun Lim2, Mao Wang 1, Pei Min Lio2, Paul M. Yen1, Sebastian Schafer 1,2, Stuart A. Cook 1,2,3,4,5 ✉ &
                  Anissa A. Widjaja 1,5 ✉
1234567890():,;

                  IL11 is important for fibrosis in non-alcoholic steatohepatitis (NASH) but its role beyond the
                  stroma in liver disease is unclear. Here, we investigate the role of IL11 in hepatocyte lipo-
                  toxicity. Hepatocytes highly express IL11RA and secrete IL11 in response to lipid loading.
                  Autocrine IL11 activity causes hepatocyte death through NOX4-derived ROS, activation of
                  ERK, JNK and caspase-3, impaired mitochondrial function and reduced fatty acid oxidation.
                  Paracrine IL11 activity stimulates hepatic stellate cells and causes fibrosis. In mouse models of
                  NASH, hepatocyte-specific deletion of Il11ra1 protects against liver steatosis, fibrosis and
                  inflammation while reducing serum glucose, cholesterol and triglyceride levels and limiting
                  obesity. In mice deleted for Il11ra1, restoration of IL11 cis-signaling in hepatocytes recon-
                  stitutes steatosis and inflammation but not fibrosis. We found no evidence for the existence
                  of IL6 or IL11 trans-signaling in hepatocytes or NASH. These data show that IL11 modulates
                  hepatocyte metabolism and suggests a mechanism for NAFLD to NASH transition.

                  1 Cardiovascular and Metabolic Disorders Program, Duke-National University of Singapore Medical School, Singapore, Singapore. 2 National Heart Research

                  Institute Singapore, National Heart Centre Singapore, Singapore, Singapore. 3 National Heart and Lung Institute, Imperial College London, London, UK.
                  4 MRC-London Institute of Medical Sciences, Hammersmith Hospital Campus, London, UK. 5These authors jointly supervised this work: Stuart A. Cook,

                  Anissa A. Widjaja. ✉email: stuart.cook@duke-nus.edu.sg; anissa.widjaja@duke-nus.edu.sg

                  NATURE COMMUNICATIONS | (2021)12:66 | https://doi.org/10.1038/s41467-020-20303-z | www.nature.com/naturecommunications                               1
ARTICLE                                                                 NATURE COMMUNICATIONS | https://doi.org/10.1038/s41467-020-20303-z

I
    nterleukin 11 (IL11) is a fibrogenic factor1–4 that is elevated in        previous data showing reciprocal expression of these two receptors
    fibrotic precision-cut liver slices across species5. IL11 has             on different cells (Fig. 1b)1,19. RNA-seq and Ribo-seq studies
    recently been shown to have negative effects on hepatocyte               confirmed IL11RA and gp130 transcripts to be highly expressed
function after toxic liver insult6 and, directly or indirectly, con-         and actively translated in hepatocytes, whereas IL6R transcripts
tributes to nonalcoholic steatohepatitis (NASH) pathologies7. At             were low and there was little eveidence of IL6R translation
the other end of the spectrum, a number of earlier publications              (Fig. 1c–e; Supplementary Fig. 3b and c). Immunofluorescence
suggest that IL11 is protective in mouse models of ischemic-,                staining of primary human and mouse hepatocytes and some of
infective-, or toxin-induced liver damage8–13. However, it is now            the most commonly used hepatocyte-like cell lines (HepG2 and
apparent that the recombinant human IL11 (rhIL11) reagent used               AML12) revealed that all of these cells consistently had high
in these earlier studies has unexpected effects in the mouse6 and            IL11RA but low IL6R expression (Supplementary Fig. 3d).
the question as to the true biological effect of IL11 in the liver,          Overall, these data show strong co-expression of both IL11RA
specifically in hepatocytes, remains open.                                    and gp130 in hepatocytes across species.
   IL11 is a member of the interleukin 6 (IL6) cytokine family and
binds to its cognate alpha receptor (IL11RA) and then to glyco-
protein 130 (gp130) to signal in cis. IL6 itself has been linked to          IL11 cis-signaling causes hepatocyte death. In hepatocytes, IL11
liver function and publications suggest an overall beneficial                 activated non-canonical signaling pathways (ERK and JNK) in a
effect14–19. Aside from cis-signaling, IL6 can also bind to soluble          dose-dependent manner (2.5–20 ng/ml), while IL6 activated
IL6 receptor (sIL6R) and signal in trans. IL6 trans-signaling is             STAT3 (Supplementary Fig. 4a). To compare IL6 and
considered maladaptive in the context of metabolic and auto-                 IL11 signaling, while circumventing potential complexities asso-
immune disease but, somewhat paradoxically, beneficial for liver              ciated with different levels of IL11RA or IL6R expression, we used
regeneration16. It is possible that IL11, like IL6, also signals in          a synthetic IL6 trans-signaling construct (hyperIL6) and com-
trans but experiments to date have found no evidence for this in             pared this with a synthetic IL11 trans-signaling complex
tumors or reproductive tissues20,21.                                         (hyperIL11). HyperIL11, like IL11 itself, dose-dependently acti-
   The factors underlying the transition from nonalcoholic fatty             vated ERK and JNK. Similarly, IL6 trans-signaling dose-
liver disease (NAFLD) to NASH are multifactorial but lipid                   dependently induced STAT3 phosphorylation, as seen with IL6
loading of hepatocytes is of central importance22. Certain lipid             itself, but did not activate ERK or JNK (Fig. 1f). Thus, IL11 or IL6
species are toxic for hepatocytes and lipotoxicity leads to cytokine         (cis and trans) signaling results in activation of different intra-
release causing hepatocyte death along with activation of hepatic            cellular pathways in hepatocytes.
stellate cells (HSCs) and immune cells22,23. Lipotoxicity, such as              HyperIL11, like IL116, caused a dose-dependent increase in
that due to palmitate24, is an early event in NASH and represents            alanine transaminase (ALT) in the media of primary human
a linkage between diet, NAFLD, and NASH. While genetic or                    hepatocyte cell cultures whereas hyperIL6 (20 ng/ml) had a
pharmacological inhibition of IL6 cis-signaling worsens steatosis            significant, albeit limited, protective effect (ALT fold change (FC)
phenotypes17,18,25, a role for IL11 in hepatic lipotoxicity has not          = 0.9; P = 0.0468) (Fig. 1g). Soluble gp130 (sgp130) is a selective
been described.                                                              inhibitor of trans-signaling complexes acting through gp13016.
   In the current study, we used a range of in vitro and in vivo             Consistent with its reported decoy effects, sgp130 blocked the
approaches to address key questions regarding IL11 in hepatocyte             activation of signaling pathways downstream of both hyperIL11
biology, NAFLD, and NASH: (1) Defining the role of IL11 signaling             (ERK/ JNK) and hyperIL6 (STAT3) as well as inhibited the
in human hepatocytes, (2) examining whether lipotoxicity is related          hepatotoxic effects of hyperIL11 (Fig. 1h–j).
to IL11 activity in hepatocytes, (3) establishing whether IL11 (or              We next probed for the existence of IL11 trans-signaling in a
IL6) trans-signaling contributes to NASH, (4) dissecting the inter-          physiological context, in the absence of preformed, synthetic/alien
relationship between IL11 cis-signaling in hepatocytes and the               protein complexes. We stimulated cells with IL11 in the presence
development of steatosis, hepatocyte death, inflammation, and                 of either soluble gp130 (sgp130, to inhibit putative trans-
fibrosis. These studies demonstrate a detrimental effect of                   signaling) or soluble IL11RA (sIL11RA, to potentiate putative
lipotoxicity-associated IL11 signaling in hepatocytes that appears to        trans-signaling). IL11-induced caspase-3 activation, NOX4 upre-
be apical pathology in the aetiology of NASH.                                gulation, ERK and JNK signaling, and hepatocyte cell death were
                                                                             unaffected by sgp130 or sIL11RA (1 µg/ml) (Fig. 1k and l;
                                                                             Supplementary Fig. 4b). Furthermore, IL11 dose-dependently
Results                                                                      caused hepatocyte cell death, which was unaffected by the
High levels of IL11RA expression in primary human hepato-                    addition of sgp130 or sIL11RA (Supplementary Fig. 4c).
cytes. We first assessed the expression levels of IL6R and IL11RA             Reciprocally, increasing doses of sgp130 or sIL11RA had no
in healthy human or mouse liver by immunohistochemistry. In                  effect on ALT release from IL11-stimulated hepatocytes (Supple-
both human and mouse liver sections there was limited staining               mentary Fig. 4d). These data argue against the existence of IL11
of IL6R but robust expression of IL11RA, which appeared mostly               trans-signaling in hepatocytes.
localized to hepatocytes (Fig. 1a; Supplementary Fig. 2a). This is              Reactive oxygen species and caspases are implicated, together
consistent with staining data from the human protein atlas using             or alone, in lipotoxic cell death26. To probe the mechanisms
two additional antibodies (CAB032830 and HPA036652; https://                 underlying IL11-regulated hepatocyte death we inhibited NOX4
www.proteinatlas.org). Interestingly, as compared to control                 with GKT-13781 or DPI and caspases with Z-VAD-FMK. NOX4
livers, IL11RA expression was increased in liver biopsies from               inhibitors reduced IL11-induced ERK and JNK activation and
patients with NASH and also in livers from mice with NASH on a               robustly protected hepatocytes from IL11-induced cell death
Western Diet supplemented with fructose (Supplementary Fig. 2b               (Supplementary Fig. 4e and f). Pan-caspase inhibition, while
and c).                                                                      protective, was not as effective as NOX4 inhibition in preventing
   Flow cytometry studies confirmed that both IL11RA and gp130                cell death and did not reduce either NOX4 induction or ERK
are highly expressed in primary human hepatocytes whereas IL6R               activation (Supplementary Fig. 4g and h). This places NOX4
was expressed at much lower levels (Fig. 1b; Supplementary                   activity upstream of late-stage (24 h) ERK and caspase-3
Fig. 3a). In contrast, IL6R was highly expressed on immune cells             activation in IL11-stimulated hepatocytes and suggests that
where IL11RA expression was low that is in keeping with                      apoptotic cell death is only one mode of cell death in this context.

2                NATURE COMMUNICATIONS | (2021)12:66 | https://doi.org/10.1038/s41467-020-20303-z | www.nature.com/naturecommunications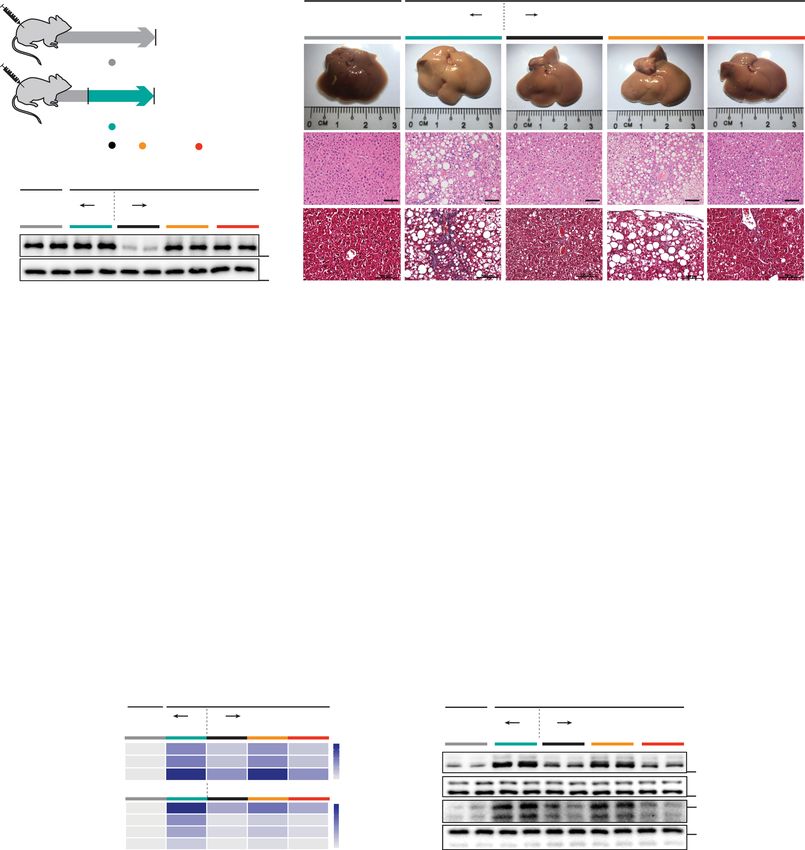
NATURE COMMUNICATIONS | https://doi.org/10.1038/s41467-020-20303-z ARTICLE
a b
250k 250
IL11RA - IL11RA IL6R gp130 IL6R IL11RA
200k 200
150k
Count
150
Hep
100k 100
50k 50
0 0
-3 3 4 5 -3 3 4 5 -3 3 4 5 -3 3 4 5
10 0 10 10 10 10 0 10 10 10 10 0 10 10 10 10 0 10 10 10 10-3 0 103 104 105
FSC
IL6R 250k
- IL11RA IL6R gp130 300 IL11RA IL6R
200k
150k 200
Count
THP-1
100k
100
50k
0 0
10-3 0 103 104 105 10-3 0 103 104 105 10-3 0 103 104 105 10-3 0 103 104 105 10-3 0 103 104 105
Alexa Fluor 488
Alexa Fluor 488
c d e
IL11RA1 IL6R
Read coverage
Read coverage
80 80
RNA-seq RNA-seq
25
40 40
20
0 0
15 80 80
Read coverage
Read coverage
TPM
RIBO-seq RIBO-seq
10
40 40
5
0 0
0
IL11RA1 IL6R IL11RA1 IL6R
annotation
annotation
IL11RA1
RNA-Seq RIBO-Seq
IL6R
f g h
0.0468
- 2.5 5 10 20 (ng ml-1) 25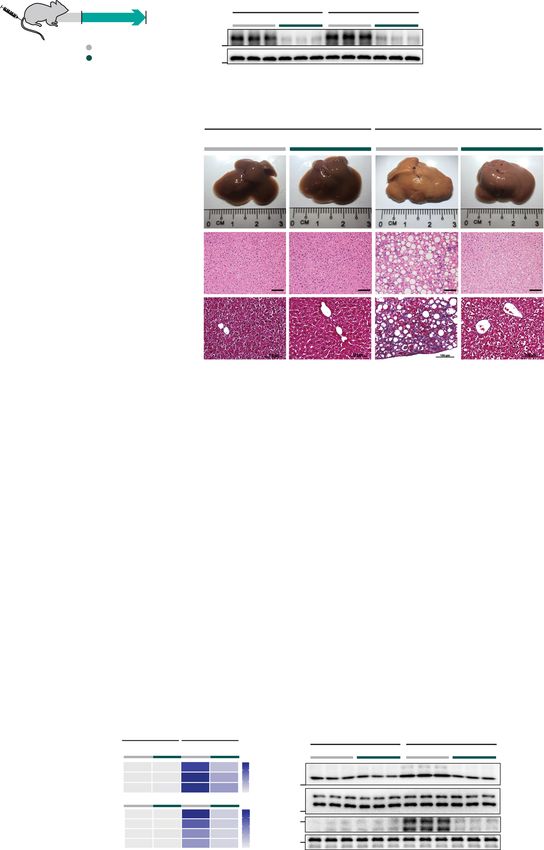
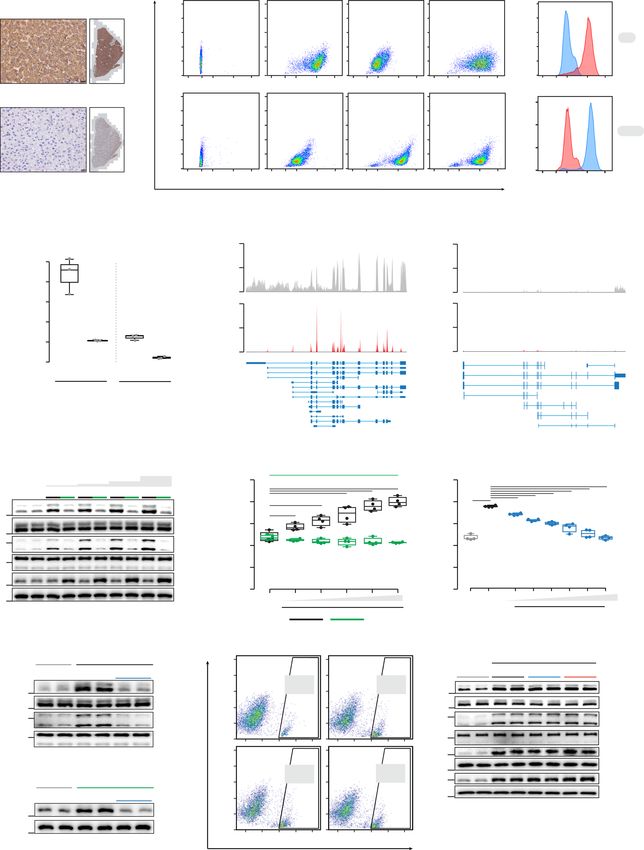
ARTICLE                                                                   NATURE COMMUNICATIONS | https://doi.org/10.1038/s41467-020-20303-z

Fig. 1 IL11RA is highly expressed in hepatocytes and IL11 cis-signaling is hepatotoxic. a Immunohistochemistry staining of IL11RA and IL6R in healthy
human liver sections (scale bars, 20 µm, n = 1 independent experiment, due to limited amount of human liver section). b Flow cytometry forward scatter
(FSC) plots of IL11RA, IL6R, and gp130 staining and fluorescence intensity plots of IL11RA and IL6R staining on hepatocytes and THP-1. c Abundance of
IL11RA1 and IL6R reads in hepatocytes at baseline based on RNA-seq (left) and Ribo-seq (right) (transcripts per million, TPM) (n = 3). d, e Read coverage of
d IL11RA1 and e IL6R transcripts based on RNA-seq (gray) and Ribo-seq (red) of primary human hepatocytes (n = 3). f Western blots showing ERK, JNK,
and STAT3 activation status and g ALT secretion (n = 4) by hepatocytes following a dose range stimulation of either hyperIL11 or hyperIL6. h ALT levels in
the supernatants of hepatocytes stimulated with hyperIL11 alone or in the presence of increasing amounts of soluble gp130 (sgp130) (n = 4). i, j Western
blots of hepatocyte lysates showing i phosphorylated ERK and JNK and their respective total expression in response to hyperIL11 stimulation alone or with
sgp130 and j phospho-STAT3 and total STAT3 in response to hyperIL6 stimulation with and without sgp130. k Representative FSC plots of propidium
Iodide (PI) staining of IL11-stimulated hepatocytes in the presence of sgp130 or soluble IL11RA (sIL11RA). l Western blots showing phospho-ERK, phospho-
JNK, cleaved caspase-3, and their respective total expression, NOX4, and GAPDH in hepatocytes in response to IL11 stimulation alone or in the presence of
sgp130 or sIL11RA. i, j, l Representative data of n = 2 independent experiments. b–l Primary human hepatocytes; f–l 24 h stimulation; hyperIL11, hyperIL6,
IL11 (20 ng/ml), sgp130, sIL11RA (1 µg/ml). c, g, h Data are shown as box-and-whisker with median (middle line), 25th–75th percentiles (box), and
min–max values (whiskers). g, h One-way ANOVA with Dunnett’s correction. Source data are provided as a Source data file.

IL11 cis-signaling underlies lipotoxicity in hepatocytes. To                   oxidation may play a role29. We tested for this and found that
begin to examine the role of IL11 in fatty liver disease, we                   inhibition of IL11 cis-signaling improved fatty acid oxidation in
modeled hepatocyte lipotoxicity, widely viewed as an initiating                lipid-laden hepatocytes (Fig. 2k).
pathology for NASH and related to cytokine release22. To do so,                   In the context of fatty liver disease, hepatocytes release factors
we loaded hepatocytes with palmitate using a concentration of                  to activate HSCs and activate/recruit immune cells, which are key
saturated fatty acids seen in the serum of NAFLD patients27.                   events in the progression from compensated steatosis to NASH.
Palmitate-loaded hepatocytes secreted large amounts of IL11 (28-               As IL11 is secreted by lipotoxic hepatocytes (Fig. 2a), it could in
fold higher than control, P < 0.0001) (Fig. 2a), produced more                 theory act in paracrine on HSCs to drive HSC-to-myofibroblast
IL6, CCL2, and CCL5 (Fig. 2b–d), and exhibited cell death and                  transformation7. We cultured HSCs with conditioned media from
ALT release (Fig. 2e–g).                                                       either control or palmitate-treated hepatocytes and found that
   To test if IL11 secretion from lipid-laden hepatocytes was                  media from lipotoxic hepatocytes strongly induced ACTA2 and
mechanistically related to lipotoxicity we incubated cells with                Collagen expression in HSCs (Fig. 2l; Supplementary Fig. 5i and
neutralizing anti-IL11RA antibody (X209)7 or sgp130. X209                      j). Addition of X209 to the conditioned media blocked ACTA2
reduced the secretion of all cytokines, including IL11 itself,                 and Collagen (Fig. 2l; Supplementary Fig. 5i and j). These data
whereas sgp130 had no effect (Fig. 2a–g). This suggests the                    demonstrate that lipotoxic hepatocytes release IL11 that acts in a
importance of autocrine loop of IL11 cis-signaling for hepatocyte              paracrine fashion to activate IL11 signaling in HSCs.
lipotoxicity. Using hyperIL11 stimulation, which is not detected
by IL11 enzyme-linked immunosorbent assay1, we then estab-
lished the existence of feed-forward autocrine IL11 signaling in               No evidence for IL11 or IL6 trans-signaling in two NASH
hepatocytes (Supplementary Fig. 5a). The production of reactive                models. We then tested whether trans-signaling underlies NASH
oxygen species (ROS) from damaged mitochondria is important                    in vivo using two preclinical mouse NASH models: The Western
for lipotoxicity23 and ROS from NOX4 are also pertinent28.                     Diet supplemented with fructose (WDF) model and the
Consistent with IL11 cis-driven effects on ROS in palmitate-                   methionine- and choline-deficient high fat diet (HFMCD) model.
loaded hepatocytes, we found that X209, but not sgp130, partially              The WDF model is associated with obesity, hyperlipidemia, high
restored total and reduced glutathione (GSH) levels, and this was              glucose levels, and insulin resistance and is seen as translatable to
accompanied by reduction in ROS (Fig. 2h and i; Supplementary                  common forms of human NASH, as in diabetic patients. The
Fig. 5b).                                                                      HFMCD model stimulates rapid onset NASH, specifically driven
   Lipotoxicity is strongly associated with activation of JNK,                 by hepatocyte lipotoxicity, that is associated with weight loss in
which contributes to caspase-3 activation, lipoapoptosis, and                  the absence of insulin resistance. Lipotoxicity is common to both
dysfunctional mitochondria function. Accordingly, palmitate-                   models whereas obesity and insulin resistance are not.
loaded hepatocytes exhibited an increase in JNK activation along                  Three weeks prior to starting either the WDF or HFMCD diet,
with ERK phosphorylation, caspase-3 cleavage, and NOX4                         mice were injected with an AAV8 virus encoding either albumin
upregulation (Fig. 2j). Treatment of lipotoxic cells with Z-VAD-               promoter-driven sgp130 (AAV8-Alb-sgp130), which contains the
FMK prevented caspase-3 cleavage, as expected, and reduced                     whole extracellular domain of mouse gp130 protein (amino acid
hepatocyte death (Supplementary Fig. 5c and d). Notably,                       1–617), or albumin promoter alone (AAV8-Alb-Null) (Fig. 3a;
inhibition of IL11 signaling with X209 reduced palmitate-                      Supplementary Fig. 6a, 7a). AAV8-Alb-sgp130 administration
induced NOX4 upregulation along with JNK, ERK, and                             induced high levels of sgp130 in the liver, which was also
caspase-3 activation (Fig. 2j). While STAT3 was activated by                   detectable in the peripheral circulation, suitable for both local and
palmitate loading, this effect appears unrelated to IL11-driven                systemic inhibition of putative IL6 or IL11 trans-signaling
lipoapoptosis as it was unaffected by X209 (Fig. 2j).                          (Fig. 3b; Supplementary Figs. 6b, 7b and c).
   Lipid loading of hepatocytes was confirmed by Oil Red O                         After 16 weeks of WDF, IL11 levels were strongly upregulated
staining (Supplementary Fig. 5e) and quantitative analysis                     in the liver and the periphery but IL6 expression was unaffected
revealed a reduction in hepatocyte triglyceride (TG) levels with               (Fig. 3b–d). Mice on WDF became obese (Supplementary Fig. 6c),
X209 treatment (Supplementary Fig. 5f). Inhibition of IL11 signal-             an approximate twofold increase in liver mass and developed
ing also resulted in increased mitochondrial O2 consumption                    severe steatosis and fibrosis by gross morphology, histology, and
rates, and maximal and spare respiratory capacity levels                       quantitative analysis of liver triglycerides (Fig. 3e–g). These
(Supplementary Fig. 5g and h). This effect was mediated by                     phenotypes were unaffected by high levels of sgp130 expression
IL11 cis-signaling as sgp130 had no effect (Supplementary Fig. 5g              (Fig. 3b–g). Similarly, mice on WDF had elevated levels of ALT,
and h). The fact that TGs were reduced suggested increased beta-               AST, collagen, and peripheral cardiovascular risk factors (fasting

4                  NATURE COMMUNICATIONS | (2021)12:66 | https://doi.org/10.1038/s41467-020-20303-z | www.nature.com/naturecommunications
NATURE COMMUNICATIONS | https://doi.org/10.1038/s41467-020-20303-z                                                                                                                                                                                                                               ARTICLE

               a                                                                                              b                                                       ns
                                                                                        ns

                                            800
ARTICLE                                                                                                                                                  NATURE COMMUNICATIONS | https://doi.org/10.1038/s41467-020-20303-z

    a                                                                                  b                                                                                          c                                                                      d
                  C57BL/6N single IV inj. (4x10¹¹gc)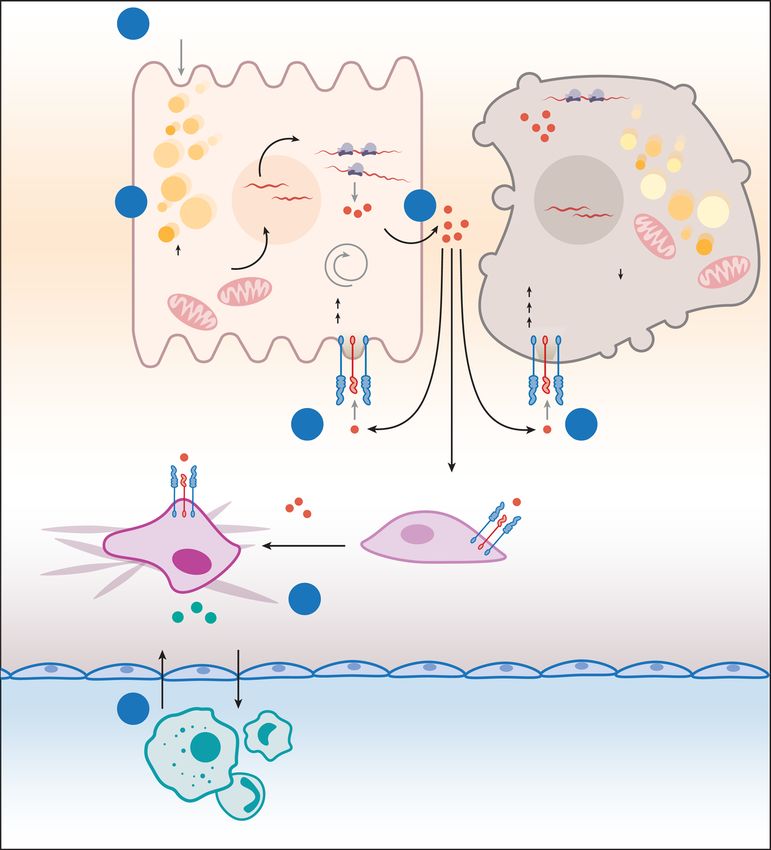
NATURE COMMUNICATIONS | https://doi.org/10.1038/s41467-020-20303-z                                                                          ARTICLE

Fig. 3 Inhibition of IL6 family cytokine trans-signaling has no effect on NASH or metabolic phenotypes in mice on Western Diet supplemented with
fructose. a Schematic of WDF feeding in mice with hepatocyte-specific expression of sgp130 for data shown in (b–p). Three weeks following AAV8-Alb-
Null or AAV8-Alb-sgp130 virus injection, mice were fed WDF for 16 weeks. b Western blots showing hepatic levels of sgp130, IL11, IL6, and GAPDH as
internal control (n = 4 mice/group). c Serum IL11 levels. d Serum IL6 levels. e Representative gross anatomy, H&E-stained (scale bars, 50 µm), and
Masson’s Trichrome (scale bars, 100 µm) images of livers. Representative dataset from n = 8 mice/group is shown for gross anatomy; representative
dataset from n = 4 mice/group is shown for H&E-stained and Masson’s Trichrome images. f Liver weight. g Hepatic triglycerides content. h Serum ALT
levels. i Serum AST levels. j Hepatic collagen levels. k Fasting blood glucose levels. l Serum triglycerides levels. m Serum cholesterol levels. n Hepatic GSH
content. o Hepatic pro-inflammatory and fibrotic genes expression heatmap (values are shown in Supplementary Fig. 6d and e). p Western blots of hepatic
phospho-ERK, ERK, phospho-JNK, JNK, phospho-STAT3, and STAT3 (n = 4 mice/group). c, d, f–o n = 8 mice/group. c, d, f–n Data are shown as box-and-
whisker with median (middle line), 25th–75th percentiles (box), and min–max values (whiskers); one-way ANOVA with Tukey’s correction. Source data
are provided as a Source data file.

histology, and molecular assays, which was unaltered by sgp130                  to be comparable to NC control levels (Figs. 4f and g, 5h and i). In
expression (Supplementary Fig. 7f and g). Hepatocyte damage                     both models, GSH levels were diminished in WT mice on both
markers (ALT and AST) and collagen expression were elevated                     NASH diets but normalized in CKOs (Figs. 4h, 5j).
and GSH levels were depleted by HFMCD diet, irrespective of                        Liver fibrosis was greatly reduced in CKO mice on either
sgp130 expression (Supplementary Fig. 7f, h–k). Similarly, the                  NASH diet as compared to WT (reduction: HFMCD, 87%; WDF,
HFMCD diet was associated with dysregulated expression of                       64%) (Figs. 4d, 4i, 5e, 5k). Upregulation of pro-inflammatory and
inflammation and fibrosis genes and these molecular phenotypes                    fibrosis genes in mice on either the HFMCD or WDF diets was
were unaffected by sgp130 expression (Supplementary Fig. 7l                     also diminished in the CKOs (Figs. 4j, 5l; Supplementary Figs. 8c
and m).                                                                         and d, 9c and d). This suggests that transformation of HSCs to
   At the signaling level, both WDF and HFMCD diets stimulated                  myofibroblasts and activation of immune cells are, in part,
ERK and JNK activation, consistent with elevated IL11 cis-                      secondary to upstream, IL11-driven events in hepatocytes that are
signaling (Fig. 3p; Supplementary Fig. 7n). In contrast, phospho-               consistent with the paracrine effects we detected in vitro (Fig. 2l;
STAT3 levels in the liver were not elevated by WDF (Fig. 3p) and                Supplementary Fig. 5i and j). At the signaling level, both HFMCD
were mildly increased in mice on the HFMCD diet (Supplemen-                     diet and WDF resulted in elevated ERK and JNK phosphoryla-
tary Fig. 7n). In all instances, there was no effect of sgp130 on               tion. This was prevented in CKO mice, consistent with inhibition
diet-induced signaling events. Overall, these data suggest that                 of IL11 signaling in hepatocytes (Figs. 4k, 5m).
neither IL6 nor IL11 trans-signaling plays a role in NASH, which                   Mice on WDF are known to develop hyperglycemia,
is consistent with other studies where IL6 family trans-signaling               hypertriglyceridemia, and hypercholesterolemia, all of which
has not been detected20,21,30,31.                                               were improved in the CKOs (Supplementary Fig. 9e–g). Further-
                                                                                more, as compared to controls, CKOs on WDF had elevated
Hepatocyte-specific IL11 cis-signaling is required to initiate                   serum levels of β-hydroxybutyrate, a peripheral marker of liver
NASH. While we found no evidence to support IL11 trans-sig-                     fatty acid oxidation and ketone production (Supplementary
naling in NASH models, our in vitro data showed evidence of                     Fig. 9h). Overall these data suggest improvement of liver
pathological IL11 cis-signaling in lipotoxic hepatocytes. To test               metabolism in CKOs, in keeping with our finding that inhibition
the effects of IL11 cis-signaling in heptocytes in vivo, we admi-               of IL11 signaling promotes fatty acid oxidation in lipotoxic
nistered AAV8-Alb-Cre to Il11ra1loxP/loxP mice to delete Il11ra1                hepatocytes (Fig. 2k).
specifically in hepatocytes (CKO mice). CKO mice were then fed
either normal chow (NC), HFMCD diet or WDF (Figs. 4a, 5a).
Liver IL11RA protein was greatly diminished in the CKOs fol-                    Reconstitution of IL11 cis-signaling in hepatocytes in IL11ra1
lowing AAV8-Alb-Cre injection, showing the model to be effec-                   null mice restores steatohepatitis but not liver fibrosis. To
tive and suggesting that hepatocytes are the largest hepatic                    complement our loss-of-function experiments using the CKO
reservoir of IL11RA (Figs. 4b, 5b). Both WT and CKO mice had                    mice we employed in vivo gain-of-function experiments. To do
similar levels of serum IL11 after 4 weeks of HFMCD and                         so, we assessed whether restoring IL11 cis- or trans-signaling
16 weeks of WDF (Supplementary Figs. 8a, 9a).                                   specifically in hepatocytes in mice with global Il11ra1 deletion
   In addition to rapidly stimulating lipotoxicity-driven NASH,                 (Il11ra1−/− knockouts (KOs)) resulted in disease. KO mice were
the HFMCD diet causes weight loss32. Surprisingly, weight loss in               injected with AAV8 encoding either the full-length, membrane-
mice on the HFMCD diet was initially limited and later reversed                 bound Il11ra1 (mbIl11ra1; to reconstitute cis-signaling) or a
in CKO mice (Fig. 4c; Supplementary Fig. 8b). Mice on WDF                       secreted/soluble form of Il11ra1 (sIl11ra1, which constitutes the
gained weight and fat mass throughout the experimental period,                  extracellular portion of Il11ra1; to enable trans-signaling) or a
as expected. However, and equally surprising, these obesity                     control construct, and the animals were then fed with NC,
phenotypes were mitigated in CKO mice (Fig. 5c and d;                           HFMCD diet, or WDF (Fig. 6a; Supplementary Fig. 10a, 11a).
Supplementary Fig. 9b). These data suggest that inhibition of                      KO mice injected with AAV8-Alb-mbIl11ra1 re-expressed
IL11 signaling is permissive for weight homeostasis, with context-              IL11RA1 on hepatocytes and KO mice injected with AAV8-Alb-
specific anti-cachectic or anti-obesity effects, which requires                  sIl11ra1 had increased expression of sIL11RA1 in both the liver
further study.                                                                  and the periphery (Fig. 6b; Supplementary Fig. 10b, 11b and c).
   By gross morphology, histology and quantitative triglyceride                 As expected, WT mice receiving control AAV8 constructs
analysis, the CKO mice on either HFMCD or WDF diet were                         (AAV8-Alb-Null) on NC had normal livers and developed
protected from steatosis (Figs. 4d and e, 5e, and f) and those on               steatosis, inflammation, liver damage, and liver fibrosis when on
WDF had less liver mass (Fig. 5g). Liver damage markers were                    either HFMCD diet or WDF (Fig. 6c–j; Supplementary Fig. 10c
markedly reduced in CKO mice fed with either HFMCD diet                         and d, 11d–k). KO mice injected with control virus and fed either
(reduction: ALT, 99%; AST, 97%; P < 0.0001 for both) or WDF                     HFMCD or WDF diets were protected from NASH phenotypes,
(reduction: ALT, 98%; AST, 98%; P < 0.0001 for both) and found                  although protection from NASH with germline global deletion of

NATURE COMMUNICATIONS | (2021)12:66 | https://doi.org/10.1038/s41467-020-20303-z | www.nature.com/naturecommunications                                      7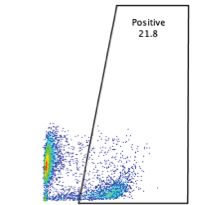
ARTICLE                                                                                                                                                NATURE COMMUNICATIONS | https://doi.org/10.1038/s41467-020-20303-z

      a                                                                                                                                d
                                               Il11ra1loxP/loxP
                                                                                                                                                                    NC                                                           HFMCD (4 weeks)
                                                            NC           HFMCD                                                                  WT                                 CKO                     WT                                       CKO
                                                         week 3                              7
                                       single IV inj.
                                          4x10¹¹gc AAV8-Alb-           Null (WT)
                                                                       Cre (CKO)
      b
                                                                                                                                                                                                                                                                Anatomy
                                               NC                                HFMCD
    kDa                                  WT           CKO                   WT               CKO
     70
                                                                                                                             IL11RA

                                                                                                                             GAPDH
     40

                                                                                                                                                                                                                                                                H&E

      c                                 100
          (% initial weight)
            Body weight

                                                         0.0002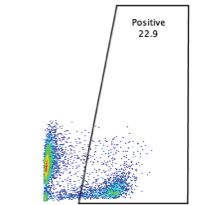
NATURE COMMUNICATIONS | https://doi.org/10.1038/s41467-020-20303-z ARTICLE
a Il11ra1loxP/loxP b
NC WDF
NC WDF WT CKO WT CKO
week 3 19 kDa
IL11RA
single IV inj. 50
4x10¹¹gc AAV8-Alb- Null (WT)
Cre (CKO) GAPDH
40
0.0143
0.0084
0.0346
c 200 NC e
WDF
NC WDF
150
(% initial weight)
WT CKO WT CKO
Body weight
100
50
Anatomy
0
0 2 4 6 8 10 12 14 16 Weeks
0.0007
0.0057
d 15 NC
0.0155
H&E
0.0159
WDF
0.0031
Fat mass (g)
10
5
MT
0
0 2 4 6 8 10 12 14 16 Weeks
f g ns
h
500 4 0.0076 600 ns
nsARTICLE NATURE COMMUNICATIONS | https://doi.org/10.1038/s41467-020-20303-z
Fig. 5 Hepatocyte-specific inhibition of IL11 cis-signaling protects mice against WDF-induced obesity and NASH. a Schematic of WDF-fed control and
CKO mice for data shown in (b–m). Three weeks following AAV8-Alb-Null or AAV8-Alb-Cre virus injection, CKO mice were fed WDF for 16 weeks.
b Western blots showing hepatic levels of IL11RA and GAPDH (n = 3 mice/group). c Body weight (shown as a percentage (%) of initial body weight). d Fat
mass. e Representative gross anatomy, H&E-stained (scale bars, 50 µm), and Masson’s Trichrome (scale bars, 100 µm) images of livers. Representative
dataset from n = 5/group is shown for gross anatomy; representative dataset from n = 4 mice/group is shown for H&E-stained and Masson’s Trichrome
images. f Hepatic triglycerides content. g Liver weight. h Serum ALT levels. i Serum AST levels. j Hepatic GSH content. k Hepatic collagen levels. l Hepatic
pro-inflammatory and fibrotic genes expression on heatmap (values are shown in Supplementary Fig. 9c and d). m Western blots showing activation status
of hepatic ERK and JNK (n = 3 mice/group). c, d, f–l n = 5 mice/group. c, d Data are shown as mean ± SD, two-way ANOVA with Tukey’s correction,
statistical significance (P values) are shown for comparison between WT WDF and CKO WDF; f–k data are shown as box-and-whisker with median
(middle line), 25th–75th percentiles (box), and min–max values (whiskers); two-way ANOVA with Tukey’s correction. Source data are provided as a
Source data file.
progress to NASH22,33. A key underlying pathology in the pro- Our studies have limitations and pose questions. The published
gression to NASH is “substrate overload”, whereby a nutritional literature suggests IL6R is highly expressed in hepatocytes16 and it
abundance overruns the hepatocyte’s ability to process fat, was surprising that primary human hepatocytes express very little
causing lipotoxicity. Cytokines are key NASH factors secreted IL6R. The differential activation of ERK/JNK by IL11 as com-
from lipotoxic hepatocytes22 and here we establish IL11 as an pared to STAT3 by IL6 at 24 h in hepatocytes was also notable
important component of the lipotoxic milieu and a driver of the but the underlying mechanisms are unknown. While we show
NAFLD-to-NASH transition. consistent effects of IL11 inhibition on pro-inflammatory factors
A large body of evidence supports the idea that IL6 cis- and we did not specifically address effects on immune cells them-
trans-signaling in the liver is beneficial16,17,19,25. However, at the selves. Metabolic effects appear closely related to IL11-mediated
same time, a pathogenic role for IL6 trans-signaling in hepatic NOX4-derived ROS but ROS from other sources also likely
steatosis has also been proposed30,34. Using man-made, artificial contributes. Temporal relationships between ERK and NOX4
protein constructs we found that IL11 trans-signaling is toxic in activation require further evaluation. We found a beneficial effect
hepatocytes, whereas hyperIL6 appears protective. However, we of hepatocyte-specific IL11 inhibition on reducing fat deposition
found no evidence to support a meaningful role for IL6 or IL11 and body weight gain in mice on an obesogenic NASH diet,
trans-signaling in a biologically relevant context either in vitro or which while notable was not studied in depth. We surmise that
in vivo, using both gain- and loss-of-function approaches. Nota- IL11 hepatocyte biology is a nascent field and that these various
bly, sgp130, a therapeutic agent that inhibits IL6 trans-signaling, matters require further study.
had no effect on lipotoxicity, NAFLD or NASH. Thus, we suggest In conclusion, we propose a model for lipotoxicity-driven
that IL6 family member trans-signaling has no role in hepatocytes NAFLD-to-NASH transitions whereby lipid-laden hepatocytes
or NASH, which is in agreement with studies outside the secrete IL11 leading to autocrine hepatocyte metabolic dysfunc-
liver20,21. tion and cell death along with paracrine activation of neigh-
Our data show a central importance of IL11 cis-signaling in bouring HSCs and other cells (Fig. 7). We rule out IL6 or IL11
hepatocytes for multiple NASH pathologies. This effect was trans-signaling as relevant for hepatocyte biology or liver
established using both hepatocyte-specific loss-of-function on a pathology in lipotoxicity. We suggest that inhibiting
wild-type genetic background and also hepatocyte-specific gain- IL11 signaling in hepatocytes targets an initiating nexus for diet-
of-function on an Il11ra1 null background. This overturns the induced steatohepatitis that impacts subsequent liver fibrosis and
suggestion in the literature that IL11 is protective for hepatocytes inflammation. Hence, therapeutic inhibition of IL11-induced
based on the use of recombinant human IL11 in murine models lipotoxicity may be beneficial in metabolic liver diseases, such as
of liver disease8,10–12. While restoration of IL11 cis-signaling in NASH.
hepatocytes causes steatohepatitis in mice globally deleted for
Il11ra1, lipotoxicity-associated fibrosis was still prevented. In
contrast, hepatocyte-specific Il11ra1 deletion protected mice from Methods
Ethics statements. All experimental protocols involving human subjects (com-
both steatohepatitis and fibrosis. This places hepatocyte dys- mercial primary human cell lines and human liver sections) have been performed
function upstream of HSC activation, which is consistent with the in accordance with the ICH Guidelines for Good Clinical Practice. As written in
observed paracrine effects of IL11 from lipotoxic hepatocytes. their respective datasheets, ethical approvals have been obtained by the relevant
We repeatedly documented metabolically advantageous effects parties and all participants gave written informed consent: commercial human liver
associated with the inhibition of IL11 signaling. In vitro, inhibi- sections (by Abcam); liver sections from healthy control and NASH patients (by
Fibrofind); primary human hepatocytes and hepatic stellate cells (by ScienCell);
tion of IL11 improved mitochondrial function and increased HepG2 and THP-1 (by ATCC).
beta-oxidation along with a reduction of intracellular triglycerides Animal studies were carried out in compliance with the recommendations in
and ROS production. The effects on ROS are likely complex as the Guidelines on the Care and Use of Animals for Scientific Purposes of the
IL11 induces NOX4 but also impacts mitochondria function and National Advisory Committee for Laboratory Animal Research (NACLAR). All
experimental procedures were approved (SHS/2014/0925 and SHS/2019/1482) and
perhaps also the endoplasmic reticulum, directly or indirectly. conducted in accordance with the SingHealth Institutional Animal Care and Use
Interestingly, inhibition of NOX4 was more effective than caspase Committee.
inhibition in reducing IL11-stimulated cell death. Thus IL11-
induced NOX4/ROS lies upstream of late-stage ERK and caspase
activation in hepatocytes and apoptosis is not the only form of AAV8 vectors. All Adeno-associated virus serotype 8 (AAV8) vectors used in this
study were synthesized by Vector Biolabs. AAV8 vector carrying a mouse
cell death in this context. In vivo, deletion of Il11ra1 in hepato- membrane-bound Il11ra1 cDNA (NCBI accession number: BC069984), a mouse
cytes limited WDF-induced fat accumulation and body weight soluble Il11ra1 cDNA, and a mouse soluble gp130 cDNA driven by Albumin (Alb)
gain while reducing serum glucose, triglyceride, and cholesterol promoter is referred to as AAV8-Alb-mbIl11ra1, AAV8-Alb-sIl11ra1, and AAV8-
levels. This was associated with lower liver fat, lesser hepatic Alb-sgp130, respectively. AAV8-Alb-sgp130 and AAV8-Alb-sIl11ra1 were con-
structed by removing the transmembrane and cytoplasmic regions of mouse gp130
oxidative stress, and increased serum levels of beta-hydro- sequence (NCBI accession number: BC058679) and mouse Il11ra1 sequence,
xybutyrate, thought metabolically beneficial in itself35. respectively. AAV8-Null vector was used as vector control. To specifically delete
10 NATURE COMMUNICATIONS | (2021)12:66 | https://doi.org/10.1038/s41467-020-20303-z | www.nature.com/naturecommunicationsNATURE COMMUNICATIONS | https://doi.org/10.1038/s41467-020-20303-z ARTICLE
a single IV inj. AAV8-Alb-
4x10¹¹gc
c NC WDF
WT KO
Null Null Null mbIl11ra1 sIl11ra1
NC
19
Il11ra1+/+(WT) Null
Anatomy
NC WDF
week 3 19
Il11ra1+/+(WT) Null
Il11ra1-/-(KO) Null mbIl11ra1 sIl11ra1
b
H&E
Diet NC WDF
Genotype
WT KO
AAV8-Alb- Null Null Null mbIl11ra1 sIl11ra1
kDa
MT
IL11RA
50
GAPDH
40
d ns e ns f ns
3ARTICLE NATURE COMMUNICATIONS | https://doi.org/10.1038/s41467-020-20303-z
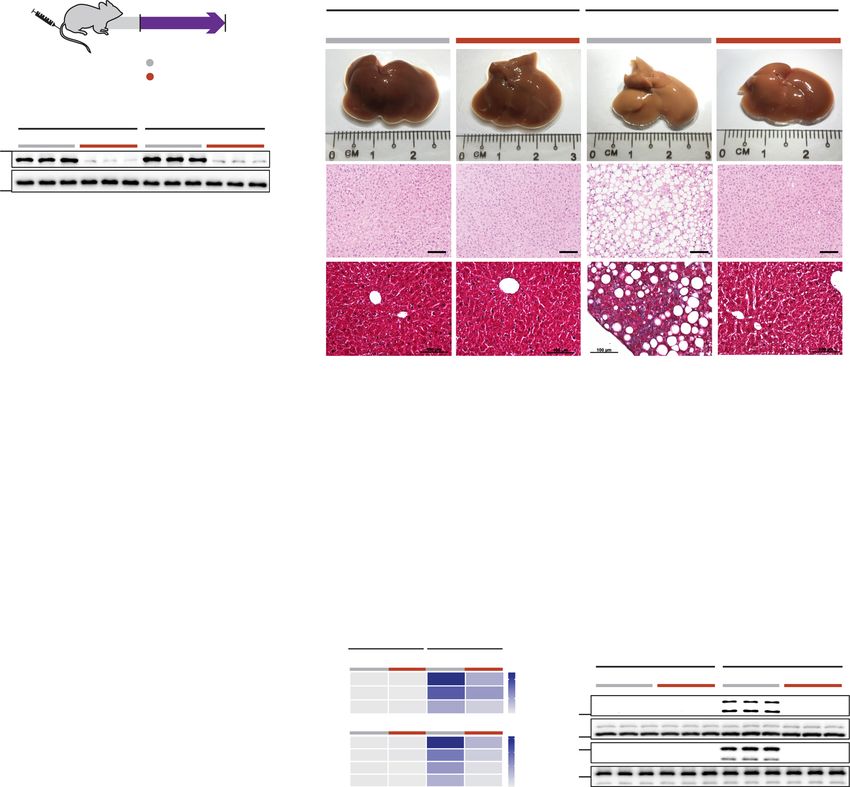
Fig. 6 Hepatocyte-specific IL11 cis-signaling but not IL11 trans-signaling drives steatohepatitis in mice on WDF. a Schematic showing WDF feeding
regimen of Il11ra1+/+ (WT) and Il11ra1−/− (KO) mice for experiments shown in (b–n). AAV8-Alb-Null, AAV8-Alb-mbIl11ra1 (full-length membrane-bound
Il11ra1), and AAV8-Alb-sIl11ra1 (soluble form of Il11ra1)-injected KO mice were given 16 weeks of WDF feeding, three weeks following virus administration. b
Western blots showing hepatic levels of IL11RA and GAPDH (n = 2 mice/group). c Representative gross anatomy, H&E-stained (scale bars, 50 µm) and
Masson’s Trichrome (scale bars, 100 µm) images of livers. Representative dataset from n = 6 mice/group is shown for gross anatomy; representative
dataset from n = 4 mice/group is shown for H&E-stained and Masson’s Trichrome images. d Liver weight. e Hepatic triglycerides content. f Serum ALT
levels. g Serum AST levels. h Hepatic GSH content. i Hepatic collagen content. j Hepatic pro-inflammatory and fibrotic genes expression heatmap (values are
shown in Supplementary Fig. 10c and d). k Western blots showing activation status of hepatic ERK and JNK (n = 2 mice/group). l Fasting blood glucose
levels. m Serum triglycerides levels. n Serum cholesterol levels. d–j, l–n n = 6 mice/group. d–i, l–n Data are shown as box-and-whisker with median (middle
line), 25th–75th percentiles (box), and min–max values (whiskers); one-way ANOVA with Tukey’s correction. Source data are provided as a Source data file.
1 Saturated FA
Hepatocyte Apoptotic hepatocyte
IL11 translation
Lipotoxicity 2 IL11
mRNA 3
IL11
NOX4
ROS β Oxidation
Cl.CASP3
JNK JNK
ERK ERK
Cell death
gp130+IL11RA
4 4
Activated HSC Quiescent HSC
IL11 Space of Disse
ECM
Autocrine loop
Fibrosis
5
chemokines Endothelial cells
6
Inflammation Immune Hepatic sinusoid
cells
Fig. 7 Proposed mechanism for IL11 in lipotoxicity-driven NASH transition. Excessive lipid accumulation in hepatocytes stimulates IL11 protein secretion
and autocrine IL11 activity, which upregulates NOX4 and increases reactive oxygen species production. Subsequently, hepatocyte mitochondrial oxidative
capacity and fatty acid metabolism impaired and steatosis established. ERK, JNK, and caspase-3 become activated and this leads to lipoapoptosis, along
with other forms of cell death. IL11 also acts in paracrine to drive hepatic stellate cell-to-myofibroblast transformation and fibrosis. Cytokines and
chemokines released from lipotoxic hepatocytes and HSCs activate and recruit immune cells causing inflammation.
antibody (ab150113, Abcam, 1:200), mouse HRP (7076, CST, 1:2000), rabbit Alexa Custom recombinant proteins: Human IL11 (UniProtKB:P20809, Genscript).
Fluor 488 secondary antibody (ab150077, Abcam, 1:200), rabbit HRP (7074, CST, Human hyperIL11 (IL11RA:IL11 fusion protein), which mimics the trans-signaling
1:2000), rat Alexa Fluor 488 secondary antibody (ab150157, Abcam, 1:200), rat complex, was constructed using a fragment of IL11RA (amino acid residues 1–317;
HRP (31470, Santa Cruz, 1:800). UniProtKB: Q14626) and IL11 (amino acid residues 22–199, UniProtKB: P20809)
with a 20 amino acid linker (GPAGQSGGGGGSGGGSGGGSV)1.
Recombinant proteins. Commercial recombinant proteins: Human hyperIL6
(IL6R:IL6 fusion protein, 8954-SR, R&D Systems), human IL6 (206-IL-010, R&D Chemicals. 4′,6-diamidino-2-phenylindole (DAPI, D1306, Thermo Fisher),
Systems), human soluble gp130 Fc (671-GP-100, R&D Systems), human IL11RA diphenyleneiodonium chloride (DPI, 141310, Abcam), GKT-137831 (17764, Cay-
(8895-MR-050, R&D Systems). man Chemical), palmitate (P5585, Sigma), paraformaldehyde (PFA, 28908;
12 NATURE COMMUNICATIONS | (2021)12:66 | https://doi.org/10.1038/s41467-020-20303-z | www.nature.com/naturecommunicationsNATURE COMMUNICATIONS | https://doi.org/10.1038/s41467-020-20303-z ARTICLE
Thermo Fisher), phorbol 12-myristate 13-acetate (PMA, P1585, Sigma), Triton X- Oil Red O staining. Primary human hepatocytes were seeded on 8-well chamber
100 (T8787, Sigma), and Z-VAD-FMK (FMK001, Sigma). slides (1.5 × 10⁴ cells/well) Following 24 h of palmitate treatment, cells were fixed in
10% PFA for 30 min, washed with distilled water, and incubated with 60% (v/v)
isopropyl alcohol for 5 min. Cells were then stained with Oil Red O Solution
Cell culture. All the experiments performed with primary human hepatocytes, (O0625, Sigma) for 30 min and washed with distilled water prior to imaging with a
primary adult mouse hepatocytes, and primary adult human hepatic stellate cells bright field microscope (BX53, Olympus). The lipid droplets were identified by
were carried out at low cell passage (≤P3). their red staining.
1. Primary human hepatocytes culture
Primary human hepatocytes (5200, ScienCell) were maintained in Reactive oxygen species (ROS) detection. Primary human hepatocytes were
hepatocyte medium (5201, ScienCell) supplemented with 2% fetal bovine seeded on 8-well chamber slides (1.5 × 10⁴ cells/well). For this experiment, cells
serum, 1% penicillin-streptomycin at 37 °C and 5% CO2. Hepatocytes were were not serum-starved prior to palmitate treatment. Twenty-four hours following
serum-starved overnight unless otherwise specified in the methods prior to palmitate stimulation, cells were washed, incubated with 25 µM of DCFDA solu-
24 h stimulation with different doses of various recombinant proteins as tion (ab113851, Abcam) for 45 min at 37 °C in the dark, and rinsed with the
outlined in the main text and/or figure legends. dilution buffer according to the manufacturer’s protocol. Live cells with positive
2. Primary adult mouse hepatocytes culture DCF staining were imaged with a filter set appropriate for fluorescein (FITC) using
Mouse hepatocytes (ABC-TC3928, AcceGen Biotech) were maintained in a fluorescence microscope (Leica).
mouse hepatocyte medium (ABC-TM3928, AcceGen Biotech) supplemented
with 1% penicillin-streptomycin.
3. Primary adult human hepatic stellate cells Seahorse assay. Primary human hepatocytes were seeded into the Seahorse XF
HSCs (5300, ScienCell) were cultured in stellate cells complete media (5301, Cell Culture Microplate (1 × 10⁴ cells/well) and serum-starved overnight prior to
ScienCell) on poly-L-lysine-coated plates (2 µg/cm2, 0403, ScienCell). HSCs stimulations. Seahorse measurements were performed on Seahorse XFe96 Extra-
were serum-starved overnight prior to 24 h stimulation with conditioned cellular Flux analyzer (Agilent). XF Cell Mito Stress Test kit (103015-100, Agilent)
media from BSA or palmitate-stimulated hepatocyte (24 h) in the presence was used to measure the mitochondrial oxygen consumption rate as per the
of various recombinant proteins as outlined in the main text and/or figure manufacturer’s protocol. Briefly, stimulation media were removed and replaced
legends. with 180 μl of Mitostress assay medium at 37 °C. Oligomycin (1 μM; ATP synthase
4. HepG2 culture inhibitor) was injected following basal OCR measurements followed by injection of
HepG2 (ATCC) were cultured in Eagle’s minimum essential medium (30- FCCP (1 μM; an uncoupling agent that collapses the proton gradient and disrupts
2003, ATCC) supplemented with 10% FBS. the mitochondrial membrane potential), and finally by injection of a mixture of
5. AML12 culture rotenone (1 μM; a complex I inhibitor) and antimycin A (1 μM; a complex III
AML12 (ATCC) were cultured in DMEM:F12 medium (30-2006, ATCC) inhibitor). The percentage of fatty acid oxidation analysis was performed by using
supplemented with 10% FBS, 10 µg/ml insulin, 5.5 µg/ml transferrin, 5 ng/ml Seahorse XF Mito Fuel Flex Test kit (103260-100). Acute injections of CPT1 alpha
selenium, and 40 ng/ml dexamethasone. inhibitor Etomoxir (4 µM) was used to inhibit mitochondrial FAO, whereas BPTES
6. THP-1 culture (3 µM) and UK5099 (2 µM) were used to inhibit mitochondrial glutamine and
THP-1 (ATCC) were cultured in RPMI 1640 (A1049101, Thermo Fisher) glucose oxidation, respectively, to inhibit 100% mitochondrial fuel oxidation.
supplemented with 10% FBS and 0.05 mM β-mercaptoethanol. THP-1 cells Seahorse Wave Desktop software was used for report generation and data analysis.
were differentiated with 10 ng/ml of PMA in RPMI 1640 for 48 h.
RNA-sequencing (RNA-seq) and ribosome profiling (Ribo-seq)
Generation of RNA-seq libraries. Total RNA was extracted from human hepatocytes
Palmitate (saturated fatty acid) treatment in vitro. Palmitate (0.5 mM) con-
using RNeasy columns (Qiagen). RNA was quantified using a Qubit RNA High-
jugated in fatty acids free BSA in the ratio of 6:1 was used to treat cells as described
Sensitivity Assay kit (Life Technologies) and its quality was assessed on the basis of
in figure legends; 0.5% BSA solution was used as control.
their RNA integrity number using the LabChip GX RNA Assay Reagent Kit
(PerkinElmer). TruSeq Stranded mRNA Library Preparation kit (Illumina) was
Flow cytometry. For surface IL11RA, IL6R, and gp130 analysis, primary human used to measure transcript abundance following standard instructions from the
hepatocytes and THP-1 cells were stained with IL11RA, IL6R, or gp130 antibody, manufacturer.
and the corresponding Alexa Fluor 488 secondary antibody. Omission of primary
antibody staining was used as negative control. Cell death analysis was performed
by staining primary human hepatocytes with Dead Cell Apoptosis Kit with Generation of Ribo-seq libraries. Hepatocytes were grown to 90% confluence in a
Annexin V FITC and PI (V13242, Thermo Fisher). PI+ve cells were then quantified 10 cm culture dish and lysed in 1 ml cold lysis buffer (formulation as in TruSeq®
with the flow cytometer (Fortessa, BD Biosciences) and analyzed with FlowJo Ribo Profile Mammalian Kit, RPHMR12126, Illumina) supplemented with 0.1 mg/
ml cycloheximide. Homogenized and cleared lysates were then footprinted with
version X software (TreeStar): the preliminary FSC/SSC gates of the starting cell
population was 10,000 events. Debris (SSC‐A vs FSC‐A) and doublets (FSC‐H vs Truseq Nuclease (Illumina) according to the manufacturer’s instructions. Ribo-
FSC‐A) were excluded. Boundaries between “positive” and “negative” staining were somes were purified using Illustra Sephacryl S400 columns (GE Healthcare), and
set at 103 for PI staining. A figure exemplifying the gating strategy is provided in the protected RNA fragments were extracted with a standard phenol:chloroform:
the Supplementary Fig. 1. isoamylalcohol technique. Following ribosomal RNA removal (Mammalian Ribo-
Zero Magnetic Gold, Illumina), sequencing libraries were then prepared out of the
footprinted RNA by using TruSeq® Ribo Profile Mammalian Kit according to the
Immunofluorescence (IF). Primary human hepatocytes were seeded on 8-well manufacturer’s protocol.
chamber slides (1.5 × 10⁴ cells/well) 24 h before the staining. Cells were fixed in 4% The final RNA-seq and ribosome profiling libraries were quantified using
PFA for 20 min, washed with PBS, and non-specific sites were blocked with 5% KAPA library quantification kits (KAPA Biosystems) on a StepOnePlus Real-Time
BSA in PBS for 2 h. Cells were incubated with IL11RA, IL6R, gp130, or Albumin PCR system (Applied Biosystems) according to the manufacturer’s protocol. The
antibody overnight (4 °C), followed by incubation with the appropriate Alexa Fluor quality and average fragment size of the final libraries were determined using a
488 secondary antibody for 1 h (RT). Negative control cells (−) were only stained LabChip GX DNA High Sensitivity Reagent Kit (PerkinElmer). Libraries with
with the secondary antibody. Chamber slides were dried in the dark and 5 drops of unique indexes were pooled and sequenced on a NextSeq 500 benchtop sequencer
mounting medium with DAPI were added to the slides for 15 min prior to imaging (Illumina) using NextSeq 500 High Output v2 kit and single-end 75-bp sequencing
by fluorescence microscope (Leica). chemistry.
Operetta high throughput phenotyping assay. HSCs were seeded in 96-well Data processing and analyses for RNA-sequencing and ribosome profiling.
black CellCarrier plates (PerkinElmer) at a density of 5 × 10³ cells per well. Fol- Raw sequencing data were demultiplexed with bcl2fastq V2.19.0.316 and the
lowing simulations, cells were fixed in 4% PFA (Thermo Fisher), permeabilized adaptors were trimmed using Trimmomatic36 V0.36, retaining reads longer than
with 0.1% Triton X-100 (Sigma), and non-specific sites were blocked with 0.5% 20 nt post-clipping. Ribo-seq reads were aligned using bowtie37 to known mtRNA,
BSA and 0.1% Tween-20 in PBS. Cells were incubated overnight (4 °C) with pri- rRNA, and tRNA sequences (RNACentral38, release 5.0) and only unaligned reads
mary antibodies (1:500), followed by incubation with the appropriate Alexa Fluor were retained as Ribosome protected fragments (RPFs). Alignment to the human
488 secondary antibodies (1:1000). Cells were counterstained with 1 µg/ml DAPI genome (hg38) was carried out using STAR39. Gene expression was quantified on
(D1306, Thermo Fisher in blocking solution. Each condition was imaged from the CDS (coding sequence) regions for Ribo-seq and exonic regions for RNA-seq
duplicated wells and a minimum of 7 fields/well using Operetta high-content using uniquely mapped reads (Ensembl database release GRCh38 v86) with feature
imaging system 1483 (PerkinElmer). Cells expressing ACTA2 were quantified counts40. TPM was calculated and visualized using boxplot to compare baseline
using Harmony v3.5.2 (PerkinElmer) and the percentage of activated fibroblasts/ expression of IL11RA (ENSG00000137070), IL6R (ENSG00000160712), and gp130
total cell number (ACTA2+ve) was determined for each field. The measurement of (ENSG00000134352). Read coverage using Ribo-seq and RNA-seq reads for
fluorescence intensity per area (normalized to the number of cells) of Collagen I IL11RA, IL6R, and gp130 was visualized using Gviz R package41 with strand-
was performed with Columbus 2.7.1 (PerkinElmer). specific alignment files.
NATURE COMMUNICATIONS | (2021)12:66 | https://doi.org/10.1038/s41467-020-20303-z | www.nature.com/naturecommunications 13ARTICLE NATURE COMMUNICATIONS | https://doi.org/10.1038/s41467-020-20303-z
Animal models. Mice were housed in temperatures of 21–24 °C with 40–70% (DCP00; R&D Systems), and Human CCL5/RANTES Quantikine ELISA Kit
humidity on a 12 h light/12 h dark cycle and provided with food and water ad (DRN00B; R&D Systems), respectively. The levels of IL11, IL6, gp130, and IL11RA
libitum. in mouse serum were quantified using Mouse IL11 DuoSet ELISA (DY418; R&D
Systems), Mouse IL6 Quantikine ELISA Kit (M6000B; R&D Systems), Mouse
Interleukin 11 Receptor Alpha (IL11Ra) ELISA Kit (MBS452535; MyBioSource),
Mouse models of metabolic liver disease.
and Mouse gp130 DuoSet ELISA (DY468, R&D Systems), respectively. All ELISA
1. HFMCD assays were performed according to the manufacturer’s protocol.
6–8-week-old C57BL/6N, Il11ra1−/− mice, and Il11ra1loxP/loxP and their
respective control were fed with methionine- and choline-deficient diet
supplemented with 60 kcal% fat (HFMCD, A06071301B, Research Diets) for Liver tissue processing and histological analysis.
4 weeks. Control mice received normal chow (NC, Specialty Feeds).
2. WDF 1. Immunohistochemistry (IHC)
6–8-week-old C57BL/6N, Il11ra1−/− mice, and Il11ra1loxP/loxP and their Comparison of IL11RA and IL6R expression in healthy human liver
respective control were fed western diet (D12079B, Research Diets) (ab4348, Abcam) and in mouse liver: mouse livers were fixed in 10%
supplemented with 15% weight/volume fructose in drinking water (WDF) neutral-buffered formalin (NBF), paraffinized, cut into 7-μm sections. Both
for 16 weeks. Control mice received NC and tap water. human and mouse liver tissue sections were incubated with primary
antibodies overnight and visualized using an ImmPRESS HRP anti-rabbit
IgG polymer detection kit (MP-7401, Vector Laboratories) with ImmPACT
Il11ra1-deleted mice (KO). Six- to eight-week-old male Il11ra1−/− mice DAB Peroxidase Substrate (SK-4105, Vector Laboratories).
(B6.129S1-Il11ratm1Wehi/J, Jackson’s Laboratory) were intravenously injected with Comparison of IL11RA expression in the human livers from healthy control
4 × 10¹¹ genome copies (gc) of AAV8-Alb-mbIl11ra1 or AAV8-Alb-sIl11ra1 virus and patients suffering from NASH: these studies were outsourced to a
to induce hepatocyte-specific expression of mouse Il11ra1 or soluble Il11ra1, company (Fibrofind). Briefly, paraffin embedded blocks of human livers
respectively. As controls, both Il11ra1−/− mice and their wild-type littermates were cut into slides and stained with IL11RA antibody (NBP2-32671, Novus
(Il11ra1+/+) were intravenously injected with 4 × 10¹¹ gc AAV8-Alb-Null virus. Biologicals) or control. Analysis was performed on liver sections from three
Three weeks after virus injection, mice were fed with HFMCD, WDF, or NC. healthy individuals as control (NHL20, NHL60, NHL67; 1 section/code) and
Durations of diet are outlined in the main text and/or figure legends. on liver sections from 2 NASH patients (TLPAT5, TLPAT14; 1 section/
code). Due to data protection policies, no further information is available on
samples or patients.
In vivo administration of soluble gp130. Six- to eight-week-old male C57BL/6N 2. H&E and Masson’s Trichrome staining
mice (InVivos) were injected with 4 × 10¹¹ gc AAV8-Alb-sgp130 virus to induce Mouse liver samples were processed and sectioned as mentioned above,
hepatocyte-specific expression of soluble gp130; control mice were injected with followed by hematoxylin and eosin (H&E) or Masson’s Trichrome staining
4 × 10¹¹ gc AAV8-Alb-Null virus. Three weeks following virus administration, according to standard protocol.
mice were fed with HFMCD, WDF, or NC for durations that are outlined in the
main text and/or figure legends.
Statistical analysis. All statistical analyses were performed using GraphPad Prism
software (version 6.07). Simple two-tailed Student’s t-tests were used for experi-
Il11ra-floxed mice (CKO). Il11ra-floxed mice, in which exons 4–7 of the Il11ra1
mental setups requiring testing of just two conditions. For comparisons between
gene were flanked by loxP sites, were created using the CRISPR/Cas9 system as
more than two conditions, one-way ANOVA with Dunnett’s correction (when
previously described42. To induce the specific deletion of Il11ra1 in hepatocytes,
several conditions were compared to one condition) or Tukey’s correction (when
6–8-week-old male homozygous Il11ra1-floxed mice were intravenously injected
with AAV8-Alb-Cre virus (4 × 10¹¹ gc); a similar amount of AAV8-Alb-Null virus several conditions were compared to each other) were used. Comparisons of two
parameters (body weight across time) for different groups were performed by two-
were injected into homozygous Il11ra1-floxed mice as controls. The AAV8-injected
way ANOVA with Tukey’s correction. The criterion for statistical significance was
mice were allowed to recover for 3 weeks prior to HFMCD, WDF, or NC feeding.
set at P < 0.05.
Knockdown efficiency was determined by western blotting of hepatic IL11RA.
RT-qPCR. Total RNA was extracted from snap-frozen liver tissues using Trizol Reporting summary. Further information on research design is available in the Nature
(Invitrogen) and RNeasy Mini Kit (Qiagen). PCR amplifications were performed Research Reporting Summary linked to this article.
using iScript cDNA Synthesis Kit (Bio-Rad). Gene expression was analyzed in
duplicate by SYBR green (Qiagen) technology using StepOnePlus (Applied Bio-
systems) over 40 cycles. Expression data were normalized to GAPDH mRNA Data availability
expression and fold change was calculated using 2−ΔΔCt method. The primer All data are available within the Article or Supplementary Information. The RNA-seq
sequences are listed in Supplementary Table 1. and RIBO-seq data reported in this paper are available in NCBI BioProject ID:
PRJNA670552. Source data are provided with this paper.
Immunoblotting. Western blots were carried out on total protein extracts from
hepatocytes and liver tissues. Hepatocyte and liver tissue lysates were homogenized Received: 18 March 2020; Accepted: 24 November 2020;
in RIPA Lysis and Extraction Buffer (89901, Thermo Scientific) containing pro-
tease and phosphatase inhibitors (Roche). Protein lysates were separated by SDS-
PAGE and transferred to PVDF membranes. Protein bands were visualized using
the ECL detection system (Pierce) with the appropriate secondary antibodies: anti-
rabbit HRP, anti-mouse HRP, or anti-rat HRP. Uncropped western blot images are
provided in Source data file. References
1. Schafer, S. et al. IL-11 is a crucial determinant of cardiovascular fibrosis.
Colorimetric assays. Alanine aminotransferase (ALT) activity in the cell culture Nature 552, 110–115 (2017).
supernatant and mouse serum was measured using ALT Activity Assay Kit 2. Ng, B. et al. Interleukin-11 is a therapeutic target in idiopathic pulmonary
(ab105134, Abcam). Cellular and liver glutathione (GSH) levels were measured fibrosis. Sci. Transl. Med. 11, eaaw1237 (2019).
using Glutathione Colorimetric Detection Kit (EIAGSHC, Thermo Fisher). Total 3. Lim, W.-W. et al. Transgenic interleukin 11 expression causes cross-tissue
hydroxyproline content in mouse livers was measured using Quickzyme Total fibro-inflammation and an inflammatory bowel phenotype in mice. PLoS ONE
Collagen assay kit (QZBtotco15, Quickzyme Biosciences). The levels of triglycer- 15, e0227505 (2020).
ides in hepatocyte lysates and in mouse serum and livers were measured using 4. Cook, S. A. & Schafer, S. Hiding in plain sight: interleukin-11 emerges as a
Triglyceride Assay Kit (ab65336, Abcam). Mouse serum levels of aspartate ami- master regulator of fibrosis, tissue integrity, and stromal inflammation. Annu.
notransferase (AST), cholesterol, and β-hydroxybutyrate were measured using AST Rev. Med. 71, 263–276 (2020).
Assay Kit (ab105135, Abcam), Cholesterol Assay Kit (ab65390; Abcam), and beta- 5. Bigaeva, E. et al. Transcriptomic characterization of culture-associated
hydroxybutyrate (Ketone body) Colorimetric Assay Kit (700190; Cayman Che- changes in murine and human precision-cut tissue slices. Arch. Toxicol.
micals), respectively. All colorimetric assays were performed according to the https://doi.org/10.1007/s00204-019-02611-6 (2019).
manufacturer’s protocol. 6. Widjaja, A. A. et al. Redefining Interleukin 11 as a regeneration-limiting
hepatotoxin. bioRxiv https://doi.org/10.1101/830018 (2019).
Enzyme-linked immunosorbent assay (ELISA). The levels of IL11, IL6, CCL2, 7. Widjaja, A. A. et al. Inhibiting interleukin 11 signaling reduces hepatocyte
and CCL5 in equal volumes of cell culture media were quantified using Human death and liver fibrosis, inflammation, and steatosis in mouse models of non-
IL11 Quantikine ELISA kit (D1100; R&D Systems), Human IL-6 Quantikine alcoholic steatohepatitis. Gastroenterology https://doi.org/10.1053/j.
ELISA Kit (D6050; R&D Systems), Human CCL2/MCP-1 Quantikine ELISA Kit gastro.2019.05.002 (2019).
14 NATURE COMMUNICATIONS | (2021)12:66 | https://doi.org/10.1038/s41467-020-20303-z | www.nature.com/naturecommunicationsYou can also read