The Tortoise and the Hare: The Race between Vaccine Rollout and New Covid Variants 9151 2021
←
→
Page content transcription
If your browser does not render page correctly, please read the page content below
9151
                                                             2021
                                                              June 2021

The Tortoise and the Hare:
The Race between Vaccine
Rollout and New Covid
Variants
David Turner, Balazs Egert, Yvan Guillemette, Jamila Botev
Impressum: CESifo Working Papers ISSN 2364-1428 (electronic version) Publisher and distributor: Munich Society for the Promotion of Economic Research - CESifo GmbH The international platform of Ludwigs-Maximilians University’s Center for Economic Studies and the ifo Institute Poschingerstr. 5, 81679 Munich, Germany Telephone +49 (0)89 2180-2740, Telefax +49 (0)89 2180-17845, email office@cesifo.de Editor: Clemens Fuest https://www.cesifo.org/en/wp An electronic version of the paper may be downloaded · from the SSRN website: www.SSRN.com · from the RePEc website: www.RePEc.org · from the CESifo website: https://www.cesifo.org/en/wp
CESifo Working Paper No. 9151

                       The Tortoise and the Hare:
  The Race between Vaccine Rollout and New Covid Variants

                                         Abstract

New variants of the virus are spreading which, together with seasonal effects, are estimated to
be able to raise effective reproduction numbers by up to 90%. Meanwhile, many countries are
rolling out vaccination programmes, but at varying speeds. Hence the race is on to beat the
variants with the vaccines. Vaccination is very powerful at reducing virus transmission: fully
vaccinating 20% of the population is estimated to have the same effect as closing down public
transport and all-but-essential workplaces; fully vaccinating 50% of the population would have a
larger effect than simultaneously applying all forms of containment policies in their most
extreme form (closure of workplaces, public transport and schools, restrictions on travel and
gatherings and stay-at-home requirements). For a typical OECD country, relaxing existing
containment policies would be expected to raise GDP by about 4-5%. Quick vaccination would
thus help limit the extent to which containment policies need to be escalated in future epidemic
waves, providing huge welfare benefits both in terms of fewer infections and stronger economic
activity.
JEL-Codes: I180, E610.
Keywords: Covid, Sars-Cov-2, reproduction number, vaccine, variant, lockdown, weekly
tracker.

               David Turner                                     Balazs Egert
        OECD Economics Department                        OECD Economics Department
              Paris / France                                   Paris / France
         David.TURNER@oecd.org                            Balazs.EGERT@oecd.org
             Yvan Guillemette                                   Jamila Botev
        OECD Economics Department                        OECD Economics Department
              Paris / France                                   Paris / France
       Yvan.GUILLEMETTE@oecd.org                          Jamila.BOTEV@oecd.org

The views expressed in this paper are those of the authors and do not necessarily reflect the
opinions of the OECD. The authors would like to thank Laurence Boone, Luiz de Mello, Alain
de Serres, colleagues from the Economics Department, colleagues from the Employment,
Labour and Social Affairs Directorate and delegates of Working Party No. 1 of the OECD
Economic Policy Committee, for useful comments and suggestions. Many thanks also to
Veronica Humi for excellent editorial assistance.
2 1. Introduction The ever-growing body of the literature has been providing insights with regard to the effect of individual lockdown and other public health policies on the reproduction rate and economic outcomes. There is now much research to suggest that containment policies are associated with a reduction in infections, in COVID- 19-related deaths and in reproduction numbers (Conyon et al., 2020; Gros et al., 2020). However, there is disagreement as to which interventions are most effective, with different studies emphasising different polices. Some research suggests that stay-at-home requirements are most effective in curbing the propagation of the virus (Esra et al., 2020; Gapen et al., 2020; Spiegel and Tookes, 2020; Chernozhukov et al., 2020). A recent survey concludes that a majority of papers find significant effects of school closure on the spread of the virus (Walsh et al., 2020). School closure is found to be particularly effective by Liu et al. (2020) and Olczak et al. (2020). Chernozhukov et al. (2020) argue the effect is uncertain, whilst Spiegel and Tookes (2020) find no effect. Some studies find that limiting potential ‘super-spreader’ events -- such as NBA and NHL games in the United States, football matches in England or gatherings more generally - - are a very effective way of reducing the spread of the virus (Ahammer et al., 2020; Chen et al., 2020; Hunter et al., 2020; Olczak et al., 2020; Weber, 2020; Li et al., 2020). Other studies emphasise the importance of travel restrictions, particularly on international flights and at the early stages of the pandemic (Hubert, 2020; Keita, 2020, Leffler et al., 2020). The elderly population is especially vulnerable to COVID-19 with much higher mortality rates than other demographic groups. A particular concern is that at the early stages of the pandemic, mortality rates were alarmingly high in long-term care facilities (LTCFs) in some OECD countries (ECDC, 2020b; Gandal et al. 2020). Evidence from influenza outbreaks as well as the current pandemic suggests that improving hygiene, including regular hand sanitising and disinfection at the establishment level (Koshkouei et al., 2020), as well as limiting the migration of staff across different care homes, help to reduce infection rates substantially (Koshkouei et al., 2020; Chen et al., 2020), although the latter may be difficult given widespread staff shortages. Recent work at the country level also underlines the importance of protecting the elderly (Égert et al, 2020). The effectiveness of testing and tracing crucially depends on correctly and speedily identifying contact persons and on compliance with isolation orders (Hellewell et al. 2020). Empirical evidence, exploiting an administrative mistake in contact tracing in England, indicates potentially massive effects from timely contact tracing (Fetzer and Graeber, 2020). Testing and tracing appears to work well in countries with good social security and in particular high coverage of paid sick leave in case isolation is needed. This effect has been shown for earlier influenza episodes as well (Pichler et al., 2020). It has been argued that repeated mass testing coupled with the isolation of the infected could eradicate the virus without reliance on contact tracing (Taipale, Romer and Linnarsson, 2020). 2 A recent review of about 50 studies on the effectiveness of facial coverings in the community concluded that they have a “small to moderate effect” in preventing the spread of COVID-19 (ECDC, 2021). Measuring the health effect of facial coverings in multi-country empirical studies is difficult, because they depend on the take-up rate and it is difficult to account for the greater tendency to wear face masks, regardless of policy pronouncements, in some (mostly Asian) countries prior to the current virus outbreak. Nevertheless, some cross-country studies have identified important negative effects on mortality (Esra et al., 2020, Leffler et al., 2020, Hatzius et al., 2020) and the reproduction number (Égert et al., 2020). Beneficial effects of 2 China has demonstrated the potential for mass testing in the city of Wuhan in May 2020, with up to 1.5 million tests being processed in a single day (New York Times, 2020). Mass antigen testing has been considered a success in Slovakia, where the reproduction number declined by 0.3. Nevertheless, such a strategy can work in the longer term only if mass testing is repeated at regular intervals (Kahanec et al., 2021).
3

mask wearing on mortality are also reported at the regional level in the United States (Hatzius et al., 2020,
Welsch, 2020; Spiegel and Tookes, 2020) and Germany (Mitze et al., 2020).
Containment policies are also found to depress economic activity, for example König and Winkler (2020)
and Gros et al. (2021) find a strong link between the overall stringency of containment policies and quarterly
GDP growth rates. In terms of specific policies, workplace closure is often found to have the strongest link
with GDP, with stay-at-home requirements and school closures having weaker links (Chen et al., 2020;
Demirguc-Kunt et al., 2020; Kok, 2020). Other containment policies are less often singled out, although it
is clear that international travel restrictions have more severely impacted those countries that are more
reliant on travel and tourism. The GDP costs of containment measures must be understood in a short-
run/immediate sense, because from a longer-run perspective, there may be no cost to containment policies
if they prevent an epidemic from spreading, which would lead to larger GDP costs later on via either
spontaneous changes in behaviour or the need for harsher containment measures. A recent study that
attempts to take epidemiological dynamics into account indeed finds little output costs to additional
containment polices that reduce deaths (Arias et al., 2021).
The contribution of the paper is manifold. First, using OECD country experiences from the beginning of
2020 to mid-May 2021 it evaluates policy impacts for a set of policies and not for specific policies in
isolation, as it done in much of the literature. Second, the paper studies the importance of vaccination.
Many countries around the world are now faced with a race to rollout vaccination programmes against
potential upsurges in infections caused by more transmissible COVID-19 variants. While mass vaccination
should eventually win the race and bring the pandemic under control, 3 the rapid spread of new variants
has the potential to cause new epidemic waves in the meantime, requiring further containment policies,
which will slow or delay any economic recovery. In these circumstances, the appropriate policy responses,
and their dependence on the speed of vaccine rollout. Third, the paper assesses the relative importance
of differential variants of the virus as well as seasonal effects. Finally, the paper looks at the economic
costs using the OECD Weekly GDP Tracker-
The empirical analysis consists of two equations estimated at high frequency: the first explains the daily
evolution of the effective reproduction number, R (representing the spread of the virus), and the second
explains a proxy measure of weekly GDP. The estimations make extensive use of a set of COVID-19 policy
trackers maintained by the Oxford Blavatnik School of Government (Hale et al., 2020), as well as data on
the scale of vaccinations and the prevalence of different variants of the virus.
These equations are then used to explore alternative scenarios that differ according to the speed of vaccine
rollout and the infectiousness of new variants of the virus. A feature of all of the scenarios is that the number
of infections is on a downward trajectory (i.e. the reproduction number remains below 1). This is because
differing OECD country experiences since the start of the pandemic underline the advantage of
suppressing the virus rather than pursuing a strategy of stop-and-go mitigation (Aghion et al, 2021). On
that basis, the different scenarios consider whether new lockdown measures may be required to offset the
effect of more transmissible variants of the virus and the extent to which this can be avoided by a faster
vaccination rollout.
The remainder of the paper is organised as follows. Section 2 provides stylised facts. Section 3 describes
the data and the estimation method. for the reproduction number and the proxy measure of GDP, as well
as the policies and other explanatory variables that influence them in the estimation framework. In section
4, estimation results for the drivers of the reproduction rate are presented for OECD countries, because

3
 This assumes that a new variant does not prove to be resistant to existing vaccines, although were this to be the
case, the hope is that existing vaccines could be modified relatively quickly.
4

sensitivity analysis suggests that responses from a wider set of countries are very different.4. Section 5
reports the determinants of weekly GDP. In section 6, the estimation results are used to construct a number
of stylised scenarios incorporating the prevalence of more transmissible variants, to consider the required
setting of containment policies and how this varies with the proportion of the population that are vaccinated.
Section 7 summarises the results.

2. Stylised facts

The median R estimate for OECD countries fell rapidly from around 2¼ in early March 2020 to around 0.75
the next month and has since fluctuated in the 0.75 to 1.50 range (Figure 1, panel A). Reasons behind
these fluctuations include seasonal effects, the probably premature lifting of restrictions in the summer of
2020 and the delayed and muted policy reaction to the surge of the virus in the Autumn of 2020. Another
reason is the ebb and flow of mutations in the virus. For instance, the emergence of the so-called UK or
alpha variant (B.1.1.7) in the fall of 2020, first in the United Kingdom and then in many other countries, was
a major factor behind the increase in R in the first quarter of 2021 (Figure 1, panel B).
The OECD Weekly Tracker of GDP growth, developed by OECD (2020b) and Woloszko (2020a and
2020b)5 shows a large drop and quick recovery in 2020. The median weekly GDP tracker for OECD
countries also shows that output has been about 5% below the no-pandemic counterfactual in late 2020
and much of 2021 (Figure 2).
The question that needs to be raises is how the typical policy response with regard to containment
measures has evolved since the start of the pandemic. A cursory examination would suggest that among
OECD countries, more recent responses have been characterised by less resort to the most stringent
implementation of school closures, workplace closures, international travel restrictions and stay-at-home
requirements, but more stringent restrictions on gatherings (Figure 3). Different waves of the virus have,
however, hit countries at different times, so in order to define a typical policy response, a focus here is on
all OECD European countries on the assumption that the timing may be more similar. Typically, policy
response during the first wave contained hard lockdown measures such as stay-at-home requirements
and workplace closures, whereas policies have been shifted towards less binding measures including
mandatory mask wearing and to the scaling up test, trace and isolate policies amd the roll-out of
vaccination programmes.

4
  For example, many of the main containment measures (such as workplace closures and stay-at-home requirements)
have much weaker effects on the reproduction number in non-OECD countries than OECD countries, perhaps
reflecting weaker social security nets and/or more limited possibilities to work remotely.
5
 applies a machine learning model to a panel of Google Trends data, aggregating together information about search
behaviour related to consumption, labour markets, housing, trade, industrial activity and economic uncertainty to
provide estimates of the growth rate of weekly GDP compared to a year earlier.
5

Figure 1. Reproduction number and emergence of the B.1.1.7 variant
             A. Median effective reproduction number (R) and                      B. Percentage of all sequenced cases of COVID-19 that are
                   interquartile range, OECD countries                                     of the B.1.1.7 variant, selected countries
2.50                                                                 2.50   100                                                               100
                                                                                         United Kingdom
2.25                                                                 2.25
                                                                                         Poland
                                                                             80                                                               80
2.00                                                                 2.00                Netherlands
1.75                                                                 1.75                Italy
                                                                             60          Germany                                              60
1.50                                                                 1.50                Sweden
1.25                                                                 1.25    40          France                                               40

1.00                                                                 1.00
                                                                             20                                                               20
0.75                                                                 0.75
0.50                                                                 0.50     0                                                               0
       Mar     Apr         Jul           Oct          Jan      Apr                 Oct     Nov    Dec     Jan     Feb     Mar    Apr    May
                        2020                            2021                              2020                           2021

Source: Arroyo Marioli, F. et al. (2020), “Tracking R of COVID-19: A New Real-Time Estimation Using the Kalman Filter”; Hodcroft, E.B.
(2021), "CoVariants: SARS-CoV-2 Mutations and Variants of Interest" and authors’ calculations.

Figure 2. A weekly measure of OECD GDP
Median and interquartile range, % difference from a no-pandemic counterfactual

Note: The chart shows the difference between the proxy measure of weekly GDP and a no-pandemic counterfactual projection provided by
OECD Economic Outlook No. 106 (November 2019).
Source: OECD Weekly Tracker site: http://www.oecd.org/economy/weekly-tracker-of-gdp-growth/

3. Data and estimation issues

The empirical analysis relies on a set of variables representing containment measures maintained by the
Oxford Blavatnik School of Government (Hale et al., 2020), which in their original form are scored according
to the degree of stringency or comprehensiveness with which they are applied. Eight categories of
containment measures are distinguished, being variously scored from 0 to 2, 0 to 3, or 0 to 4 (Table 1).
The scoring of measures refers to their design, not necessarily how they have been applied. This
6
represents a potential weakness as the variables do not capture how enforcement and abidance by
regulations has varied across countries.
For the purposes of estimation, the cardinal value of these scores are ignored (as there is no reason, for
example, to expect a policy with a stringency value of 3 to have treble the effect of a policy with a value of
1) and instead the same policy at different levels of stringency are included as distinct dummy variables
(taking the value of zero or one). Subsequently, if the estimation does not deliver the expected ordinal
ranking in coefficients (so that a more stringent application of a policy has a greater effect), the same
coefficient may be imposed across different levels of stringency by combining policy variables. 6 For school
closures, an indicator produced by UNESCO and measuring whether schools and universities are partially
or completely closed due to COVID-19 is used in the empirical analysis instead of the one by the Oxford
Blavatnik School of Government.
Table 1. Definition of different stringency levels for containment policies
Containment measure Scoring of degree of stringency
School closures 1: Partial closure due to COVID
2: Complete closure due to COVID
Workplace closures 1: Recommend closing (or work from home)
2: Require closing (or work from home) for some sectors or categories of workers
3: Require closing (or work from home) all-but-essential workplaces (e.g. grocery stores, doctors)
Cancel public events 1: Recommend cancelling
2: Require cancelling
Restrictions on gatherings 1: Restrictions on very large gatherings (above 1000 people)
2: Restrictions on gatherings between 101-1000 people
3: Restrictions on gatherings between 11-100 people
4: Restrictions on gatherings of 10 people or less
Close public transport 1: Recommend closing (or significantly reduce volume/route/means of transport available)
2: Require closing (or prohibit most citizens from using it)
Stay at home requirements 1: Recommend not leaving house
2: Require not leaving house with exceptions for daily exercise, grocery shopping, and ‘essential’ trips
3: Require not leaving house with minimal exceptions (e.g. only once a week, or one person at a time)
Restrictions on internal movement 1: Recommend not to travel between regions/cities
2: Internal movement restrictions in place
International travel controls 1: Screening
2: Quarantine arrivals from high-risk regions
3: Ban on arrivals from some regions
4: Ban on all regions or total border closure
Note: Not shown in the table, but “No measures” or “No restrictions” are always scored 0.
Source: Oxford COVID-19 Government Response Tracker described in Hale et al. (2020) and UNESCO’s School closures caused by
Coronavirus (Covid-19) (unesco.org).
The Oxford COVID-19 Government Response Tracker includes the severity of restrictions on visitors to
LTCFs, with the most stringent classification reserved for when all non-essential visitors are prohibited
(Table 2). In this paper’s empirical framework, facial coverings are investigated using the Oxford COVID-
19 Government Response Tracker indicators, which denote the strength of government mandates in this
regard. The empirical work will investigate the effect of the protection of the elderly.
To capture the effect of test and trace policies, the policy indicators from the Blavatnik School of
Government at the University of Oxford (Hale et al., 2020) are used (Table 2). Again, for the purpose of
6
Multicollinearity, implying problems in being able to separately identify coefficients on different explanatory variables,
is a concern given that containment measures were often introduced simultaneously or very close together. Earlier
work, estimating similar equations over a shorter sample to mid-2020 (Égert et al. 2020), suggested there was
collinearity between some of the main containment policies associated with lockdown, however this is much less
apparent over a longer sample period.7
the estimation work, the cardinal values of the trackers are ignored and instead different dummy variables
are used to represent test-and-trace variables at different degrees of comprehensiveness. Many aspects
of testing and tracing may be easier at low infection levels and this can be readily tested in the empirical
framework. However, an important limitation of these indicators is that they do not capture timing or speed,
which can be key to a successful strategy: test results must be returned with minimum delay and then
contacts need to be traced quickly. A further important limitation of these indicators is there is no
information on the extent to which test and trace polices are followed up with measures to isolate those
infected or potentially infected.
Table 2. Public health policies against COVID-19
Protection of elderly people
1: Recommendations regarding isolation, hygiene and visitor restrictions in Long-term Care Facilities (LTCFs) and/or
elderly to stay at home.
2: Narrow restrictions for isolation, hygiene and visitor restrictions in LTCFs and/or restrictions protecting elderly people at
home.
3: Extensive restrictions for isolation, hygiene in LTCFs, all non-essential external visitors prohibted, and/or elderly
required to stay at home with minimal exceptions and no visitors.
Testing policy1
1: Only those who both (a) have symptoms AND (b) meet specific criteria (e.g. key workers, admitted to hospital, came
into contact with a known case, returned from overseas)
2: Testing of anyone showing COVID-19 symptoms
3: Open public testing (e.g. "drive through" testing available to asymptomatic people).
Contact tracing
1: Limited contact tracing - not done for all cases
2: Comprehensive contact tracing - done for all identified cases.
Facial coverings
1: Recommend
2: Required in some specified shared/public spaces or some situations when social distancing not possible
3: Required in all specified shared/public spaces or all situations when social distancing not possible
4: Required outside the home at all times
Note: Not shown in the table, but “No measures” or “No restrictions” are scored 0.
(1) Testing variable relates to policies testing for infection (PCR test), not to policies testing for immunity (antibody tests).
Source: Oxford COVID-19 Government Response Tracker described in Hale et al. (2020).
Data on vaccination rates are taken from Our World in Data. The estimation results do not differentiate
between the different vaccines, although there is some evidence to suggest that some vaccines -- such as
the SINOVAC vaccine which, among OECD countries, has been approved in Chile, Turkey, Mexico and
Colombia – has lower efficacy than other vaccines commonly used in OECD countries, especially after
only one shot (Figure 3).7
7 The speed with which vaccination programmes are being rolled out varies greatly across OECD countries. By end-
May, there were five countries where more than 50% of the population had received at least one vaccine done, but
also five countries where this share had not reached 20%.8
Figure 3. Vaccination rates vary greatly across OECD countries
Per cent of population vaccinated as of end-May 2021
70
Vaccinated once Vaccinated twice
60
50
40
30
20
10
0
ISL
EU
ISR
CAN
CHL
LTU
LUX
POL
LVA
MEX
SVN
SVK
TUR
GBR
AUT
HUN
USA
AUS
JPN
FRA
SWE
CZE
ESP
KOR
DEU
EST
GRC
NOR
BEL
PRT
DNK
ITA
Source: Official data collated by Our World in Data. Some OECD countries are missing because the data do not allow splitting vaccination status
between one and two doses.
The empirical work considers mutants of the virus that have had widespread prevalence in the estimation
sample as well as the recent Indian variant. Data on the prevalence of different variants are from the
GISAID database via the website Covariants.org. The series measure the proportions of all virus
sequences (not cases) submitted to GISAID classified as a specific variant. The names for the variants
refer to the Pango Lineage nomenclature. B.1.1.7 is commonly referred to as the UK variant. Other variants
considered (B.1.258, B.1.160 and B.1.177) have all been highly prevalent in at least a few OECD countries.
The more recent Indian variant (B.1.617) is also considered
4. Explaining the reproduction number
Regression analysis is used to relate country-level daily reproduction numbers to several potential
explanatory factors, including containment policies, public-health policies, seasonal conditions, the
prevalence of variants, vaccination rates as well as proxies for spontaneous behavioural changes and
natural immunity. In addition, the estimated equation includes a full set of country fixed effects to account
for fixed country characteristics (such as population density, general social habits, etc.) that could affect
virus transmission. This means that identification relies on variation of reproduction numbers and other
variables in the time dimension.
Unlike many other studies that focus on a single explanatory factor, the approach used here has the
advantage of considering all of the above factors at once within the same framework and using a large
amount of daily data from several countries. Nevertheless, the approach is not able to identify causal policy
effects, as many of the explanatory variables are not independent from the reproduction number. For
instance, containment and other policies are taken in response to the evolution of the pandemic. Identifying
pure causal effects would require exogenous sources of policy variation (e.g. natural experiments) or the
use of instrumental variables, if good instruments could be found.
An important feature of the estimated equation explaining R is that the preferred functional form for the
dependent variable is logarithmic; a formal test decisively rejects a linear form in favour of a logarithmic9
one.8 This implies that any policy intervention will have a larger effect when R is initially high than when it
is low.
4.1. Containment policies
In the estimation, the coefficients on six containment policies -- workplace and school closures, restrictions
on gatherings, stay-at-home requirements, international travel controls and closures of the public transport
system -- are found to have a statistically significant effect in reducing R (Table 3, Figure 4).
The largest effects come from the most stringent application of workplace closures, which reduce
logged R by 0.27 (which from an initial R number of 1.5, implies an absolute fall in R of 0.35).
Resort to such stringent policies have, however, been very infrequent. Also rare is the
accompaniment of workplace closures with a complete closure of the public transport system,
which in combination reduces logged R by 0.37.
Tight restrictions on gatherings and stay-at-home requirements have been widely applied across
most OECD countries and are estimated to reduce logged R by up to 0.15 and 0.13, respectively.
Complete closure of schools, which OECD countries have been more reluctant to impose since
their widespread imposition in dealing with the first wave of the virus in the first half of 2020, reduce
logged R by 0.13.
International travel restrictions are estimated to reduce logged R by up to 0.12, although this may
underestimate their importance in preventing the spread of new variants of the virus and in
sustaining a situation in which the national rate of infections is much lower than in other countries.
The estimated equation suggests that tightening the stringency of policies increases their effectiveness,
although not always in a linear fashion (Figure 6). The finding of stronger effects from more stringent
application of containment policies contradicts the findings of Bendavid et al. (2021), who conclude that
more restrictive containment policies do not have a significantly greater impact on the growth of infections.
8
Testing the appropriate functional form of the dependent variable is not as straightforward as testing for the functional
form of explanatory variables because the competing models cannot be nested within a general model. The test is
therefore conducted by first transforming the dependent variable by dividing by its geometric mean to make the two
competing models (log and linear) comparable. A formal test of model equivalence can be performed with the BoxCox
statistic by comparing the relative goodness-of-fit of the two models. The test decisively favours the logarithmic form
for R over different country samples. Conversely, when a similar test is carried out for the weekly GDP equation, the
linear form is decisively preferred to the logarithmic form.10
Table 3. The drivers of the effective reproduction number, OECD countries
Sample period: 15 January 2020 to 16 May 2021
Dependent variable: ln(R)
Constant 0.6999**
Containment policies
Stay-at-home requirement (=1 & 2) -0.0755**
Stay-at-home requirement (=3) -0.1293**
Workplace closures (=1) -0.1036**
Workplace closures (=2) -0.1987**
Workplace closures (=3) -0.2666**
Closure of public transport(=2) & workplaces (=3) -0.1005**
School closures (=2) -0.1327**
Restrictions on gatherings (=1 & 2) -0.0494**
Restrictions on gatherings (=3) -0.1139**
Restrictions on gatherings (=4) -0.1481**
International travel controls (=3) -0.0932**
International travel controls (=4) -0.1235**
Test and Trace policies
All Test & Trace combinations 0.0217
All Test & Trace combinations when deaths < 10 per million -0.0612**
Other non-containment policies
Facial coverings (=3 & 4) -0.0157**
Protection of the elderly (=3) -0.0403**
Seasonal effect
Hours of daylight -0.0203**
Death rates (per million population)
Daily national death rate -0.0172**
Daily global death rate -0.1338**
Total national death rate -0.0001**
Vaccination rates (% of population)
Vaccinated once(-28) -0.0054**
Vaccinated twice(-28) -0.0181**
Prevalence of virus variants (% of cases sequenced)
B.1.177 0.0014**
B.1.160 0.0009**
B.1.258 0.0043**
B.1.1.7 ('UK variant') 0.0035**
B.1.617 ('Indian variant') 0.0006
Adjusted R-squared 0.476
Daily observations 14167
Countries covered 35
Note: The policy variables are based on the variables described in Table 1and Table 2, but re-normalised to be (0, 1) dummy variables as
described in the main text. The notation in brackets “(=n)” after a containment policy variable denotes that the dummy variable is assigned a 1
if the original score for that policy was equal to n, whereas the notation “(>=n)” denotes that the dummy variable is assigned a 1 if the original
score for that policy was greater than or equal to n. “**” denotes statistical significance at the 5% level, based on heteroscedasticity-robust
standard errors. The equation includes country fixed effects, which are not reported here. The dependent variable (R) has a lead of 12 days
relative to the explanatory variables, to account for the delay between infection and case detection.
Source: Authors’ calculations.11
Figure 4. Estimated effects of policies and natural caution on logged R
A. Effect on logged R
National
Workplace Restrictions Stay-at- International death rate Global death
Workplace
closures 1 on School home travel Protection of Facial (10 per rate (1 per
closures gatherings closures requirement controls the elderly Test & Trace coverings million) million)
0.00
-0.05
-0.10
-0.15
-0.20
-0.25
-0.30
-0.35
Stringency level 1 2 3 4
-0.40
Note: The chart shows the estimated effect on logged R of different containment policies at varying degrees of stringency, the effect of policies
relating to test-and-trace and facial coverings as well as the effect of increased natural caution, proxied by the daily death rate. If a particular
degree of policy stringency is not shown in the bar chart, then it either means there is no significant effect on GDP (this being the case when
bar segments at a higher level of stringency are shown), or that it has the same effect as the policy at the previous level of stringency (when bar
segments at a lower level of stringency are shown). The effect of the test-and-trace and facial coverings are the maximum effect, which in the
former case depend on a low level of infections.
1) Workplace closures have a maximum stringency level of 3 according to the Oxford taxonomy, but are shown here as having a maximum
stringency level of 4 when combined with a complete closure of public transport. Full closure of public transport is not shown separately because
it has only rarely been applied and then in combination with full workplace closure and this is also reflected in the estimation.
Source: OECD calculations based on estimations reported in Table 3.
4.2. Public health policies
The implementation of test and trace policies is found to reduce R, but the effects are relatively small. It is
also difficult to distinguish the size of effects according to the comprehensiveness of the policy, so in the
estimated specification the same coefficient applies to all combinations of test and trace stringencies. This
result may be attributable to differences in how quickly and successfully test and trace policies are applied,
as explained previously. All test and trace policies are found to be much more effective when the infection
rate is low (which in this estimation is taken to be less than ten new daily cases per million population, a
rate which many countries had well exceeded already in March and April 2020). This is a rather
unsurprising finding, given the difficulties of tracking down all contact persons in a timely manner if the
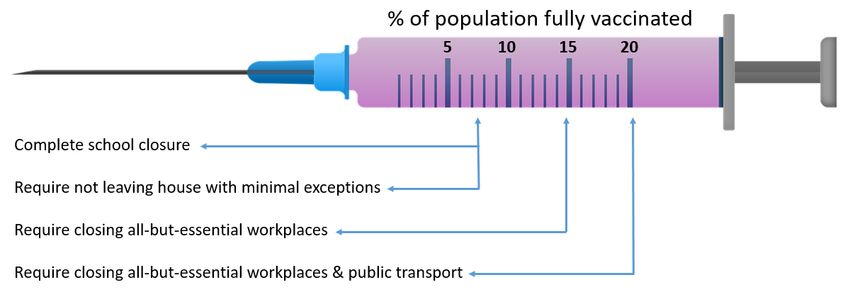
system is overwhelmed with new cases.12 Recommendations to make facial coverings mandatory in public are found to reduce the spread of the virus, but the estimated effects are small, lowering logged R by less than 0.02. This result -- possibly explained by inadequate compliance, improper mask wearing and the fact that many infections take place in family settings where masks are impractical -- is consistent with the recent review of about 50 studies, referred to above, that concluded the use of facial coverings in the community have a “small to moderate effect” in preventing the spread of COVID-19 (ECDC, 2021). The most stringent interventions to protect the elderly, involving prohibiting all non-essential visitors from LTCFs, are found to reduce the spread of the virus, but the effects are relatively small, reducing logged R by about 0.04. However, this understates the importance of such measures given that the elderly are much more vulnerable to serious illness once infected. Vaccination is found to reduce the reproduction number substantially. The percentage of the population having received either one or two doses of vaccine enters the equation with a lag of four weeks, to account for the gradual build-up of immunity after vaccination. The estimated coefficients imply that each percentage point of the total population that is fully vaccinated lowers logged R by 0.018. Hence, fully vaccinating only 7% of the population reduces logged R by the same amount as closing down schools and fully vaccinating 20% of the population is as powerful as closing all-but-essential workplaces and public transport (Figure 53). Once 60% of the population has received two doses, as in Israel at the end of May 2021, then logged R is reduced by about 1.1. The results imply that two doses are much more effective at reducing transmission than a single dose, but the second-dose effect may also include some delayed immunity from the first dose. Figure 53. The powerful effect of vaccination Equivalency between estimated effects of selected containment policies and percentage of population fully vaccinated Note: The figure is based on the coefficient estimates reported in Table 3. 4.3. Non-policy effects: Awareness of the virus and transition towards herd immunity Voluntary social distancing and increased personal hygiene measures, such as increased handwashing, are important in containing the spread of the virus (Caselli et al., 2020). In some cases, voluntary behavioural changes preceded the implementation of containment measures (Audirac et al., 2020) and in some cases their effects might even have been superior to those of official containment policies (Berlemann and Haustein, 2020; Goolsbee and Syverson, 2020; Gupta et al., 2021).
13
In order to capture voluntary behavioural responses, the regression analysis includes different measures
of the death rate from the virus (national and global daily deaths per million population) as proxies for
general awareness of the pandemic prompting more cautious behaviour. The importance of these
variables is that they substitute for changes in behaviour that are likely to be engendered regardless of
government-mandated restrictions.
Total national deaths attributed to the virus, expressed as a share of the population, are also separately
included as a proxy for the share of the population that has previously been infected, with the expectation
of a negative coefficient: as the share of the population that has been infected rises (and presumably
becomes immune), the speed with which the virus spreads should be reduced.
The death rate variables are statistically significant with the expected negative sign and their magnitudes
imply they can play an important role in the evolution of R.
The national daily death rate varies substantially, both across countries and over time, but for some
OECD countries it was running at well over 10 per million going into the first lockdown in March
2020 and has exceeded this threshold in some countries in recent months. At such levels, the
estimated coefficient implies precautionary behaviour to such an extent that that the reduction in R
is larger than most of the containment policies implemented in isolation (Figure 4).
The global daily death rate has exceeded 1 per million since November 2020, and the estimated
coefficient implies this would further supplement this precautionary effect by reducing logged R by
about 0.13.
The coefficient on the total national death rate (i.e. based on cumulative deaths) is surprisingly
small, implying that even in those OECD countries which have experienced the highest death rates
of over 1 000 per million population, logged R would only be reduced by about 0.1.
4.4. Non-policy effects: Seasonal conditions
The global nature of the pandemic indicates that the virus can spread all over the world irrespective of
seasonal conditions. Review papers trying to distil the several hundreds of studies analysing the potential
seasonality of Coronavirus transmission struggle to come to a clear conclusion. 9 Some evidence suggests
that increased UV light exposure bears a stronger relation to transmission than temperature or humidity
(Merow and Urban, 2020).10 For the purposes of this paper, seasonal effects (whether due to weather,
behavioural changes or other factors) are proxied by a measure of daylight hours. For the median OECD
country, the number of daylight hours varies by around seven hours between winter and summer and by
up to 13 hours in some Nordic countries such as Finland, Norway or Sweden. The estimated coefficient
implies that this would produce a seasonal variation in logged R of between 0.15 and 0.25. Climatic
variables, including temperature, were found to generate similar seasonal variation, but multicollinearity
between the different measures precludes the inclusion of more than one such variable.
9
Papers summarised in Mecenas et al. (2020) connect warm and wet weather with reduced virus transmission, the
papers reviewed in Briz-Redon and Serrano-Aroca (2020), Shakil et al. (2020) and Paraskevis et al. (2021) provide
more mixed evidence.
10
For European countries, Walrand (2021) identifies UV light as the only climatic factor explaining COVID-19
outbreaks. UV light exposure is strongly correlated with daylight hours, which determines time spent indoors and the
emergence of vitamin D deficiency, which is thought to amplify the severity of COVID-19 (Weir et al., 2020).14
4.5. Prevalence of virus variants
Relative to the original strain of the virus, to which the estimated constant assigns a basic reproduction
number (R0) of about 2.0, four variants are found to increase the effective reproduction number
substantially.
The B.1.177 variant initially expanded in Spain and spread widely across Europe via holiday travel
(Hodcroft et al., 2021). In the summer of 2020, it became the most prevalent variant in western
Europe.
The B.1.160 variant became the second most dominant variant in western Europe over the
northern-hemisphere summer of 2020, after variant B.1.177.
The B.1.258 variant first circulated widely in Ireland in August 2020 and later on in central Europe,
particularly the Czech Republic and Slovenia.
The B.1.1.7 variant, commonly referred to as the ‘UK variant’ because it appears to have arisen
and/or initially expanded in the South East of England, became the dominant variant in many
European countries during the first quarter of 2021. It has since been found throughout the world,
notably the United States where it was the most prevalent variant according to the latest data.
Each of these variants is estimated to raise the logged reproduction number by between 0.01 and 0.04 for
each percentage point of all cases sequenced attributable to it. If prevalence of the B.1.1.7 variant became
100%, for instance, then the effective reproduction number would be 2.9 instead of 2.0, a result consistent
with Davies et al. (2021), who find that the UK variant is 43% to 90% more transmissible than the original
strain of the virus. The B.1.617 (aka Indian) variant is included in the estimated equation but its impact on
the reproduction number is not statistically significant, most likely because prevalence was still very low in
most OECD countries even toward the end of the estimation period.
5. Explaining weekly GDP over the pandemic period
Estimation results suggest that six of the eight categories of containment policies have a negative short-
run effect on GDP and a fiscal stimulus variable is found to have a significant positive effect (Table 4).
Sensitivity testing suggests that there has been some decline in the (negative) GDP effects of containment
policies over time, distinguishing between the first half of 2020 and the period since then. These differences
are most significant for restrictions on gatherings and on internal movement (see the second column of
Table 4).
The sensitivity of the estimation results to different sample periods is examined by maintaining a preferred
specification estimated over the full sample period as a reference point, but then re-estimating it adding a
time dummy (taking the value of 1 after the start of July 2020) interacted with each of the containment
policy variables. Most of the interaction terms are found to be positive, although only those that are also
statistically significant are reported in the second column of Table 4. A revised (and reduced) policy effect
can then be computed over the second half of the sample by summing the coefficients estimated over the
full sample with the corresponding coefficient interacted with the period dummy variable. When a similar
procedure was followed for the R equation, it was difficult to discern any meaningful systematic pattern in
the interaction coefficients, which were more often small and statistically insignificant. So, for this reason,
it was decided to retain the R equation estimated over the full sample, not least no minimise problems of
multicollinearity.
Focussing on the effect over the last year of the most stringent application of each of the containment
policies suggests a clear ranking of policies in terms of their adverse effect on GDP, with workplace
closures having the largest effect on GDP (particularly in the extreme case of being accompanied by the15
closure of public transport), followed by stay-at-home requirements, with school closures, restrictions on
gatherings and internal movement all having a lesser, but significant, cost to GDP (Figure 6).
Table 4. The determinants of weekly GDP
Sample period: Mid-January 2020 to mid-May 2021
Interacted with
Over entire
dummy from
period
July
Dependent variable: GDP (% difference from counterfactual)
Constant -0.0109**
Containment policies
Stay-at-home requirement (=1) -0.0125**
Stay-at-home requirement (>=2) -0.0184**
Workplace closures (=1&2) -0.0159**
Workplace closures (=3) -0.0254**
School closures (=2) -0.0116**
Restrictions on gatherings (>=3) -0.0257** 0.0146**
Restrictions on internal movement (=1) -0.0231** 0.0169**
Restrictions on internal movement (=2) -0.0425** 0.0381**
Closure of public transport (=2) * Workplace closure (=3) -0.0224**
Fiscal policy controls
Structural budget balance (% of GDP) -0.0015**
Death rates (per million population)
Daily national death rate -0.0075** 0.0079**
Adjusted R-squared 0.656
Daily observations 2122
Countries covered 33
Note: The containment policy variables are based on those summarised in Table 1, but re-normalised to be (0, 1) dummy variables as described
in the main text. The notation in brackets “(=n)” after a containment policy variable denotes that the dummy variable is assigned a 1 if the original
score for that policy was equal to n, whereas the notation “(>=n)” denotes that the dummy variable is assigned a 1 if the original score for that
policy was greater than or equal to n. “**” denotes statistical significance at the 5% level. The structural budget balance variable is taken from
the OECD Economic Outlook No. 109 database at a quarterly frequency and is converted to a weekly frequency. The coefficients reported in
the second column are those that are significant when interacted with a dummy taking the value of 1 from the beginning of July 2020; the effect
of these policies from July is then estimated to be the sum of the coefficients in the two columns.
Source: Authors’ calculations.16
Figure 6. The effect of containment policies on GDP (per cent)
Maximum effect on GDP in period after July 2020
Closure of public Stay-at-home Restrictions on Restrictions on
Workplace closures transport 1 requirement School closures gatherings internal movement
0.0%
-0.5%
-1.0%
-1.5%
-2.0%
-2.5%
-3.0%
Note: The chart shows the maximum effect on GDP of different containment policies estimated for the period after July 2020.
1) The effect of full closure of public transport is estimated when implemented with full workplace closure.
Source: Authors’ calculations based on estimation results in Table 4.
Modelling the effect of international travel restrictions on GDP is more difficult because it depends not only
on restrictions imposed by the country in question, but also on the restrictions imposed on travellers by
other countries. While international travel restrictions are not included in the equation reported in Table 4,
alternative equations suggest the effect on GDP of international travel restrictions is proportional to the
importance of tourism in the country.
Fiscal measures are also found to play a role in supporting GDP through the inclusion of the structural
budget balance (expressed in per cent of GDP).11 The estimated coefficient is highly statistically significant
and implies a multiplier of about 0.2, which is consistent with much of the fiscal support having taken the
form of income support and subsidies.
6. Scenario analysis
The estimations described earlier in the paper are used to construct scenarios that illustrate the benefits
of a rapid vaccination rollout, particularly in the face of more contagious strains of the virus. The
11
The structural budget balance is a measure of the cyclically-adjusted primary fiscal balance (expressed as a
percentage of GDP) and is taken from the most recent quarterly OECD Economic Outlook database and is converted
to a weekly frequency with interpolation.17
assumptions are highly stylised, but nevertheless highlight some of the policy implications of different
speeds of vaccination rollout.
6.1. Baseline scenario prior to vaccination rollouts and new variants
An initial baseline scenario is constructed to be representative of the position of a typical OECD country
during the first quarter of 2021, before either vaccines or new variants were having any significant effect
on the spread of the virus, on the following assumptions:
Containment measures are applied at the median level of stringency observed across all OECD
countries during the first quarter of 2021. This implies maximum stringency as regards restrictions
on public events, gatherings and internal movement. It also implies some workplace closures as
well as stay-at-home requirements, partial school closures and restrictions on international travel,
although all these latter measures remain one stringency notch below the maximum specified by
the Oxford taxonomy. The overall cost of these measures to the economy is estimated to be about
5% of GDP, which corresponds roughly with the hit to GDP in the median OECD country since the
start of 2021.
All public health measures, including test and trace policies and mandating facial coverings, which
might help reduce the spread of the virus, have already been implemented and cannot be made
more effective. However, protection for the elderly remains below the maximum level of stringency,
so although there are some restrictions on visitors to long-term care facilities, these fall short of
prohibiting all non-essential visitors.
A ‘fear factor’, proxied by the global and national daily death rates (here assumed to be running at
1 per million and 2 per million, respectively), induces more cautious behaviour which further
reduces the reproduction number.
Using the estimation results described in the previous section, the reproduction number implied by the
combination of these assumptions is only just below 1.0 (equivalent to log R being below 0) as summarised
in Figure 74. The situation represented by the scenario is, however, precarious, with many factors,
including seasonal influences, having the potential to push the reproduction number above 1 and so lead
to a surge in infections.18 Figure 74. An initial baseline scenario before vaccinations and more transmissible variants Effect on the logged reproduction number R Note: The waterfall chart illustrates the component effects on logged R. The sum of the initial R0 (red bar) and the negative effects of natural caution and policies (yellow bars) give a total estimate for the logged reproduction number (green bar). The (small) negative number for the total logged R implies that R is (just) less than 1. The numbers in brackets after each containment policy (n/N) indicates that corresponding containment policy is assumed to be at stringency level n, compared to a possible maximum stringency level of N. The natural caution effect assumes a global daily death rate of 1 per million and a national daily death rate of 2 per million. Source: Authors’ calculations based on the estimation results in Table 3. 6.2. Scenario with more contagious new variant and moderate vaccination rollout The scenarios that follow build on the initial baseline scenario by considering how the situation might develop in response both to more contagious variants and the rollout of vaccination programmes. For this purpose, all scenarios assume that the so-called ‘UK variant’ becomes predominant, leading to an increase in transmissibility of the virus by 35%. If only 13% of the population have been fully vaccinated, which corresponds to the OECD median in mid-May, then vaccinations would be insufficient to keep the reproduction number below 1. Policy-makers would then face difficult choices about which containment policies to tighten further, given the raft of containment policies already implemented in the baseline scenario. In the scenario summarised in Figure 10, it is assumed that all schools are closed full-time, which would be just sufficient to keep the reproduction number below 1. Of course, there is considerable uncertainty around the parameter estimates used to construct the scenarios as well as the assumptions underlying them. On the positive side, seasonal factors for many European countries coming into summer could serve to lower the reproduction number, by approximately 15% for a central European country relative to winter. Alternatively, the test, trace and isolation policy now operating in a particular country could be more effective than captured by the average estimate for all countries over the whole pandemic period. On the other hand, a slower vaccination rollout (some OECD
19

countries had only vaccinated around 5% of the population by mid-May) or even more transmissible
variants would only exacerbate the dilemma about which containment policies to tighten; given lockdown
fatigue, policy-makers might hesitate to implement the most stringent forms of stay-at-home requirements
and the closure of all-but-essential workplaces that might then be required to keep the reproduction number
below 1 (Figure 8).

Figure 8. UK variant with limited vaccine rollout
Effect on the logged reproduction number R

Note: See the note to Figure 9. Changes relative to the baseline scenario are highlighted by the red bolded numbers.
Source: Authors’ calculations based on the estimation results in Table 3.

6.3. Scenario with more contagious new variant and faster vaccination rollout

A faster vaccine rollout would not only avoid the need to tighten containment polices, but also enable
containment policies in the baseline scenario to be progressively relaxed. For example, if 40% of the
population were fully vaccinated (which is close to the shares in the United States and United Kingdom at
end-May), then there might be no need for any stay-at-home requirements or closure of workplaces and
restrictions on gatherings could start to be relaxed, which would raise GDP by 4% relative to the baseline
scenario (Figure 9).
20

Figure 9. UK variant with quick vaccine rollout
Effect on the logged reproduction number R

Note: See the note to Figure 9. Changes relative to the previous scenario illustrated in Figure 10 are highlighted by the red bolded numbers, in
addition there is no need for stay-at-home requirements and closure of workplaces, which are consequently excluded from the chart
Source: Authors’ calculations based on the estimation results in Table 3.

6.4. Scenario with comprehensive vaccination rollout

The estimates also suggest that, in the absence of any supporting measures, roughly 70% of the population
would need to be vaccinated to ensure the reproduction number remains below 1 (Figure 10). While much
of the focus has recently been on the speed with which vaccines have been rolled out, achieving such a
high overall level of vaccination is likely to be a challenge in many countries, given that some vulnerable
groups (such as young children) will not be vaccinated and given the observed slowdown in take-up when
vaccination rates reach high levels. Moreover, if other more transmissible variants of the virus become
predominant, then the overall required level of vaccination would rise further. This suggests that in some
countries, it may be necessary to continue with some public health measures and limited containment
measures over the longer term even after large shares of the population have been fully vaccinated.
Finally, it is important that policy-makers are not complacent over the summer as seasonal factors may
temporarily contribute to suppressing the reproduction rate and so reduce the urgency to rollout
vaccinations. For example, for a typical Central European country, seasonal factors could lower the
reproduction rate by about 15%, which would mean that it could be kept below 1 with about 10 percentage
points less of the population vaccinated. However, without further progress in vaccination, there could be
a subsequent surge in the virus as seasonal factors reverse.
21

Figure 10. Comprehensive vaccination rollout
Effect on the logged reproduction number R

Note: See the note to Figure 9. Changes relative to the previous scenario are highlighted by the red bolded numbers.
Source: Authors’ calculations based on the estimation results in Table 3.

7. Conclusions

This paper analysed empirically the impact of policies on the reproduction rate and the OECD Weekly
GDP Tracker using high-frequency data for a set of OECD countries, based on which scenario analysis is
carried out. The main findings of the paper can be summarised as follows.
First, some new variants of the virus are estimated to be able to boost the effective reproduction number
by up to 50%. Seasonal effects are also found to increase the effective reproduction number in fall/winter,
in some countries by up to 25% relative to summer. The rapidity of these adverse shocks represent a major
challenge to policy-makers because they can coincide and take full effect over a matter of a few months.
The two effects together can potentially boost reproduction numbers by up to 90%.
Second, vaccination is found to powerfully reduce the spread of the virus. Using the estimated equation,
the effects can be stated in intervention-equivalent terms. Fully vaccinating…
          o    7% of the population is equivalent to either complete school closure, requiring people not to
               leave the house with minimal exceptions, or banning all public gatherings;
          o    15% of the population is equivalent to closing down all-but-essential workplaces;
          o    20% of the population is equivalent to closing down all-but-essential workplaces as well as
               public transport.
You can also read