The KOF Globalisation Index - Revisited - Savina Gygli, Florian Haelg and Jan-Egbert Sturm
←
→
Page content transcription
If your browser does not render page correctly, please read the page content below
The KOF Globalisation Index – Revisited

Savina Gygli, Florian Haelg and Jan-Egbert Sturm

KOF Working Papers, No. 439, February 2018
ETH Zurich
KOF Swiss Economic Institute
LEE G 116
Leonhardstrasse 21
8092 Zurich, Switzerland

Phone +41 44 632 42 39
Fax +41 44 632 12 18
www.kof.ethz.ch
kof@kof.ethz.ch
The KOF Globalisation Index – Revisited∗
          Savina Gyglia, Florian Haelgb and Jan-Egbert Sturmb,c

                                   This version: February, 2018

                                     a
                                         SNB, Zurich, Switzerland
                  b
                      KOF Swiss Economic Institute, ETH Zurich, Switzerland
                                     c
                                         CESifo Munich, Germany

Abstract: In this paper we present and describe the revised version of the KOF
Globalisation Index, a composite index measuring globalisation for every country in the
world along the economic, social and political dimension. The original index was
introduced by Dreher (2006) and updated in Dreher et al. (2008). This second revision of
the index introduces the differentiation between de facto and de jure measures along the
different dimensions of globalisation, the differentiation between trade and financial
globalisation within the economic dimension of globalisation and time-varying weighting
of the variables entering the index. Finally, the revised version incorporates several
additional variables in the construction process. At the aggregate level, we show that a bi-
directional relationship between de facto and de jure globalisation exists.
The KOF Globalisation Index can be downloaded from http://www.kof.ethz.ch/globalisation/.

JEL classification: F15, F36, F43, F53, F60, F62, O19, O24, O57, Y10.
Keywords: Globalisation, composite indicators, Granger causality, economic growth

∗ Corresponding author: Florian Haelg, haelg@kof.ethz.ch, KOF Swiss Economic Institute, ETH Zurich,

Leonhardstrasse 21, 8092 Zurich, Switzerland. We thank Dennis Quinn and Stefan Sperlich for valuable
discussions and Axel Dreher and Niklas Potrafke for comments on a previous version of this paper. This paper
was written while Savina Gygli was working at KOF. The views expressed are those of the authors and do not
necessarily reflect those of the SNB. The usual disclaimer applies.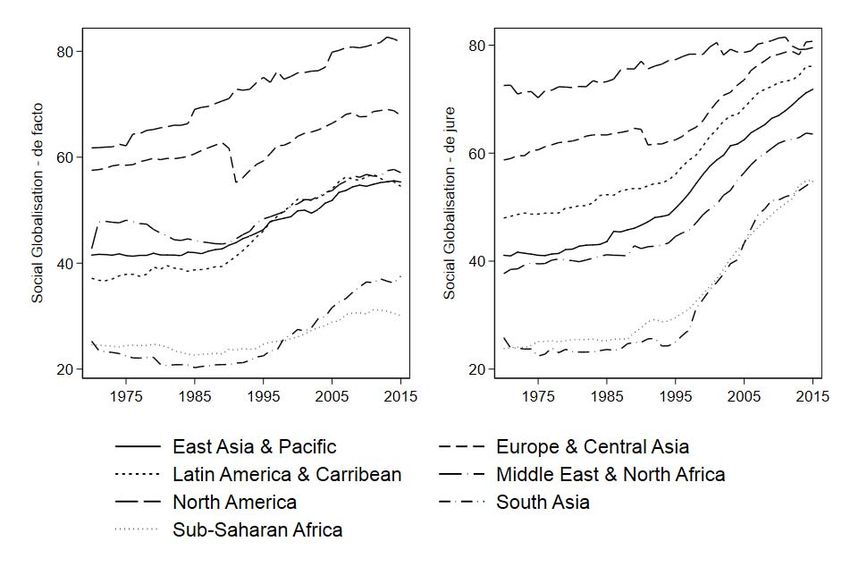
1. Introduction
The impact of globalisation on different aspects of our daily lives is still a very hotly debated
topic. In order to analyse questions related to globalisation more analytically, we need to
measure globalisation. Single indicators, often reflecting openness, such as trade as a
percentage of GDP, are frequently used as a proxy for globalisation. However, if we understand
globalisation as a multifaceted concept, it encompasses much more than trade openness and
movements of capital. It can also manifest itself in citizens of different countries
communicating with each other and exchanging ideas and information or governments working
together to tackle political problems of global reach. Consequently, we have to find ways to
account for various manifestations of globalisation. Composite indicators, such as the KOF
Globalisation Index, present themselves as straightforward solutions because they allow to
combine different variables, measuring different aspects of globalisation, into one final index.
Several composite indicators measuring globalisation have been proposed in recent years. The
KOF Globalisation Index, introduced by Dreher (2006) and updated in Dreher et al. (2008),
measures globalisation along the economic, social and political dimension for almost every
country in the world since 1970. It has become the most widely used globalisation index in the
literature (Potrafke, 2015).
Inherent to composite indicators is the danger of oversimplification, which could result in
misinterpretation of globalisation. Rather than finding one composite indicator based on the
widest definition possible, we propose an index that allows for flexible aggregation of different
dimensions and characteristics of globalisation. The revised version of the KOF Globalisation
Index introduces a clear distinction between de facto and de jure measures of globalisation.
While de facto measures of globalisation include variables that represent flows and activities,
de jure measures include variables that represent policies that, in principle, enable flows and
activities. Quinn et al. (2011) for example show that the decision to use either de facto or de
jure measures of financial openness results in systematically different findings in the financial
openness-economic growth nexus. We do not only propose a separate de facto and de jure
globalisation index, the distinction between de facto and de jure is also maintained in every
dimension and sub-dimension of the index. The overall KOF Globalisation Index is calculated
by combining de facto and de jure indices. The wide set of globalisation indices of different
dimensions and aggregation levels makes the index applicable in a large number of different
settings. At the same time, researchers still have the possibility to use an overall index of
globalisation in which all dimensions and characteristics play their role. For an overview of the
structure of the revised KOF Globalisation Index, see Table 1.
[Insert Table 1: Structure of the KOF Globalisation Index about here]
Besides distinguishing between de facto and de jure indices of globalisation, the revision of the
KOF Globalisation Index includes the following components: We introduce the differentiation
between trade and financial globalisation within the economic dimension of globalisation, we
allow the weights of the underlying variables to vary over time and we define cultural
globalisation in a broader way. While some variables from the 2007 version of the KOF
Globalisation Index are replaced, many new variables, especially measuring de jure
characteristics of globalisation, are introduced. The total number of underlying variables
increases from 23 to 42 compared to the previous version of the index.
This paper is structured as follows. In Section 2, we define globalisation as we want to measure
it and review the literature that has evolved around the measurement of globalisation by the
means of composite indicators. In Section 3, we describe the methodology of the revisited KOF
Globalisation Index, which includes the content of the current revision, the selection of
variables and the method of calculation. In Section 4, we discuss first results, which includes
the comparison between the previous and the revisited version of the index and the empirical
relationship between de facto and de jure globalisation indices. Finally, Section 5 concludes.

2. Measuring globalisation
2.1 Defining globalisation
In order to construct a composite indicator measuring globalisation, a clear definition of
globalisation is needed. Our definition of globalisation stems from Dreher (2006) and is based
on Clark (2000) and Norris (2000). The definition states that globalisation describes the process
of creating networks of connections among actors at intra- or multi-continental distances,
mediated through a variety of flows including people, information and ideas, capital, and
goods. Globalisation is a process that erodes national boundaries, integrates national
economies, cultures, technologies and governance, and produces complex relations of mutual
interdependence. To guide our decision in terms of structuring the KOF Globalisation Index,
we draw on the work of Nye and Keohane (2000) who divide globalisation in three different
dimensions. Economic globalisation characterises long distance flows of goods, capital and
services as well as information and perceptions that accompany market exchanges. Social
globalisation expresses the spread of ideas, information, images and people. Political
globalisation characterises the diffusion of government policies.
According to Scholte (2008) and Caselli (2012) globalisation is distinct to similar concepts
such as internationalisation, liberalisation, universalisation or Westernisation. These concepts
are however close to each other and sometimes used interchangeably. A clear distinction is
therefore needed but sometimes difficult to achieve. Based on Scholte (2008)
internationalisation refers to an increase in transactions and interdependencies between
countries. Liberalisation denotes the process of removing officially imposed restrictions on
movements of resources between countries. Universalisation describes the process of
dispersing various objects and experiences to people at all inhibited parts of the earth.
Westernisation is interpreted as a particular type of universalisation, in which social structures
of Western societies are spread across the earth. According to Scholte (2008) globalisation is
the spread of trans-planetary of supra-territorial connections between people. What
distinguishes it from the aforementioned concepts is the relation to space. Globalisation is a
supra-territorial or a multi-continental concept, as it is defined in Clark (2000) and Norris
(2000). While Scholte (2008) perceives the differentiation as essential, Figge and Martens
(2014), on the contrary, argue that a distinction of all these concepts is not needed, when a
pluralistic and multiscale definition of globalisation is employed.

2.2 Literature and critique
Previous measures of globalisation
The construction of comprehensive composite indicators measuring a multifaceted concept of
globalisation has flourished during the last two decades (for an overview of some of the most
popular globalisation indices, see Table 2). The A.T. Kearney/Foreign Policy Globalisation
Index (ATK/FP) was one of the first globalisation index, launched in 2001 and continued until
2006, and has served as a prototype for many later indices. Influenced by the ATK/FP Index,
the KOF Globalisation Index followed in 2002 and was updated in 2007 (Dreher, 2006 and
Dreher et al, 2008). The Center for the Study of Globalisation and Regionalisation (CSGR) at
the University of Warwick produced a globalisation index for the years 1982-2004, measuring
the economic, social and political dimension of globalisation using 16 different variables and
determining the weights by the means of principal components (Lockwood and Redoano,
2005). A distinguishing feature of the CSGR is that variables measuring openness are adjusted
for country characteristics such as initial population size, land area and whether a country is
landlocked or not. The GlobalIndex attempted to better include the sociological concept of
globalisation by extending the cultural dimension of globalisation with variables related to the
international convergence of norms and values (Raab et al., 2008). The Maastricht
Globalisation Index (MGI) included the environmental dimension in their index, represented
by the ecological footprint of exports and imports as a share of bio capacity (Figge and Martens,
2014). The New Globalisation Index (NGI) introduced distance weighting of some of the
variables to better distinguish globalisation from regionalisation (Vujakovic, 2010). More
recently, the DHL Connectedness Index, measuring connectedness rather than globalisation,
has been proposed (Ghemawat and Altman, 2016). It distinguishes between depth and breadth
of integration along the different dimensions of globalisation.
[Insert Table 2: Globalisation Indices - Overview and main characteristics about here]
The KOF Globalisation Index is the most heavily adopted and cited globalisation index in the
literature. It encompasses a large panel dataset including over 200 countries and territories and
spans from 1970-2015. The data is easily accessible and a yearly update includes adding an
additional year.1 Potrafke (2015) reviews 120 more recent empirical studies that use the 2007
version of the KOF Globalisation Index in their empirical specifications.
As the number of globalisation measures has flourished in the last two decades, so did the
literature discussing the appropriate definition of globalisation and features that have to be
accounted for when measuring globalisation.2 In the following, we discuss different topics
concerning the measurement of globalisation defined by Martens et al. (2015), which guides
us in the construction of the revised KOF Globalisation Index: (i) the focus of measurement,
(ii) the unit of measurement, (iii) the dimensions of globalisation, (v) the differentiation
between globalisation and regionalisation, (vi) the transformation of variables in the light of
country specific factors and (vii) the comparison of countries with different development status.

Focus of measurement: Activities or policies
Globalisation indices and similar composite indicators can be distinguished by their focus of
measurement, which can be de facto or de jure measures, also labelled as activities and policies
or output and input measures. While de facto measures include variables that represent actual
flows or activities, de jure measures include variables representing policies, resources or
institutions enabling or facilitating actual flows and activities. According to Lombaerde and
Iapadre (2008) and Martens et al. (2015) it is advisable that a composite index only consists of
variables from one focus of measurement to maintain a clear distinction between the de facto
and de jure globalisation. When analysing the relationship between financial openness and
economic growth, Quinn et al. (2011) show that the choice of financial openness indicators has
a crucial impact on the results. The findings especially depend on whether a de facto or de jure
measure of financial openness is chosen. As Kose et al., 2009 point out, de facto and de jure
measures can differ substantially, when for example a policy is strict on paper, but toothless in
practice.
Most globalisation indices focus on de facto globalisation. Exceptions are the 2007 version of
the KOF Globalisation Index and the GlobalIndex by Raab et al. (2008) which combines
variables representing de facto and de jure measures within the economic dimension, making
them hybrid indices. The 2007 version of the KOF Globalisation Index for example, includes
the sub-dimension actual flows, a de facto measure, which contains variables of trade and
capital flows and the sub-dimension restrictions, a de jure measure, which contains variables
on hidden import barriers and tariff rates. In the revised KOF Globalisation Index, we propose
a rigorous distinction between de facto and de jure measures of globalisation in all dimensions

1
    The KOF Globalisation Index can be downloaded from http://www.kof.ethz.ch/globalisation.
2
 See among others: Dreher et al. (2008), Dreher et al. (2010), OECD (2010), Caselli (2012) and Martens et al.
(2015).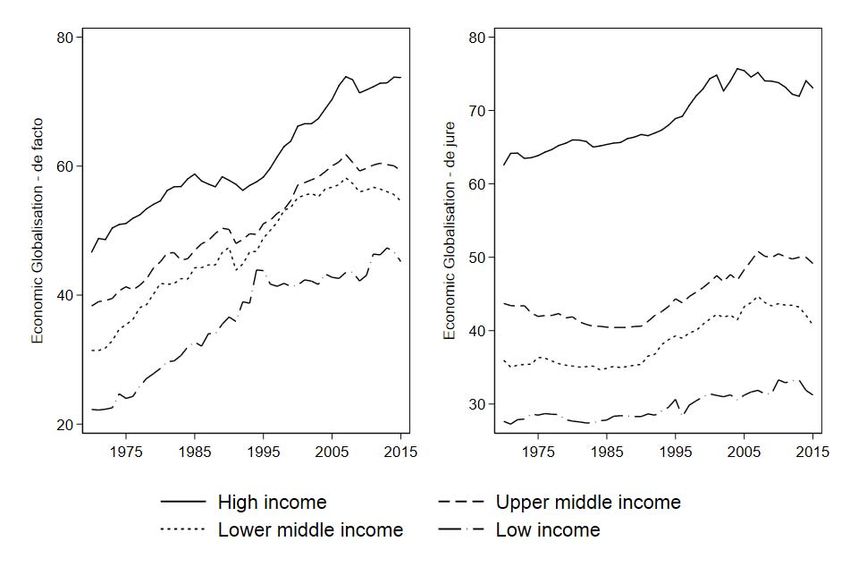
and sub-dimensions of the index. This allows researchers to compare different outcomes of de
facto and de jure globalisation and the relationship between the two measures.

Unit of measurement: National, subnational, individual
The KOF Globalisation Index focuses, as most other globalisation indices, on measuring
globalisation at the international level. Caselli (2012) advocates extending this perspective by
considering further units of measurement as exchanges at multi-continental distances not only
take place at the national level. Moreover, concentrating on the national perspective conflicts
with the notion that globalisation erodes national borders, reducing the importance of nation
states. Given the distinct feature of globalisation being its supra-territoriality, as opposed to
internationalisation, Scholte (2008) raises the question on how we can justify the use of the
nation state as the main unit of measurement. In the light of this discussion, indices that depart
from the perspective of nation states have been proposed, such as the Person-Based
Globalisation Index (PBGI) by Caselli (2012) and the Global Cities Index (GCI) by A.T.
Kearney. They provide new perspectives and additional insights to the multidimensional
concept of globalisation. However, no index so far reasonably combines different units of
measurement. Caselli (2013) concludes that composited indices with different unit of
measurement should be used side by side rather than be combined.

Dimensions of Globalisation: Economic, social and political dimensions
The KOF Globalisation Index identifies three dimensions of globalisation: Economic, social
and political. Economic globalisation is subdivided into trade and financial globalisation.
Social globalisation is subdivided into interpersonal, information and cultural globalisation.
Figge and Martens (2014) propose two additional dimensions in the Maastricht Globalisation
Index, which are technological and ecological globalisation. While technological globalisation
includes measures of communication technology that overlap with the social dimension of the
KOF Globalisation Index, the ecological dimension is a distinct feature of the Maastricht
Globalisation Index.
The definition of cultural globalisation in the KOF Globalisation Index goes back to Saich
(2000) and Rosendorf (2000), stating that cultural globalisation can be understood as the
dispersion of American values. However, Raab et al. (2008), Dreher et al. (2010) and Martens
et al. (2015) perceive current attempts to measure cultural globalisation as being too much
focused on Western cultural peculiarities and its global spread. Raab et al. (2008) take a more
refined look at cultural globalisation, trying to abstain from focusing too much on Western
culture. Following the literature in sociology on international cultural diffusion, Raab et al.
(2008) include additional variables measuring the spread of values and standards of rationalism
around the world. They interpret the diffusion of such values as clear signs of globalisation in
cultural affairs. Kluver and Fu (2004) use as proxy for cultural globalisation three media related
variables, which they combine to one composite index, in form of a Herfindahl-Hirschman
index. They justify the usage of those variables by pointing out that the international media has
a more lasting impact on citizens thinking than the presence of fast food restaurants or
international brands.
Transmission of cultural values is closely related to sharing cultural goods and services such
as movies and TV series, music and other works of art across borders. Studies analysing
cultural assimilation and its consequences therefore use direct measures of these cultural goods
and services to proxy cultural proximity. Disdier et al. (2010) analyse bilateral trade in cultural
goods and use it as a proxy for countries’ cultural proximity. UNESCO (2009) has classified
cultural goods for such purposes. In recent years, many cultural goods such as music recordings
and movies initially provided physically have become digital, which has shifted the focus to
trade in cultural services. Hellmanzik and Schmitz (2015) study trade in audio-visual services
and relate it to a new proxy for cultural proximity based on bilateral hyperlinks and bilateral
website visits.

Globalisation versus Regionalism: Accounting for distances, intensities and
networks
When measuring globalisation, most indices do not account for distances, intensities or
network sizes, which leads to the criticism that globalisation cannot be distinguished from
concepts such as openness or regionalism (Vujakovic, 2010; Martens et al., 2015). A typical
example is the variable trade, which usually is employed as sum of total exports and imports
in percent of GDP. According to Vujakovic (2010), trade that encompasses global distances
and trade that takes place between neighbouring countries cannot be treated equally. While the
former is an indication of globalisation, the second rather depicts regionalism. Vujakovic
(2010) proposes to weight trade data with the bilateral distance between the capital cities to
correct for these shortcomings. Greater distances lead to higher weighted trade, which indicates
a higher degree of globalisation. The DHL Connectedness Index is a more recent attempt to
account for the notion of creating networks in the definition of globalisation (Ghemawat and
Altman, 2016). The DHL Connectedness Index defines globalisation as the concentration of
relationships across borders. Countries maintaining smaller numbers of international
connections are assigned lower levels of globalisation than countries that maintain connections
with many partners, independent of locations or distances.
Babones and Farabee-siers (2008), Lombaerde and Iapadre (2008) and OECD (2010) propose
another concept, which is to include variables that indicate a country’s trade partner
concentration as a proxy for the trade partner network. In this line, we include the inverse of
the Herfindahl-Hirschmann concentration index for a country’s exports and imports as
additional variable in the revised KOF Globalisation Index. A country is assigned higher values
if its trade is more equally distributed across trade partners. On the contrary, countries whose
trade structure is heavily skewed towards a few trade partners, an indication of regional
integration, are assigned lower values in this variable.

Transformation of variables: Shall we account for country specific factors?
The outcome of many variables, in particular most de facto variables, is influenced by a variety
of exogenous and country specific factors. Larger countries for example exhibit higher trade
volumes in absolute terms. Landlocked countries are less integrated in world markets than
countries with access to the sea due to higher transport costs. Hence, constructing a
globalisation index includes deciding on how to deal with the influence of such exogenous
factors. The 2007 version of the KOF Globalisation Index accounts for the size of an economy
or a country by dividing variables by GDP or population size. This procedure is maintained in
the revised version of our index. Lockwood (2004) proposes a more rigorous way of controlling
for geographical characteristics of a country. His correction consists of regressing each variable
on a set of exogenous factors such as population, land area and whether a country is landlocked
or not. The residuals of such regressions, which describe the difference between the predicted
value based on geographical characteristics and the actual value of the variable, are included
in the index. Lockwood and Redoano (2005) use this technique to transform all economic
variables related to openness in the CSGR Globalisation Index. Vujakovic (2010) goes even
further and transforms the majority of variables included in her globalisation index in such a
way. She shows that this procedure favours bigger countries, giving them higher levels of
globalisation than they would have had otherwise. However, it goes beyond the treatment of
variables that is suggested by the definition of globalisation in Clark (2000), Norris (2000) and
Nye and Keohane (2000). These authors describe globalisation as a process that connects
actors, which does not call for more than a correction of size effects.

Comparison of countries of different development status
Ebenthal (2007) worries about the ability of single indices to assess globalisation appropriately
for all countries in the world at the same time. Disregarding completely any level of
development is, from his point of view, handicapping less developed countries. Ebenthal
(2007) points out that one should not focus too much on variables that measure recent
technological developments. Instead, one should continue considering variables that measure
older technologies because they are still heavily used in developing countries. An additional
criticism of his concerns the procedure with which the weights of the different variables are
determined. By not considering differences in development status, developing countries once
more start from a suboptimal position. He speaks in favour of performing more than one
principle component analysis for different groups of countries, which are formed according to
their development status.
3. The KOF Globalisation Index revisited
3.1 Content of revision
Distinction between de facto and de jure globalisation
The revisited KOF Globalisation Index introduces a rigorous distinction between de facto and
de jure measures of globalisation. As aforementioned, Martens et al. (2015) do not recommend
combining both de facto and de jure measures of economic globalisation within one index, due
to its potential distorting effects in later applications. Quinn et al. (2011) show that de jure and
de facto indicators yield systematically different results when the effect of financial
globalisation on GDP growth is analysed. This is because de jure indices of financial
globalisation do not reflect the extent to which actual capital flows evolve in response to legal
restrictions. We propose a new structure for the revised KOF Globalisation Index, which
introduces the differentiation between de facto and de jure globalisation at every dimension
and at every level of the index. In this structure, we calculate a separate index for de facto and
de jure economic, social and political globalisation. On the sub-dimensional level a separate
index for de facto and de jure trade, financial, interpersonal, informational and cultural
globalisation is calculated. All of those indices are published, which makes the index and its
sub-indices applicable in a wide range of empirical settings. We acknowledge that some
variables in the 2007 version of the KOF Globalisation Index do not measure international
flows but rather the possibility for information exchange between international actors. These
variables include access to television and internet and are reclassified as de jure indicators in
the revised KOF Globalisation Index. Besides reclassifying some variables from the 2007
version of the index, many new variables, especially measuring de jure globalisation, are
introduced.

Differentiation between trade and financial globalisation
The economic dimension of the revised KOF Globalisation Index consists of the two sub-
dimensions, trade globalisation and financial globalisation. Differentiating between these two
dimensions of economic globalisation is a key advantage over the 2007 version of the KOF
Globalisation Index and other globalisation indices. The distinction between trade and financial
liberalisation has already been exploited in the literature. Jaumotte et al. (2013) for example
study the effect of trade and financial globalisation on the income distribution within a country
and find that whereas trade globalisation is associated with a reduction in inequality, financial
globalisation is associated with an increase in inequality. In a study on the negative relationship
between output volatility and growth, Kose et al. (2009) find that both trade and financial
globalisation reduces this negative relationship, although the effect tends to be stronger for
trade globalisation. Several strands of literature have also documented that trade and financial
globalisation go hand in hand (see, for example, Lane and Milesi-Ferretti, 2008).

Measuring cultural globalisation more broadly
Another feature of the revised KOF Globalisation Index is an attempt to define and measure
cultural globalisation more broadly. This is done by including more variables that do not rely
on particular value concepts. The original selection of variables in the 2002 version of the KOF
Globalisation Index built on an understanding of cultural globalisation based on Saich (2000),
which defines modern cultural globalisation largely as the dispersion of American values. It
was measured by including the number of McDonald’s restaurants in a country. The focus on
American values was somewhat relaxed in the 2007 version of the index by including the
number of IKEA stores and trade in books as additional variables to the index. Nevertheless,
as discussed above, the KOF Globalisation Index is still subject to the critique that it rather
measures Westernisation than cultural globalisation in general. In the revised version of the
KOF Globalisation Index, we include three additional de facto variables measuring cultural
globalisation, of which none relies on a particular value concept. These variables measure trade
in cultural goods, trademark applications of non-residents and trade in personal services. The
variables McDonald’s restaurants and IKEA stores are still included in the index.

Time-varying weights for the aggregation
The revised KOF Globalisation Index includes time-varying weighting of the individual
variables in the aggregation process. As in the 2007 version of the KOF Globalisation Index,
we use principle component analysis to determine the weights of the individual variables for
the lowest aggregation level of the index. However, we no longer use all years to determine the
weights, but apply principal component analysis on rolling windows of 10 years instead to
calculate time-varying weights. This procedure has the advantage of letting the weights adjust
over the years to account for changes in the role of certain variables in serving as proxies for
globalisation.

Reevaluate variables
In order to emphasize globalisation as being a process of creating global networks, we include
two additional variables that do not only measure the manifestation of an outcome of
globalisation itself, but also quantify the creation of networks. Those variables measure trade
partner diversification in the sub-dimension trade globalisation and number of partners in
investment treaties in the dimension political globalisation. In this way, we account for the
point of view that globalisation also has a spatial dimension as put forward by Babones and
Farabee-siers (2008), Vujakovic (2010) and Ghemawat and Altman (2016).
A final part of the revision consists of reassessing the ability of some variables contained in the
2007 version of the KOF Globalisation Index to measure flows of information and
communication over the entire time span. In particular, variables in the 2007 version of the
index such as international letters, trade in newspapers and trade in books are heavily affected
by the digitalisation and the internet and are gradually replaced by different channels of
information exchanges. Ideally, we would include variables measuring those new channels
alongside with the variables measuring the traditional channels to capture some of the
substitution between the two variables over the time span. However, in cases where no
measures for those new means of communication are readily available for a large number of
countries, we remove some of the old variables from the index. Keeping them in the index
delivers the impression, that social globalisation is decreasing, while in fact only the means of
communication are changing.

3.2 Data selection
KOF de facto Economic Globalisation
KOF Trade Globalisation. The sub-dimension trade globalisation includes variables that
measure the exchange of goods and services over long distances. We use the sum of exports
and imports of goods as a share of GDP, the sum of exports and imports of services as a share
of GDP and a variable that measures trade partner diversification in goods trade. Trade partner
diversification is computed as the inverse of the average Herfindahl-Hirschmann trade partner
concentration index for exports and imports of goods. Herfindahl-Hirschmann trade partner
concentration index is computed as the sum of squares of trade partner shares in exports and
imports respectively for a given country. The more dispersed the trade of a country over
different trade partner is, the higher the value in the variable. The variable therefore favours
countries whose export and import structure is globally oriented as compared to countries that
primarily trade regionally.
KOF Financial Globalisation. Financial globalisation is measured by capital flows and stocks
of foreign assets and liabilities. We thereby apply a quantity-based measure as opposed to a
price-based or news-based measure of financial globalisation (see Baele et al., 2004). As Kose
et al. (2009) point out, it is preferable to focus on the sum of stocks of foreign assets and
liabilities as opposed to flows, because it can mitigate the problem of volatility and
measurement errors in the flow variables. Based on the work of Lane and Milesi-Ferretti (2007)
we include the following variables: The sum of stocks of assets and liabilities of foreign direct
investments as a share of GDP, the sum of assets and liabilities of international equity portfolio
investments as a share of GDP, the sum of inward and outward stocks of international portfolio
debt securities and bank loans and deposits as share of GDP and international reserves
excluding gold as a share of GDP. As only flow variable, we include the sum of primary income
payments and receipts as a share of GDP. It comprises earnings and payments arising mainly
from the cross-border provision of labour and capital. For the historical values for all variables,
we rely on the updated and extended dataset External Wealth of Nations of Lane and Milesi-
Ferretti (2007), which comprises information about the composition of the international
financial position of a large sample of countries from 1970-2011. Additionally, the dataset
accounts for valuation changes.

KOF de facto Social Globalisation
KOF Interpersonal Globalisation. We measure de facto interpersonal globalisation using
four variables: International voice traffic, international financial transfers, international tourism
and the share of foreign-born persons. In the revised version international calls not only
includes incoming and outgoing calls from fixed telephone lines but also from mobile phones.
All of the variables are measured in relation to domestic population. In contrast to the 2007
version of the KOF Globalisation Index, international transfers is divided by population instead
of GDP. By following this approach, we still account for differences in country size as in
Dreher et al. (2008), but it has the advantage of not carrying over movements in GDP that are
not directly relevant for personal contacts. In that sense and in line with our definition of
globalisation, the role of actors is better highlighted in the process of creating connections.
KOF Informational Globalisation. Informational globalisation is measured by three
variables. The first two are the stock of patent applications made by non-residents and the sum
of in- and outbound international students. Both variables are proposed by OECD (2010) to
represent international flows of technology, scientific knowledge and related information and
are used in a similar fashion in Vujakovic (2010). We divide both variables by population size,
to stress the influence that foreign information has on national actors. As the variable patent
applications by non-residents proxies the inflow of information, we choose the third variable
to be export of high technology products divided by population. It serves as representation of
outward flows of technological and scientific information. Using this variable is in accordance
with the proposal of the OECD (2010) to use it as an approximation for outward directed flow
of information.
KOF Cultural Globalisation. The revised sub-dimension measuring cultural globalisation
contains the number of McDonald’s restaurants and the number of IKEA stores, as in the 2007
version. Additionally, we include the stock of trademark applications by non-residents. It is
conceptually very close to the number of McDonald’s Restaurants or IKEA stores, for they are
both registered trademarks. Yet, trademark applications do not focus on American or any other
particular culture, as all non-residents in principle have equal opportunities to register
trademarks. Following Disdier et al. (2010) and Hellmanzik and Schmitz (2015), we include
trade in cultural goods and trade in personal, cultural and recreational services as two distinct
additional variables. Both variables contain the sum of exports and imports and are calculated
in per capita terms. For the first, we employ the definition based on UNESCO (2009), which
identifies eleven groups of cultural goods. The latter is a subcomponent of the Balance of
Payments and includes for example services related to provision of cultural goods such as
production of motion pictures or musical records, organisation of sport events or operation of
museums. A substantial part of this subcomponent represents financial flows related to audio-
visual services which includes purchases and sales of mass produced recordings and
manuscripts that where downloaded.

KOF de facto Political Globalisation
Political globalisation is measured using the variables participation in UN Peacekeeping
missions and number of embassies. The presence of embassies implies foreigners acting in
their home countries’ interest. Hence, it is an indication of how much a government accepts
foreign sovereign governmental influence and resources. Additionally, we include the variable
number of NGO active in a country. Similar to an embassy, the presence of NGOs involves
presence of foreigners with political or social motives in one’s own territory, which can be
interpreted as political influence from abroad. We focus on NGOs that are declared as
internationally oriented NGOs by the Union of International Organisations.

KOF de jure Economic Globalisation
KOF Trade Globalisation. We argue that de jure trade globalisation includes policies that
impede or promote trade flows between countries. The dimension relates closely to the sub-
dimension economic restriction of the 2007 version of the KOF Globalisation Index (Dreher et
al., 2008). The first variable is called trade regulation and includes the average over two
subcomponents. The prevalence of non-tariff trade barriers, which is based on the WEF Global
Competitiveness Reports survey question: In your country, tariff and non-tariff barriers
significantly reduce the ability of imported goods to compete in the domestic market. And the
sub-component compliance costs, which is based on the World Bank’s Doing Business report.
The second variable measuring de jure trade globalisation is trade taxes, which measures the
income of taxes on international trade as a share of total income. The variables measures the
unweighted mean of tariff rates. All variables are taken from Gwartney et al. (2016).
KOF Financial Globalisation. The IMFs Annual Report on Exchange Arrangements and
Exchange Restrictions (AREAER) is the primary source for most measures of de jure financial
globalisation (see for example Quinn et al., 2011). The most widely used index based on the
AREAER reports is the Chinn-Ito index, which we include as a variable measuring de jure
financial globalisation. The Chinn-Ito index is the first principle component of the four IMF
binary variables foreign exchange regime, export proceeds, capital account and current
account, but does not bear information on the prevalence of capital controls on specific types
of flows nor information on the direction or residency. To account for additional information
in the AREAER that became available since 1995, we also include the index of Jahan and
Wang (2016) that is based on the same source, but includes a broader set of variables in the
construction. The third variable measures investment restrictions and includes measures of the
prevalence of foreign ownership and regulations to international capital flows. It is based on
the WEF Global Competitiveness Report and taken from Gwartney et al. (2016).

KOF de jure Social Globalisation
KOF Interpersonal Globalisation. Measuring de jure interpersonal globalisation, we choose
variables that are conceptually close to the ones we use for de facto interpersonal globalisation.
The first variable is the sum of mobile phone and telephones subscriptions per 100 people.
Movement of people across borders count for a substantial amount of de facto personal contact.
Including a measure that facilitate these movements, helps create a more complete picture of
de jure interpersonal globalisation. We include the number of airports hosting international
flights, published by the International Civil Aviation Organization (ICAO). Additionally, the
variable freedom of foreigners to visit is included. It is measured by the percentage of countries
for which a country requires a visa for foreign visitors and is taken from Gwartney et al. (2016).
KOF Informational Globalisation. De jure informational globalisation is measured by the
number of televisions by household and internet access per household. Furthermore, we
measure the relevance of the internet in enabling exchange of information through electronic
channels by using the maximum international internet bandwidth. It captures the maximum
capacity with which users can access information from abroad. Additionally, the press freedom
index captures the availability of news related information.3 The index aims at portraying media
independence and assessing the degree of print, broadcast, and digital media freedom.4
KOF Cultural Globalisation. Our choice of variables for this sub-dimension is inspired by the
GlobalIndex. Raab et al. (2008) justify their choice of variables by highlighting their key role
in quantifying the spread of common values of rationalism and hence cultural assimilation
across the world. With respect to our attempts to discriminate de facto and de jure globalisation,
we classify them as factors shaping openness towards other cultures. Three factors are of
particular relevance to us when it comes to the ability of understanding and accepting foreign
cultural values. We use the general government expenditure on education expressed as a
percentage of GDP as an indication of the importance of education. Schools in many countries

3
  In the KOF Globalisation Index based on Dreher et al. (2008), the variable trade in newspapers was used to
proxy information flows. Although we will not include this variable in the de facto sub index on informational
globalisation, we can proxy the availability of news related information in the de jure part.
4
  This index does not distinguish between national and international press. Hence, the validity of including the
indicator rest on the assumption that national and international media is not treated differently when it comes to
censoring.
teach foreign languages, which are needed to make international culture understandable. A
great part of today’s international culture is influenced by an egalitarian view on the role of
woman in society. Consequently, we assume that having an equally egalitarian view intensifies
cultural assimilation. As an approximation of such views, we use the gender parity index on
gross primary school enrolment. It is an indication of parity of boys and girls and as such a
strong indicator of the equality of men and women. Third, we include the civil freedom index,
an assessment of civil liberties published in the freedom of the world report. It quantifies
aspects of civil freedom such as expression and belief, associational and organisational rights,
rule of law and personal autonomy and individual rights. These and other cultural elements
determine whether citizens of a country have the possibility to get in touch with values and
beliefs, essential elements of culture, from abroad.

KOF de jure Political Globalisation
We include the number of multilateral treaties signed since 1945 and number of memberships
in international organisations as two out of three variables in the dimension of de jure political
globalisation. Both variables represent cross-border communication and meetings of
negotiators. Nevertheless, the actual intention of such actions is to influence future
relationships and therefore rather characterises the willingness of creating networks than actual
manifestation of flows. Next to the number of treaties, partner constellations are also
informative when examining the impact of a country in global politics. Having the same
number of treaties with a smaller number of partners rather reveals strong individual
relationships than willingness to create global political networks. Contrary to the first treaty
related variable, we restrict ourselves to bilateral treaties.5 There exists no conclusive collection
of bilateral treaties, however the United Nation Conference on Trade and Development
publishes data on bilateral investment treaties.6
Table 3 gives an overview of all variables that are used to construct the different dimensions
of the KOF Globalisation Index, as well as their definitions and sources.
[Insert Table 3: Overview of all variables used to construct the KOF Globalisation Indices
about here]

5
  We do so to not unwillingly reward free-rider behaviour. We assume that the successful negotiation of a bilateral
treaty tells us that each party was actively involved, whereas the same cannot be assumed to be necessary in case
of multilateral treaties.
6
  Since each pair of countries only forms one contract, we can simply count the number of bilateral investment
treaties a country has to arrive at the equivalent of a concentration measure.
3.3 Method of calculation
The revised version of the KOF Globalisation Index is based on 42 individual variables, which
are aggregated to a de facto and a de jure index of five sub-dimensions (trade, financial,
interpersonal, informational and cultural globalisation), three dimensions (economic, social
and political globalisation) and one total index. We can thus differentiate between as many as
eighteen different indices if we maintain the distinction between de facto and de jure. We also
report an overall index for the total and each of the three dimensions, which is calculated as the
average of the de facto and the de jure index. This increases the total number of indices to
twenty-two. Besides the selection of variables, which is described in Section 3.2, the
construction of the KOF Globalisation Index includes the following steps.

Imputation of missing data
The KOF Globalisation Index is calculated on a yearly basis from 1970 to 2015 and for a
maximum number of 209 countries and territories. The selection of countries and territories
relies on the definitions by the World Bank. However, not all variables are available for all
countries and years. Missing observations within a series are imputed using linear interpolation.
Missing observations at the beginning or the end of a series are substituted by the closest
observation available. Specifically, this implies that we carry the last non-missing observation
backwards in the case of missing observations at the beginning of a series and forward in the
case of missing observations at the end of a series. Table 4 displays the data coverage for the
different variables and selected years before imputation by displaying the share of non-missing
observations in percent. Data coverage increases for most variables over the time horizon from
on average of 34 percent in 1970 to 71.3 percent in 2015.
[Insert Table 4: Coverage ratios of variables for selected years (in percent) about here]

Normalisation of the data
Normalising the data implies that each variable is transformed to an index with a scale from
one to one hundred, where one hundred is assigned to the observation with the highest value
of the whole sample of countries and the entire period of time. The remaining observations are
ranked according to the percentiles of the distribution. This procedure is called panel
normalisation, which is different to annual normalisation, where observations are normalised
over given year only. The resulting data is well-behaved in terms of sensitivity to outliers,
which is a clear advantage over the original series. The downside is that changes in the data in
any year possibly affect the index value of countries in all years.
Determining the weights
We perform principal components analysis on a 10-year rolling window to determine time-
varying weights for the individual variables. This means that we use observations for t-10 until
t-1 to compute the weights for time t. The weights for the years 1970 to 1979 are set equal the
weights of the year 1980, given the shorter time window. Principal components analysis
partitions the variance of the variables used in each sub-group and the weights are determined
in a way that maximises the variation of the resulting principal component. We calculate the
weights using the entire sample of countries at the same time. By applying time-varying
weights as opposed to fixed weights determined over all years, we are able to adapt to changes
in the relevance of certain variables to capture globalisation over time. Table 5 displays time-
varying weights of the variables in the lowest aggregation level for selected years.
While the weights of individual variables vary over years, the weights of the sub-indices are
determined by giving equal weights to each component and are held fixed over the time
horizon. Economic globalisation is sub-divided into trade and financial globalisation, both of
which receive a weight of 50 percent within the economic dimension. Social globalisation
consists of interpersonal, informational and cultural globalisation, each of them contributing a
third to the social globalisation index. Economic, social and political globalisation are
aggregated to the Globalisation Index using again equal weights. The overall globalisation
indices are calculated as the average of the de facto and the de jure indices. Table 1 shows the
weights of the different levels of the indices in the aggregation process.

Aggregation to indices
Once the weights are determined, the aggregation consists of adding up individual weighted
variables to the desired level of aggregation. Each aggregation level is calculated from the
individual variables instead of using the aggregated lower-level indices. This procedure has the
advantage that variables can be used in higher aggregation levels of the index, even if the value
of a sub-index is not reported due to missing data. Observations of indices are reported as
missing if more than 40 percent of the underlying variables are missing or at least two out of
three sub-indices cannot be calculated.

4. Resulting KOF Globalisation Indices
4.1 World averages
Since there is no reference series with which we can assess the appropriateness of the revised
KOF Globalisation Index, we compare the revised 2018 version with the 2007 version of the
KOF Globalisation Index. For that purpose, we recalculate the 2007 version with the most
recent data. Ultimately, our perception of globalisation did not change and the outcome of the
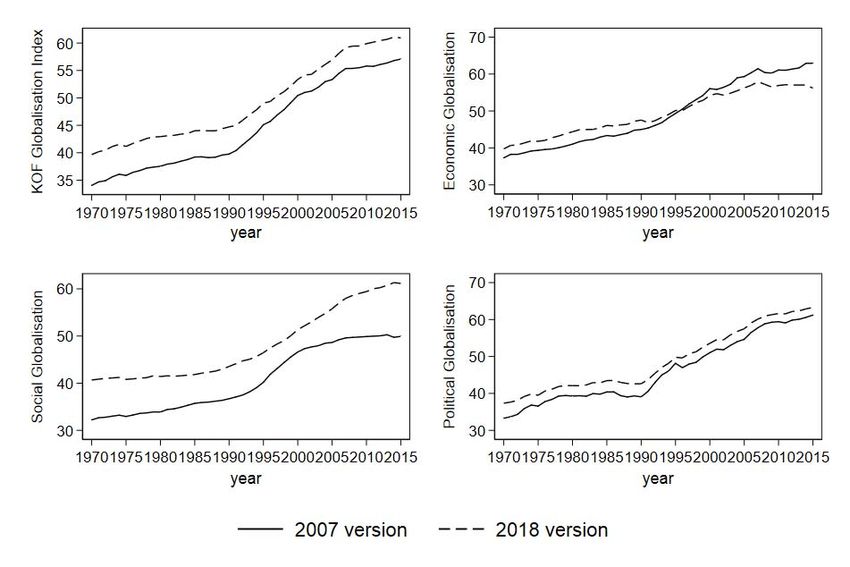
two indices should therefore be comparable.
Figure 1 is a combination of four graphs, where each of them allows comparing the evolution
of world globalisation and its dimensions according to the 2018 and 2007 version of the KOF
Globalisation Index. We calculate the world globalisation and its dimension as the unweighted
average over all countries. The upper left panel shows the overall KOF Globalisation Index
computed by the two different versions. Both lines represent the evolution of worldwide
globalisation over time. While the 2018 version shows a much higher level of globalisation
than the 2007 version, the two series exhibit very similar movements over time. According to
both measures, globalisation increases most strongly between 1990 and 2007, but levels off
afterwards.
[Insert Figure 1: KOF Globalisation Index - 2007 Version vs. 2018 Version about here]
The remaining three panels show the evolution of economic, social and political globalisation
respectively, measured by the two different versions of the KOF Globalisation Index. We
observe that, at least at the world level, there are no fundamental differences in the
measurement of globalisation arising between the two versions. There are however some
smaller differences, arising from the revised calculation method and new variables.
Measuring economic globalisation, the increase in globalisation between 1990 until the onset
of the financial crisis 2007 is less pronounced in the 2018 version than in the 2007 version of
the KOF Globalisation Index. The reason being that economic globalisation in the 2018 version
contains more variables reflecting de jure economic globalisation than in the previous version.
In particular, de jure financial globalisation did not keep up with progresses in de facto financial
globalisation. Measuring social globalisation, the revised version exhibits much higher levels
of globalisation on the world level, after all, social globalisation is the dimension where the
KOF Globalisation Index has been modified the most. Additionally, compared to the revised
version of the index, social globalisation remains flat after 2000 in the 2007 version. Given
many numerous modern channels of international communication, some older variables are
dropped or replaced from the index. Political globalisation shows the smallest differences
between the two versions.
To see how the two versions compare in individual years, we examine overlap statistics of the
rankings of countries in our index. These statistics are an indication of similarity in the sense
that they specify the share of identical countries within the same range in both rankings.7 It
does however not make a statement about the similarity of the exact ordering of the countries.
The overlap statistics of the comparison of the country rankings of the 2007 and the 2018

7
 For each comparison, we concentrate on the subsample of countries that are present in both rankings and have
positive index values.
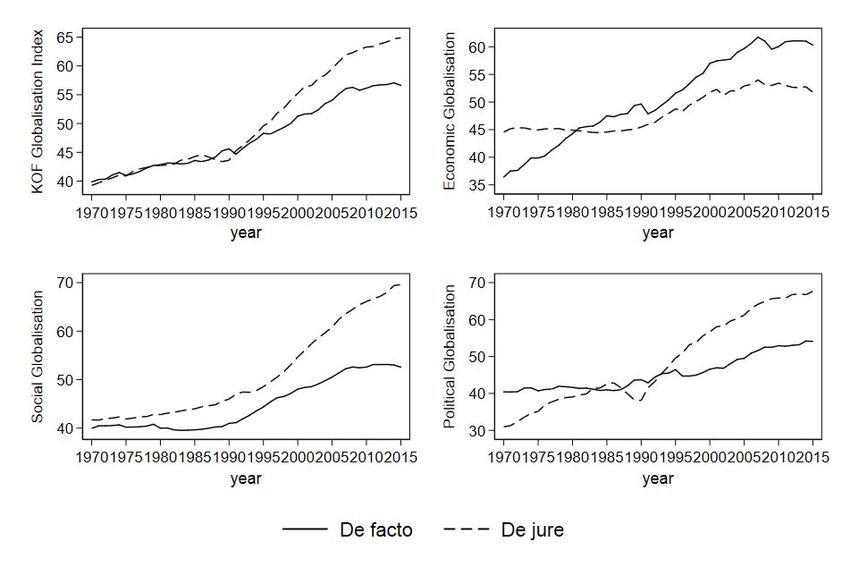
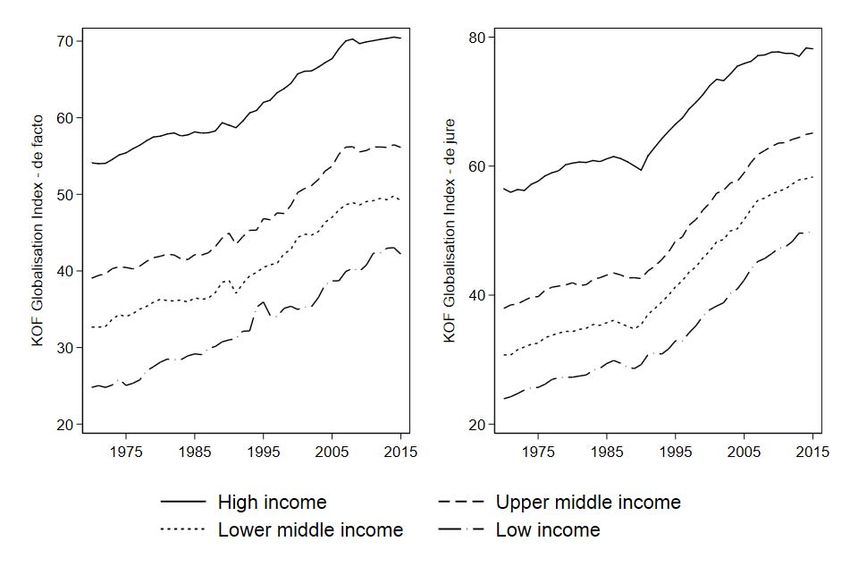
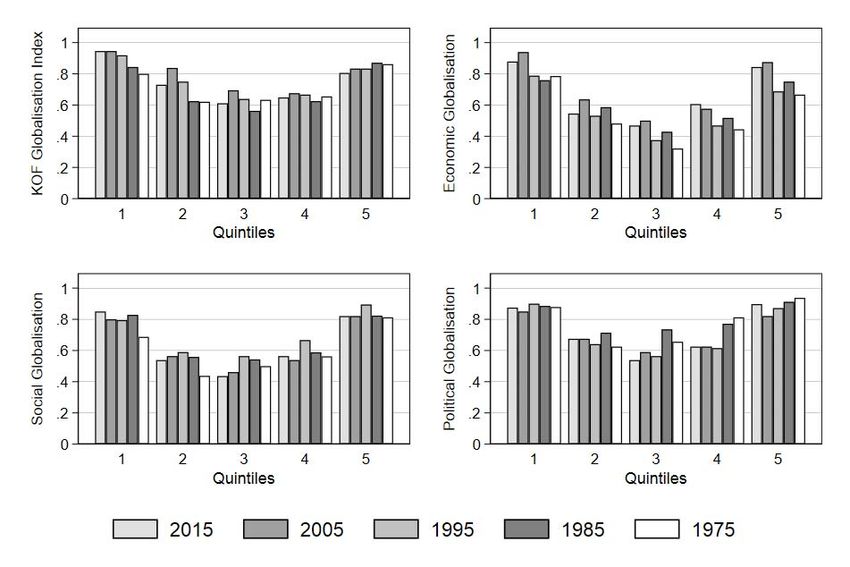
version of the KOF Globalisation Index are shown in Figure 2. For each Index, we display the
similarity of country composition in the different quintiles of the ranking for five selected years.
The first panel displays the overlap statistics of the two different versions of the overall KOF
Globalisation Index. Overlap in the first quintile is equal or greater than 80 percent in all years,
which means that 80 percent of countries in the top quintiles of the index are the same in both
versions. The overlap is also high in the bottom quintile with values around 80 percent. In the
middle quintiles, overlap is lower because countries in the middle of the rankings have index
values that lie much closer together. Consequently, any changes from the 2007 to the 2018
version are likely to have the greatest impact on the position of countries that are in the middle
part of the ranking.
[Insert Figure 2: Overlap statistics of the 2007 and 2018 versions of the KOF Globalisation
Index and its dimensions about here]
To analyse the revised KOF Globalisation Index, we compare de facto with de jure
globalisation indices. Figure 3 depicts both indices for the KOF Globalisation Index and its
dimensions. Overall, developments of de facto and de jure globalisation are quite distinct over
time. Until 1995 the world average of de facto and de jure globalisation evolve fairly similar
but start to diverge afterwards, where de jure globalisation grows considerable faster than the
de facto globalisation.
[Insert Figure 3: KOF Globalisation Index - de facto versus de jure globalisation about here]
For economic globalisation, both indices measure a steeper increase in de facto than in de jure
globalisation. We find that, while in the sub-dimension trade globalisation both de facto and
de jure indices increase hand-in-hand over our sample period, in the sub-dimension financial
globalisation we observe a steep increase in de facto globalisation but only a muted
development in de jure globalisation. For social and political globalisation, de jure
globalisation increases much more compared to de facto globalisation, especially after 1990
and 1995, respecitvely.
The overlap statistics between the de jure and de factor indices, depicted in Figure 4, confirm
that both differ substantially and produce distinct country rankings. The highest overlap is
achieved in the top quintiles: Countries that are most globalised in the de facto indices also
tend to be most globalised in the de jure indices. On the contrary, overlap in the middle quintiles
is low. With value below 50 percent, overlap tend to be lowest for social and economic
globalisation. Overall, the low overlap statistics do confirm the notion that de facto and de jure
globalisation feature different characteristics of globalisation resulting in distinct country
rankings.
[Insert Figure 4: Overlap statistics of de facto and de jure measures of the KOF Globalisation
Index and its dimensions about here]
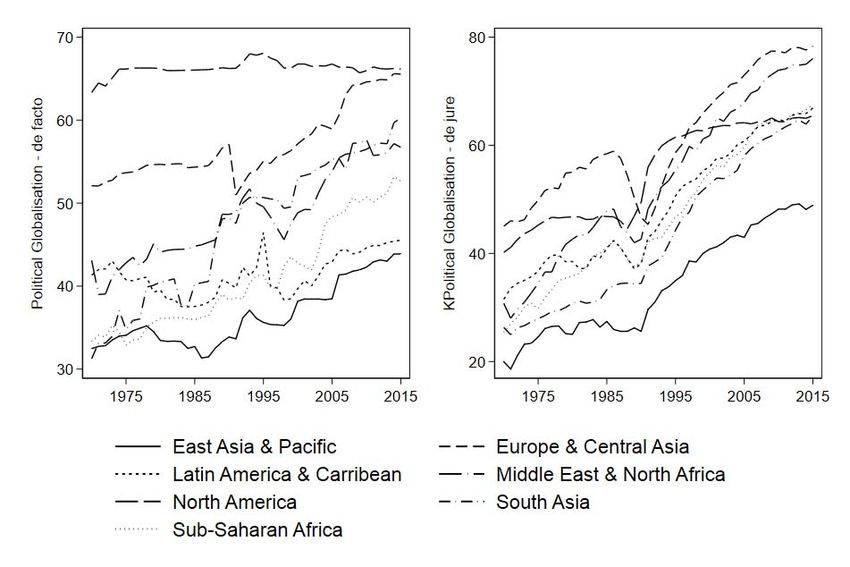
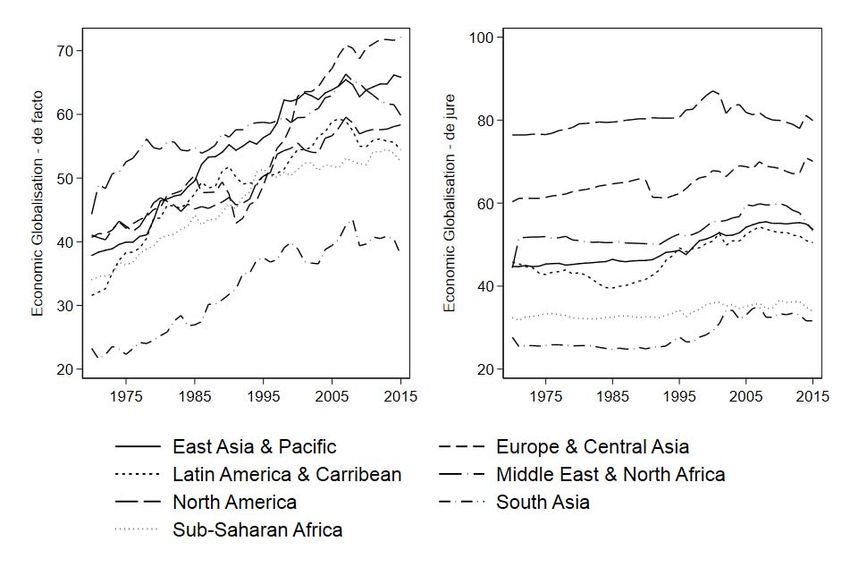
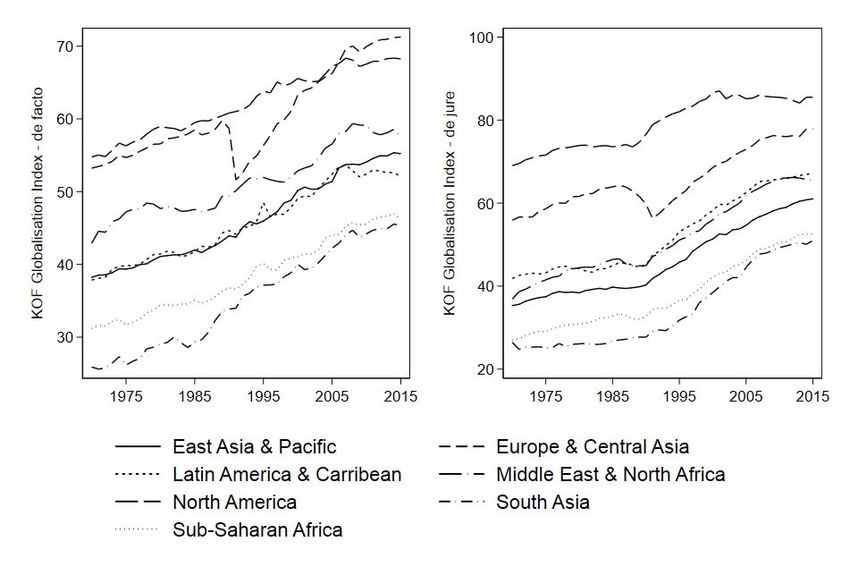
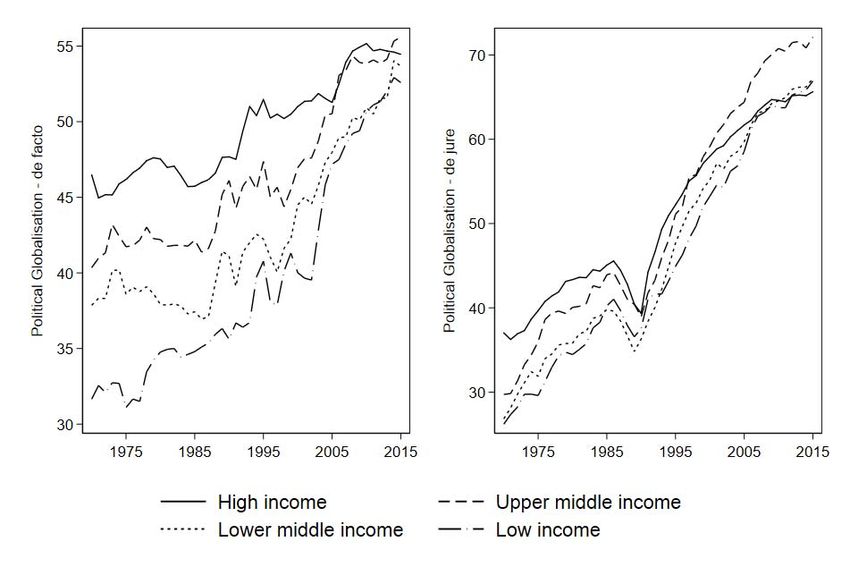
4.2 Regional differences
Departing from the world view, we can look at regional averages which reveal interesting
features of globalisation as measured with our indices. We compute regional globalisation as
country averages based on the regional classification of the World Bank.8
The left panel of Figure 5 shows de facto globalisation of different regions. North America is
the most globalised region during the first half of the sample period, but is overtaken by Europe
& Central Asia in the year 2005. The breakdown of the Soviet Union leads to a drop in the
index value for Europe & Central Asia in the early 1990ies. This is because we cannot compute
the index value for many former soviet countries for the years prior to the fall of the iron curtain
and including them afterwards lowers the regional average. Middle East & North Africa, East
Asia & Pacific and Latin America and Caribbean form the middle field of globalised regions.
South Asia and Sub-Saharan Africa are considered the least globalised regions, whereby the
former manages to catch up substantially over the sample period.
[Insert Figure 5: KOF de facto and de jure Globalisation Indices - Regional differences about
here]
The right panel of Figure 5 shows that North America leads the comparison of regional
averages when looking at de jure globalisation. Europe & Central Asia follows with the second
highest average value. Although the gap clearly decreases after Europe & Central Asia’s plunge
in the nineties, they did so far not manage to take over the leading role of North America as
they already have regarding de facto globalisation. Further below, the Middle East & North
Africa, East Asia & Pacific and Latin America form the middle group and South Asia and Sub-
Saharan Africa forming the group with the lowest de jure globalisation average.
Diving deeper into the different dimensions, we can identify de facto economic globalisation
as the main driver of Europe & Central Asia’s catch up in terms of de facto globalisation (see
Figure 6). From being second in the seventies to being sixth after the breakdown of the Soviet
Union in the nineties, the region experiences a remarkable comeback in terms of de facto
economic globalisation and takes over the leading role in 2000. North America is considered
the most globalised region in terms of de jure economic as well as de jure social globalisation.
[Insert Figure 6: KOF de facto and de jure Economic Globalisation Indices - Regional
differences about here]
During the first half of the sample, de jure social globalisation evolves equally sluggish,

8
 We use the classification from 2017 for the entire sample from 1970 to 2015. Country classifications from
World Bank can be found here: https://datahelpdesk.worldbank.org/knowledgebase/articles/906519-world-bank-
country-and-lending-groups
You can also read