Effects of elevated CO2 and extreme climatic events on forage quality and in vitro rumen fermentation in permanent grassland
←
→
Page content transcription
If your browser does not render page correctly, please read the page content below
Biogeosciences, 18, 4841–4853, 2021
https://doi.org/10.5194/bg-18-4841-2021
© Author(s) 2021. This work is distributed under
the Creative Commons Attribution 4.0 License.

Effects of elevated CO2 and extreme climatic events on forage
quality and in vitro rumen fermentation in permanent grassland
Vincent Niderkorn1 , Annette Morvan-Bertrand2 , Aline Le Morvan1 , Angela Augusti3 , Marie-Laure Decau4 , and
Catherine Picon-Cochard5
1 Université Clermont Auvergne, INRAE, VetAgro Sup, UMRH, 63122, Saint-Genès-Champanelle, France
2 Ecophysiologie Végétale, Agronomie et nutritions N.C.S., Normandie Université, UNICAEN, INRAE, EVA,
14000 Caen, France
3 CNR-Research Institute on Terrestrial Ecosystems, 05010 Porano (TR), Italy
4 INRAE, Unité Expérimentale Ferlus, Lusignan, France
5 Université Clermont Auvergne, INRAE, VetAgro Sup, UREP, 63000 Clermont-Ferrand, France

Correspondence: Vincent Niderkorn (vincent.niderkorn@inrae.fr)

Received: 9 December 2020 – Discussion started: 11 January 2021
Revised: 31 May 2021 – Accepted: 18 June 2021 – Published: 30 August 2021

Abstract. The aim of this study was to analyze changes in         1   Introduction
botanical and chemical composition, as well as in vitro ru-
men fermentation characteristics of an upland grassland ex-       Global livestock production has increased rapidly and sub-
posed to climate changes in controlled CO2 concentration,         stantially in recent decades as a result of world population
air temperature and precipitation conditions. Grassland was       growth and a shift towards diets with a higher animal pro-
exposed to a future climate scenario coupled with CO2 treat-      tein content in many countries (Tilman and Clark, 2014).
ments (390 and 520 ppm) from the beginning of spring. Dur-        The livestock sector is singled out as a significant contrib-
ing summer, an extreme climatic event (ECE; 2 weeks of a          utor to global human-induced greenhouse gas (GHG) emis-
+6 ◦ C increase in temperature, together with severe drought)     sions (Gerber et al., 2013), particularly through energy and
was applied and then followed by a recovery period. Three         protein losses in the form of enteric methane (CH4 ) and am-
cutting dates were considered, i.e. in April, June and Novem-     monia (NH3 ), urea, and nitrous oxide (N2 O) released during
ber. The results indicate that increases in greenness, nitrogen   ruminant digestion. Using 100-year-timescale global warm-
(N) content and changes in water-soluble carbohydrate pro-        ing potentials of 34 for CH4 and 298 for N2 O (compared to
file in association with botanical composition changes for the    CO2 ) (IPCC, 2013), the livestock supply chains emit an es-
November cut lead to higher in vitro dry matter degradability     timated total of 7.1 Gt CO2 eq. yr−1 , with ruminants by far
(IVDMD) in the rumen. The neutral detergent fiber : nitrogen      the largest contributors (Gerber et al., 2013). Recent stud-
(NDF : N) ratio appeared to be a key driver of forage quality,    ies show that atmospheric CH4 levels have grown alarmingly
which was affected in opposite ways by elevated CO2 and           rapidly in recent years (Nisbet et al., 2019) and that livestock
ECE, with a strong impact on rumen fermentation. Atmo-            CH4 emissions may even have been underestimated (Wolf
spheric CO2 concentration in interaction with ECE tended to       et al., 2017). Reducing GHG emissions is a crucial chal-
affect IVDMD, indicating that the effects of elevated CO2         lenge for Earth system governance, and there is significant
and ECE may partly offset each other. Our findings indicate       potential for mitigation in the ruminant sector (Herrero et al.,
that the various factors of climate change need to be consid-     2016).
ered together in order to properly characterize their effects
on forage quality and use by ruminants.

Published by Copernicus Publications on behalf of the European Geosciences Union.
4842                                                 V. Niderkorn et al.: Effects of elevated CO2 and extreme climatic events

   The bulk of the ruminant diet consists of plant material         2     Materials and methods
in the form of forage. Globally, grasses comprised 48 %
(2.3 billion tons) of the total biomass used by livestock           2.1    Experimental design
(4.7 billion tons) in 2000 (Herrero et al., 2013). Forage
quality is a major actionable lever for decreasing GHG              The experimental design was previously described in Roy
emissions as variability in forage nutritive value has been         et al. (2016) and Volaire et al. (2020). The present study
shown to generate variability in the CH4 emission levels            tested the forage quality response of an upland-grassland
from ruminants (Thornton and Herrero, 2010). Forage qual-           plant community near Saint-Genès-Champanelle (central
ity is closely linked to ingestibility and digestibility, both of   France) to future climate scenarios projected for the 2050s
which are largely dependent on the nature and concentrations        (Ciais et al., 2005). For the representative year 2045 given
of the major forage macronutrients, such as structural and          by the ARPEGEv4 atmosphere–ocean general circulation
non-structural carbohydrates or crude proteins (Fig. 1). Di-        model under the A2-CO2 emissions scenario (Nakicenovic
gestibility is the main driver of net dietary energy, rumen         et al., 2000) and using a multivariate statistical downscal-
microbial synthesis and production of volatile fatty acids          ing methodology (Boé et al., 2006) to generate projections
(VFAs), which are the main sources of energy for the ru-            over an 8×8 km grid, the projected annual means for air tem-
minant (INRA, 2018). On the other hand, digestible organic          perature and precipitation at Saint-Genès-Champanelle were
matter (OM) is the best indicator of CH4 emissions as it            10.9 ◦ C and 770 mm, respectively. These values correspond
is produced by carbohydrate fermentation (Fig. 1; INRA,             to +2.3 ◦ C and −33 mm compared to the mean air tempera-
2018). In the specific case of permanent grasslands, forage         ture and precipitation measured over the 1990–2009 period.
quality is mainly driven by botanical composition, i.e. a large     Here, we chose to apply less precipitation and higher tem-
diversity of self-seeded grasses and dicotyledons and broad         peratures than under the prevailing current climate from the
variability in phenology and competitiveness, and is affected       start of the experiment and for all treatments (all monoliths
by agricultural practices (Rossignol et al., 2014; Andueza          were exposed to future climate scenario) in order to test and
et al., 2016).                                                      compare the effects of elevated CO2 and increased ECEs
   Forage quality can also be impacted by elevated tempera-         under these drier and warmer conditions. The baseline cli-
tures and by the intensity and frequency of extreme climatic        mate conditions of this experiment were therefore drier and
events (ECEs) such as droughts and heat waves, which are            warmer than at the origin site (Saint-Genès-Champanelle).
projected to increase (Planton et al., 2008). Lee et al. (2017)     Furthermore, we tested and compared the atmospheric CO2
modeled the variation in nutritive value of forage species          concentration forecasted for the 2050s (according to the A2
growing across a range of bioclimatic zones and showed that         scenario), i.e. 520 ppm, against the CO2 concentration of
higher temperatures reduce forage nutritive value likely due        390 ppm measured in 2010.
to changes in species identity, physiology and phenology.              In June 2009, 1 m2 monoliths (n = 48) formed by undis-
They also found that CH4 production may increase by 0.9 %           turbed soil and vegetation from an extensively managed up-
with a 1 ◦ C temperature rise and by 4.5 % with a 5 ◦ C rise.       land semi-natural grassland were excavated to 60 cm depth.
The effects of interactions between ECEs and elevated CO2           The origin site (Redon; 45◦ 430 N, 03◦ 010 E; 800 m a.s.l.) is
on grassland ecology and forage quality are not well under-         located near Saint-Genès-Champanelle and is a long-term
stood, especially for permanent grasslands (Dumont et al.,          fertile (clover rich) grassland managed by a combination of
2015). There is a need to address the gap in knowledge on           grazing (three to five grazing periods) and cutting (one cut
the drivers of forage quality under projected climatic condi-       per year). One organic fertilization occurs at the end of the
tions in order to adapt grass-based ruminant systems to the         winter period. The average botanical composition of the plant
context of global climate change.                                   communities was initially dominated by C3 perennial grasses
   The aim of this study was to analyze changes in botanical        (60 %), legumes (35 %) and forbs (5 %). At the start of the
and chemical composition of plants from an upland grassland         experiment, five species accounted for 70 % of species com-
when exposed to an elevated atmospheric CO2 level com-              position: Trifolium repens, Lolium perenne, Holcus lanatus,
bined or not with an ECE (drought combined with heat wave)          Agrostis tenuis and Alopecurus pratensis. The origin-site soil
in controlled conditions. The impact of these changes on ru-        is a cambisol of 59.5 % sand, 19.2 % silt and 21.3 % clay,
minant digestion was investigated by determining in vitro ru-       with a pH of 5.9. Once excavated, the 48 monoliths were
men fermentation parameters. The hypothesis tested was that         transferred to the INRAE research station (Clermont Fer-
combined drivers of global change (elevated CO2 and ECEs)           rand; 45◦ 460 N, 03◦ 080 E; 350 m a.s.l.) where the soil water
may have different effects on forage characteristics and di-        content (SWC) was maintained at near 80 % of original field
gestion by ruminants, with potential offsets.                       capacity between natural precipitation and additional irriga-
                                                                    tion.

Biogeosciences, 18, 4841–4853, 2021                                                   https://doi.org/10.5194/bg-18-4841-2021
V. Niderkorn et al.: Effects of elevated CO2 and extreme climatic events 4843 Figure 1. Overview of protein and carbohydrate metabolism in the rumen. WSCs: water-soluble carbohydrates; NDF: neutral detergent fiber (cell wall carbohydrates); CH4 : methane; CO2 : carbon dioxide; NH3 : ammonia; H2 : hydrogen. At the beginning of 2010, the monoliths were transported match with data on forage quality, SWC was averaged across to the CNRS Ecotron near Montpellier (43◦ 400 N, 03◦ 520 E). regrowth periods before the cuts, i.e. from 1 to 26 April, from Four monoliths were randomly allocated to each of the 12 27 April to 9 June and from 22 September to 3 November. Ecotron macrocosms. The macrocosms were exposed from April 2010 to early March 2011 to the future climate scenario 2.2 Plant materials, cutting and botanical composition forecasted for 2050, according to the ARPEGEv4 model, and to current CO2 concentration. From mid-March 2011 In 2011, on three dates (26 April, 9 June, 3 November), to November 2012, six randomly selected macrocosms were aboveground biomass was harvested on a fixed center-square exposed to 520 ppm CO2 and the other six to 390 ppm CO2 . (0.5×0.5 m) in each monolith using a precision mower (6 cm For each CO2 concentration treatment, a first phase of the cutting height). The April cut was the expression of winter ECE treatment (reduction of 50 % precipitation) was applied and spring growth, and no treatments were applied except on three out of six monoliths from 25 June to 21 July. A sec- for 1 month of CO2 treatment, whereas the June cut was the ond phase of the ECE treatment (no irrigation and a 3.4 ◦ C expression of spring and early summer growth and CO2 treat- increase in air temperature per the year 2050 scenario) was ment, and the November cut was the expression of summer applied from 22 July to 4 August. This temperature increase and fall growth and included the CO2 treatment, the ECE and corresponded to a 7.1 ◦ C higher temperature than the mean the recovery phase. temperature from 2000 to 2009 at the same period and was The cut material was weighed to determine fresh above- above the 14 consecutive hottest days of summer 2003. From ground biomass and then separated into three subsamples: 5 to 31 August, irrigation was progressively applied in the the first subsample was oven-dried at 60 ◦ C for 72 h and treatment with the ECE to allow the same cumulative precip- used for dry matter (DM) determination and chemical anal- itation as in the non-ECE-treated monoliths. From the end yses; the second subsample was freeze-dried and used for of August until the beginning of November, all macrocosms the in vitro rumen fermentation assay; the third subsam- were exposed to the 2050 climate conditions. From April ple was used to sort out green, dead and flower biomass 2010 to November 2011, the Ecotron climate-regulation sys- and determine the botanical composition of the green ma- tem monitored hourly means of air temperature and humid- terial. Species were sorted by hand, oven-dried (60 ◦ C, 72 h) ity, as well as daily means of precipitation and CO2 concen- and weighed separately in order to calculate relative abun- tration. Each of the four experimental treatments combining dance for each species and then define the functional groups, both CO2 and ECE treatments was replicated three times. i.e. grasses, legumes and forbs (shown as relative abun- Further details on the experimental conditions can be found dance). in Roy et al. (2016). In each of the 48 monoliths, SWC was continuously measured at soil depths of 7, 20 and 50 cm us- ing time domain reflectometry (TDR) probes (IMKO, Ettlin- gen, Germany) and averaged across soil depths and mono- liths in order to get one value per macrocosm. In addition, to https://doi.org/10.5194/bg-18-4841-2021 Biogeosciences, 18, 4841–4853, 2021
4844                                               V. Niderkorn et al.: Effects of elevated CO2 and extreme climatic events

2.3    In vitro rumen fermentation assay                         2.4   Analytical procedures

All experimental procedures were performed according to          Plant substrates and leftovers after fermentation (residues)
the European Union Directive 2010/63/EU, reviewed by the         were analyzed to determine DM by oven-drying at 60 ◦ C for
local institutional review board (C2E2A, “Comité d’Ethique       72 h and OM by ashing at 550 ◦ C for 6 h in a muffle fur-
pour l’Expérimentation Animale en Auvergne”) and ap-             nace. In-plant neutral detergent fiber (NDF) content was de-
proved under French Ministry for Research authorization no.      termined according to the method described by Van Soest
CE 69-12.                                                        et al. (1991) using an ANKOM fiber analyzer (ANKOM
   For each macrocosm and each cutting date, a representa-       Technology Corporation, Fairport, NY). The leaf carbon (C)
tive sample was reconstituted with cut freeze-dried material     and nitrogen (N) contents were determined at the INRAE-
from the four monoliths, weighted according to the values of     Nancy isotopic analysis platform using a stable isotope-
aboveground biomass measured on each monolith (thereby           ratio mass spectrometer (IsoPrime 100, IsoPrime, Manch-
pooling the four monoliths, n = 12). The rumen fermenta-         ester, UK). Water-soluble carbohydrates (WSCs) were suc-
tion assay was performed on the 12 samples taken on each         cessively extracted from dry powder with 80 % ethanol
cutting date, three times over a period of 2 weeks.              and water, according to Benot et al. (2019). Supernatants
   Freeze-dried plant material (600±0.5 mg) was transferred      were pooled and evaporated under vacuum to eliminate
in 120 mL serum bottles, pre-warmed at 39 ± 0.5 ◦ C and          ethanol and water and to thus concentrate the samples. The
flushed with N2 to eliminate the oxygen. A total of 40 mL        residue was dissolved in water and passed through ion ex-
buffered rumen fluid was then added to the serum bottle, and     change resins to remove charged compounds before high-
the bottle was hermetically sealed with a butyl rubber stopper   performance liquid chromatography (HPLC) analysis. WSCs
and aluminum crimp seals. The buffered rumen fluid was pre-      were separated on a cation exchange column (Sugar-PAK I,
pared as follows. Rumen contents were collected before the       300 × 6.5 mm, Millipore Waters Milford, MA) and detected
morning feeding from three cannulated sheep fed daily with       using a refractometer (see Benot et al., 2019, for more de-
1200 g of a diet composed of 80 % permanent grassland hay        tails). Condensed tannin (CT) content was determined us-
and 20 % concentrate mix. Rumen contents from the three          ing the colorimetric HCl–butanol method (Grabber et al.,
sheep were mixed in the same proportions in a container and      2013). Pepsin-cellulase OM digestibility was evaluated ac-
squeezed through two layers of cheesecloth (800 µm mesh          cording to the method described by Aufrère and Michalet-
size) to obtain the fluid used as inoculum for the in vitro      Doreau (1988). In vitro DM degradability (IVDMD) was
rumen fermentation assay. Strained rumen fluid was diluted       determined as the difference between the DM of plant ma-
in an anaerobic buffer solution (phosphate : carbonate, 1 : 2    terial before the fermentation and the DM of fermentation
v/v) as described by Goering and Van Soest (1970) and mod-       residue after 24 h of fermentation. The CH4 and CO2 con-
ified by Niderkorn et al. (2011). Initial pH of the buffered     centrations in gas samples were determined by gas chro-
rumen fluid was 7.03 ± 0.02. All bottles were incubated in       matography using a 3000A Micro GC system (Agilent Tech-
a shaking water bath at 39 ± 0.5 ◦ C, and blanks without any     nologies, France). Total and individual VFAs (acetate, pro-
plant substrate (only buffered rumen fluid) were included. At    pionate, butyrate, valerate, caproate, isobutyrate, isovalerate)
t = 0, samples of buffered rumen fluid were taken to deter-      in the supernatant were measured by gas chromatography,
mine the VFAs and NH3 concentrations in the medium be-           and NH3 was determined using the Berthelot reaction (Park
fore incubation.                                                 et al., 2009).
   After 24 h of incubation, the volume of gas produced in the
headspace of the serum bottles was determined using a pres-      2.5   Statistical analysis
sure transducer (Theodorou et al., 1994), and gas samples
were taken for the determination of CH4 and CO2 concentra-       All variables related to the chemical composition of plant
tions. The entire contents of the bottle were then transferred   communities and in vitro rumen fermentation parameters
into a pre-weighed 50 mL Falcon tube, and the pH was im-         were analyzed using a mixed model (MIXED procedure,
mediately measured. Tubes were centrifuged at 3400 × g for       SAS Enterprise Guide 5.1, SAS Institute Inc., Cary, NC).
10 min at 4 ◦ C, and samples of supernatant were taken for       Each macrocosm was considered as an experimental unit.
determination of VFAs and NH3 concentrations (Niderkorn          For the April and June cuts, CO2 concentration was used as
et al., 2011). To recover all the non-degraded particles, the    a fixed effect, and the effects of ECE treatment and CO2 –
bottle was washed twice with distilled water, and the wash-      ECE interaction were added as fixed effects for the Novem-
ing water was transferred into the Falcon tube. Tubes were       ber cut, with the macrocosm used as a random factor. For
again centrifuged at 3400 × g for 10 min at 4 ◦ C, and after     each variable analyzed, data were subjected to three co-
removal of the supernatant, the residue was used for DM de-      variance structures: compound symmetry, autoregressive or-
termination.                                                     der 1 and unstructured covariance. The covariance that re-
                                                                 sulted in the smallest Akaike’s information criterion was
                                                                 retained for analysis. Fractions (relative abundances) were

Biogeosciences, 18, 4841–4853, 2021                                                 https://doi.org/10.5194/bg-18-4841-2021
V. Niderkorn et al.: Effects of elevated CO2 and extreme climatic events 4845
transformed by the arcsine of the square root before the anal- biomass (p > 0.05). There was a significant cutting date ef-
ysis of variance. Significance was set at p ≤ 0.05, and trend fect on all the chemical composition parameters except C
was set at 0.05 < p < 0.10. Relationships between above- content, with a significant cutting date and CO2 effect on N
ground biomass characteristics, chemical composition and content (p < 0.001), C : N ratio (p < 0.001) and NDF : N ra-
in vitro rumen fermentation parameters were analyzed with tio (p < 0.001) (Table S3 in the Supplement). By taking all
non-parametric Spearman correlation tests. data into account (36 observations), many significant rela-
tionships were observed between aboveground biomass char-
acteristics and chemical composition of forage (Table S4 in
3 Results the Supplement). Chemical composition was strongly driven
by green material percentage, as well as plant species abun-
The measured values of temperature and atmospheric CO2 dances, especially those of Alopecurus pratensis, Holcus
concentration throughout the experiment for the different lanatus and Lolium perenne (Fig. S1 in the Supplement).
treatments were reported in Roy et al. (2016). When the ECE
was imposed, mean daily air temperature peaked at 25 ◦ C. 3.2 In vitro rumen fermentation characteristics
As expected, the ECE strongly affected SWC during the
stress period (Table 1, p < 0.001). There was a significant Estimated IVDMD was significantly lower (−3 %, p =
effect of CO2 –ECE interaction during the period preceding 0.041) in plants exposed to 520 ppm CO2 concentration com-
the November cut (Table 1, p = 0.014), reflecting a higher pared to 390 ppm for the April cut and tended to be lower
SWC for the control at 520 ppm CO2 compared to the other for the November cut (p = 0.075) (Tables 3 and 4). Increas-
treatments. ing the level of CO2 drastically decreased the NH3 con-
centration in the incubation medium for all cuts (−21 %,
3.1 Aboveground biomass characteristics and chemical p = 0.014; −31 %, p = 0.001; and −34 %, p = 0.005, re-
composition spectively), decreased the proportion of valerate for the cuts
of April and June (−7 %, p = 0.016 and p = 0.017, re-
Aboveground biomass did not differ significantly among spectively), and increased the acidification for the Novem-
treatments. The November cut had more green material (p = ber cut (+11 %, p = 0.007). Increasing the level of CO2
0.013) and less dead material (p = 0.018) with the ECE also tended to increase total VFA concentration (p = 0.056)
than in the control (Tables 2 and S1 in the Supplement and decrease the proportion of isovalerate for the April cut
and seasonal pattern shown in Fig. 2). There were very (p = 0.062), as well as decrease the proportion of isobutyrate
few differences among treatments in terms of relative abun- for the November cut (p = 0.063). The ECE treatment very
dances of functional groups or species (Table 2, Tables S1 significantly increased NH3 concentration in the incubation
and S2 in the Supplement, Fig. 3) due to large variability medium (+90 %, p < 0.001), IVDMD (+10 %, p = 0.001),
among the macrocosms, except for Holcus lanatus which and the proportions of propionate, valerate and isovaler-
decreased dramatically after the ECE (p = 0.001). There ate (+4 %, p = 0.008; +21 %, p = 0.004; and +25 %, p =
was a seasonality-driven cutting date effect on aboveground 0.006, respectively), and it tended to decrease the propor-
biomass, fractions of green and dead materials and flowers tion of acetate (p = 0.064), whereas the acetate : propionate
(p < 0.001), and relative abundances of several species but ratio, which is related to the fermentation pathways in the
without a significant cutting date and CO2 effect (Table S2). rumen, decreased (−5 %, p = 0.013). The CO2 –ECE inter-
The N content in the aboveground biomass was signif- action tended to have effects on IVDMD (p = 0.053) and
icantly lower at 520 ppm CO2 concentration compared to isovalerate concentration (p = 0.067). There was a cutting
390 ppm (Tables 3 and 4). This was shown in cuts from every date effect (seasonality) on all in vitro rumen fermentation
season: April (−11 %, p < 0.001), June (−9 %, p = 0.003) parameters except isovalerate concentration and CO2 : CH4
and November (−21 %, p = 0.007). Increasing the CO2 con- ratio, with a significant cutting date and CO2 effect on NH3 ,
centration caused an increase in OM content in April (+1 %, valerate and isovalerate concentrations (Table S3).
p = 0.033) and a decrease in NDF content in June (−3 %, By taking all data into account, many strong significant
p = 0.002), as well as increased C : N ratio and NDF : N ra- relationships were observed between in vitro rumen fermen-
tio at the three cutting dates (p < 0.05). After ECE recov- tation characteristics and chemical composition of forage
ery in November, there were strong increases in N content (Table S4). For example, IVDMD was negatively correlated
(+54 %, p < 0.001), sucrose content (+31 %, p = 0.022) with NDF and NDF : N ratio and positively correlated with
and fructose content (+23 %, p = 0.031). The ECE sig- fructan content. The NH3 emission was positively correlated
nificantly decreased NDF content (−7 %, p = 0.027), C : with aboveground biomass N content (Table S4, Fig. S1
N ratio (−34 %, p < 0.001) and NDF : N ratio (−39 %, in the Supplement). As expected due to the link between
p < 0.001) and increased pepsin-cellulase OM digestibility chemical composition and aboveground biomass characteris-
(+14 %, p = 0.005). There was no effect of the CO2 –ECE tics, significant correlations were observed between in vitro
interaction on chemical composition of the aboveground rumen fermentation characteristics and plant species abun-
https://doi.org/10.5194/bg-18-4841-2021 Biogeosciences, 18, 4841–4853, 20214846 V. Niderkorn et al.: Effects of elevated CO2 and extreme climatic events
Table 1. Factor effects (p values) on soil volumetric water content (SWC) at two levels of CO2 concentration (390 and 520 ppm) with or
without an extreme climatic event (ECE).
1–26 April 27 April–9 June 21 July–3 August (stress period) 22 September–3 November
CO2 effect CO2 effect CO2 effect ECE effect CO2 × ECE effect CO2 effect ECE effect CO2 × ECE effect
SWC 0.736 0.430 0.775 < 0.001 0.312 0.111 0.366 0.014
d.f (num/den) 1/10 1/10 1/8 1/8 1/8 1/8 1/8 1/8
The d.f (num/den) signifies degrees of freedom (numerator and denominator). In bold: p < 0.05; in italics: 0.05 < p < 0.1.
Table 2. Factor effects (p values) on aboveground mass, fractions of green material, flower and dead material, relative abundance of functional
groups, and relative abundance of the 10 most abundant species and other species (< 15 %) in plant communities exposed to two levels of
CO2 concentration (390 and 520 ppm) with or without an extreme climatic event (ECE) at three different cutting dates.
Cut April Cut June Cut November
CO2 effect CO2 effect CO2 effect ECE effect CO2 × ECE effect
Aboveground mass 0.315 0.301 0.467 0.405 0.818
Fractions
Green material 0.396 0.332 0.222 0.013 0.355
Flower 0.076 0.329 0.406 0.066 0.650
Dead material 0.267 0.718 0.278 0.018 0.417
d.f (num/den) 1/10 1/10 1/8 1/8 1/8
Relative abundance of functional groups
Grasses 0.845 0.822 0.335 0.632 0.129
Legumes 0.451 0.986 0.647 0.339 0.310
Forbs 0.918 0.968 0.091 0.939 0.176
d.f (num/den) 1/10 1/10 1/8 1/8 1/8
Relative abundance of species
Agrostis spp 0.305 0.989 0.987 0.070 0.126
Arrhenatherum elatius 0.429 0.802 0.811 0.544 0.414
Alopecurus pratensis 0.251 0.212 0.130 0.452 0.026
Dactylis glomerata 0.834 0.668 0.696 0.721 0.643
Holcus lanatus 0.693 0.999 0.475 0.001 0.379
Lolium perenne 0.497 0.777 0.736 0.732 0.037
Poa angustifolia 0.809 0.788 0.415 0.754 0.644
Poa pratensis 0.967 0.952 0.957 0.988 0.846
Trisetum flavescens 0.856 0.475 0.469 0.519 0.192
Ranunculus acris 0.299 0.017 0.584 0.028 0.166
Other species 0.377 0.443 0.426 0.201 0.324
d.f (num/den) 1/10 1/10 1/8 1/8 1/8
The d.f (num/den) signifies degrees of freedom (numerator and denominator). In bold: p < 0.05; in italics: 0.05 < p < 0.1.
dances, especially those of Lolium perenne, Holcus lana- 4 Discussion
tus and Alopecurus pratensis (Table S4, Fig. S1). Acidifi-
cation and CH4 emission appeared to be strongly positively 4.1 Elevated CO2 and ECE modify aboveground
driven by the abundance of Lolium perenne (Table S4), while biomass and botanical composition
NH3 emission was driven by that of Alopecurus pratensis
(Fig. S1). The strong negative relationship between Holcus In this experiment, aboveground biomass was not affected by
lanatus abundance and isovalerate production (Fig. S1) sug- elevated CO2 or an ECE probably because the control was
gests that the increase in isovalerate production following the actually exposed to drier and warmer conditions compared
ECE was due to the decline of Holcus lanatus. to the current ones (referred to as the mean of the 1990–2009
period). These conditions were applied to allow us to com-
pare the effect of elevated CO2 and ECE under the projected
Biogeosciences, 18, 4841–4853, 2021 https://doi.org/10.5194/bg-18-4841-2021V. Niderkorn et al.: Effects of elevated CO2 and extreme climatic events 4847
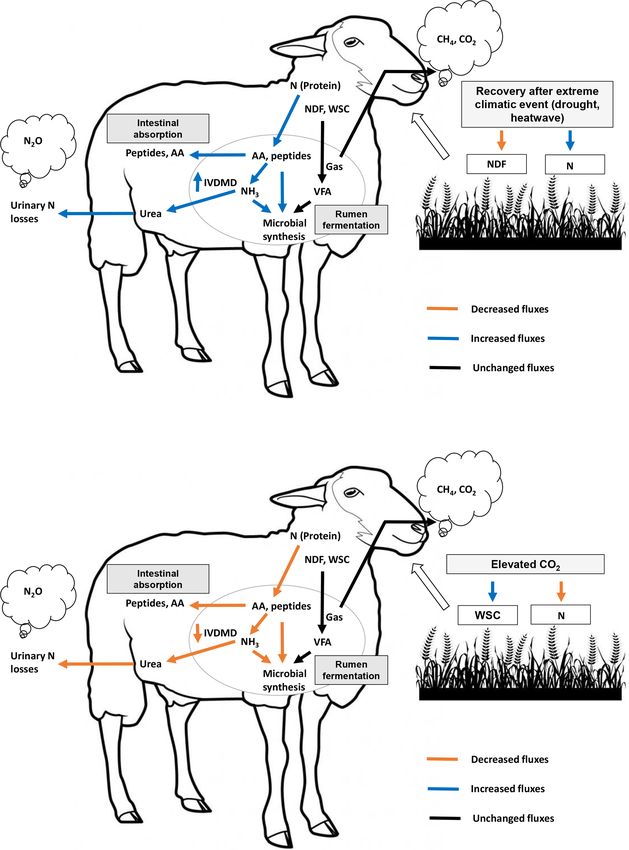
Figure 2. Aboveground biomass of green material, dead material and flowers measured before (April, June) and after (November) the extreme
climatic event (ECE) exposed to four climate scenarios: 390 or 520 ppm atmospheric CO2 concentration without (control) or combined with
the ECE; n = 3.
Table 3. Chemical composition and in vitro rumen fermentation parameters of plant communities exposed to two levels of CO2 concentration
(390 and 520 ppm) with or without an extreme climatic event (ECE) at three different cutting dates.
Cut April Cut June Cut November
Control ECE
CO2 (ppm) 390 520 390 520 390 520 390 520
Chemical composition
OM (g kg−1 DM) 918 ± 6 926 ± 5 918 ± 4 921 ± 4 909 ± 10 918 ± 6 918 ± 2 909 ± 13
C (g kg−1 DM) 448 ± 4 447 ± 2 448 ± 2 446 ± 3 444 ± 6 444 ± 3 449 ± 3 442 ± 8
N (g kg−1 DM) 23.1 ± 1.1 20.5 ± 0.8 18.2 ± 0.5 16.5 ± 0.9 17.7 ± 1.5b,c 14.3 ± 0.6c 27.6 ± 4.0a 21.6 ± 1.6b
C : N ratio 19.5 ± 0.9 21.8 ± 0.8 24.6 ± 0.7 27.1 ± 1.4 25.2 ± 2.3b 31.0 ± 1.3a 16.4 ± 2.2c 20.5 ± 1.1b,c
NDF (g kg−1 DM) 515 ± 23 513 ± 22 586 ± 11 568 ± 11 550 ± 8a 546 ± 37a,b 534 ± 6a,b 490 ± 26b
NDF : N ratio 22.3 ± 0.9 25.0 ± 1.2 32.2 ± 1.1 34.5 ± 2.1 31.2 ± 2.5b 38.0 ± 1.3a 19.5 ± 2.5c 22.7 ± 0.5c
WSCs (g kg−1 DM) 263 ± 36 241 ± 36 187 ± 27 192 ± 33 146 ± 39 194 ± 50 167 ± 36 195 ± 4
Glucose (g kg−1 DM) 19.8 ± 4.2 17.7 ± 2.7 20.2 ± 3.7 16.8 ± 4.2 10.3 ± 2.7 7.8 ± 1.3 10.8 ± 1.7 10.6 ± 1.2
Sucrose (g kg−1 DM) 39.7 ± 6.2 41.4 ± 9.1 29.4 ± 4.9 30.5 ± 6.5 18.7 ± 2.9 20.0 ± 3.4 23.0 ± 5.2 27.6 ± 2.5
Fructose (g kg−1 DM) 21.6 ± 4.2 19.0 ± 3.6 20.5 ± 3.1 17.9 ± 4.5 13.0 ± 2.2 12.7 ± 2.1 15.1 ± 2.3 16.6 ± 1.0
Fructans (g kg−1 DM) 182 ± 29 163 ± 22 117 ± 21 127 ± 22 104 ± 40 153 ± 47 118 ± 27 140 5
CTs (g kg−1 DM) 20 ± 7 16 ± 3 30 ± 14 31 ± 15 19 ± 3 17 ± 4 25 ± 13 21 ± 4
Pepsin-cellulase OM digestibility (g kg−1 ) 775 ± 24 765 ± 28 644 ± 14 649 ± 47 610 ± 37b 645 ± 56a,b 696 ± 42a,b 737 ± 2a
In vitro rumen fermentation parameters
Acidification (dpH) 0.91 ± 0.05 0.94 ± 0.05 0.82 ± 0.04 0.84 ± 0.03 0.69 ± 0.04a,b 0.77 ± 0.03a 0.66 ± 0.03b 0.73 ± 0.03a,b
IVDMD (g kg−1 ) 602 ± 13 584 ± 14 525 ± 24 516 ± 19 515 ± 17b 512 ± 17b 541 ± 15a,b 584 ± 20a
NH3 (mmol L−1 ) 9.60 ± 1.18 7.54 ± 1.20 7.10 ± 0.89 4.92 ± 0.67 7.99 ± 1.72b,c 4.18 ± 1.38c 13.32 ± 2.23a 9.80 ± 0.85a,b
Total VFA (mmol g−1 DM) 8.10 ± 0.17 8.37 ± 0.25 7.58 ± 0.45 7.45 ± 0.27 7.14 ± 0.39 7.37 ± 0.05 7.42 ± 0.33 7.72 ± 0.55
Acetate (%) 63.5 ± 0.9 64.2 ± 1.1 64.5 ± 0.6 65.0 ± 1.3 65.2 ± 0.9 65.8 ± 0.5 64.8 ± 0.3 63.9 ± 1.5
Propionate (%) 23.7 ± 0.5 23.1 ± 0.7 23.0 ± 0.3 22.7 ± 0.5 22.2 ± 0.2b 22.6 ± 0.4a,b 23.0 ± 0.06a,b 23.4 ± 0.7a
Butyrate (%) 9.19 ± 0.42 9.27 ± 0.41 9.10 ± 0.32 9.12 ± 0.83 8.90 ± 0.35 8.67 ± 0.25 8.21 ± 0.12 8.79 ± 0.67
Valerate (%) 1.19 ± 0.04 1.11 ± 0.05 1.12 ± 0.04 1.04 ± 0.06 1.15 ± 0.12a,b 0.99 ± 0.07b 1.31 ± 0.03a 1.27 ± 0.12a
Isobutyrate (%) 0.93 ± 0.08 0.87 ± 0.10 0.85 ± 0.07 0.83 ± 0.16 0.97 ± 0.18 0.79 ± 0.09 1.07 ± 0.16 0.88 ± 0.02
Isovalerate (%) 1.41 ± 0.10 1.27 ± 0.12 1.34 ± 0.07 1.25 ± 0.12 1.47 ± 0.22a,b 1.12 ± 0.11b 1.61 ± 0.11a 1.64 ± 0.15a
Acetate : propionate ratio 2.69 ± 0.09 2.79 ± 0.12 2.82 ± 0.06 2.89 ± 0.11 2.95 ± 0.06a 2.93 ± 0.07a,b 2.84 ± 0.02a,b 2.75 ± 0.13b
Total gas (mmol g−1 DM) 7.07 ± 0.23 7.14 ± 0.16 6.43 ± 0.41 6.41 ± 0.21 6.06 ± 0.16 6.13 ± 0.39 6.25 ± 0.28 6.50 ± 0.13
CH4 (mmol g−1 DM) 1.25 ± 0.03 1.26 ± 0.03 1.10 ± 0.08 1.11 ± 0.06 1.06 ± 0.05 1.08 ± 0.08 1.13 ± 0.05 1.12 ± 0.05
CO2 (mmol g−1 DM) 5.83 ± 0.22 5.86 ± 0.13 5.28 ± 0.29 5.31 ± 0.16 5.00 ± 0.14 5.06 ± 0.31 5.12 ± 0.22 5.38 ± 0.11
CO2 : CH4 ratio 4.67 ± 0.16 4.66 ± 0.08 4.80 ± 0.08 4.81 ± 0.19 4.72 ± 0.20 4.71 ± 0.11 4.53 ± 0.04 4.80 ± 0.18
Data shown are means ± standard deviation. a,b,c For the November cut, means in a given row with different letters are significantly different (p < 0.05).
OM: organic matter; C: carbon; N: nitrogen; NDF: neutral detergent fiber; WSCs: water-soluble carbohydrates; CTs: condensed tannins; IVDMD: in vitro dry matter degradability; DM: dry matter; VFAs: volatile fatty acids.
year 2050 climate scenario. The fact that the control was un- the control in November. This can be related to increases in
der little stress may have limited biomass growth and may leaf area index and canopy photosynthesis linked with higher
explain why no difference was observed between treatments SWC under elevated CO2 as indicated by additional mea-
with and without an ECE, as expected. Although there was surements made in the same experiment (Roy et al., 2016).
no overall effect of elevated CO2 on the plant fractions, we There was no effect of the ECE on aboveground biomass
nevertheless observed a significant increase in green mass for for the November cut, although it had more green tissue and
https://doi.org/10.5194/bg-18-4841-2021 Biogeosciences, 18, 4841–4853, 20214848 V. Niderkorn et al.: Effects of elevated CO2 and extreme climatic events
after an ECE, corresponding to higher recovery under ele-
vated CO2 (Roy et al., 2016).
The lack of significant differences in relative abundances
of functional groups and species can be attributed to the huge
variability in ecosystem responses to elevated CO2 and ECE.
We did, however, observe a notable change due to the high
vulnerability to the ECE of Holcus lanatus, which mostly
disappeared. Volaire et al. (2020) recently showed that sol-
uble carbohydrate metabolism, particularly fructans and su-
crose, plays a role in the lack of Holcus lanatus recovery
from the ECE.
4.2 Elevated CO2 and ECE modify the chemical
composition of aboveground biomass
We observed contrastive effects of elevated CO2 and ECE
on the chemical composition of aboveground biomass. The
lower N concentration under elevated CO2 compared to the
control was shown for all the cutting dates and is consistent
with findings from meta-analyses addressing climate change
effects on grassland (Dumont et al., 2015; Dellar et al., 2018).
Note that this lower N concentration was not accompanied
by significant changes in legume proportions, which could
have been an explanatory factor due to their high N content.
The reduction in N content may therefore reflect a combi-
nation of increased growth and changes in photosynthetic N
use efficiency (Leakey et al., 2009). Even though NDF con-
centration was only affected for the June cut, the NDF : N
ratio increased at elevated CO2 concentrations for all cutting
dates but without a negative impact on pepsin-cellulase OM
digestibility. This parameter could have been affected as a
high concentration of partially digestible fiber (NDF) and a
limiting N concentration can be detrimental for the microbial
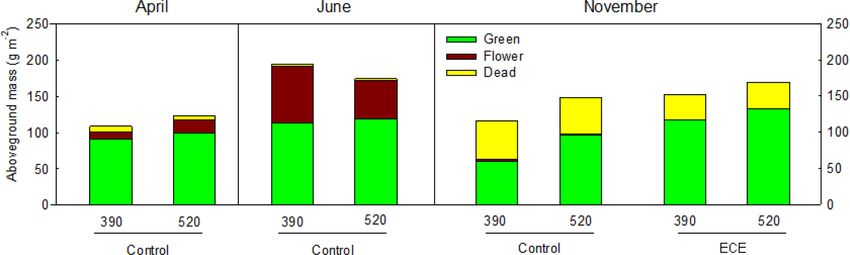
Figure 3. Relative abundance of the 10 most abundant species ecosystem in the rumen (Sinclair et al., 1995). These results
present in the community measured before (April, June) and af- are globally well in line with those described in a recent study
ter (November) the extreme climatic event (ECE) grown under four
on mixed grass prairie (Augustine et al., 2018) and a meta-
climate scenarios: 390 or 520 ppm atmospheric CO2 concentration
analysis on the effects of climate change on pasture quality
without (control) or combined with the ECE. Aspp: Agrostis spp.;
Ae: Arrhenatherum elatius L.; Ap: Alopecurus pratensis L.; Dg: in Europe (Dellar et al., 2018).
Dactylis glomerata L.; Hl: Holcus lanatus L.; Lp: Lolium perenne We observed a clear increase in N concentrations in above-
L.; Pa: Poa angustifolia L.; Pp: Poa pratensis L.; Tf: Trisetum ground biomass from the November cut. ECE-driven dehy-
flavescens L.; Ra: Rumex acetosa L.; Others: < 15 % of species; dration of plant material may have resulted in the asynchrony
n = 3. between plants and soil microbial community functioning.
High plant litter and microbial detritus during the ECE are
both sources of energy for microbial recovery in soil during
less dead tissue compared to the control. This could be at- rehydration, which is faster than in plants (Hofer et al., 2017).
tributed to a strong increase in the shoot N pool driven pri- Microbial mineralization of the OM produces inorganic N
marily by an effect of the ECE on the belowground compart- that plants can only uptake if they have recovered. In addi-
ment (Roy et al., 2016). These authors showed that ECEs tion, it has been shown that the maintenance of root exudates
strongly increased the root N pool, thereby increasing N during drought may be one of the factors that enable above-
availability. The CO2 –ECE interaction suggests that SWC ground recovery, since root functionality ensures increased
before the November cut in the 520 ppm CO2 treatment was N availability (Karlowsky et al., 2018). The flush of N can
reduced with the ECE and was enhanced in the control com- explain the increase in N and sucrose content in the above-
pared to the other treatments. This could be explained by en- ground biomass due to high photosynthesis and transpira-
hanced leaf area index, photosynthesis, greenness and C se- tion indicated by lower SWC (Roy et al., 2016). An increase
questration leading to higher water extraction from the soil in fructose content, as observed here after the ECE, is usu-
Biogeosciences, 18, 4841–4853, 2021 https://doi.org/10.5194/bg-18-4841-2021V. Niderkorn et al.: Effects of elevated CO2 and extreme climatic events 4849
Figure 4. Schematic overview of treatment effects (recovery after an extreme climatic event, ECE, and elevated atmospheric CO2 concen-
tration) on forage quality, digestive use of macronutrients by the ruminant and atmospheric greenhouse gas emissions. WSCs: water-soluble
carbohydrates; N: nitrogen; NDF: neutral detergent fiber (cell wall carbohydrates); AAs: amino acids; VFAs: volatile fatty acids; CH4 :
methane; CO2 : carbon dioxide; NH3 : ammonia; N2 O: nitrous oxide; IVDMD: in vitro dry matter degradability.
ally linked to hydrolysis of fructans (Simpson and Bonnett, amounts of energy and nitrogen for rumen microbial synthe-
1993), but we did not find any significant decrease in fructan sis (Nocek and Russell, 1988).
content in this experiment. These ECE-driven changes led
to a much lower (∼ 50 %) NDF : N ratio than in the control. 4.3 Changes in chemical composition affect rumen
A low NDF : N ratio, in addition to effects on some sugars, fermentation parameters
is particularly beneficial in terms of forage quality, as con-
firmed by higher pepsin-cellulase OM digestibility due to an The changes in chemical composition in aboveground
increase in readily degradable nutrients providing increased biomass following the ECE strongly affected rumen fermen-
tation parameters. The lower NDF content led naturally to in-
creased IVDMD as some fibers, especially lignin, are known
https://doi.org/10.5194/bg-18-4841-2021 Biogeosciences, 18, 4841–4853, 20214850 V. Niderkorn et al.: Effects of elevated CO2 and extreme climatic events
Table 4. Factor effects (p values) on chemical composition and in vitro rumen fermentation parameters of plant communities exposed to two
levels of CO2 concentration (390 and 520 ppm) with or without an extreme climatic event (ECE) at three different cutting dates.
Cut April Cut June Cut November
CO2 effect CO2 effect CO2 effect ECE effect CO2 × ECE effect
Chemical composition
OM 0.033 0.158 0.973 0.989 0.123
C 0.547 0.333 0.299 0.603 0.304
N < 0.001 0.003 0.007 < 0.001 0.346
C : N ratio < 0.001 0.003 0.002 < 0.001 0.425
NDF 0.883 0.018 0.108 0.027 0.175
NDF : N ratio 0.001 0.038 0.002 < 0.001 0.128
WSCs 0.337 0.784 0.112 0.616 0.662
Glucose 0.379 0.170 0.227 0.147 0.303
Sucrose 0.712 0.744 0.198 0.022 0.452
Fructose 0.306 0.262 0.619 0.031 0.473
Fructans 0.261 0.445 0.106 0.986 0.515
Condensed tannins 0.252 0.887 0.495 0.295 0.788
Pepsin-cellulase OM digestibility 0.518 0.808 0.139 0.005 0.903
d.f (num/den) 1/10 1/10 1/8 1/8 1/8
In vitro rumen fermentation parameters
Acidification (dpH) 0.201 0.560 0.007 0.112 0.734
IVDMD 0.041 0.496 0.075 0.001 0.053
NH3 0.014 0.001 0.005 < 0.001 0.882
Total VFA 0.056 0.577 0.256 0.186 0.871
Acetate 0.243 0.427 0.779 0.064 0.237
Propionate 0.107 0.210 0.110 0.008 0.865
Butyrate 0.749 0.956 0.464 0.251 0.121
Valerate 0.016 0.017 0.111 0.004 0.317
Isobutyrate 0.308 0.755 0.063 0.289 0.999
Isovalerate 0.062 0.134 0.111 0.006 0.067
Acetate : propionate ratio 0.151 0.223 0.261 0.013 0.484
Total gas 0.545 0.916 0.308 0.103 0.554
CH4 0.567 0.876 0.908 0.122 0.750
CO2 0.788 0.828 0.225 0.105 0.413
CO2 : CH4 ratio 0.841 0.960 0.181 0.566 0.137
d.f (num/den) 1/10 1/10 1/8 1/8 1/8
OM: organic matter; C: carbon; N: nitrogen; NDF: neutral detergent fiber; WSCs: water-soluble carbohydrates; CTs: condensed tannins; IVDMD: in vitro
dry matter degradability; VFAs: volatile fatty acids; d.f (num/den): degrees of freedom (numerator and denominator). In bold: p < 0.05; in italics:
0.05 < p < 0.1.
to be indigestible (Jung and Allen, 1995). This is consistent related to hydrogen availability and CH4 production in the
with the increase in pepsin-cellulase OM digestibility, a pa- rumen (Russell, 1998). The increase in N concentration after
rameter that is closely correlated with in vivo digestibility the ECE, which may be partly linked to the increase in the
(Aufrère and Michalet-Doreau, 1988). Interestingly, despite abundance of Alopecurus pratensis, also led to an increase in
an increase in IVDMD following the ECE, we did not find ruminal NH3 , which is a main end product of protein degrad-
any of the usually observed increased total gas production, ability through amino acid deamination. The increase in iso-
including CH4 (Getachew et al., 2004). This could mean that valerate with the ECE, which appears to be related to the de-
a potential increase in energy available for the animal was crease in Holcus lanatus abundance, also indicates increased
not accompanied by more energy losses and pollutant emis- protein degradation as this branched-chain VFA results from
sions. This could be due to the changes observed in VFA deamination of branched-chain amino acids such as leucine
profiles (acetate, propionate and valerate) indicating changes (Menahan and Schultz, 1964). Part of the NH3 produced is
in fermentation pathways. In particular, we observed a de- incorporated into the rumen microbial biomass, but the sur-
crease in the acetate : propionate ratio, which is known to be plus is transformed into urea, which gets excreted into the
Biogeosciences, 18, 4841–4853, 2021 https://doi.org/10.5194/bg-18-4841-2021V. Niderkorn et al.: Effects of elevated CO2 and extreme climatic events 4851
environment and thus drives N loss and polluting emissions. produced during the regrowth stage, resulting in higher OM
Indeed, the fraction of urinary N not used by soil microbes digestibility. Taken together, our results point to the NDF : N
and plants is transformed into N2 O, a potent GHG, during ratio as a major driver of forage quality which is highly likely
microbial processes of nitrification and denitrification (Fire- to be affected differently by elevated CO2 and ECE, both
stone et al., 1980). of which will have strong impacts on rumen fermentation.
The changes in chemical composition under elevated CO2 In addition, our results on the CO2 –ECE interaction indicate
affected rumen fermentation parameters in a different man- that elevated CO2 may limit the ECE-driven gain of IVDMD.
ner compared to the ECE. Interestingly, we observed con-
trastive effects according to cutting date. Elevated CO2 de-
creased IVDMD for the April cut but then increased IVDMD Data availability. No data sets were used in this article.
in November following the ECE, resulting in a trend towards
a CO2 –ECE interaction. This could mean that the ECE coun-
teracts the negative effect of elevated CO2 on IVDMD likely Supplement. The supplement related to this article is available on-
due to the decrease in NDF concentration. Note, however, line at: https://doi.org/10.5194/bg-18-4841-2021-supplement.
that we never observed any significant change in VFA pro-
duction, which is one of the main drivers of energetic value
for the animal as VFAs provide more than 70 % of ruminant Author contributions. CPC designed the study, AMB, ALM, AA,
MLD, VN and CPC contributed to the acquisition, analysis and in-
energy supply (Bergman, 1990). For all cutting dates, the de-
terpretation of data. VN wrote the manuscript with contributions
crease in N content in aboveground biomass under elevated from all co-authors.
CO2 led to lower NH3 concentrations in the rumen for the
reasons given above.
Analysis of the correlation matrix (data not shown) Competing interests. The authors declare that they have no conflict
showed a positive correlation between CT content in above- of interest.
ground biomass and CO2 : CH4 ratio in fermentation gas
(r = 0.51, p = 0.002) and negative correlations between CT
content and IVDMD (r = −0.38, p = 0.024) and total VFA Disclaimer. Publisher’s note: Copernicus Publications remains
production (r = −0.40, p = 0.015). The antimethanogenic neutral with regard to jurisdictional claims in published maps and
effect of CTs and the reduction of IVDMD are consistent institutional affiliations.
with the literature (meta-analysis by Jayanegara et al., 2012).
However, in this experiment, mean CT content values were
higher following the ECE compared to the control, but the Acknowledgements. This study benefited from human resources
difference was not significant. (CNRS staff) and technical resources allocated to the ECOTRONS
Figure 4 provides a schematic illustrative overview of the Research Infrastructure and from the French government-sponsored
results obtained in this experiment, showing the impact of “Investissement d’Avenir” funding (AnaEE-France ANR-11-INBS-
0001). We thank the technical staff of INRAE Herbipole and UREP
the ECE and elevated CO2 on ruminant digestive degrada-
groups for extracting the intact soil monoliths; the Ecotron team,
tion of plant macronutrients (carbohydrates and protein). Our Olivier Darsonville, Lionel Thiery and Marine Zwicke for their
findings suggest that the ECE, by increasing aboveground technical help during this experiment; Didier Macheboeuf for his
biomass N content, increased N metabolism in the rumen, expertise in in vitro rumen fermentation; and Pierre-Jean Hau-
probably with a positive effect on rumen microbial synthesis. pais for his contribution to soluble carbohydrate analysis. Angela
This, along with the lower in-plant NDF content and higher Augusti and Marie-Lise Benot received post-doctorate positions
sucrose and fructose contents, may explain the observed in- through an INRAE scientific package (2010–2014). Angela Augusti
crease in IVDMD. In contrast, the elevated atmospheric CO2 was also supported by the European FP7 ExpeRT Transnational Ac-
concentration reduced aboveground biomass N content and cess program.
ruminal N metabolism, thereby resulting in a negative impact
on IVDMD.
Financial support. This research has been supported by the FP7
in Food, Agriculture and Fisheries and Biotechnology (Animal
Change project; grant no. 266018). This study was supported by the
5 Conclusions
European Community FP7 funding (Animal Change project, grant
agreement number 266018, 2007–2013) and an ANR project grant
This study shows that different drivers of climate change, i.e. (VALIDATE).
elevated atmospheric CO2 concentration and ECEs (drought
and heat wave), have contrastive impacts on forage quality
through their effects on plant characteristics. An ECE was Review statement. This paper was edited by Paul Stoy and re-
followed by an increase in greenness and in N and water- viewed by two anonymous referees.
soluble carbohydrate contents in the aboveground biomass
https://doi.org/10.5194/bg-18-4841-2021 Biogeosciences, 18, 4841–4853, 20214852 V. Niderkorn et al.: Effects of elevated CO2 and extreme climatic events
References Grabber, J. H., Zeller, W. E., and Mueller-Harvey, I.: Acetone en-
hances the direct analysis of procyanidin-and prodelphinidin-
Andueza, D., Rodrigues, A. M., Picard, F., Rossignol, N., Bau- based condensed tannins in Lotus species by the butanol–
mont, R., Cecato, U., and Farruggia, A.: Relationships between HCl–iron assay, J. Agr. Food Chem., 61, 2669–2678,
botanical composition, yield and forage quality of permanent https://doi.org/10.1021/jf304158m, 2013.
grasslands over the first growth cycle, Grass Forage Sci., 71, Goering, H. K. and Van Soest, P. J.: Forage Fiber Analyses (Ap-
366–378, https://doi.org/10.1111/gfs.12189, 2016. paratus, Reagents, Procedures, and Some Applications), Agric.
Aufrere, J. and Michalet-Doreau, B.: Comparison of methods for Handbook No. 379.ARS-USDA, Washington, DC, 1970.
predicting digestibility of feeds, Anim. Feed Sci. Tech., 20, 203– Herrero, M., Havlík, P., Valin, H., Notenbaert, A., Rufino, M. C.,
218, https://doi.org/10.1016/0377-8401(88)90044-2, 1988. Thornton, P. K., Blümmel, M., Weiss, F., Grace, D.,
Augustine, D. J., Blumenthal, D. M., Springer, T. L., LeCain, D. R., and Obersteiner, M.: Biomass use, production, feed effi-
Gunter, S. A., and Derner, J. D.: Elevated CO2 induces sub- ciencies, and greenhouse gas emissions from global live-
stantial and persistent declines in forage quality irrespective stock systems, P. Natl. Acad. Sci. USA, 110, 20888–20893,
of warming in mixedgrass prairie, Ecol. Appl., 28, 721–735, https://doi.org/10.1073/pnas.1308149110, 2013.
https://doi.org/10.1002/eap.1680, 2018. Herrero, M., Henderson, B., Havlík, P., Thornton, P. K., Co-
Benot, M. L., Morvan-Bertrand, A., Mony, C., Huet, J., Sulmon, C., nant, R. T., Smith, P., Wirsenius, S., Hristov, A. N., Ger-
Decau, M. L., Prud’Homme, M. P., and Bonis, A.: Grazing ber, P., Gill, M., Butterbach-Bahl, K., Valin, H., Gar-
intensity modulates carbohydrate storage pattern in five grass nett, T., and Stehfest, E.: Greenhouse gas mitigation poten-
species from temperate grasslands, Acta Oecol., 95, 108–115, tials in the livestock sector, Nat. Clim. Change, 6, 452–461,
https://doi.org/10.1016/j.actao.2018.11.005, 2019. https://doi.org/10.1038/nclimate2925, 2016.
Bergman, E. N.: Energy contributions of volatile fatty acids from Hofer, D., Suter, M., Buchmann, N., and Lüscher, A.: Ni-
the gastrointestinal tract in various species, Physiol. Rev., 70, trogen status of functionally different forage species
567–590, https://doi.org/10.1152/physrev.1990.70.2.567, 1990. explains resistance to severe drought and post-drought
Boé, J., Terray, L., Habets, F., and Martin, E.: A simple statistical- overcompensation, Agr. Ecosyst. Environ., 236, 312–322,
dynamical downscaling scheme based on weather types and https://doi.org/10.1016/j.agee.2016.11.022, 2017.
conditional resampling, J. Geophys. Res.-Atmos., 111, D23, INRA: INRA feeding system for ruminants, Wageningen Academic
https://doi.org/10.1029/2005JD006889, 2006. Publishers, Wageningen, NLD, 2018.
Ciais, P., Reichstein, M., Viovy, N., Granier, A., Ogée, J., Al- IPCC: Working group I contribution to the fifth assessment re-
lard, V., Buchmann, N., Aubinet, M., Bernhofer, C., Car- port of the intergovernmental panel on climate change, in: Cli-
rara, A., Chevallier, F., De Noblet, N., Friend, A., Friedling- mate Change 2013 – The Physical Science Basis by Intergov-
stein, P., Grünwald, T., Heinesch, B., Keronen, P., Knohl, A., ernmental Panel on Climate Change, edited by: Stocker, T. F.,
Krinner, G., Loustau, D., Manca, G., Matteucci, G., Migli- Qin, D., Plattner, G. K., Tignor, M., Allen, S. K., Boschung, J.,
etta, F., Ourcival, J. M., Pilegaard, K., Rambal, S., Seufert, G., Nauels, A., Xia, Y., Bex, V., and Midgley, P. M., Cambridge
Soussana, J. F., Sanz, M. J., Schulze, E. D., Vesala, T., and University Press, Cambridge, UK and New York, NY, USA,
Valentini, R.: Europe-wide reduction in primary productivity https://doi.org/10.1017/CBO9781107415324, 2013.
caused by the heat and drought in 2003, Nature, 437, 529–533, Jayanegara, A., Leiber, F., and Kreuzer, M.: Meta-analysis of the
https://doi.org/10.1038/nature03972, 2005. relationship between dietary tannin level and methane formation
Dellar, M., Topp, C. F. E., Banos, G., and Wall, E.: A meta- in ruminants from in vivo and in vitro experiments, J. Anim.
analysis on the effects of climate change on the yield and qual- Physiol. An. N., 96, 365–375. https://doi.org/10.1111/j.1439-
ity of European pastures, Agr. Ecosyst. Environ., 265, 413–420, 0396.2011.01172.x, 2012.
https://doi.org/10.1016/j.agee.2018.06.029, 2018. Jung, H. G. and Allen, M. S.: Characteristics of plant cell walls af-
Dumont, B., Andueza, D., Niderkorn, V., Lüscher, A., fecting intake and digestibility of forages by ruminants, J. Anim.
Porqueddu, C., and Picon-Cochard, C.: A meta-analysis of Sci., 73, 2774–2790, https://doi.org/10.2527/1995.7392774x,
climate change effects on forage quality in grasslands: specifici- 1995.
ties of mountain and Mediterranean areas, Grass Forage Sci., 70, Karlowsky, S., Augusti, A., Ingrisch, J., Akanda, M. K. U.,
239–254, https://doi.org/10.1111/gfs.12169, 2015. Bahn, M., and Gleixner, G.: Drought-induced accumulation
Firestone, M. K., Firestone, R. B., and Tiedje, J. M.: Ni- of root exudates supports post-drought recovery of microbes
trous oxide from soil denitrification: factors control- in mountain grassland, Front. Plant Sci., 9, 1593, 1–16,
ling its biological production, Science, 208, 749–751, https://doi.org/10.3389/fpls.2018.01593, 2018.
https://doi.org/10.1126/science.208.4445.749, 1980. Leakey, A. D., Ainsworth, E. A., Bernacchi, C. J., Rogers, A.,
Gerber, P. J., Steinfeld, H., Henderson, B., Mottet, A., Opio, C., Di- Long, S. P., and Ort, D. R.: Elevated CO2 effects on
jkman, J., Falcucci, A., and Tempio, G.: Tackling climate change plant carbon, nitrogen, and water relations: six impor-
through livestock: a global assessment of emissions and miti- tant lessons from FACE, J. Exp. Bot., 60, 2859–2876,
gation opportunities, Food and Agriculture Organization of the https://doi.org/10.1093/jxb/erp096, 2009.
United Nations (FAO), Rome, 2013. Lee, M. A., Davis, A. P., Chagunda, M. G. G., and Manning, P.: For-
Getachew, G., Robinson, P. H., DePeters, E. J., and Taylor, S. J.: Re- age quality declines with rising temperatures, with implications
lationships between chemical composition, dry matter degrada- for livestock production and methane emissions, Biogeosciences,
tion and in vitro gas production of several ruminant feeds, Anim. 14, 1403–1417, https://doi.org/10.5194/bg-14-1403-2017, 2017.
Feed Sci. Tech., 111, 57–71, https://doi.org/10.1016/S0377-
8401(03)00217-7, 2004.
Biogeosciences, 18, 4841–4853, 2021 https://doi.org/10.5194/bg-18-4841-2021V. Niderkorn et al.: Effects of elevated CO2 and extreme climatic events 4853
Menahan, L. A. and Schultz, L. H.: Metabolism of leucine Roy, J., Picon-Cochard, C., Augusti, A., Benot, M. L., Thiery, L.,
and valine within the rumen, J. Dairy Sci., 47, 1080–1085, Darsonville, O., Landais, D., Piel, C., Defossez, M., De-
https://doi.org/10.3168/jds.S0022-0302(64)88849-4, 1964. vidal, S., Escape, C., Ravel, O., Fromin, N., Volaire, F.,
Nakicenovic, N., Alcamo, J., Grubler, A., Riahi, K., Roehrl, R. A., Milcu, A., Bahn, M., and Soussana, J. F.: Elevated CO2 main-
Rogner, H. H., and Victor, N.: Special report on emissions sce- tains grassland net carbon uptake under a future heat and
narios (SRES), a special report of Working Group III of the in- drought extreme, P. Natl. Acad. Sci. USA, 113, 6224–6229,
tergovernmental panel on climate change, Cambridge University https://doi.org/10.1073/pnas.1524527113, 2016.
Press, UK, 2000. Russell, J. B.: The importance of pH in the regulation of ruminal
Niderkorn, V., Baumont, R., Le Morvan, A., and Macheboeuf, D.: acetate to propionate ratio and methane production in vitro, J.
Occurrence of associative effects between grasses and legumes in Dairy Sci., 81, 3222–3230, https://doi.org/10.3168/jds.S0022-
binary mixtures on in vitro rumen fermentation characteristics, J. 0302(98)75886-2, 1998.
Anim. Sci., 89, 1138–1145, https://doi.org/10.2527/jas.2010- Sinclair, L. A., Garnsworthy, P. C., Newbold, J. R., and But-
2819, 2011. tery, P. J.: Effects of synchronizing the rate of dietary
Nisbet, E. G., Manning, M. R., Dlugokencky, E. J., Fisher, R. E., energy and nitrogen release in diets with a similar carbo-
Lowry, D., Michel, S. E., Lund Myhre, C., Platt, S. M., hydrate composition on rumen fermentation and microbial
Allen, G., Bousquet, P., Brownlow, R., Cain, M., France, J. L., protein synthesis in sheep, J. Agric. Sci., 124, 463–472,
Hermansen, O., Hossaini, R., Jones, A. E., Levin, I., Man- https://doi.org/10.1017/S0021859600073421, 1995.
ning, A. C., Myhre, G., Pyle, J. A., Vaughn, B. H., War- Simpson, R. J. and Bonnett, G. D.: Fructan exohy-
wick, N. J., and White, J. W. C.: Very strong atmospheric drolase from grasses, New Phytol., 123, 453–469,
methane growth in the 4 years 2014–2017: Implications for https://doi.org/10.1111/j.1469-8137.1993.tb03757.x, 1993.
the Paris Agreement, Glob. Biogeochem. Cy., 33, 318–342, Theodorou, M. K., Williams, B. A., Dhanoa, M. S., McAllan, A. B.,
https://doi.org/10.1029/2018GB006009, 2019. and France, J.: A simple gas production method using a
Nocek, J. E. and Russell, J.: Protein and energy as an inte- pressure transducer to determine the fermentation kinetics
grated system. Relationship of ruminal protein and carbohy- of ruminant feeds, Anim. Feed Sci. Tech., 48, 185–197,
drate availability to microbial synthesis and milk production, J. https://doi.org/10.1016/0377-8401(94)90171-6, 1994.
Dairy Sci., 71, 2070–2107, https://doi.org/10.3168/jds.S0022- Thornton, P. K. and Herrero, M.: Potential for reduced methane and
0302(88)79782-9, 1988. carbon dioxide emissions from livestock and pasture manage-
Park, G., Oh, H., and Ahn, S.: Improvement of the am- ment in the tropics, P. Natl. Acad. Sci. USA, 107, 19667–19672,
monia analysis by the phenate method in water and https://doi.org/10.1073/pnas.0912890107, 2010.
wastewater, B. Korean Chem. Soc., 30, 2032–2038, Tilman, D. and Clark, M.: Global diets link environmen-
https://doi.org/10.5012/bkcs.2009.30.9.2032, 2009. tal sustainability and human health, Nature, 515, 518–522,
Planton, S., Déqué, M., Chauvin, F., and Terray, L.: https://doi.org/10.1038/nature13959, 2014.
Expected impacts of climate change on extreme Van Soest, P. J., Robertson, J. B., and Lewis, B. A.: Methods for
climate events, C. R. Geosci., 340, 564–574, dietary fiber, neutral detergent fiber, and nonstarch polysaccha-
https://doi.org/10.1016/j.crte.2008.07.009, 2008. rides in relation to animal nutrition, J. Dairy Sci., 74, 3583–3597,
Rossignol, N., Andueza, D., Carrère, P., Cruz, P., Duru, M., https://doi.org/10.3168/jds.S0022-0302(91)78551-2, 1991.
Fiorelli, J. L., Michaud, A., Plantureux, S., Pottier, E., and Bau- Volaire F., Morvan-Bertrand, A., Prudhomme, M. P., Benot, M. L.,
mont, R.: Assessing population maturity of three perennial grass Augusti, A., Zwicke, M., Roy, J., Landais, D., and Picon-
species: influence of phenology and tiller demography along lati- Cochard, C.: Non-structural carbohydrate metabolism drives
tudinal and altitudinal gradients, Grass Forage Sci., 69, 534–548, the resilience of perennial grass species after extreme summer
https://doi.org/10.1111/gfs.12067, 2014. drought and heat under elevated CO2 , J. Exp. Bot., 71, 370–385,
https://doi.org/10.1093/jxb/erz424, 2020.
Wolf, J., Asrar, G. R., and West, T. O.: Revised methane
emissions factors and spatially distributed annual carbon
fluxes for global livestock, Carbon Balance Manag., 12, 16,
https://doi.org/10.1186/s13021-017-0084-y, 2017.
https://doi.org/10.5194/bg-18-4841-2021 Biogeosciences, 18, 4841–4853, 2021You can also read