The Status of Irish Salmon Stocks in 2020 with Catch Advice for 2021 - Report of the Technical Expert Group on Salmon to the North-South Standing ...
←
→
Page content transcription
If your browser does not render page correctly, please read the page content below
Report of the Technical Expert Group on Salmon
                      to the
 North-South Standing Scientific Committee for
                 Inland Fisheries

  The Status of Irish Salmon Stocks in 2020
        with Catch Advice for 2021

                 January 2021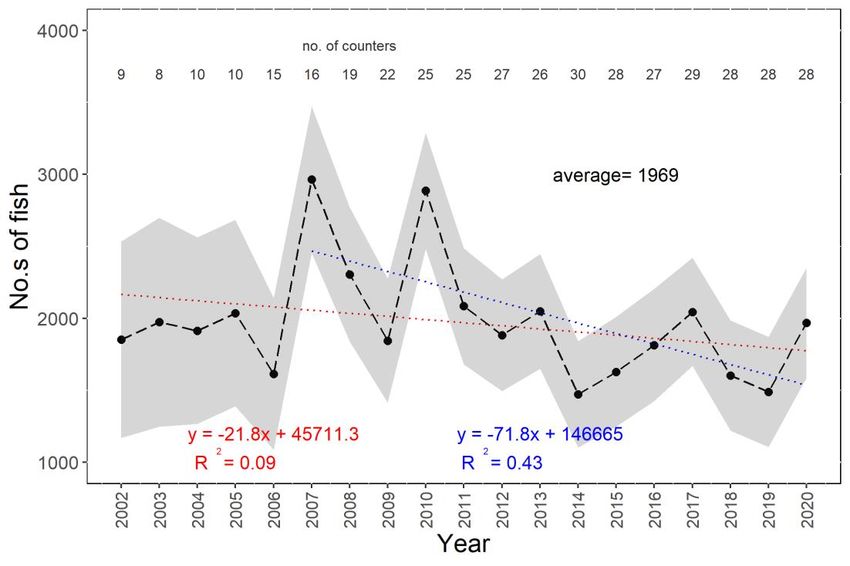
Citation

Gargan, P., Fitzgerald, C., Kennedy, R., Maxwell, H., McLean, S. and Millane, M. (2021).
The Status of Irish Salmon Stocks in 2020 with Catch Advice for 2021. Report of the
Technical Expert Group on Salmon (TEGOS) to the North-South Standing Scientific
Committee for Inland Fisheries. 53 pp.
1 Executive summary .................................................................................................................5
2 Introduction ...............................................................................................................................6
2.1 Terms of reference for the operation of the Technical Expert Group on
Salmon (TEGOS) ........................................................................................................... 6
2.2 Scope of report............................................................................................................. 7
3 The status of Irish salmon stocks in 2020 with catch advice for 2021 ............................8
3.1 Assessment methodology for 2021 catch advice ...............................................10
3.1.1 Commercial catch data ......................................................................................11
3.1.2 Rod catch data .....................................................................................................11
3.1.3 Total traps and counters ......................................................................................11
3.1.4 National Coded-wire Tagging and Tag Recovery Programme ...................14
3.1.5 Catchment-wide electro-fishing.........................................................................14
3.2 Status of individual rivers relative to conservation limits .....................................14
3.2.1 Estimating the total catch in each river ............................................................15
3.2.2 Estimating the returns of adult salmon in each river using rod exploitation
rates ........................................................................................................................15
3.3 Provision of harvest guidelines .................................................................................16
4 Overview of status of stocks and precautionary catch advice for 2021 ....................18
5 Mixed-stock commercial fisheries advice .......................................................................34
5.1 Killary Harbour .............................................................................................................34
5.2 Tullaghan Bay ..............................................................................................................34
5.3 Castlemaine Harbour ................................................................................................35
6 Recent trends in salmon stock status .................................................................................36
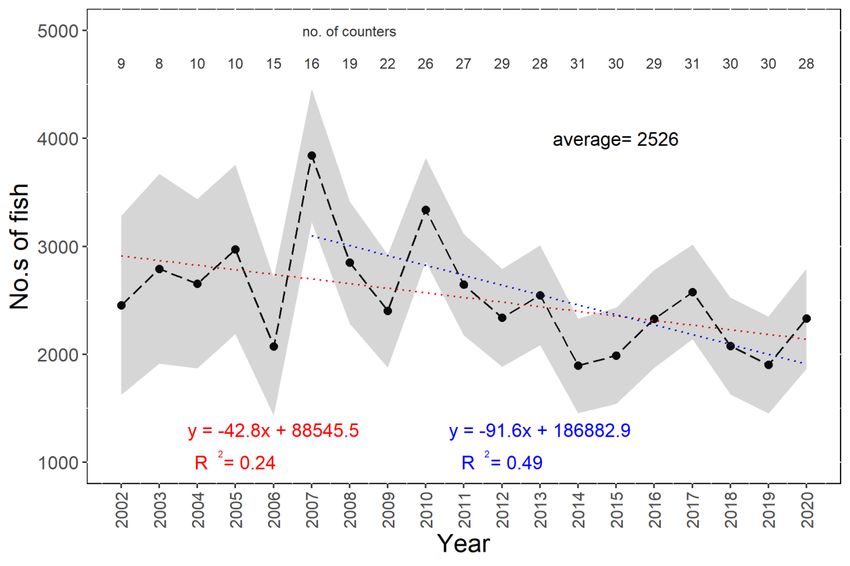
6.1 Fish counter time series..............................................................................................36
6.2 National returns and estimates of spawners relative to CL attainment ..........38
6.2.1 One-sea-winter returns and spawners ...............................................................39
6.2.2 Multi-sea-winter returns and spawners ..............................................................39
6.2.3 Stock forecast (to 2021)........................................................................................40
7 Advice for stock rebuilding ..................................................................................................41
7.1 International guidance on stock rebuilding .........................................................41
7.2 Factors affecting stock rebuilding programmes for Irish salmon stocks ..........43
7.2.1 Marine survival ........................................................................................................43
8 Changes to assessments in future years ...........................................................................46
9 Conclusions .............................................................................................................................47
10 References...............................................................................................................................48
11 Appendices .............................................................................................................................50
Appendix I. Members of the The Technical Expert Group on Salmon (TEGOS)
2020/2021 ....................................................................................................................50
Appendix II. Rivers assessed by the TEGOS where salmon have a qualifying interest
       in Special Areas of Conservation and status relative to CL in 2021. ...............51
Appendix III. Summary results from the catchment-wide electro-fishing programme
       in 2020. .........................................................................................................................53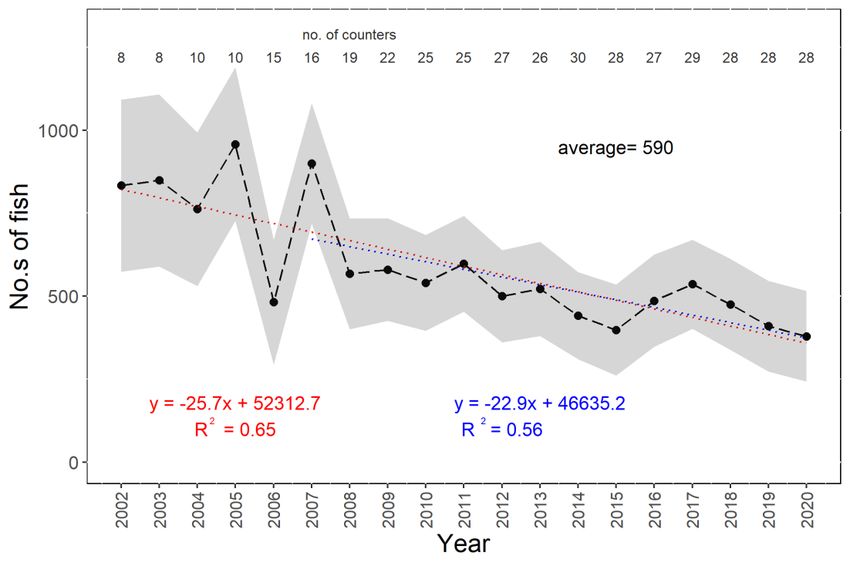
1 Executive summary
The Technical Expert Group on Salmon (TEGOS) advises that in 2021:
48 rivers have an advised harvestable surplus as they are exceeding their
conservation limits (CLs).
A further 32 rivers, may be opened on a catch and release only basis, subject
to IFI management criteria based on having a high probability of achieving
50% of their conservation limit (CL) or exceeding the management qualifying
fry threshold of ≥15 fry (0+) per 5 minute electrofishing (multiple site catchment
average).
In addition 64 rivers are (a) failing to meet 50% of their CL or (b) recent data to
determine their CL attainment status are lacking. Where there is a lack of
data, or where catchment-wide electro-fishing surveys indicate juvenile
abundance below the fry threshold, the TEGOS assumes that these rivers are
failing to meet CL.
There are 16 rivers for which there are significant fisheries on the MSW (spring salmon)
component of the stock and a separate assessment is made. Of these:
11 have an advised harvestable surplus as they are exceeding their CL.
5 rivers may be opened on a catch and release-only basis subject to IFI
management criteria as they have a high probability of achieving 50% of their
CL or exceed the minimum mean fry threshold (≥15 fry) in catchment-wide
electro-fishing.
There are currently 40 rivers or river tributaries of the 144 salmon rivers assessed in
Special Areas of Conservation (SACs) where salmon have a qualifying interest under
the EU Habitats Directive. Of these, only 20 are above their CL.
5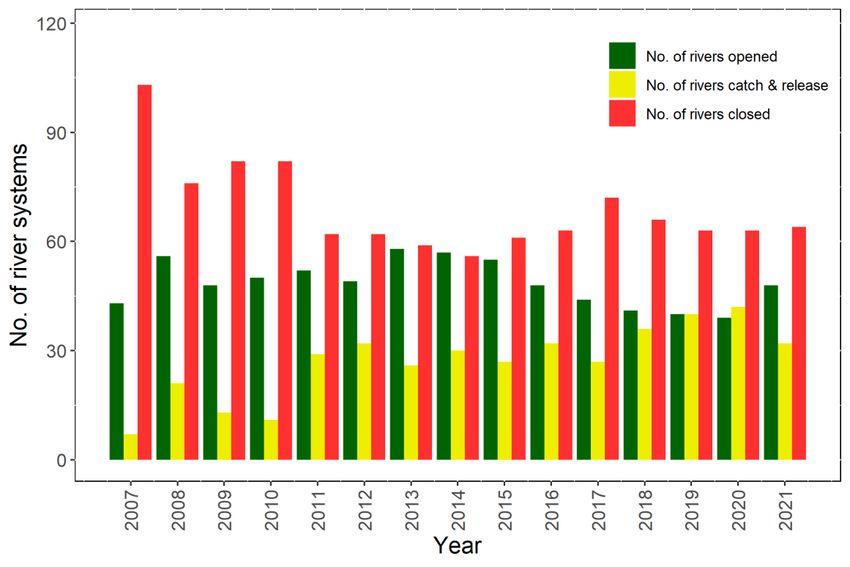
2     Introduction
The North-South Standing Scientific Committee for Inland Fisheries (NSSSCIF) was
formed in early 2018 to support the provision of scientific advice relating to the
conservation and sustainable exploitation of the inland fisheries resource with advice
provided in response to requests from the Department of Communications, Climate
Action and Environment (DCCAE) and its agency Inland Fisheries Ireland (IFI) from
Ireland (IRL), the Department of Agriculture, Environment and Rural Affairs (DAERA)
from Northern Ireland (NI) and the Loughs Agency (LA) a North-South Implementation
Body. This group was also tasked to give consideration to the co-ordination and
effective use of scientific resources for data collection and research projects linked to
the above. The NSSSCIF Terms of Reference (ToRs) facilitates the formation of Expert
Groups drawn from within the membership of the Committee, or additional invitees as
required, to advise and contribute on any particular species, aquatic habitat or
biosecurity issues. To this end, the NSSSCIF has established an expert group to provide
scientific advice to guide the NSSSCIF and IFI management in the decisions and policy
development relating to salmon.

2.1    Terms of reference for the operation of the Technical Expert Group on
       Salmon (TEGOS)
This document outlines the ToRs for the establishment of a Technical Expert Group on
Salmon (TEGOS) to support the NSSSCIF with scientific advice on salmon stock status to
support IFI with the management of salmon stocks.

Purpose
The NSSSCIF requests the TEGOS to provide an annual report (on the status of salmon
stocks, as outlined in Appendix A, for the purpose of advising the NSSSCIF on the
sustainable management of Irish salmon stocks. The NSSSCIF may also request the
TEGOS to offer scientific advice on the implications of proposed management
decisions or policies on salmon or seek advice on scientific matters in relation to
salmon. All scientific advice provided by TEGOS will be considered by the NSSSCIF and
presented as independent advice.

Appendix A:
For the purpose of advising the NSSSCIF, the TEGOS shall estimate the overall
abundance of salmon returning to rivers in the State with reference of river-specific
conservations limits (CLs). The TEGOS shall carry out an assessment of salmon stocks
using internationally accepted best scientific practice which should demonstrate
whether:

                                           6
a. conservation limits are being or likely to be attained on an
individual river basis; and
b. favourable conservation status is being attained within Special
Areas of Conservation (SACs) and nationally as required under the
Habitats Directive or otherwise.
The assessment shall take account of mixed-stock fishing on salmon stocks including
the potential effects on freshwater salmon populations from rivers other than those
targeted. In cases where stocks are determined to be below CLs, the TEGOS shall
advise the level to which catches should be reduced or other measures adopted on
a fishery basis in order to ensure a high degree of probability of meeting the CLs. The
TEGOS shall respond to the NSSSCIF relating to specific requests for scientific advice
using best international practice. The TEGOS shall provide the NSSSCIF with an
independent annual report, which contains the following information:
a) an annual overview of the status of Irish salmon stocks on an
individual river basis.
b) catch advice with an assessment of risks associated with the
objective of meeting conservation limits in all rivers.
c) upon request an evaluation of the effects on salmon stocks and
fisheries of management measures or policies.
d) upon request from the NSSSCIF, report on specific scientific advice
relating to salmon conservation.
2.2 Scope of report
The purpose of this report is to provide IFI with the technical and scientific information
required in order to meet its ToRs. This includes information on Irish salmon stocks, the
current status of these stocks relative to the objective of meeting biologically
referenced “conservation limits” and the catch advice which will allow for a
sustainable harvest of salmon in the forthcoming fishing season and into the future.
73 The status of Irish salmon stocks in 2020 with catch advice for 2021
The conservation limit (CL) applied by the Technical Expert Group on Salmon (TEGOS)
to establish the status of individual stocks is the “maximum sustainable yield” (MSY)
also known as the stock level that maximises the long-term average surplus, as
defined and used by the International Council for the Exploration of the Sea (ICES)
and the North Atlantic Salmon Conservation Organisation (NASCO). The methodology
for establishing CLs was modified for the 2013 catch advice by the former Standing
Scientific Committee on Salmon (SSCS) by deriving new estimates of fecundity,
average weights, sex and age ratio for Irish index rivers. Similarly, new wetted areas
were derived based on a more robust statistical approach and these were also
incorporated into the assessment for 2013. Therefore, on the basis of these
modifications and the best information available on catches, counts or other
estimates and application of a forecast model to these data, the TEGOS advises that
in 2021:
48 rivers have an advised harvestable surplus as they are exceeding their CLs
(Figure 1).
A further 32 rivers, may be opened on a catch and release-only (C&R-only)
basis, subject to IFI management criteria based on having a high probability
of achieving 50% of their CL or exceeding the management qualifying fry
threshold of ≥ 15 fry (0+) per 5 minute electro-fishing (multiple site catchment
average).
In addition 64 rivers are (a) failing to meet 50% of their CL or (b) recent data to
determine their CL attainment status are lacking. Where there is a lack of
data, or where catchment-wide electro-fishing surveys indicate juvenile
abundance below the fry threshold, it is assumed that these rivers are failing to
meet CL.
There are 16 rivers for which there are significant fisheries on the MSW (spring salmon)
component of the stock and a separate assessment is made. Of these:
11 have an advised harvestable surplus as they are exceeding their CLs.
5 rivers may be opened on a C&R-only basis subject to IFI management
criteria as they are they have a high probability of achieving 50% of their CL or
exceeding the minimum fry threshold (15 fry) in catchment-wide electro-
fishing.
8Amongst the stocks being assessed are 57 river stocks where no rod catch data has
been available since 2006 and the most recent annual average rod catch (2002-
2006) has been less than 10 salmon, making a direct assessment difficult. Although
these are insignificant fisheries (accounting for less than 0.5% of the total national rod
catch when combined), their stocks are important as spawning populations in their
own right, which must be maintained as constituent elements of biodiversity, as
required under the EU Habitats Directive. Because there is no recent means of direct
salmon stock assessment on these rivers, the TEGOS have not provided an assessment
of CL attainment on these rivers for the 2021 advice. The TEGOS advise that these
rivers remain closed until additional information is made available to assess stock
status relative to their CLs. In effect, this means that stocks in 87 salmon rivers are
assessed annually.
Despite the considerable reductions in commercial catches, following the closure of
the mixed-stock fishery at sea in 2007, only 55% of Ireland’s 87 assessed salmon rivers
are currently estimated to be meeting biologically-based CLs. While 32 more rivers
could open for C&R-only angling, as assessments indicate relatively high juvenile
abundances or the stocks are meeting ≥50% of CL, it is clear the overall proportion of
Irish rivers with good population status is low.
Figure 1 Summary of status of stocks and scientific catch advice provided between
2007 and 2021.
9Of the 144 rivers being assessed, there are currently 40 rivers or river tributaries in SACs
where salmon have a qualifying interest under the EU Habitats Directive. Of these,
only 20 are above their CL (Appendix II). In addition, there are stocks in four major
rivers used for hydro-power which have been assessed as being below their CLs
above the impoundments i.e. Upper Liffey (Dublin), Upper Lee (Cork), Upper Shannon
(Limerick) and the River Erne (Table 6) and following the scientific advice already
provided for other rivers, there should be no harvest fisheries on wild salmon in these
specific rivers. It is also recognised however, that the release of hatchery-reared
salmon has resulted in fishery opportunities within these rivers for these stocks.
Restoration programmes should therefore be given precedence until such time as
significant improvements to the generation of self-sustaining runs of salmon above
these impoundments has been made within the context of agreed restoration plans.
3.1 Assessment methodology for 2021 catch advice
There was no change in principle to the methodology used to provide catch advice
in 2020 for the 2021 season. A summary of the approach is shown below in Figure 2.
In-river or estuarine measures of abundance are used (i.e. fish counter data and
rod/net catch data) to provide a primary measure of spawning stocks and
attainment of CLs. For the 2012 analyses for 2013 advice, river-specific CLs were
updated and these updated CLs will apply in future years. Updates are detailed in the
relevant sections below.
Figure 2 The scientific process for catch advice from 2006 to present.
10With the operation of fisheries restricted to estuaries and rivers from 2007, the
assessment is now focused primarily on estimating individual river returns from catch
data, counter data (if available) and ranges of rod catch exploitation rates derived
from observed values in Irish rivers in recent years.
A more comprehensive description of the data used and the assessment in 2020 for
the 2021 fishery is provided in the relevant sections below. Every effort is made to
obtain relevant data and monitor the performance of stocks (attainment of CL) at the
river level and consequently to assess the status of individual riverine stocks. Several
sources of information are used in this process.
3.1.1 Commercial catch data
Despite the closure of the mixed-stock fisheries, the catch statistics derived from the
estuarine commercial fisheries (draft nets & snap nets) will remain an important source
of quantitative information if fished, particularly in determining the overall size of the
returning stock and the attainment of river CLs. Following implementation of the wild
salmon and sea trout tagging scheme which commenced in 2001 (Ó Maoiléidigh et
al., 2001; Anon 2004), the catch data are derived from the logbook returns of
commercial fishermen. Reporting rates are at 100% from this fishery.
3.1.2 Rod catch data
The reported rod catch from the wild salmon and sea trout tagging scheme was
adjusted to take into account the numbers of fish that have been caught by anglers
who have not returned their logbook. The adjustment follows Small (1991). In some
instances, directly reported rod catches from IFI Regional Fisheries officers or rod catch
data from managed fisheries (private owners who maintain reliable records), provided
these have been vouched for by IFI officers, have also been used. Angling logbook
returns have seen a steady return rate averaging around 70% in recent years.
However, the 2018 and 2019 logbook returns dipped to c. 57%.
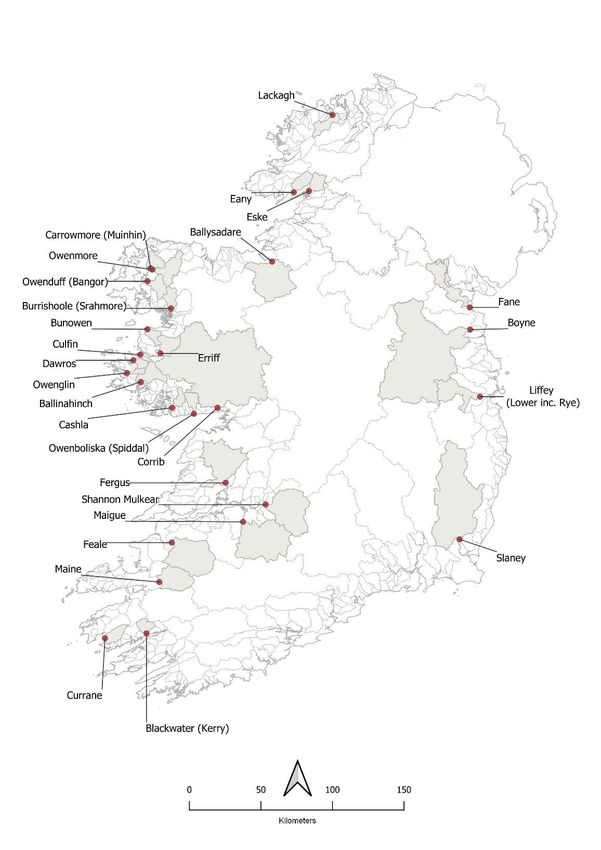
3.1.3 Total traps and counters
Data are available from 29 fish counters (see below) and two salmon traps
(Burrishoole River, Bangor District and Erriff river, Ballinakill District). Values for October
to December were extrapolated from the mean of the previous five years where
appropriate. Any further information received which indicated changes to previous
catch or counter estimates were incorporated where indicated by IFI.
11Figure 3 Fish counters used in the stock assessment for the 2021 advice.
Fish counter data are provided by IFI and ESB/Marine Institute and some private fishery
owners. In total, counts from 31 fish counters and traps were used in 2020 assessments
for 2021 advice, an increase of 11 counters on the 2011 – 2012 assessment (Figure 3).
These are the: Boyne (Drogheda District); Lower Liffey and Upper Liffey US Leixlip
(Dublin District); Slaney (Wexford), Upper Lee (Cork District); Kerry Blackwater,
Waterville/Currane and Maine (Kerry District), Feale, Fergus, Mulkear, Maigue and
Shannon Upstream Ardnacrusha/Parteen (Limerick District); Corrib (Galway District);
Boulisce, Casla and Ballynahinch (Connemara District), Owenglin, Dawros, Culfin, Erriff,
12and Bunowen (Ballinakill District); Burrishoole traps, Owenduff, Owenmore and
Carrowmore (Bangor District); Ballysadare (Sligo District), Erne, Eske and Eany
(Ballyshannon District and Lackagh (Letterkenny District).
The following approach has been adopted in interpreting the count data and utilising
these to measure the attainment of CL:
Fish are initially separated into salmon & sea trout by signal strength generated
by the fish passing the counting electrodes and video images.
A process of validation of the numbers of salmon and sea trout is carried out
during the year whereby a proportion of the counter data (usually 15-20%) is
examined in relation to contemporaneous video footage (resistivity counters)
or self-generated infra-red images (infra-red counters).
The initial numbers of salmon and sea trout are corrected after video
verification and this correction factor is applied to the remainder of the data.
It is assumed that all of the downstream counts up to the end of May represent
out-migrating kelts i.e. fish ascending the river in the previous year (except for
the Corrib, Erriff, Lee, Shannon and Erne counters).
The downstream count from June to December is then subtracted from the
upstream count in the same period, correcting for fish counted upstream but
which may then come back downstream.
The estimated upstream run of fish from the counter is corrected to include
salmon caught and killed downstream of the counter and excludes salmon
caught and killed above the counter.
Raising factors may be applied to those counters where the possibility of fish
moving over the weir without being counted has been reported, the recorded
count is raised by a further percentage depending on observations. However,
it is essential that these observations are based on assessments carried out by
local fisheries authorities or the agencies involved in salmon stock assessment.
The Dee (non-operational in 2020), Boyne, Corrib and Slaney counts are raised
by a factor of two to allow for the partial nature of these counts.
In the case of the River Slaney where the proportion of MSW salmon to grilse is
much higher than most other rivers in Ireland, a specific analysis was carried
out which allows the numbers of grilse and MSW salmon to be allocated over
the season with greater precision than in previous assessments based on scale
analyses.
13 Where counters are used, the CL relates to the area above the counter. In the
event that the count is above or below CL, it is assumed that the overall stock
is above or below CL.
3.1.4 National Coded-wire Tagging and Tag Recovery Programme
This programme provides an index of marine survival over a long time period and
information on exploitation rates in marine and freshwater fisheries. Despite the closure
of the mixed-stock fisheries in 2007, information from this programme will continue to
inform on marine survival rates and exploitation in some estuarine and rod fisheries
and more importantly indicates whether fluctuations in the numbers of returning adults
are as a result of management measures or changes in factors occurring outside of
management control i.e. environmental/climate changes. The most recent trends in
marine survival are shown in Section 7.2.1.
3.1.5 Catchment-wide electro-fishing
Information on juvenile salmon abundance indices derived from catchment-wide
electro-fishing surveys carried out annually by IFI are examined to indicate stock
status. This information is used primarily where new information has not been available
for rod catches. A summary of the 2020 programme is provided in Appendix III.
3.2 Status of individual rivers relative to conservation limits
In line with international advice on salmon stocks, the TEGOS advise that the best way
to meet national and international objectives of conserving salmon stocks in all
salmon rivers is to allow fisheries only in rivers or the estuary of that river, where there is
a greater probability of targeting only the stocks originating from these rivers (i.e.
single stock fisheries). The TEGOS also advise that fisheries should take place only on
stocks that are shown to be meeting their CL with the catch restricted to the
estimated surplus above CL. This advice follows from international best practice as
advised by ICES and NASCO.
The main objective of the scientific advice therefore, is to ensure that there are
sufficient spawning salmon remaining after commercial and recreational fisheries to
meet the required CL for that river. In order to do this, the number of salmon which will
be available before the fishery takes place must be “forecast” for each river annually,
based on the average returns in recent years (usually the most recent 5 years
provided sufficient information is available). The information required for this forecast
is derived from commercial catch data, from extrapolation of rod catch information
using exploitation rates or from estimates based on fish counter information.
143.2.1 Estimating the total catch in each river
As stated previously the catch data for draft nets, other commercial engines (snap
nets) and rods, derive from mandatory fishing logbooks or from vouched information
supplied by IFI directly. The forecast model requires the inclusion of the fish taken by
the commercial fisheries in the estuaries of each river if present.
3.2.2 Estimating the returns of adult salmon in each river using rod exploitation rates
Rod exploitation rates derive from observed exploitation rate values from fish counters
or traps on Irish rivers and are supported by information from the scientific literature
and the National Coded-wire Tagging and Tag Recovery Programme. Exploitation
by angling on grilse stocks varies but is generally between 10% and 30% of the total
river stock available (Milner et al., 2001). These authors quote mean values of 19% for
UK rivers, while values for specific Irish grilse (1SW salmon) fisheries have been
estimated for the River Erriff at 19% between 1986 and 2000 (Gargan et al., 2001), and
15% for the Burrishoole between 1970 and 2000 (Whelan et al., 2001). Estimates of
angling exploitation on multi-sea-winter stocks are generally higher than those
reported for grilse (Solomon and Potter 1992) and this has also been observed from
Irish fish counter data. In 2008, the SSCS evaluated all existing information on
individual rod fisheries made available by IFI, including field observations of fisheries
which have known high or low intensity, to derive more precise estimates of the likely
rod exploitation rate on a river by river basis. An extensive review of salmon
exploitation rates in Irish rivers (Millane et al., 2017) using rod catch and fish counter
data was published in 2017 but has not yet been incorporated into estimates of adult
salmon return.
Provided the catch in a river is known, the total stock can be estimated by
extrapolation using an appropriate exploitation rate in the fishery e.g.:
If the rod catch of salmon was 150 fish and the exploitation rate in the fishery
was 10%, then the total stock of salmon available to generate this catch would
be estimated as the catch raised by the exploitation rate:
Catch / Exploitation rate * 100
In this case 150 / 10 * 100 = 1,500 salmon.
15For most rivers, the specific exploitation rates are not known and therefore a range of
values is applied within which the true value is expected to be. Furthermore, as there
is now specific rod exploitation data for Irish rivers with fish counters, it has been
possible to allocate all rivers into specific groups representing heavily fished (higher
exploitation rate) and medium fished to lightly fished rivers (low exploitation rate)
based on field observations (Table 1). This restricts the overall range of values being
used to a more likely range rather than applying the entire range of values observed.
Table 1 Standard exploitation rates applied in the stock assessment
Fishing intensity Total and 1SW MSW
Low 5 (1–12) 12 (6–27)
Medium 15 (7–35)
High 33 (10–50) 31(15–46)
Table 9 provides the exploitation rate ranges used for each river for the 2021 advice.
Angling exploitation rates in general were reduced by 20% for year 2020 to account
for a reduced exploitation rate because of COVID unless Fisheries Inspector reports
indicated otherwise or if the rod catch was greater than twice the five-year average
then no such reductions were applied.
3.3 Provision of harvest guidelines
Once estimates of average spawners, average catch, and river-specific CL have
been derived, harvest options are provided with the associated probability of meeting
CLs. Where estimates were available for both a counter or trap and a rod catch, the
values for the counter or trap are used.
Following the procedure used by ICES for the provision of catch advice for West
Greenland, the harvest option that provides a 0.75 probability level (or 75% chance)
of meeting the CL for a given stock is recommended. Where there is no harvest
option which will provide a 75% chance of meeting the CL, then there is no surplus of
fish to support a harvest (commercial or rod).
Given the uncertainty in the data and the use of a risk analysis to allow for some of this
uncertainty, a further limitation is applied to the recruit per spawner index of each
river. A maximum recruit per spawner value is applied to the abundance outputs
derived from the risk assessment of three i.e. for every one spawner three recruits may
be produced. This is considered to reflect better the overall status of salmon stocks
both nationally and internationally.
16An objective of the catch advice is to ensure that harvest fisheries only take place on
river stocks meeting and exceeding CLs. The means to achieve this objective is to
allow only harvest fisheries, which can specifically target single stocks, which are
meeting their CLs. Where a fishery comprises of more than one stock, the risk analysis
is based on the simultaneous attainment of CL for all contributing stocks. For the 2021
advice, Killary Harbour (Bundorragha and Erriff stocks), the Owenmore Estuary
(Carrowmore Lake and Owenmore) and the Castlemaine Harbour area (Maine,
Laune and Caragh river stocks) were considered as true mixed-stock fisheries.
Mixed-stock fisheries will always present greater risks than when stocks are exploited
separately however, because of uncertainties or variability in the proportion of the
catch originating from the weaker of the stocks. This is particularly true when there are
large differences in the relative numbers of fish in each stock as it may be difficult to
estimate the impacts on the smaller stocks. Therefore, to avoid intercepting fish from
other rivers, particularly those which are not meeting CLs, the advice is to operate all
fisheries within the estuary of the river stock for which the catch advice is being given
and not a common bay or estuary where several rivers stocks may be present. Careful
consideration must be made of local topography, fishing practices, number of
contributing stocks and their status and the ability to discriminate the contributing
stocks and manage the fishery effectively.
In a number of rivers the CL will be achieved by the contributions of both 1SW (grilse)
and MSW (spring fish). There is conservation of biodiversity and fisheries development
value in identifying and protecting both life history types. It is important for fisheries
management to be able to determine how much of the CL is likely to be met by
either MSW or 1SW fish and to regulate fisheries for both components separately.
More information is required on the proportions of each component of the stock
being exploited and the timing of their entry into estuaries and freshwater. Advice has
been provided on 1SW and MSW separately where a significant early run component
has been identified and can be managed separately on the assumption that all fish
counted or caught before 31st May are considered to be MSW fish (except for the
Slaney where in-season data are available on proportions of 1SW and MSW salmon).
174 Overview of status of stocks and precautionary catch advice for
2021
Although new CLs were applied in 2013 and the basis for the risk assessment was
modified, few changes applied to the actual catch advice procedure for the 2021
season. The present system of updating catch data from the previous year to reflect
official logbook returns was maintained (unless indicated otherwise by local
inspectors), while the catch data for the most recent year was based on local
inspectors estimates. Data from fish counters were updated for the previous year to
include October to December values if available, while provisional counts for the
current year were based on estimates to the end of September. Values for October
to December were extrapolated from the mean of the previous five years where
appropriate. Any further information received, which indicated changes to previous
catch or counter estimates, were incorporated where indicated by IFI.
Counting each of the combined rivers above as one stock, catch advice for the 2021
season is provided for 144 separate rivers and additionally advice is also given
separately for the Upper Liffey and Upper Lee. In addtion, separate assessments are
made on 16 rivers for the early running MSW component of the stock in question.
Of these:
29 rivers have counter data (includes rivers with large hydro-electric
impoundments)
2 rivers have trap data (Burrishoole and Erriff).
Details of the catch advice for 2021 provided by the TEGOS are given in Table 2
through to Table 7:
Generally, the TEGOS advises that:
Harvest of salmon should only be allowed on stocks from rivers where there is a
surplus above the CL identified and that no more than this surplus should be
harvested i.e. those rivers detailed in Table 2 and Table 3. (Note; in some rivers
the available surplus is very small and management have decided not to
place these rivers in the open category with an exploitable surplus but have
moved them to catch & release fisheries).
18 Harvest fisheries should not take place on stocks from rivers without an
identifiable surplus above the CL i.e. those rivers identified in Table 4, Table 5,
Table 6 and Table 7.
No harvest fisheries should take place on those stocks from 57 rivers where rod
catch data have not been available since 2006 to assess salmon stock status
(Table 8). The TEGOS advise that these rivers remain closed to harvest until such
time as additional information becomes available to assess the status of these
stocks relative to their CLs. Of these rivers, where electro-fishing information is
available to show that the catcment-wide electro-fishing threshold has been
achieved, these rivers can be open for C&R-only to generate a rod catch
which can be used for assessment of total salmon stock status.
Owing to the different status of individual stocks within the stock complex, mixed-stock
fisheries present particular threats to stock status (ICES 2014). The objective of the
catch advice is to ensure that harvest fisheries only take place on river stocks meeting
and exceeding CLs. The means to achieve this objective is to allow only harvest
fisheries which can specifically target single stocks which are meeting their CLs. The
TEGOS strongly advise that all fisheries should operate only on the target stock as close
to the river mouth or within the river to achieve this.
Even where all exploited stocks in a common estuary are meeting their CLs, mixed-
stock fisheries introduce greater uncertainty into predicting the effects of
management measures and pose a greater threat to small stocks or populations,
especially if these are of low relative productivity and/or subject to high exploitation.
As the number of stocks (or populations) increases, the number of fish that must be
released from the fisheries in order to meet CLs must also increase. When the number
of populations is too large, it may be impossible to ensure a high probability of the
simultaneous achievement of spawner requirements in each individual unit. The
overall objective should be to achieve a flexible but sustainable fishery without
compromising conservation goals by fishing only single stock salmon stocks which are
shown to have a harvestable surplus over the CL. The best way to achieve this is to
fish within the river or as close to the river as possible (i.e. the estuary of that river).
19Table 2 Rivers with a forecasted surplus above the required conservation limit for 2021.
This is the catch option which provides a 75% chance that the CL will be met. (Note:
1SW and 2SW combined unless otherwise noted). (Note; in some rivers the available
surplus is very small and management have decided not to place these rivers in the
open category with an exploitable surplus but have moved them to catch & release
fisheries).
Deficit/ Prop. CL
District River CL
Surplus achieved
Dundalk Fane 1173 29 1.03
Lismore Blackwater, Glenshelane, Finisk 15217 6420 1.42
Cork Lower Lee (Cork) 1896 755 1.40
Cork Bandon 2058 568 1.28
Cork 1SW Ilen 679 755 1.28
Cork Mealagh 96 191 3.00
Cork Owvane 372 562 2.51
Cork Coomhola 309 151 1.49
Cork Glengarriff 166 332 3.00
Cork Adrigole 167 35 1.21
Kerry Croanshagh 274 254 1.93
Kerry Sheen 623 1236 2.99
Kerry Roughty 1538 415 1.27
Kerry Sneem 347 695 3.00
Kerry 1SW Waterville 119 237 3.00
Kerry Inney 630 190 1.30
Kerry Ferta 224 140 1.62
Kerry 1SW Caragh 395 551 2.40
Kerry 1SW Laune and Cottoners 2071 3540 2.71
Kerry Maine 1186 417 1.35
Kerry Owenmore 105 210 3.00
Limerick 1SW Feale, Galey and Brick 2859 218 1.08
Galway Corrib 7551 4540 1.60
Connemara Cashla 419 97 1.23
Connemara Ballynahinch 834 234 1.28
Ballinakill Owenglin 422 37 1.09
Ballinakill Dawros 495 589 2.19
Ballinakill Culfin 136 232 2.72
Ballinakill Erriff 1381 414 1.30
Ballinakill 1SW Bundorragha 95 190 3.00
Bangor 1 SW Newport R. (Lough Beltra) 507 355 1.70
Bangor 1SW Owenduff (Glenamong) 711 538 1.76
Bangor Owenmore 2073 224 1.11
Bangor 1SW Carrowmore 231 258 2.12
Bangor Glenamoy 622 129 1.21
Ballina Moy 16736 12908 1.77
Ballina Easky 1400 315 1.23
Sligo Ballysadare 6372 2587 1.41
Sligo Drumcliff 511 138 1.27
20Deficit/ Prop. CL
District River CL
Surplus achieved
Ballyshannon Duff 1065 6 1.01
Ballyshannon 1 SW Drowes 1064 2024 3.00
Ballyshannon Owenwee (Yellow R) 183 28 1.15
Letterkenny Owenea and Owentocker 1684 199 1.12
Letterkenny 1SW Gweebarra 611 284 1.46
Letterkenny Gweedore (Crolly R.) 342 118 1.34
Letterkenny Clady 345 144 1.42
Letterkenny Tullaghobegly 223 121 1.54
Letterkenny 1SW Lackagh (Counter) 235 154 1.66
Letterkenny Crana 1072 187 1.17
Table 3 Rivers meeting conservation limits and estimated surplus and proportion of CL
achieved for MSW stocks only in 2021. (Total surplus for these rivers = 1SW & MSW
surplus combined).
Prop. CL
District River CL Surplus
achieved
Cork 2SW Ilen 212 306 2.44
Kerry 2SW Waterville 83 39 1.47
Kerry 2SW Caragh 280 128 1.46
Kerry 2SW Laune 815 959 2.18
Limerick 2SW Feale , Galey and Brick 864 58 1.07
Ballinakill 2SW Bundorragha 70 24 1.34
Bangor 2SW Newport R. (Lough Beltra) 366 45 1.12
Bangor 2SW Owenduff (Glenamong) 402 212 1.59
Bangor 2SW Carrowmore 122 244 3.00
Ballyshannon 2SW Drowes 426 338 1.79
Letterkenny 2SW Gweebarra 116 32 1.27
21Table 4 Rivers below conservation limits in 2021 and the estimated deficits and
proportion of CL achieved for 1SW and MSW stocks combined unless otherwise
indicated.
Prop. CL
District River CL Deficit
achieved
Dundalk Castletown 1447 -1241 0.14
Dundalk Glyde 1852 -631 0.66
Dundalk 1SW Dee 945 -342 0.64
Drogheda Boyne 10242 -7840 0.24
Dublin Lower Liffey Inc Rye 1705 -1442 0.15
Dublin Upper Liffey US Lexlip 5373 -5213 0.03
Wexford 1SW Slaney 915 -673 0.27
Waterford Barrow and Pollmounty 11738 -10077 0.14
Waterford Nore 10420 -1780 0.84
Suir, Clodiagh, Lingaun,
Waterford 14055 -1197 0.91
Blackwater
Lismore Bride 1569 -556 0.65
Cork Argideen 467 -4 0.99
Kerry Cloonee 61 -42 0.31
Kerry Blackwater 438 -157 0.64
Kerry Owenascaul 180 -144 0.20
Limerick Maigue 4642 -4328 0.07
Limerick Mulkear 4222 -1232 0.75
Limerick Fergus 1187 -841 0.29
Limerick Doonbeg -250 0.52
Galway Owenboliska R (Spiddal) 592 -477 0.20
Connemara Screebe 151 -72 0.52
Ballinakill Carrownisky 365 -30 0.92
Ballinakill Bunowen 460 -48 0.90
Ballinakill Owenwee (Belclare) 375 -88 0.76
Bangor Srahmore (Burrishoole) 617 -286 0.54
Sligo 1 SW Garvogue (Bonnet) 2545 -212 0.93
Ballyshannon Eske 729 -219 0.70
Ballyshannon Eany 1314 -914 0.38
Ballyshannon Oily 628 -501 0.20
Ballyshannon Bungosteen 373 -300 0.20
Ballyshannon Glen 1196 -573 0.52
Letterkenny Ray 435 -129 0.70
Letterkenny 1SW Leannan 517 -133 0.74
22Table 5 Rivers below conservation limits and estimated deficits and proportion of CL
achieved for MSW stocks only in 2021. (Total deficit for these rivers = 1SW & MSW
deficits combined).
Prop. CL
District River CL Deficit
achieved
Dundalk 2SW Dee 715 -633 0.11
Wexford 2SW Slaney Counter 2749 -2264 0.18
Sligo 2SW Garvogue (Bonnet) 289 -130 0.55
Letterkenny 2SW Lackagh (Counter) 278 -257 0.07
Letterkenny 2SW Leannan 1199 -1037 0.13
Table 6 Status of salmon stocks above rivers impounded for hydro-electric schemes.
Wetted area Average
u/s of CL salmon Prop. CL
River
hydro station count achieved
m² (most recent five-year data)
Erne 6,457,264 16,586 2076 11%
Upper Shannon
30,895,619 49,638 1429 5%
(above Parteen)
Upper Lee 2,370,000 2,789 512 18%
Upper Liffey 2,308,361 5,389 242 3%
23Table 7 Rivers advised to be open for catch & release-only fishing based on meeting
≥50% CL management threshold or meeting management electro-fishing threshold
≥15 salmon fry/ 5 min catchment-wide average).
Electro-
fishing
Prop. CL Prop. CL
District River CL mean
achieved achieved
salmon
fry/5 Min.
Dundalk Glyde 1852 -631 0.66
Dundalk 1SW Dee 945 -342 0.64
Drogheda Boyne 10242 -7840 0.24 15.9
Dublin Lower Liffey Inc Rye 1705 -1442 0.15 15.6
Wexford 1SW Slaney 915 -673 0.27 15.0
Barrow and
Waterford 11738 -10077 0.14 16.9
Pollmounty
Waterford Nore 10420 -1780 0.84
Suir, Clodiagh,
Waterford 14055 -1197 0.91
Lingaun, Blackwater
Lismore Bride 1569 -556 0.65
Cork Argideen 467 -4 0.99
Kerry Cloonee 61 -42 0.31 24.9
Kerry Blackwater 438 -157 0.64
Kerry Owenascaul 180 -144 0.20 15.1
Kerry Milltown 87 15
Limerick Mulkear 4222 -1232 0.75
Limerick Lower Shannon 4,204 35.7
Limerick Doonbeg 524 -250 0.52
Connemara Screebe 151 -72 0.52
Ballinakill Carrownisky 365 -30 0.92
Ballinakill Bunowen 460 -48 0.90
Ballinakill Owenwee (Belclare) 375 -88 0.76
Bangor Srahmore (Burrishoole) 617 -286 0.54
Cloonaghmore
Ballina 1323 15.8
(Palmerstown)
1SW Garvogue
Sligo 2545 -212 0.93
(Bonnet)
Ballyshannon Eske 729 -219 0.70
Ballyshannon Eany 1314 -914 0.38 19.6
Ballyshannon Oily 628 -501 0.20 19.9
Ballyshannon Bungosteen 373 -300 0.20 18.4
Ballyshannon Glen 1196 -573 0.52
Letterkenny Ray 435 -129 0.70
Letterkenny 1SW Leannan 517 -133 0.74
24Table 8 Rivers where no rod catch data available since 2006, with exceedance of
catchment-wide electro-fishing (CWEF) threshold indicated.
Meeting CWEF
District River CL
threshold (value)
Dundalk Flurry 427 No (11.2)
Dublin Dargle 734 No (3.33)
Dublin Vartry 274 No (6.9)
Wexford Avoca 3945 No (7)
Wexford Owenavorragh 944 No (7.5)
Waterford Colligan 422 No (11.8)
Waterford Corock R 836 No (14.6)
Waterford Mahon 443 No (6.3)
Waterford Owenduff 300 No (7.1)
Waterford Tay 319 No (5.5)
Lismore Lickey 148 No (12.8)
Lismore Tourig 118 No (10.3)
Lismore Womanagh 368 No (6.4)
Cork Owenacurra 293 No (12.6)
Kerry Behy 176 No (5.9)
Kerry Carhan 88 No (9.5)
Kerry Emlagh 137 No (5.1)
Kerry Emlaghmore 68 No (3.1)
Kerry Feohanagh 161 No (11.4)
Kerry Finnihy 143 No (2.5)
Kerry Kealincha 128 No (0.0)
Kerry Lee 507 No (0.7)
Kerry Lough Fada 88 No (1.6)
Kerry Milltown 87 No (15.0)
Kerry Owenreagh 87 No (5.6)
Kerry Owenshagh 304 No (10.8)
Limerick Annageeragh 321 No (3.9)
Limerick Aughyvackeen 223 No (1.4)
Limerick Deel 2823 No (0.12)
Limerick Inagh 1096 No (5.3)
Limerick Owenagarney 630 No (10)
Limerick Skivaleen 458 No (12.3)
Galway Aille (Galway) 105 No Data
Galway Clarinbridge 487 No (4.5)
Galway Knock 132 No (12.5)
Connemara L. Na Furnace 71 No (0.0)
Bangor Muingnabo 336 No (1.0)
25Meeting CWEF
District River CL
threshold (value)
Bangor Owengarve R. 227 No (6.4)
Ballina Ballinglen 411 No (9.3)
Ballina Brusna 1096 No (11.2)
Ballina Cloonaghmore 1323 No (15.8)
Ballina Leaffony 241 No (5.2)
Sligo Grange 339 No (4.4)
Ballyshannon Abbey 333 Yes (17.7)
Ballyshannon Ballintra (Murvagh R). 548 No (13.9)
Ballyshannon Laghy 448 No (10.8)
Letterkenny Bracky 200 No (12.5)
Letterkenny Clonmany 443 No (9.1)
Letterkenny Culoort 252 No (4.0)
Letterkenny Donagh 429 No (2.5)
Letterkenny Glenagannon 377 No (9.3)
Letterkenny Glenna 215 No (8.1)
Letterkenny Isle (Burn) 521 No (2.1)
Letterkenny Mill 312 No (0.0)
Letterkenny Owenamarve 205 No (2.5)
Letterkenny Straid 184 No (0.1)
Letterkenny Swilly 1105 No (11.7)
26Table 9 River rod catch exploitation rates applied for 2021 advice.
Total or 1SW exploitation rate MSW exploitation rate
District River Year
Min. Likely Max. Min. Likely Max.
Dundalk Castletown 2020 0.07 0.15 0.35
Dundalk Castletown 2019 0.01 0.05 0.12
Dundalk Castletown 2018 0.01 0.025 0.06
Dundalk Castletown (2016–2017) 0.01 0.05 0.12
Dundalk Dee 2020 0.01 0.05 0.12 0.06 0.12 0.27
Dundalk Dee 2019 0.01 0.05 0.12 0.06 0.12 0.27
Dundalk Dee 2018 0.01 0.025 0.06 0.06 0.12 0.27
Dundalk Dee 2017 0.01 0.05 0.12 0.06 0.12 0.27
Dundalk Dee 2016 0.01 0.05 0.12 0.06 0.12 0.27
Dundalk Fane 2020 0.07 0.15 0.25 0.06 0.12 0.27
Dundalk Fane 2019 0.01 0.05 0.12 0.06 0.12 0.27
Dundalk Fane 2018 0.01 0.05 0.12 0.06 0.12 0.27
Dundalk Fane 2017 0.07 0.15 0.35 0.15 0.31 0.46
Dundalk Fane 2016 0.01 0.05 0.12 0.06 0.12 0.27
Dundalk Glyde 2020 0.07 0.15 0.35 0.06 0.12 0.27
Dundalk Glyde 2019 0.01 0.05 0.12 0.06 0.12 0.27
Dundalk Glyde 2018 0.01 0.025 0.06 0.06 0.12 0.27
Dundalk Glyde (2016–2017) 0.07 0.15 0.35 0.06 0.12 0.27
Waterford Barrow and Pollmounty 2020 0.01 0.05 0.12 0.06 0.12 0.27
Waterford Barrow and Pollmounty 2019 0.01 0.05 0.12 0.06 0.12 0.27
Waterford Barrow and Pollmounty 2018 0.01 0.025 0.06 0.06 0.12 0.27
Waterford Barrow and Pollmounty (2016–2017) 0.01 0.05 0.12 0.06 0.12 0.27
Waterford Nore 2020 0.01 0.05 0.12 0.06 0.12 0.27
Waterford Nore 2019 0.01 0.05 0.12 0.06 0.12 0.27
Waterford Nore 2018 0.01 0.025 0.06 0.06 0.12 0.27
Waterford Nore (2016–2017) 0.01 0.05 0.12 0.06 0.12 0.27
Waterford Suir, Clodiagh, Lingaun 2020 0.07 0.15 0.35 0.06 0.12 0.27
Waterford Suir, Clodiagh, Lingaun 2019 0.01 0.05 0.12 0.06 0.12 0.27
Waterford Suir, Clodiagh, Lingaun 2018 0.01 0.05 0.12 0.06 0.12 0.27
Waterford Suir, Clodiagh, Lingaun 2017 0.07 0.15 0.35 0.06 0.12 0.27
Waterford Suir, Clodiagh, Lingaun 2016 0.01 0.05 0.12 0.06 0.12 0.27
Lismore Blackwater, Glenshelane, Finisk 2020 0.12 0.18 0.26
27Total or 1SW exploitation rate MSW exploitation rate
District River Year
Min. Likely Max. Min. Likely Max.
Lismore Blackwater, Glenshelane, Finisk 2019 0.12 0.18 0.26
Lismore Blackwater, Glenshelane, Finisk 2018 0.09 0.14 0.19
Lismore Blackwater, Glenshelane, Finisk (2016–2017) 0.12 0.18 0.26
Lismore Bride 2020 0.01 0.05 0.12
Lismore Bride 2019 0.01 0.05 0.12
Lismore Bride 2018 0.01 0.025 0.06
Lismore Bride (2016–2017) 0.01 0.05 0.12
Cork Adrigole 2020 0.01 0.04 0.1
Cork Adrigole 2019 0.01 0.05 0.12
Cork Adrigole 2018 0.01 0.05 0.12
Cork Adrigole (2016–2017) 0.01 0.05 0.12
Cork Argideen 2020 0.01 0.04 0.1
Cork Argideen 2019 0.01 0.05 0.12
Cork Argideen 2018 0.01 0.025 0.06
Cork Argideen (2016–2017) 0.01 0.05 0.12
Cork Bandon 2020 0.13 0.22 0.34 0.13 0.22 0.34
Cork Bandon 2019 0.13 0.281 0.423 0.13 0.281 0.423
Cork Bandon 2018 0.065 0.14 0.212 0.13 0.281 0.423
Cork Bandon (2016–2017) 0.13 0.281 0.423 0.13 0.281 0.423
Cork Coomhola 2020 0.07 0.15 0.35
Cork Coomhola 2019 0.07 0.15 0.35
Cork Coomhola 2018 0.035 0.075 0.175
Cork Coomhola (2016–2017) 0.07 0.15 0.35
Cork Glengarriff 2020 0.01 0.05 0.12
Cork Glengarriff 2019 0.01 0.05 0.12
Cork Glengarriff 2018 0.01 0.025 0.06
Cork Glengarriff (2016–2017) 0.01 0.05 0.12
Cork Ilen 2020 0.07 0.15 0.35 0.06 0.12 0.27
Cork Ilen 2020 0.07 0.15 0.35 0.06 0.12 0.27
Cork Ilen 2018 0.035 0.075 0.175 0.06 0.12 0.27
Cork Ilen (2016–2017) 0.07 0.15 0.35 0.06 0.12 0.27
Cork Lower Lee (Cork) 2020 0.07 0.12 0.28 0.06 0.1 0.22
Cork Lower Lee (Cork) 2019 0.07 0.15 0.35 0.06 0.12 0.27
28Total or 1SW exploitation rate MSW exploitation rate
District River Year
Min. Likely Max. Min. Likely Max.
Cork Lower Lee (Cork) 2018 0.035 0.075 0.175 0.06 0.12 0.27
Cork Lower Lee (Cork) 2017 0.07 0.15 0.35 0.06 0.12 0.27
Cork Lower Lee (Cork) 2016 0.01 0.05 0.12 0.06 0.12 0.27
Cork Mealagh 2020 0.01 0.05 0.12
Cork Mealagh 2019 0.01 0.05 0.12
Cork Mealagh 2018 0.01 0.025 0.06
Cork Mealagh (2016–2017) 0.01 0.05 0.12
Cork Owvane 2020 0.01 0.05 0.12
Cork Owvane 2019 0.01 0.05 0.12
Cork Owvane 2018 0.01 0.025 0.06
Cork Owvane (2016–2017) 0.01 0.05 0.12
Kerry Caragh 2020 0.07 0.12 0.28 0.15 0.25 0.37
Kerry Caragh 2019 0.07 0.15 0.35 0.15 0.31 0.46
Kerry Caragh 2018 0.035 0.075 0.175 0.15 0.31 0.46
Kerry Caragh (2016–2017) 0.07 0.15 0.35 0.15 0.31 0.46
Kerry Cloonee 2020 0.01 0.04 0.1
Kerry Cloonee (2011, 2015–2017) 0.01 0.05 0.12
Kerry Croanshagh 2020 0.01 0.05 0.12
Kerry Croanshagh 2019 0.01 0.05 0.12
Kerry Croanshagh 2018 0.01 0.025 0.06
Kerry Croanshagh (2016–2017) 0.01 0.05 0.12
Kerry Ferta 2020 0.01 0.05 0.12
Kerry Ferta 2019 0.01 0.05 0.12
Kerry Ferta 2018 0.01 0.025 0.06
Kerry Ferta (2016–2017) 0.01 0.05 0.12
Kerry Inney 2020 0.07 0.15 0.35
Kerry Inney 2019 0.07 0.15 0.35
Kerry Inney 2018 0.035 0.075 0.175
Kerry Inney (2016–2017) 0.07 0.15 0.35
Kerry Laune and Cottoners 2020 0.07 0.12 0.28 0.15 0.25 0.37
Kerry Laune and Cottoners 2019 0.07 0.15 0.35 0.15 0.31 0.46
Kerry Laune and Cottoners 2018 0.035 0.075 0.175 0.15 0.31 0.46
Kerry Laune and Cottoners (2016–2017) 0.07 0.15 0.35 0.15 0.31 0.46
29Total or 1SW exploitation rate MSW exploitation rate
District River Year
Min. Likely Max. Min. Likely Max.
Kerry Owenascaul 2020 0.01 0.05 0.12
Kerry Owenascaul 2019 0.01 0.05 0.12
Kerry Owenascaul 2018 0.01 0.025 0.06
Kerry Owenascaul (2016–2017) 0.01 0.05 0.12
Kerry Owenmore 2020 0.01 0.04 0.1
Kerry Owenmore 2019 0.01 0.05 0.12
Kerry Owenmore 2018 0.01 0.025 0.06
Kerry Owenmore (2016–2017) 0.01 0.05 0.12
Kerry Roughty 2020 0.07 0.15 0.35
Kerry Roughty 2019 0.07 0.15 0.35
Kerry Roughty (2016–2018) 0.05 0.1 0.15
Kerry Sheen 2020 0.07 0.15 0.35
Kerry Sheen 2019 0.01 0.04 0.1
Kerry Sheen 2018 0.01 0.02 0.05
Kerry Sheen (2016–2017) 0.01 0.04 0.1
Kerry Sneem 2020 0.07 0.15 0.35
Kerry Sneem 2019 0.01 0.05 0.12
Kerry Sneem 2018 0.01 0.025 0.06
Kerry Sneem (2016–2017) 0.01 0.05 0.12
Connemara Screebe 2020 0.07 0.12 0.28
Connemara Screebe 2019 0.07 0.15 0.35
Connemara Screebe 2018 0.035 0.075 0.175
Connemara Screebe (2016–2017) 0.07 0.15 0.35
Ballinakill Bundorragha 2020 0.07 0.12 0.28 0.15 0.25 0.37
Ballinakill Bundorragha 2019 0.07 0.15 0.35 0.15 0.31 0.46
Ballinakill Bundorragha 2018 0.035 0.075 0.175 0.15 0.31 0.46
Ballinakill Bundorragha (2016–2017) 0.07 0.15 0.35 0.15 0.31 0.46
Ballinakill Carrownisky 2020 0.01 0.04 0.1
Ballinakill Carrownisky 2019 0.01 0.05 0.12
Ballinakill Carrownisky 2018 0.01 0.025 0.06
Ballinakill Carrownisky (2016–2017) 0.01 0.05 0.12
Ballinakill Owenwee (Belclare) 2020 0.01 0.04 0.1
Ballinakill Owenwee (Belclare) 2019 0.01 0.05 0.12
30Total or 1SW exploitation rate MSW exploitation rate
District River Year
Min. Likely Max. Min. Likely Max.
Ballinakill Owenwee (Belclare) 2018 0.01 0.025 0.06
Ballinakill Owenwee (Belclare) 2017 0.01 0.05 0.12
Ballinakill Owenwee (Belclare) (2016–2016) 0.07 0.15 0.35
Bangor Glenamoy 2020 0.07 0.12 0.28
Bangor Glenamoy 2019 0.07 0.15 0.35
Bangor Glenamoy 2018 0.01 0.025 0.06
Bangor Glenamoy (2016–2017) 0.01 0.05 0.12
Bangor Newport R. (Lough Beltra) 2020 0.05 0.08 0.12 0.06 0.1 0.22
Bangor Newport R. (Lough Beltra) 2019 0.05 0.1 0.15 0.06 0.12 0.27
Bangor Newport R. (Lough Beltra) 2018 0.025 0.05 0.075 0.06 0.12 0.27
Bangor Newport R. (Lough Beltra) (2016–2017) 0.05 0.1 0.15 0.06 0.12 0.27
Ballina Easky 2020 0.07 0.12 0.28
Ballina Easky 2019 0.07 0.15 0.35
Ballina Easky 2018 0.035 0.075 0.175
Ballina Easky 2017 0.01 0.05 0.12
Ballina Easky 2016 0.07 0.15 0.35
Ballina Moy 2020 0.07 0.12 0.28 0.15 0.25 0.37
Ballina Moy 2019 0.07 0.15 0.35 0.15 0.31 0.46
Ballina Moy 2018 0.035 0.075 0.175 0.15 0.31 0.46
Ballina Moy (2016–2017) 0.07 0.15 0.35 0.15 0.31 0.46
Sligo Drumcliff 2020 0.07 0.12 0.28
Sligo Drumcliff 2019 0.07 0.15 0.35
Sligo Drumcliff 2018 0.035 0.075 0.175
Sligo Drumcliff (2016–2017) 0.07 0.15 0.35
Sligo Garvogue (Bonnet) 2020 0.01 0.04 0.1 0.06 0.1 0.22
Sligo Garvogue (Bonnet) 2019 0.01 0.05 0.12 0.06 0.12 0.27
Sligo Garvogue (Bonnet) 2018 0.01 0.025 0.06 0.06 0.12 0.27
Sligo Garvogue (Bonnet) (2016–2017) 0.01 0.05 0.12 0.06 0.12 0.27
Ballyshannon Bungosteen 2020 0.01 0.04 0.1
Ballyshannon Bungosteen 2019 0.01 0.05 0.12
Ballyshannon Bungosteen 2018 0.01 0.025 0.06
Ballyshannon Bungosteen (2016–2017) 0.01 0.05 0.12
Ballyshannon Drowes 2020 0.07 0.15 0.35 0.06 0.12 0.27
31Total or 1SW exploitation rate MSW exploitation rate
District River Year
Min. Likely Max. Min. Likely Max.
Ballyshannon Drowes 2019 0.07 0.15 0.35 0.15 0.31 0.46
Ballyshannon Drowes 2018 0.035 0.075 0.175 0.15 0.31 0.46
Ballyshannon Drowes (2016–2017) 0.07 0.15 0.35 0.15 0.31 0.46
Ballyshannon Duff 2020 No exploitation
Ballyshannon Duff 2019 No exploitation
Ballyshannon Duff 2018 No exploitation
Ballyshannon Duff (2016–2017) 0.07 0.15 0.35
Ballyshannon Glen 2020 0.07 0.12 0.28
Ballyshannon Glen 2019 0.01 0.05 0.12
Ballyshannon Glen (2016–2018) 0.07 0.15 0.35
Ballyshannon Oily 2020 0.01 0.04 0.1
Ballyshannon Oily 2019 0.01 0.05 0.12
Ballyshannon Oily 2018 0.01 0.025 0.06
Ballyshannon Oily (2016–2017) 0.01 0.05 0.12
Ballyshannon Owenwee (Yellow) 2020 0.01 0.04 0.1
Ballyshannon Owenwee (Yellow) 2019 0.01 0.05 0.12
Ballyshannon Owenwee (Yellow) 2018 0.01 0.025 0.06
Ballyshannon Owenwee (Yellow) (2014–2016) 0.01 0.05 0.12
Letterkenny Bungosteen 2020 0.01 0.4 0.1
Letterkenny Bungosteen 2019 0.01 0.05 0.12
Letterkenny Bungosteen 2018 0.01 0.025 0.06
Letterkenny Bungosteen (2016–2017) 0.01 0.05 0.12
Letterkenny Clady 2020 0.07 0.12 0.28
Letterkenny Clady 2019 0.07 0.15 0.35
Letterkenny Clady 2018 0.035 0.075 0.175
Letterkenny Clady (2016–2017) 0.07 0.15 0.35
Letterkenny Crana 2020 0.07 0.15 0.35
Letterkenny Crana 2019 0.01 0.05 0.12
Letterkenny Crana 2018 0.01 0.025 0.06
Letterkenny Crana (2016–2017) 0.01 0.05 0.12
Letterkenny Gweebara 2020 0.01 0.05 0.12 0.06 0.1 0.22
Letterkenny Gweebara 2019 0.01 0.05 0.12 0.06 0.12 0.27
Letterkenny Gweebara 2018 0.035 0.075 0.175 0.06 0.12 0.27
32Total or 1SW exploitation rate MSW exploitation rate
District River Year
Min. Likely Max. Min. Likely Max.
Letterkenny Gweebara (2016–2017) 0.07 0.15 0.35 0.06 0.12 0.27
Letterkenny Gweedore (Crolly R.) 2020 0.07 0.15 0.35
Letterkenny Gweedore (Crolly R.) 2019 0.01 0.05 0.12
Letterkenny Gweedore (Crolly R.) 2018 0.01 0.025 0.06
Letterkenny Gweedore (Crolly R.) (2016–2017) 0.01 0.05 0.12
Letterkenny Leannan 2020 0.07 0.12 0.28 0.06 0.1 0.22
Letterkenny Leannan 2019 0.07 0.15 0.35 0.06 0.12 0.27
Letterkenny Leannan 2018 0.035 0.075 0.175 0.06 0.12 0.27
Letterkenny Leannan (2016–2017) 0.07 0.15 0.35 0.06 0.12 0.27
Letterkenny Owenea and Owentocker 2020 0.07 0.12 0.28
Letterkenny Owenea and Owentocker (2016–2019) 0.07 0.15 0.35
Letterkenny Ray 2020 0.01 0.04 0.1
Letterkenny Ray 2019 0.01 0.05 0.12
Letterkenny Ray 2018 No exploitation
Letterkenny Ray (2016–2017) 0.01 0.05 0.12
Letterkenny Tullaghobegly 2020 0.07 0.12 0.28
Letterkenny Tullaghobegly 2019 0.07 0.15 0.35
Letterkenny Tullaghobegly 2018 0.01 0.05 0.12
Letterkenny Tullaghobegly (2016–2017) 0.01 0.05 0.12
335 Mixed-stock commercial fisheries advice
The objective of the catch advice is to ensure that harvest fisheries operate only in estuaries
where stocks in contributing systems meet and exceed CLs. There are potentially three
mixed-stock commercial fisheries operating in estuaries.
5.1 Killary Harbour
In the case of the Killary Harbour (Ballinakill District) fishery, there are two contributing stocks
(Delphi and Erriff) both of which are meeting and exceeding their CLs in the 2021 advice
(Table 2). The TEGOS provide advice on the Killary common embayment based on the CL
being met on both rivers simultaneously.
5.2 Tullaghan Bay
The draft net fishery operating in Tullaghan Bay, Bangor District, exploits stocks from the
Owenmore, Owenduff and Carrowmore systems. Following a review of this fishery in 2012, the
SSCS determined that the main bulk of the catch was made within the estuaries of the
individual rivers, so individual catch options were provided rather than a combined common
embayment catch option as in previous years. There is a small overlapping fishery which
takes some stock from each river but a local arrangement for the quota for this fishery was
determined by IFI for 2013. For advice provided by the SSCS / TEGOS between 2015 and
2020, one of these river stocks, the Owenmore was below CL and no Total Allowable Catch
(TAC) was provided for the Owenmore Estuary. The Owenduff River has had a substantial
surplus and a TAC has been allocated to the Owenduff Estuary since 2015.
As such, it has been advised that the draft net catch allocation on the Owenmore should be
based on the Owenmore/Carrowmore one-sea-winter (1SW) surplus while the Owenduff
draft net allocation should be based on the Owenduff 1SW surplus. This has implications for
the operation of a commercial draft-net fishery in the Owenmore Estuary below the
Owenmore and Munhin/Carrowmore rivers as no fishery could be advised to operate if the
Owenmore remained below CL as it had until 2020. The TEGOS advice for 2021 is that the
Owenmore has a 1SW surplus of 224 fish while the Carrowmore has a 1SW surplus of 258 fish. If
a mixed-stock draft-net fishery is to operate in the Owenmore estuary in 2021, then a mixed-
stock common estuary surplus applies which raises the CL for both rivers to ensure both rivers
meet CL simultaneously. The common estuary surplus for 1SW fish for the Owenmore estuary is
252 fish for 2021.
34You can also read