Ministry of Business, Innovation and Employment - Embedded Hydro Generation Opportunities in New Zealand - MBIE
←
→
Page content transcription
If your browser does not render page correctly, please read the page content below
Ministry of Business,
       Innovation and Employment
       Embedded Hydro Generation Opportunities
       in New Zealand

Version 1.2: Final
2 October 2020
Roaring40s Wind Power Ltd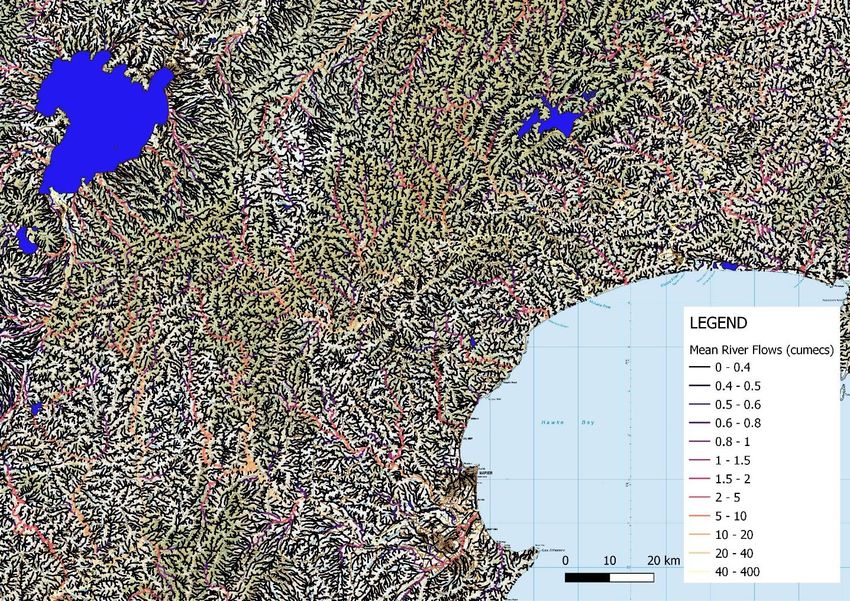
Embedded Hydro Generation Opportunities

Document Control
 Revision No.   Date                Revision Details          Author
 1.0            14 August 2020      Draft for review          SH/GM
 1.1            29 September 2020   Update draft for review   SH/GM
 1.2            2 October 2020      Final                     SH/GM

                                                              Page|2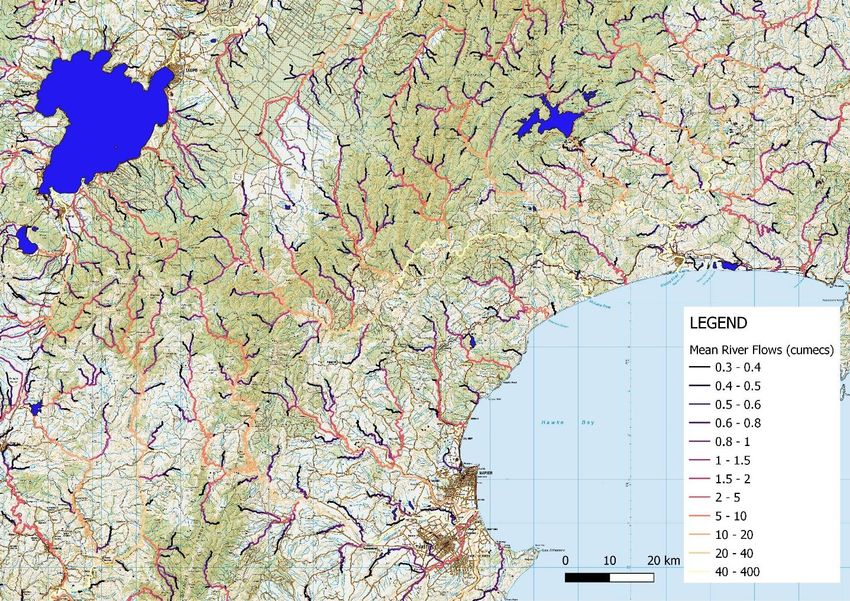
Embedded Hydro Generation Opportunities

Table of Contents
1.     Introduction ........................................................................................................................................... 4
2.     Objective................................................................................................................................................ 5
3.     Hydropower Basics ................................................................................................................................ 5
     3.1.      Types of hydropower schemes...................................................................................................... 7
4.     Methodology ......................................................................................................................................... 8
     4.1.      Identifying potential sites for new embedded hydro generation ................................................. 8
       4.1.1.          Dataset identification (Step 1)............................................................................................. 10
       4.1.2.          GIS modelling process (Step 2) ............................................................................................ 12
       4.1.3.          Automated thinning exercise (Step 3) ................................................................................. 15
       4.1.4.          Manual filtering exercise (Step 4)........................................................................................ 15
5.     Literature review ................................................................................................................................. 16
6.     Results ................................................................................................................................................. 16
7.     Data Limitations................................................................................................................................... 19
8.     Final thoughts ...................................................................................................................................... 22
9.     About the authors ............................................................................................................................... 22
10.         References ....................................................................................................................................... 23

                                                                                                                                                        Page|3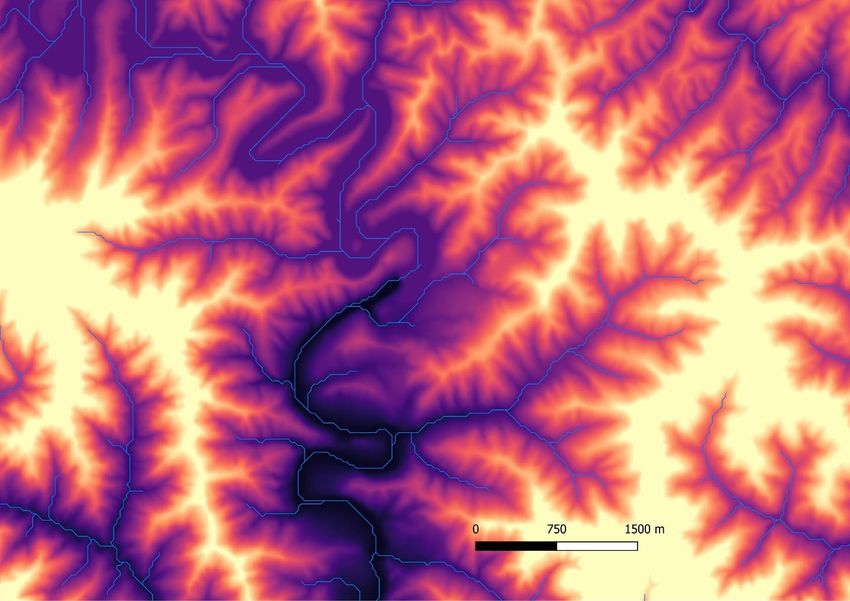
Embedded Hydro Generation Opportunities

1. Introduction
The Ministry of Business, Innovation and Employment (MBIE), with support from Transpower, has
engaged Roaring40s Wind Power Ltd (R40s) to provide an updated assessment of potential small scale
embedded hydro electricity generation in New Zealand.
The future of the New Zealand (NZ) electricity system has been the focus of a number of studies in
recent years with reports undertaken by Transpower1, the Interim Climate Change Committee (ICCC)2,
MBIE3 and the Productivity Commission4 being the most noteworthy. These reports address the growth
of NZ’s electricity market (out to 2035 in the ICCC report and to 2050 in the other reports) and what this
means in regards to NZ’s electricity demand - and mix of technologies - as it moves towards a 100%
renewable generation goal and a low carbon economy.
Transpower’s most recent modelling work undertaken for their March 2020 report Whakamana i te
Mauri Hiko assessed a range of different electricity demand forecast scenarios. These forecast scenarios
suggest an increase from New Zealand’s current electricity demand of ~40 TWh/annum to between 56
and 80 TWh/annum by 2050. This range aligns with the modeling work undertaken by the other parties.
Figure 1 shows actual demand between 1998 to 2018 and various modelled scenarios by MBIE and
Transpower between 2018 to 2050. Also plotted is an extrapolation from the 2018 actual demand to the
upper estimate of the ICCC forecast – which was modelled as being 57 TWh/annum by year 2035.
During the course of writing this report, Rio Tinto announced their intent to close the Tiwai Aluminium
smelter (NZAS) in August 20215. This will mean a reduction of 5 TWh/annum, or 13%, of NZ’s electricity
demand. Transpower’s ‘Tiwai Exit’ scenario, modelled for the Whakamana i te Mauri Hiko report and
included on Figure 1, can thus be considered the most plausible of the future demand scenarios -
assuming the smelter does close, but with a ‘staged exit’6 over a five-year period between 2020 – 2025.
This scenario shows:
       •   a decrease in electricity demand between 2020 and 2025;
       •   a recovery in electricity demand back to 2020 levels by 2029, and;
       •   significant growth (at the same rate as the Transpower Accelerated Electrification scenario) over
           the subsequent 20 years to give a total demand of approximately 65 TWh/annum by year 2050
Large-scale hydropower development in New Zealand was prolific between 1950 – 1980 but has
decreased markedly since then. In fact, there have been no new large-scale schemes constructed since
the Clyde Power Station (commissioned in 1992). Since this time there have also been a number of
National Water Conservation Orders (NWCO) sought and approved (see Appendix A), many of which
were specifically sought to prohibit the consideration of new hydroelectric development. This, combined
with the higher value and competition for fresh water in New Zealand than there was 30 years ago
means that the number of potential opportunities for new large-scale hydro generation in New Zealand
is now quite limited.
Embedded generation refers to plants that, instead of being connected to the grid, are connected to a
distribution network or are operated independently of any network. As such, they are constrained to

1
 Transpower (2018). Te Mauri Hiko – Energy Futures (White Paper), which has since been superseded by the
March 2020 report Whakamana i te Mauri Hiko.
2
 ICCC (2019). Accelerated electrification: Evidence, analysis and recommendations, Interim Climate Change
Committee.
3
    New Zealand Government [MBIE] (2018). Electricity Price Review Hikohiko Te Uira. First Report for Discussion.
4
    New Zealand Productivity Commission (2018). Low-emissions economy – Final Report.
5
    https://www.nzas.co.nz/files/3413_2020070981142-1594239102.pdf.
6
 A ‘staged exit’ being one that would see a reduction in the smelter operations (and electricity consumption) over
a period of years, as opposed to the total ‘hard exit’ in August 2021.

                                                                                                             Page|4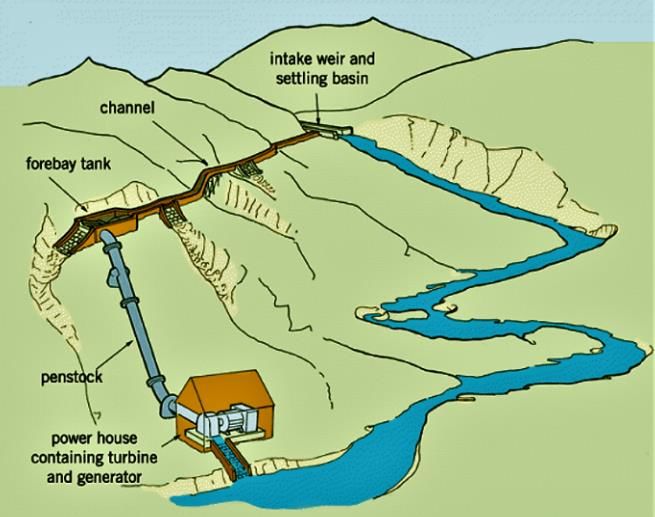
Embedded Hydro Generation Opportunities

being relatively small in size, usually less than 10MW. In the past the potential for embedded generation
has not been given a great deal of attention in an overall electricity market sense. However, given the
limited opportunities for new large scale hydro plant and the anticipated significant demand required
over the new few decades as previously described, it is prudent to consider the potential that embedded
hydro generation may have in meeting future demand growth.

           80
                                     Actual (1998 - 2018)
           75
                                     MBIE Global

           70                        MBIE Disruptive
                                     ICCC Accelerated Electrification
           65                        Transpower Business as Usual
                                     Transpower Accelerated Electricfication
           60
                                     Transpower Mobilise to Decarbonise
     TWh

           55                        Transpower Tiwai Exit (staged)

           50

           45

           40

           35

           30
                                                                               2016

                                                                                                                                                                          2042
                1998

                       2000

                              2002

                                     2004

                                            2006

                                                   2008

                                                          2010

                                                                 2012

                                                                        2014

                                                                                      2018

                                                                                             2020

                                                                                                    2022

                                                                                                           2024

                                                                                                                  2026

                                                                                                                         2028

                                                                                                                                2030

                                                                                                                                       2032

                                                                                                                                              2034

                                                                                                                                                     2036

                                                                                                                                                            2038

                                                                                                                                                                   2040

                                                                                                                                                                                 2044

                                                                                                                                                                                        2046

                                                                                                                                                                                               2048

                                                                                                                                                                                                      2050
                                                                                                       Year

     Figure 1.                  NZ Electricity Demand Forecasts

2. Objective
The objectives of this assessment in relation to the identification of potential embedded hydro
generation are to:
       •        Identify the potential total capacity for new (and locally embedded) hydro generation in New
                Zealand through the identification of potential sites that are greater than 1MW in capacity7.
       •        Provide the following details on each site:
                    o Rated capacity (MW).
                    o Annual generation (GWh).
       •        Summarise the findings in a report including a description of the methodology employed to
                identify the potential sites.

3. Hydropower Basics
The basic concept of hydropower generation is relatively simple – flowing water, being transported in a
pipe (or penstock) is used to turn a turbine, which converts the kinetic energy of the flowing water into
mechanical energy, turning a rotor inside a stator (being the components of the generator) which
converts the mechanical energy into electrical energy (Figure 2). The greater the kinetic energy, the
greater the mechanical energy and consequentially, the greater the electrical energy produced by the
generator. The amount of kinetic energy in the water is dependent on the volume of water and the
distance it falls – with gravity being the driving force.

7
    This threshold was specified by MBIE in the commissioning of this work to constrain the scope of analysis.

                                                                                                                                                                                                             Page|5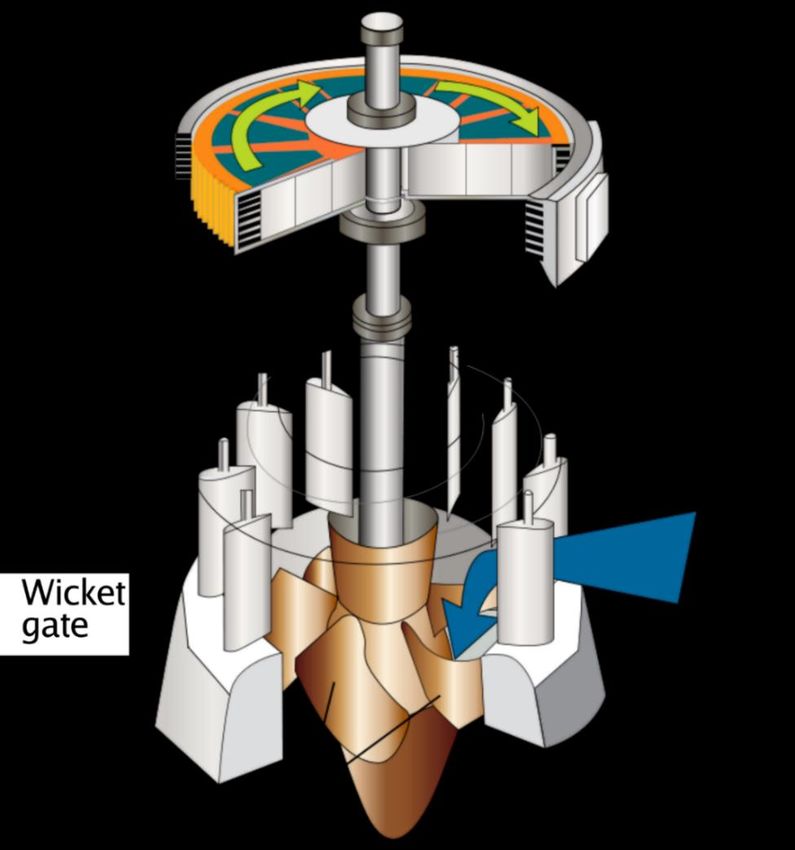
Embedded Hydro Generation Opportunities

                                                Source:
                                                https://www.usgs.gov/media/image
                                                s/a-turbine-connected-a-generator-
                                                produces-power-inside-a-dam

 Figure 2     Conversion of kinetic energy into electrical energy in a hydropower plant

The formula for calculating the theoretical potential power generated by hydropower is;
P = m * g * h [Equation1] Where:
      P = Power, measured in Watts (W).
      m = the mass of the water - as a rate of flow (kg/s - numerically the same as the flow rate in litres
      per second because 1 litre of water weighs 1 kg).
      g = the gravitational constant (which is 9.81m/s2).
      hgross = the gross head – being the difference in elevation between the intake and the discharge
      (i.e. the vertical distance over which the water drops).
There are energy losses through the various components of a hydropower system and these must be
factored into the above equation to reflect applications in practise. The energy losses relate to water
energy loss from wall friction (in the penstocks), turbine losses, generator losses, mechanical losses
between the turbine and generators, and losses from the transformer and other power conditioning
inefficiencies.
As such, the practically available power can be expressed as;
P = m * g * hnet * η [Equation 2] Where:
      hnet = the net head, being the gross head less any head losses. The head losses are mostly due to
      friction between the flowing water and the (inner) surface of the penstock, which increases with
      the number and angle of any bends. For the purposes of this study we have assumed the same
      head loss (10%) for all potential schemes identified. As such hnet = hgross * 0.9.

                                                                                                      Page|6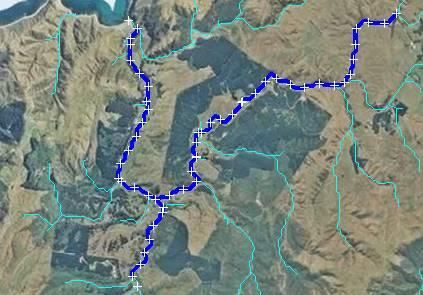
Embedded Hydro Generation Opportunities

         η = the product of all of the other component efficiencies (the turbines, drive shaft, generator and
         transformer) which are typically all located in the powerhouse. The efficiencies of these
         components will vary slightly between different equipment, with the difference in turbine
         efficiency exhibiting the greatest variation (~80-95%)8, as the types of turbines can be quite
         different. For the purpose of this study we have assumed an overall total efficiency of 75%9 for all
         potential schemes identified, comprised as per the following breakdown;
                •   Turbine: 85%;
                •   Drive Shaft: 95%
                •   Generator: 95%
                •   Transformer: 98%
Note that in addition to the above losses there would also be transmission and distribution losses – being
those losses associated with the conveyance of electricity between the point of generation and the point
of connection to the electricity network/grid. The amount of these losses is dependent on the distance
between the site and the point of connection, as well as the voltage of the electricity being exported.
We have not attempted to quantify these losses as part of this study. As such, the generation potential
for schemes identified in this report are at the point of export from each scheme’s powerhouse.

3.1. Types of hydropower schemes
There are two main types of hydropower schemes – ‘impoundment’ and ‘run-of-river’ (Figure 3).
Impoundment schemes involve a reservoir as the water source, either naturally occurring (i.e. a lake) or
man-made, typically created by the damming of rivers (see Figure 3). They often have very large
capacities - hundreds or even thousands of MW, with the Three Gorges Dam scheme in China being the
largest, at 22,500 MW10. Such large capacities are made possible by the stored water and the ability to
control the flow of water entering and exiting the storage reservoir. They are usually connected to high
voltage transmission grids – something which is necessary, due to their capacity. In New Zealand, there
are many examples of large impoundment schemes, such as those on the Waitaki, Waikato, and Clutha
rivers11.

                                     Impoundment                                                       Run-of-river

     Figure 3       Types of hydropower schemes.

8
    https://www.sciencedirect.com/science/article/pii/S1876610214007395
9
    https://www.sciencedirect.com/science/article/pii/S2211467X19300409
10
     https://www.statista.com/statistics/474526/largest-hydro-power-facilities-in-the-world-by-generating-capacity/
11
   There is an argument that many of New Zealand’s large hydro plant are essentially run-of-river because of their
limited storage – but the distinction being made is that if they impound the river to create a reservoir of significant
size then they are technically not run-of-river.

                                                                                                                Page|7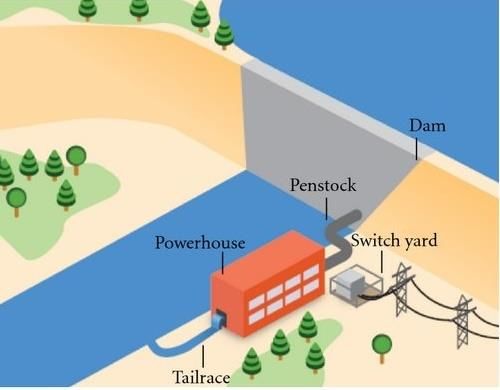
Embedded Hydro Generation Opportunities

In general, impoundment schemes have a pronounced effect on the rivers’ characteristics, particularly in
situations where man-made dams are constructed to create artificial reservoirs upstream. Downstream
effects are dependent on the scheme and the conditions of consent in relation to the residual (or
environmental) flows.
In contrast to large scale impound type hydro schemes, run-of-river schemes are generally much smaller
than impound schemes and are designed within the constraints imposed by the natural variations in river
flows. Such schemes are still being investigated and constructed by developers in New Zealand – with
Trustpower and Pioneer Generation being the most active.
Run-of-river schemes typically take a proportion of the natural river flow by way of a weir or a diversion
channel and leave a residual (or environmental) flow in the river channel immediately downstream. The
‘dewatered’ section of the river is limited to the section between the intake and the discharge at which
point river flows return back to their ‘normal’ flow volumes.
While it can be argued that a weir across a river will essentially impound it, the key difference between
true impoundment schemes and run of river schemes is in their storage potential. Run-of river schemes
will essentially have no, or only very limited, storage - whereas impoundment schemes may have the
ability to capture and store river inflows in their reservoirs over weeks or even months and the ability to
control and vary the volume of water being released downstream. Water releases range from just
residual flows to full generation flow during periods of higher electricity demand.
Some run-of-river schemes incorporate a limited amount of ‘man-made’ water storage to augment
power station flows when natural river flows are lower than usual. However, the storage is typically
limited, and may only be large enough to enable a more attractive diurnal pattern of generation - with
generation occurring when electricity demand is high, and storage of water when electricity demand is
low. Whether a run-of-river scheme has the potential for having storage is very dependent on the
topography of the site and the ability to create a storage pond close to the weir/diversion that is not cost
prohibitive.

4. Methodology
For the purposes of this study, we have deemed it appropriate to focus solely on the identification of
run-of-river schemes. Firstly, such schemes are more commonly associated with small-scale hydro
generation – the identification of which is an objective of this study. Secondly, we believe that run-of
river schemes are more likely to be successful in obtaining resource consent approval than impoundment
type schemes – due to their reduced impact on the environment and less conflict with other
stakeholders and consumers of the resource.

4.1. Identifying potential sites for new embedded hydro generation
The purpose of this study is to identify the potential of new embedded hydro generation greater than
1MW in capacity. As can be determined from Equation 2 in Section 3, there are only two variables (head
and mass/flow) that need to be identified to calculate the potentially available power from a
hydropower scheme – given that gravity is a constant and the operational efficiencies are being treated
as constants. It is also apparent that the greater the volume of water (mass) and/or the greater the
amount of head, the greater the generation will be. As the objective of this study is to identify potential
sites that could generate at least 1MW, the following simple relationship between head and flow (in
order to generate 1MW) can be derived.

                                                                                                     Page|8
Embedded Hydro Generation Opportunities
600
500
400
Head (m)
300
200
y = 150.66x-1
R² = 1
100
0
0 1 2 3 4 5 6 7 8 9 10
Flow (cumecs)
Figure 4 Relationship between Flow and (gross) Head to generate 1MW
The relationship in Figure 4 is based on Equation 2 and has combined the constants – being gravity and
the various losses (head, turbine, generator, drive shaft and transformer losses) into a single constant,
6.64. A simple way of interpreting the relationship is to multiply the flow by the head for the line
described by the relationship. For instance, a flow through the power station of 3 cumecs12, will need to
have a head of ~50m to generate 1MW (i.e. 3 * 50 * 6.64 = 996kW, or 0.996 MW). Not surprisingly, if
you halve the flow (to 1.5 cumecs) the head would have to double (to ~100m) to be able to generate
1MW. In summary, and based on the losses that we have determined as being appropriate, any product
of flow*head that is greater than 150.66 will be able to generate at least 1MW (once the constant of
6.64 is factored in). This is a useful way of understanding the minimum requirements of flow and head
that must be met to achieve the objective of at least 1MW generation.
However, it is also important to consider construction cost. There is no point in identifying theoretical
sites that meet flow and head criteria in isolation of construction difficulty/cost. Unlike large
impoundment schemes where the majority of the cost concerns the construction of the
dam/embankment, a significant proportion (up to 50%) of the cost for run-of-river schemes is typically
attributable to the diversion channel and penstocks between the intake and powerhouse (Zhang, 2012).
It is also apparent when comparing two schemes which have the same flow and head, that these will
have the same generation potential and thus will essentially have the same costs for the powerhouse
and equipment within it. However, if the distance between the intake and powerhouse differs and
Scheme A has a longer or more difficult conveyance route than Scheme B, the construction cost of
Scheme A will be greater due to this difference. The head losses will also be greater for Scheme A. As
such, it is highly desirable to identify schemes with shorter and more direct conveyance routes.
Thus the identification of potential schemes is not only based on a product of flow and head, but also the
criteria that the required minimum head must be achieved within a specified distance. The following
steps were undertaken to identify potential schemes:
1. Identify the appropriate datasets to be used in the analysis and identify the appropriate search
criteria including the distance (between intake and discharge) over which the required
combination of head and flow must be met.
12
One cumec = one cubic meter per second (also expressed as 1 m3/s) = 1000 litres per second
Page|9Embedded Hydro Generation Opportunities
2. Develop a Geographic Information System (GIS) process to identify locations on rivers that have
the necessary combination of head and flow within the specified distance to generate at least
1MW.
3. Perform an automated “thinning” exercise to reduce the number of potential locations of hydro
generation in close proximity to each other by identifying the ‘best’ or most optimal.
4. Perform a manual filtering exercise in GIS to identify valid potential sites by:
a. Removing sites within National Parks.
b. Removing sites within rivers subject to NWCO.
c. Removing sites coincident with existing hydro generation already in operation.
d. Identifying the optimal site where two or more potential results are not compatible with
each other (and removing those sites that are sub-optimal).
e. Removing sites that are considered logistically impractical from an access or construction
perspective.
These steps are described in detail in the following sections.
4.1.1. Dataset identification (Step 1)
As described previously, two key variables – head and flow are required. A third variable, conveyance
distance – being the distance over which the head criteria must be met – is also an important aspect to
consider in the identification of potential schemes to ensure the results are logical and valid.
Head
In consideration of the extent and dataset size, the most appropriate source of information for this study
was determined as being the Land Information of New Zealand (LINZ) 8m Digital Elevation Model (DEM).
This dataset, covering the entire country, contains elevation spot heights on an 8m spaced grid. The
dataset was created in 2012 by the interpolation of the LINZ 20m contours13. The description of the
dataset in the metadata notes that “Spatial accuracy is nominally the same as for the LINZ source data:
90% of well-defined points are within ±22 metres horizontally and within ±10 metres vertically”.
Although this level of accuracy is not as high as would have been desired (as discussed in Section 7),
alternative datasets of higher accuracy covering the entire country do not exist. A detailed description of
this dataset can be found in the metadata on the LINZ website14.
Flow
Following a search of publicly available data, the National Institute of Water and Atmospheric Research
(NIWA) “River Flows” dataset was determined as the most appropriate dataset. This dataset contains
flow information on every section of river in New Zealand. It is based on data records of more than five
years duration at 485 hydrological stations across New Zealand which have been used to extrapolate,
through modelling, to provide hydrological river flow parameters for over 576,000 specific river
segments. A detailed description of this dataset can be found in the metadata on the MfE website15 and
Appendix E contains an image identifying the locations of the 485 hydrological stations used in the
modelling.
The river segments are segregated where tributaries intersect – which is logical, as river flows increase
downstream of where tributaries join. This ensures that the flow characteristics within each segment are
consistent. River segment lengths range from 30m to 13km in the North Island and 30m to 29km in the
South Island, with the vast majority being less than 5km in length.
13
The 8m Digital Elevation Model (DEM) was originally created by Geographx (geographx.co.nz) and was primarily
derived from January 2012 LINZ Topo50 20m contours.
14
https://data.linz.govt.nz/layer/51768-nz-8m-digital-elevation-model-2012/metadata/
15
https://data.mfe.govt.nz/layer/53309-river-flows/metadata/
Page|10Embedded Hydro Generation Opportunities
Design flow criteria to be assumed for the sites of potential hydro generation was determined in
consultation with industry hydropower experts. For schemes with short penstock distances (of less than
1km), it was considered that the power station would likely be designed on a higher probability flow –
possibly as high as the 80th percentile flow. The logic being that a shorter and consequently lower
conveyance route cost, could accommodate a greater maximum power station design flow and output
capacity. For schemes with longer conveyance routes and cost, a balance would have to be met
between the increased costs associated with the longer conveyance route and the maximum power
station design flow. For such schemes, the design flow would likely be lower, and a 65th percentile flow
was deemed appropriate.
A formula was devised to estimate the 65th and 80th percentile flows from the mean flows in the River
Flows dataset. However it was identified that this method was not ideal as it would potentially over or
under estimate flows and that the magnitude of error may be more pronounced in smaller catchments
and may also be impacted by the different geographic regions of New Zealand. Contact was made with
NIWA, who provided a more detailed dataset16 containing the entire range of probability flows (in
addition to the variables contained in the river flows dataset) for each of the 576,000 stream segments.
Using this ‘Percentile Flows’ dataset removed a source of potential error by having access to actual
modelled percentile flows for each stream segment as opposed to estimating these from mean flows.
It is also necessary to make an allowance for a minimum residual/environmental flow downstream of the
intake location. Although there isn’t a prescribed formula for determining appropriate residual flows
downstream of hydro scheme intakes - these would be dependent on the ecological requirements and
determined on a case-by-case basis by the relevant consenting authority, discussions with consultant
ecological hydrologists revealed that the most widely accepted information is described in the Proposed
National Environmental Standard on Ecological Flows and Water Levels (2008). This recommends the
following residual flows:
• For rivers and streams with mean flows less than or equal to 5 m3/s, a minimum flow of 90% of
the mean annual low flow (MALF) as calculated by the Regional Council.
• For rivers and streams with mean flows greater than 5 m3/s, a minimum flow of 80% of MALF as
calculated by the Regional Council.
The resulting formula for calculating the maximum power station generation is as follows;
Max Output = design flow * hnet * gravity * η where;
For mean flows = 1km and subtracting 90% of the 7 day MALF as a
residual/environmental flow
For mean flows > 5 m3/s;
• design flow = 80% flow for penstock lengths < 1km and subtracting 80% of the 7 day MALF as a
residual/environmental flow
• design flow = 65% flow for penstock lengths >= 1km and subtracting 80% of the 7 day MALF as a
residual/environmental flow
hnet = the net head (hnet = hgross * 0.9)
g = gravity (9.81 m/s2)
η = the product of all of the other component efficiencies, being 75% (as described in Section 3).
16
This dataset is referred to as the Percentile Flows dataset
Page|11Embedded Hydro Generation Opportunities
Conveyance distance
To identify the distance over which the head criteria must be met, a list of existing small-scale schemes
greater than 1MW in capacity, and where information on conveyance distance17 was available, was
compiled, as described in Table 1.
Table 1 Conveyance lengths for a selection of operational small-scale hydro schemes in New Zealand
Owner/Operator Name Capacity (MW) Conveyance length (km)
Northpower Wairua 5 3
Pioneer Energy Horseshoe Bend 4.3 1
Pioneer Energy Kowhai 1.9 1.3
Pioneer Energy Matiri 4.8 2.2
Pioneer Energy Roaring Meg lower 3 2.4
Pioneer Energy Fraser 2.8 4.5
Southern Generation Upper Fraser 8 3.5
Trust House Ltd Kourarau 1 0.8
Trustpower Toronui 1.4 0.7
Trustpower Rimu 2.4 2
Trustpower Motukawa 5 3
Westpower Amethyst 7.6 2.5
The information collated on conveyance distance shows a large range; 700m (Toronui) to 4.5km (Fraser)
- with the majority being less than 3km. As such, a maximum length of 5km was adopted, on the basis
that a combined penstock/channel conveyance distance greater than 5km was probably going to render
sites uneconomic. Note that the actual distances used for the analysis ranged between 3-5km,
depending on the river flow volume, as described in the following section.
4.1.2. GIS modelling process (Step 2)
The GIS process to identify sites that met the criteria described in Step 1 was developed by consultancy
Critchlow Geospatial (Critchlow), following a workshop to discuss the approach. The code is listed in
Appendix B, but in summary, the relationship between head and flow that was employed to identify
potential locations of hydro power generation is described as follows;
• 0.3 – 0.4 cumecs and head > 350m and distance < 3km
• 0.4 – 0.5 cumecs and head > 280m and distance < 3km
• 0.5 – 0.6 cumecs and head > 250m and distance < 3km
• 0.6 – 0.8 cumecs and head > 190m and distance < 3km
• 0.8 – 1.0 cumecs and head > 160m and distance < 3km
• 1.0 – 1.5 cumecs and head > 120m and distance < 4km
• 1.5 – 2.0 cumecs and head > 100m and distance < 4km
• 2.0 – 5.0 cumecs and head > 70m and distance < 5km
• 5.0 – 10 cumecs and head > 50m and distance < 5km
• 10 – 20 cumecs and head > 30m and distance < 5km
• >20 cumecs and head > 20m and distance < 5km
Note that the minimum threshold of generation capacity to be identified by the GIS process increases for
larger river flows. For river flows exceeding 5 cumecs, the minimum threshold is 1.66MW, for 10 cumecs
the minimum threshold is 2MW and for 20 cumecs the minimum threshold is 2.7MW. The reason for
this increase in minimum size requirement is because it was deemed unlikely that schemes as small as
1MW would be contemplated for such large flows – as the economics of the scheme would unlikely be
attractive enough unless the generating capacity was higher.
17
The conveyance distance is a combination of channel and penstock – as that schematically shown in Figure 3.
Page|12Embedded Hydro Generation Opportunities
The script process developed by Critchlow is described in Appendix C. The first step transforms the
NIWA Percentile Flows dataset, which is comprised of river segments as lines, into points (or nodes). The
script ‘stamps’ a node every 200m, or at shorter intervals where tributaries join (i.e. where river flows
increase in volume). Figure 5 shows an example of the data stamp interval for a river near Wellington.
In this example, a river with a 65th percentile flow exceeding 0.3 cumecs (dark blue line) has been
identified from the NIWA Percentile Flows dataset (light blue lines) and data ‘stamped’ on a 200m
interval (or more frequent where tributaries join).
200m interval except at tributary
confluences (as identified)
Figure 5 Example of point/node frequency along a river near Wellington.
The maximum 200m interval was determined as being an appropriate balance between maintaining data
accuracy and ensuring file sizes were not the excessively large. The relevant flow information was then
extracted from the NIWA provided Percentile Flows dataset and recorded at each node. The elevation at
each node was then obtained from the LINZ 8m DEM dataset.
Due to the volume of information, the New Zealand river network was first divided into different regions,
based on the Regional Council boundaries. Even in doing so, the size of the datasets generated were
immense (in some cases in excess of 100 GB) and took many hours to process. The West Coast region
had to be split into two parts to be able to complete the analysis successfully.
The next part of this process was to use network (routing) analysis tools to interrogate the various
criteria listed in Appendix B for each node out to a maximum distance of 3km for flows < 1m3/s, 4km for
flows between 1-2 m3/s, and 5km for flows > 2 m3/s. The reason for the differences in conveyance
distance for increasing flows was partly to help reduce data size and processing time but also to reflect
hydro scheme construction in practise. It is unlikely that a scheme with a flow of less than 1 m3/s would
be economically viable if the channel/penstock conveyance length is greater than 3km. Whereas, for
larger river flows, there are more likely to be economically attractive opportunities that have longer
channel/penstock conveyance routes, due to the economies of scale – especially given that higher
generation capacity thresholds have been intentionally required for rivers with high flows.
Figure 6 shows the magnitude of the modelling challenge by plotting the mean river flows18 for the
Hawkes Bay vicinity that exceed 0.3 cumecs – with flow ranges distinguished as per the script code.
Figure 7 shows the same extent but plots all river segments (i.e. including those with mean flows less
than 0.3 cumecs).
18
Although 65th and 80th percentile flows were used in the analysis, mean flows have been plotted for convenience
– noting that for many rivers the mean flow will be within the range of 65 – 80th percentile flow.
Page|13Embedded Hydro Generation Opportunities
Figure 6 Spatial extent of the River Flow dataset showing mean flows > 0.3 cumecs in Hawkes Bay vicinity
Figure 7 Spatial extent of the River Flow dataset for all rivers in Hawkes Bay vicinity.
Page|14Embedded Hydro Generation Opportunities
The next part of the script process identifies the start and end elevations for every possible variation in
stream length over the positive results identified in the previous process and calculates the grade, head
and ‘generation per kilometre’.
At the completion of this Step 2 process, the size of datasets was substantially reduced, but the larger
regions still contained between 5,000 to 10,000 potential development ‘candidates’.
4.1.3. Automated thinning exercise (Step 3)
A thinning exercise was devised to reduce the number of locations identified during Step 2, to identify
the optimal results. Potential candidates were thinned on the following basis:
Thinning Phase 1: An automated script process that identifies the ‘best’ result for every specific river
segment ID over a maximum distance of 1200m19. The parameter used to compare results was
‘generation per kilometre’ with the highest values being selected.
Thinning Phase 2: An automated script process that compares results with neighbouring river segments
to identify the ‘best-of’ results across adjacent river segments by comparing the ‘generation per
kilometre’ parameter over a maximum distance of 900m20.
At the completion of Step 3, potential ‘candidates’ for each region typically ranged between 100 – 1000
in number. Attempts were made to reduce the size of the datasets through automated filtering, but
more aggressive automated thinning processes resulted in potentially valid locations being incorrectly
removed.
4.1.4. Manual filtering exercise (Step 4)
As described previously, the final step was a manual process, undertaken to review the potential
candidates identified at the completion of Step 3 to produce a final dataset of potential small-scale run-
of-river hydro generation sites.
This manual filtering involved:
• Removing sites within National Parks.
o The Department of Conservation dataset, from which National Parks can be identified,
was obtained from the Koordinates website21.
• Removing sites within rivers subject to NWCO.
o The identification of sections of rivers subject to NWCO was done by interpreting the
descriptions in the NWCO hearing decisions that can be found on the MfE website22.
• Removing sites coincident with hydro generation already in operation.
o A Google Earth file identifying the locations of existing small-scale hydro generation and
a list containing key information on each operational scheme was provided by the
Independent Electricity Generators Association (IEGA). As the Google Earth file was
dated 2012, schemes that had been constructed since then were identified and added.
A spreadsheet containing limited information on these operational schemes was also
19
1200m was deemed to be an appropriate maximum distance for this filter as it was considered unlikely two valid
sites of generation would be present over the same river segment for distances less than this.
20
Although it would have been preferable to compare the ‘best of’ stream segment results over a greater distance,
900m was deemed to be the appropriate maximum distance as any greater than this increased the risk of
comparing potential ‘candidates’ on adjacent rivers and thus inadvertently removing potentially valid opportunities
of hydro generation.
21
https://koordinates.com/layer/754-doc-public-conservation-areas/
22
https://www.mfe.govt.nz/fresh-water/water-conservation-orders/existing-water-conservation-orders
Page|15Embedded Hydro Generation Opportunities
provided by IEGA and updated as required (see Appendix D). Of the 78 existing small-
scale hydro schemes listed in Appendix D, 55 are greater than or equal to 1MW.
• Identifying the optimal site where two or more potential results are not compatible with each
other and removing those sites that are sub-optimal.
o Where groups of potential candidates were in close proximity and clearly not compatible
• Removing sites that are considered logistically impractical from an access or construction
perspective.
o This subjective assessment was made in consideration of topography, proximity to
existing road network, difficulty in access to the intake location, difficulty in penstock
route (based on topography), difficulty in location of powerhouse (i.e. if powerhouse
location could only be located in a steeply incised channel) and assumed distance from
local distribution network assets23.
This manual filtering process significantly reduced the number of potential candidates to produce a final
list that not only meets the power generation criteria, but one that has also been scrutinised through a
constructability lens.
5. Literature review
A literature review was undertaken to determine whether previous studies had identified new potential
hydro generation opportunities. Most studies concerned large-scale opportunities and as such were not
relevant to this assessment of small-scale embedded opportunities. However, one study, undertaken in
2004 by East Harbour Management Services (EHMS), contained a comprehensive summary of potential
new hydro opportunities throughout New Zealand, including large scale impoundment schemes, smaller
run-of-river schemes and irrigation schemes. In summarising the information in the EHMS report to
identify potential new run-of-river hydro generation schemes, the following rationale was applied:
• Discarding those opportunities that have been constructed.
• Discarding those opportunities also identified through the GIS modelling.
• Discarding those opportunities involving large dams.
• Discarding those opportunities considered highly unlikely to receive resource consent approval.
The resultant list of sites represents those opportunities that could be considered in addition to the list
of sites identified through the GIS modelling.
6. Results
Table 2 lists the potential projects identified through the GIS modelling process described in Section 4.
84 potential schemes have been identified, which have been grouped by the Regional Council area in
which they are located. Table 3 summarises the same information, but with the results aggregated by
region council area. An estimate of generation (in GWh/annum) has been made based on an assumed
capacity factor of 65%. This capacity factor was calculated by averaging the capacity factors for
operational small-scale hydro schemes greater than 1MW where such information was able to be
obtained from scheme owners.
23
It had been intended that GIS information from each of the Electricity Distribution Businesses (aka
“Network/Lines Companies”) would be obtained during the study and used as a criterion on which to filter out
unfeasible sites due to distance from existing line assets. However, only a small number of Lines Companies
provided the information, and as such, this method of filtering sites was not possible, other than via a conservative
estimate of distance from where existing assets are anticipated to be located.
Page|16Embedded Hydro Generation Opportunities
Table 2 List of potential small-scale hydro schemes identified through GIS modelling
River Channel Straight Line Power Station Flow Head Capacity Generation DOC Land Distance to nearest road
ID Region Length (km) Length (Km) (m3/s) (m) (MW) (GWh/annum) Classification (km)
1 Northland 4.1 3.1 11.8 44 3.5 19.7 Marginal StripEmbedded Hydro Generation Opportunities
Table 3 Summary of potential small-scale hydro schemes by Region
Number of Total Capacity Total Generation Average Max scheme Min scheme Number within Number outside
Potential Schemes Potential (MW) Potential (GWh/annum) scheme size size size DOC land DOC land
Northland 1 3.5 19.7 3.5 3.5 3.5 1 0
Auckland
Waikato 9 16.5 94.0 1.8 4.2 1.0 4 5
Bay of Plenty 8 22.3 126.7 2.8 4.2 1.0 2 6
Gisborne 5 12.0 68.6 2.4 3.6 1.1 1 4
Taranaki 5 15.7 89.3 3.1 5.6 1.0 0 5
Manawatu-Wanganui 10 31.5 179.6 3.2 7.4 1.2 4 6
Hawkes Bay 6 18.7 106.4 3.1 4.1 1.6 0 6
Wellington 4 13.6 77.6 3.4 4.4 2.8 0 4
Tasman-Nelson 3 9.5 54.2 3.2 6.5 1.0 3 0
Marlborough 3 5.6 31.7 1.9 2.3 1.0 3 0
West Coast 17 55.6 316.7 3.3 8.7 1.3 15 2
Canterbury 2 9.7 55.0 4.8 8.5 1.2 0 2
Otago 3 5.7 32.3 1.9 2.6 1.1 0 3
Southland 8 16.6 94.5 2.1 4.3 1.4 4 4
Total 84 236 1346 2.8 8.7 1.0 37 47
Also noted in Table 2 is whether a particular site is within DOC land, and if so, the type of that land
classification. It is possible that obtaining resource consent approval for locations within DOC land may
be more difficult or have greater limitations in regard to water take than for other locations, however
this has not been quantified for this study. The distance to the nearest existing road has also been
calculated. This can be a helpful parameter in understanding the magnitude of additional costs that
could be faced with construction of new roads accessing the site location – which may lessen the
attractiveness of a site, from an economic perspective. The manual filtering process, described in
Section 4.1.4, also filtered out sites that would be significant distances from existing roads.
In assessing the results, it is not surprising that so few potential sites were identified in Northland and
that none were identified in Auckland - neither of these regions have significant hydro power potential –
partly due to the topography that is characteristic over much of this part of New Zealand. At the
completion of the automated filtering process, there were no potential sites identified in the Auckland
Region and just three potential sites in Northland. The Northland sites were reduced to one during the
manual filtering process – with one being discarded due to coincidence with an existing scheme (the
5MW Wairua scheme, owned and operated by Northpower) and another being discarded as it was
deemed to be logistically impractical.
In contrast, it is surprising that there were not more sites identified in the Otago and Canterbury regions.
This is likely to be due to the limitations of the GIS modelling - which can ‘miss’ opportunities, as
described in Section 7, and/or could have been due to potential opportunities being inadvertently
discarded during the manual filtering process due to an overly harsh assessment of the access or
construction logistics.
This premise is somewhat endorsed when comparing the GIS modelling to those sites identified through
the literature search, described in Section 5. Table 4 lists those opportunities identified in the EHMS
(2004) report that were not identified through the GIS modelling and as such could be considered as
additional opportunities to those listed in Table 2. Many of these schemes involve longer conveyance
lengths than the criteria allowed for in the GIS modelling and assume a degree of storage that was not
able to be considered in the GIS modelling. Also, most are high flow, low head schemes – which are the
types of schemes that are more likely to be missed by the GIS modelling due to the inherent inaccuracies
of the DEM that are more pronounced when comparing small differences in elevation.
Page|18Embedded Hydro Generation Opportunities
Table 4 Summary of potential small-scale hydro schemes identified by EHMS (2004)
Capacity Generation
ID Region (MW) (GWh/annum)
EHMS 1 Waikato 7 39.9
EHMS 2 Manawatu - Wanganui 7 39.9
EHMS 3 Hawkes Bay 10 56.9
EHMS 4 Wellington 9 51.2
EHMS 5 West Coast 5 28.5
EHMS 6 West Coast 7 39.9
EHMS 7 West Coast 8 45.6
EHMS 8 Canterbury 12 68.3
EHMS 9 Canterbury 6 34.2
EHMS 10 Canterbury 11 62.6
EHMS 11 Otago 6 34.2
EHMS 12 Otago 6 34.2
EHMS 13 Otago 8 45.6
EHMS 14 Southland 5 28.5
Total 107 609
Note: A capacity factor of 65% has been assumed in the calculation of annual generation
In summary, the 84 locations identified through the GIS modelling could contribute an estimated 236
MW of capacity and 1346 GWh/annum generation. The literature search suggests there may be another
14 locations that could be considered as being potential hydro power opportunities. These would add a
further 107 MW capacity and 609 GWh/annum generation – giving a combined 98 locations, 343 MW
capacity and almost 2,000 GWh/annum generation. In total, these theoretically possible opportunities
represent a significant number of as yet undeveloped potential small-scale hydro power schemes – more
than the number of small-scale schemes that have been constructed in New Zealand to date. However,
given the spread of sites across New Zealand and the estimated total generating capacity of just 343MW,
it is unlikely small-scale hydropower generation will provide a great deal of support to meeting future
demand growth.
Furthermore, an assessment of the consentability or the ability to secure access rights to the land has
not been undertaken and indeed site visits would be required before any locations can be confirmed as
being appropriate for development. Almost half of the locations are within DOC administered land
which may result in greater consenting challenges or a requirement for maintaining higher
residual/environmental flows downstream of the intake locations. It would be unreasonable to assume
that all of the sites would be ultimately deemed appropriate for development and be progressed for
construction. Indeed, discussions with an experienced developer of small-scale hydropower schemes in
New Zealand suggests that the number of these theoretically possible opportunities that would actually
be constructed is likely to be just a fraction of the total identified during this study.
7. Data Limitations
Using GIS to identify potential sites for small-scale hydro generation is achievable and the methodology
employed worked well in identifying potential hydro power opportunities, including the identification of
a high proportion (approximately 80%) of the existing sites of run-of-river hydro power exceeding 1MW
capacity also being identified through the modelling.
However, there are limitations in using GIS, and the modelling is only as good as the data upon which it is
based. Any errors or uncertainty in either the River Flows dataset or the DEM elevation data will lead to
inaccuracies in the modelling results, and this will be manifested by:
• Invalid sites being identified.
• Valid sites that are not identified (noting that this could also be due to the conveyance distance
criteria being too short).
• Valid sites identified, but not at their correct generation capacity potential.
Page|19Embedded Hydro Generation Opportunities
River flow
It is unreasonable to assume that the modelling of river flows throughout New Zealand based on 485
discrete locations, as was undertaken by NIWA to determine the River Flows (and Percentile Flows)
datasets will represent all river flow characteristics accurately. Consequentially, there will almost
certainly be locations where actual river flows are greater, or lower, than modelled flows. In such
circumstances, the GIS modelling process may miss potential hydro power generation opportunities or
may identify opportunities incorrectly.
While an assessment of the occurrence of this potential error was not undertaken during this study, it
was recognised, during the manual thinning process, that there were two occurrences where it was
noted that modelled flows did not align well with actual river flow. These were in relation to the Rimu
scheme and the Toronui Scheme located in Hawkes Bay (owned and operated by Trustpower). These
schemes (especially the Rimu) have high head and low flow and have generation capacities of
approximately 2.4MW and 1.4 MW respectively.
Interrogation of the NIWA Probability Flow dataset revealed that the 65th percentile flows at the Rimu
and Toronui intakes are 0.24 m3/s and 0.16 m3/s respectively. These flows are lower than the minimum
flow criteria prescribed in the GIS script (see Appendix B). As such, these sites could not have been
identified by the modelling process. However, actual 65th percentile flows at the intakes of these
schemes is almost 50% greater for the Rimu and almost 100% greater for the Toronui24. The likely
reason why the NIWA modelled data under-estimates flows at these locations is probably due to the fact
that both the Rimu and Toronui schemes are located on spring fed rivers which have higher than
‘normal’ flows given their catchment areas. The modelling undertaken by NIWA to estimate the river
flows would not have been able to consider this level of site specific detail, especially so far up in the
catchment (and so far from the hydrological stations upon which the extrapolations are based).
Another issue is that the maximum power station flows for the Rimu and Toronui schemes are 1 m3/s
and 1.2 m3/s respectively. These design flows are significantly greater than the actual 65th percentile (or
even the 80th percentile) flows and thus even if the minimum flow constraint in the modelling process
had been set to a lower flow limit, the calculated generation capacity, assuming a 65th percentile flow,
would not have exceeded 1MW and thus they would not have been identified as potential sites of hydro
power generation.
Head calculation
There are two main sources of potential error in regard to the calculation of the head for a location of
potential hydro power generation. The first is the inherent inaccuracy of the LINZ 8m DEM, which, as
noted by LINZ, and as described in Section 4.1.1, is ±22 metres horizontally and ±10 metres vertically.
The difference of a few metres of head could cause some valid locations to be missed, or to identify
locations that are not valid.
The second source of potential error is in the correlation of the NIWA digitised river channels with the
river channels as determined by the DEM. Figure 7 is an image showing the colour graduated elevation
based on the DEM and the digitised river channels as contained in the NIWA River Flows dataset. As can
be seen, in general the digitised river channels align closely with the DEM, however there are instances
where the correlation between the datasets is not as accurate as desired (as identified on Figure 7).
Errors in calculation of river channel elevation could result where the two datasets do not align closely,
and this would be manifested in the river elevation increasing and appearing to go uphill at such
locations. Given that the modelling process first transformed the digitised river channels into points
every 200m (or less where river tributaries join) the likelihood of this type of error is somewhat
mitigated, but nonetheless remains a potential source of error. This type of error is more likely to occur
at locations of high flow and low head – where gradients are low and river channels are meandering.
24
Based on advice from Trustpower
Page|20Embedded Hydro Generation Opportunities
Figure 7 Correlation between the NIWA River Flows digitised river channels and the LINZ 8m DEM, indicating
locations of suboptimal correlation (circled red).
Storage
Many small hydro power schemes in New Zealand have some degree of storage associated with them –
as the benefits of storage, even if only modest, can greatly improve the project economics. Having
storage would likely mean that the maximum power station design flow would be greater (giving an
increased maximum generating capacity) and annual generation would likely also be greater, due to the
ability to capture and store flows that would otherwise be spilled during high flow events. This potential
issue has already been highlighted by the Toronui scheme example described previously, but almost
certainly will be an issue for any locations with storage potential. However, it was not possible to model
the potential for storage as part of the GIS modelling exercise undertaken for this study. The scope of
the objective and the available datasets that were used in the analysis made such an assessment too
difficult. As such, this remains another potential source of error where potential opportunities could
have been missed.
Conveyance distance
Constraining the distance over which to assess the potential for the 1MW generation criteria to be met is
another potential source of error. As noted in Section 4.1.1, an assumption had to be made as to what
the appropriate maximum conveyance distance should be. While the conveyance distance criteria
selected has sound logic behind it (and is based on actual distances for existing small-scale hydro
schemes) there remains the possibility that some opportunities, particularly those with high flow and low
head which have long diversion channels, could be missed. It is likely that some of the potential schemes
described in the 2004 EHMS report would have been identified by the GIS modelling process if a longer
conveyance distance had been adopted.
GIS process data interval
As described in Section 4.1.2 the data in the River Flow dataset was transformed from line information to
point information in order for the routing script to function properly. Clearly, the greater the point
Page|21Embedded Hydro Generation Opportunities
density, the greater the data quality – but also the larger the file size. As such a balance had to be found
between data quality and file size. A point interval of 200m was ultimately selected as being an
appropriate interval, with additional points wherever tributaries intersect. Given that the river segment
lengths range from 30m to 29km (see Section 4.1.1), this will mean that there will be some reaches
where points are as close as 30m to each other. It will also mean that there are some reaches where the
distance between points is consistently 200m for significant distances.
While this data interval is not of concern from a river flow perspective – in fact it means that every
location where river flows change will be captured – it does mean that there may be occurrences where
there is a ‘smoothing’ of elevation given that data from the DEM will, for some stretches of river, only be
taken every 200m. This may result in less accurate calculations of head, grade and generation per
kilometre. However, the magnitude of this potential error is low, and the consequence is minor.
8. Final thoughts
The combined capacity and annual generation potential of identified small-scale hydro power
opportunities is not at a level which suggests they could play a significant part in meeting New Zealand’s
future demand growth. It is also a ‘mature’ technology, and thus one that is unlikely to see a decline in
future costs per installed capacity, such as is the case with other technologies such as wind and solar
where technology improvements are continuing to decrease the capital costs. As such, small-scale hydro
power generation is likely to be at a disadvantage, from an economic perspective, in comparison to wind
and solar generation.
However, embedded generation projects can be eligible for Avoided Cost of Transmission (ACOT)
payments, which can improve project economics. Additionally, in some areas, small-scale hydro power
could help with meeting electricity demand at a local level and also provide network stability. The value
of this should not be underestimated, especially if modest storage is available and higher capacity factors
are possible than that assumed, enabling generation to be provided to the network for significant
occurrences of time.
It should also be noted that there are likely to be many more potential opportunities of hydro power
schemes throughout New Zealand that would generate less than 1MW. Although the identification of
such schemes were outside of the scope of this particular study, it is safe to assume that, collectively,
these opportunities are also unlikely to provide a significant amount of new generating capacity and
annual generation to meet New Zealand’s future demand growth.
9. About the authors
The research was undertaken by Steve Harding and Graeme Mills of Roaring 40s Wind Power Ltd (R40s)
with assistance and input by a number of industry experts. GIS analysis and advice was provided by
Critchlow Geospatial with direction by R40s.
R40s was formed in 2018 to provide consultancy services to organisations wanting to identify, investigate
and develop renewable energy projects. Our experience covers a wide range of project development
aspects – site identification, land access negotiations, feasibility studies, resource modelling, project
economic analysis, consent strategy and applications, consent hearings, stakeholder engagement, detail
design studies and business case preparation.
Steve and Graeme have a significant amount of experience in hydropower investigations and operation,
most of which was gained whilst working for ECNZ and Works/Opus Consultancy in hydrology-related
fields. During his time at ECNZ Graeme was lead author of a number of studies that summarised the
hydropower potential of New Zealand, including the identification and assessment of potential sites of
new hydro generation. Steve was involved in securing the resource consent for the water take for the
Rimu and Toronui hydro power schemes (constructed in 2013 and owned/operated by Trustpower) and
is currently investigating a mini-hydro opportunity in Hawkes Bay that would be embedded to the local
distribution network.
Page|22You can also read