Handling Mobility in Low-Power Wide-Area Network
←
→
Page content transcription
If your browser does not render page correctly, please read the page content below
Handling Mobility in Low-Power Wide-Area Network

                                                                     Dali Ismail                                       Abusayeed Saifullah
                                                          Department of Computer Science                          Department of Computer Science
                                                              Wayne State University                                  Wayne State University
                                                              Detroit, Michigan, USA                                  Detroit, Michigan, USA

                                        Abstract
arXiv:2101.01518v1 [cs.NI] 5 Jan 2021

                                                                                                         offering long-range (several miles), low-power, and low-
                                            Despite the proliferation of mobile devices in various       cost communication [22]. With the fast growth of IoT,
                                        wide-area Internet of Things applications (e.g., smart city,     multiple LPWAN technologies have emerged recently such
                                        smart farming), current Low-Power Wide-Area Networks             as LoRa [24, 13], SigFox [46], IQRF [20], RPMA [19],
                                        (LPWANs) are not designed to effectively support mobile          DASH7 [9], Weightless-N/P [53], Telensa [1] in the ISM
                                        nodes. In this paper, we propose to handle mobility in           band, and EC-GSM-IoT [17], NB-IoT [33], and LTE Cat
                                        SNOW (Sensor Network Over White spaces), an LPWAN                M1 [26, 25] in the licensed cellular band. To avoid the
                                        that operates in the TV white spaces. SNOW supports mas-         crowd in the limited ISM band and the cost of licensed band,
                                        sive concurrent communication between a base station (BS)        SNOW (Sensor Network Over White spaces) is an LPWAN
                                        and numerous low-power nodes through a distributed im-           architecture to support scalable wide-area IoT over the TV
                                        plementation of OFDM. In SNOW, inter-carrier interference        white spaces [44, 42, 43]. White spaces are the allocated
                                        (ICI) is more pronounced under mobility due to its OFDM          but locally unused TV spectrum (54 - 698 MHz in the US)
                                        based design. Geospatial variation of white spaces also          [34, 35]. They usually have wide and less crowded spectrum
                                        raises challenges in both intra- and inter-network mobility      in rural and most urban areas, with an abundance in rural
                                        as the low-power nodes are not equipped to determine white       areas [3].
                                        spaces. To handle mobility impacts on ICI, we propose a dy-          With a wide range of supported applications, IoT is inte-
                                        namic carrier frequency offset estimation and compensation       grating more mobile nodes/devices in different domains (e.g.
                                        technique which takes into account Doppler shifts without        agriculture [51, 52], connected vehicle [27], healthcare [21],
                                        requiring to know the speed of the nodes. We also propose        smart city [55]). For example, in agricultural IoT, the use of
                                        to circumvent the mobility impacts on geospatial variation       drones and tractors is rapidly increasing [29, 14, 15, 52]. It
                                        of white space through a mobility-aware spectrum assign-         is expected that by the year 2050, there will be more than 3
                                        ment to nodes. To enable mobility of the nodes across differ-    billion wearable sensors [36]. The cellular-based LPWANs
                                        ent SNOWs, we propose an efficient handoff management            rely on wired infrastructure to handle mobility. Such infras-
                                        through a fast and energy-efficient BS discovery and quick       tructure is often not available in rural and remote areas (e.g.,
                                        association with the BS by combining time and frequency          farms, oil fields, etc.). In others, mobility introduces chal-
                                        domain energy-sensing. Experiments through SNOW de-              lenges that are not well-addressed yet. Study on LoRa shows
                                        ployments in a large metropolitan city and indoors show          that its performance is susceptible even to minor human mo-
                                        that our proposed approaches enable mobility across mul-         bility [36, 37].
                                        tiple different SNOWs and provide robustness in terms of             In this paper, we propose to handle mobility in LPWAN
                                        reliability, latency, and energy consumption under mobility.     in the white spaces (in the US) considering SNOW. With
                                                                                                         the rapid growth of IoT, LPWANs will suffer from crowded
                                        1   Introduction                                                 spectrum due to long range, making it critical to exploit
                                           Low-Power Wide-Area Network (LPWAN) is an enabling            white spaces. SNOW is a highly scalable LPWAN over the
                                        technology for wide-area Internet-of-Things (IoT) applica-       white spaces which enables massive concurrent communi-
                                        tions such as smart city, agricultural IoT, and industrial IoT   cation between a base station (BS) and numerous low-power
                                                                                                         nodes. It is available as an open-course implementation [47].
                                                                                                         Its physical layer is designed based on a Distributed imple-
                                                                                                         mentation of OFDM (orthogonal frequency division multi-
                                                                                                         plexing) for multi-user access, called D-OFDM. The BS op-
                                                                                                         erates on a wide band spectrum which is split into many or-
                                                                                                         thogonal narrowband subcarriers. A node (non-BS) trans-
                                                                                                         mits and receives on a subcarrier. In SNOW, inter-carrier
                                                                                                         interference (ICI) is more pronounced under mobility due to
                                                                                                         its OFDM based design. Geospatial variation of white spaces
                                                                                                         also raises challenges in both intra- and inter-network mo-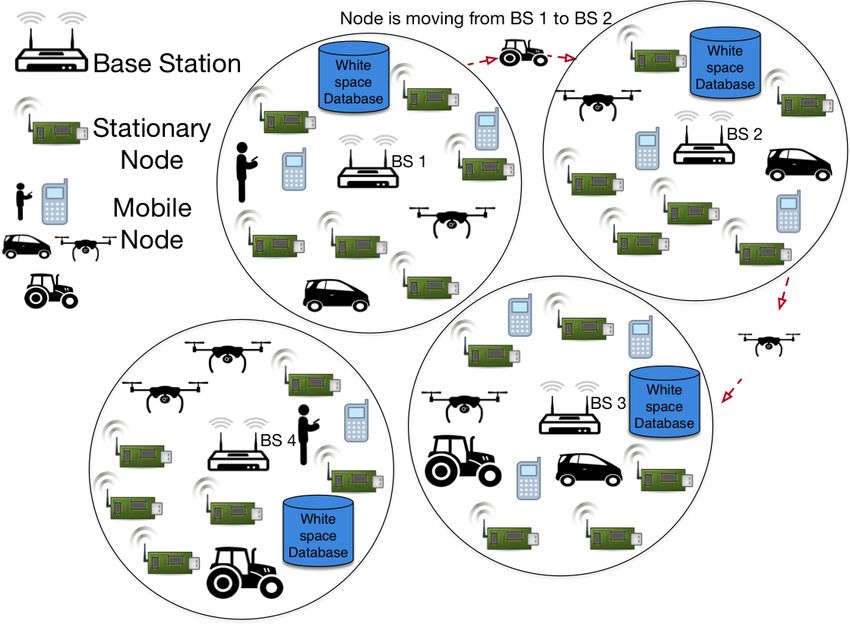
bility as the low-power nodes are not equipped to determine                              Location             Rx        BS        Tx
white space. For example, to enable mobility across different                          Internet                    …               …
SNOWs, it is challenging for a node to scan the wide spec-                         Available channels

trum of the TV band to discover a new BS. Besides, different           White Space
                                                                        Database
BSs may be using different subcarrier widths, which may re-
                                                                             Here a node is labeled
sult in subcarrier misalignment between the mobile node and                   using its subcarrier fi
the new BS.                                                                       Nodes             f3   f1        f2        f3        f4 … fn
    In this paper, we address the challenges mentioned above
to handle mobility in SNOW. Specifically, we make the fol-                     Figure 1. The SNOW architecture.
lowing new contributions.
    • To handle mobility impacts on ICI, we propose a dy-
      namic CFO (Carrier Frequency Offset ) estimation and
      compensation technique for SNOW which takes into
      account Doppler shifts under non-uniform speeds with-
      out requiring to know the speed of the nodes. To cir-
      cumvent the mobility impacts on geospatial variation
      of white space within the same SNOW, we propose a
      mobility-aware subcarrier assignment to the nodes.
    • To handle inter-SNOW (inter-network) mobility, we                                 Figure 2. SNOW hardware.
      propose an energy-efficient and fast BS discovery tech-
      nique that considers the trade-off between discovery la-
      tency and energy consumption to allow efficient hand-      mobility was studied in [30] for white space network, where
      off management. Our approach utilizes the spectrum         every device primarily relies on the database to determine
      information by combining the received signal features      the white spaces. A mobile device adds a protection range
      to distinguish between primary users (TV stations) and     of δd so that any channel blocked within distance δd of cur-
      a SNOW BS. We also propose a lightweight cross-layer       rent location is not used. Note that this approach does not
      technique feasible at the energy-constrained SNOW          work for SNOW as the nodes have no direct access to the
      nodes to handle subcarrier alignment by combining          Internet (and database). It first has to discover a BS, asso-
      time and frequency domain energy-sensing.                  ciate with it, and rely on it for spectrum access. Additionally,
   • We implement our proposed mobility handling tech-           there has been much work on channel rendezvous in cogni-
     niques on SNOW devices and perform experiments              tive radio [57, 45, 4, 8]. Due to technology-specific nature of
     by deploying SNOW in two environments - a large             SNOW, these techniques cannot be applied to a SNOW.
     metropolitan city and an indoor testbed. The experi-            Senseless [31] is an infrastructure based white space net-
     mental results show that our approaches enable mobil-       work system where the devices do not rely on sensing to
     ity across multiple different SNOWs. The results also       determine the availability of white space. They use geo-
     show an improvement of reliability from 80% to 96.6%        location service to calculate white space availability at any
     when our dynamic CFO estimation and compensation            location. Senseless then disseminates the availability infor-
     is incorporated.                                            mation to each device in the network. To address the mo-
   The rest of the paper is organized as follows. Section 2      bility challenges in white space, Senseless suggests that ev-
overviews related work. Section 3 presents an overview of        ery device adds a protection range to determine the avail-
SNOW. Section 4 describes the system model. Section 5            ability of white spaces while it is mobile. This could lead
presents our mobility approach. Section 6 presents the ex-       to a huge spectrum waste depending on the size of the pro-
periments. Section 7 concludes the paper.                        tection area. SNOW differ from Senseless in that it con-
                                                                 siders infrastructure-less network system where BSs are not
2    Related Work                                                connected. Besides, the D-OFDM based design requires
    Many studies focused on handling mobility in Wireless        a different approach for mobility in SNOW. Also, we in-
Sensor Networks (WSNs) [38, 2, 23, 54, 32, 11] (more can         corporate an energy-efficient sensing approach along with
be found in survey [10, 12]) and ad hoc network [5, 18].         the geo-location service to efficiently handle nodes mobil-
In WSN or WiFi networks, a client has to scan only a lim-        ity. To date, inter-network mobility for non-cellular LP-
ited/fixed number of channels to discover a new BS. How-         WAN remains mostly unexplored and it was never studied
ever, those approaches are not directly applicable to LP-        for SNOW.
WAN. To handle mobility across networks, cellular LP-
WANs rely on wired infrastructure. Non-cellular LPWANs           3   A Brief Overview of SNOW
are not yet handling it well. Real experiments show that            Here we provide a brief overview of the SNOW architec-
their performance is susceptible even to minor human mobil-      ture [42, 43, 44]. Due to long transmission (Tx) range (sev-
ity [36]. Spectrum mobility studied in [56, 48] for cognitive    eral miles at 0dBm), the nodes in SNOW are directly con-
networks enables secondary users to change the operating         nected to the BS, forming a star topology as shown in Fig. 1.
frequencies, and is different from device mobility. Device       We use ‘node’ to indicate a sensor node. The BS periodically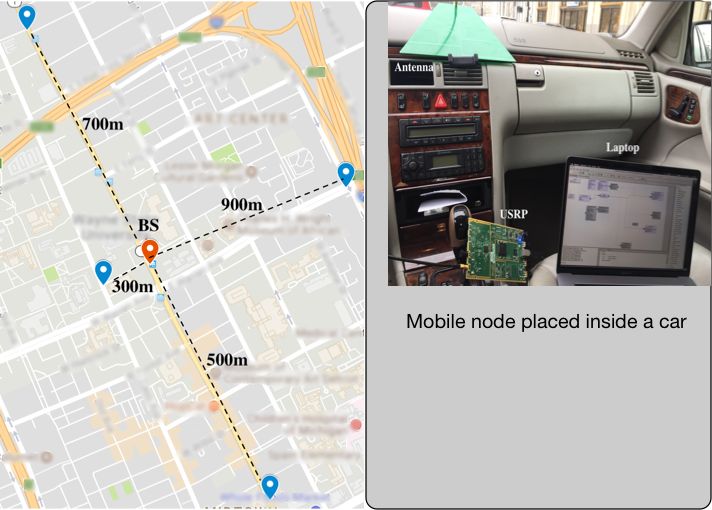
determines white spaces by providing locations of its own
and of all other nodes in a cloud-hosted database through the
Internet. It uses wide white space spectrum as a single wide
channel that is split into narrowband orthogonal subcarriers,
each of equal spectrum width (bandwidth). Each node has a
single half-duplex narrowband radio. It sends/receives on a
subcarrier. The nodes are power-constrained, and do not do
spectrum sensing or cloud access. As shown in Fig. 1, the
BS uses two radios operating on the same spectrum – one
for only transmission (called Tx radio) and the other for only
reception (called Rx radio) – to facilitate concurrent bidirec-
tional communication.
The physical layer (PHY) of SNOW is designed based
on a Distributed implementation of OFDM for multi-user
Figure 3. Inter-SNOW mobility: the figure shows mul-
access, called D-OFDM. D-OFDM splits a wide spectrum
tiple SNOWs where a mobile node is moving from one
into numerous narrowband orthogonal subcarriers enabling
SNOW to another.
parallel data streams to/from numerous distributed nodes
from/to the BS. A subcarrier bandwidth is in kHz (e.g.,
50kHz, 100kHz, 200kHz, or so depending on packet size Internet. We assume each BS knows the location of its asso-
and needed bit rate). The nodes transmit/receive on orthog- ciated nodes either manually or through existing localization
onal subcarriers, each using one. A subcarrier is modulated techniques [28]. However, we are not considering localiza-
using Binary Phase Shift Keying (BPSK) or Amplitude Shift tion in this paper.
Keying (ASK). If the BS spectrum is split into m subcarriers,
it can receive from m nodes simultaneously using a single 5 Handling Mobility
antenna. Similarly, it can transmit different data on differ- In this section, we present our techniques to address
ent subcarriers through a single transmission. Currently, the mobility challenges in both intra- and inter-SNOW mobil-
sensor nodes in SNOW use a very simple and lightweight ity. We propose to address those through lightweight cross-
CSMA/CA based MAC (media access control) protocol like layer approaches (MAC-PHY design) feasible at energy-
the one used in TinyOS [50]. constrained nodes. First, we present our mobility handling
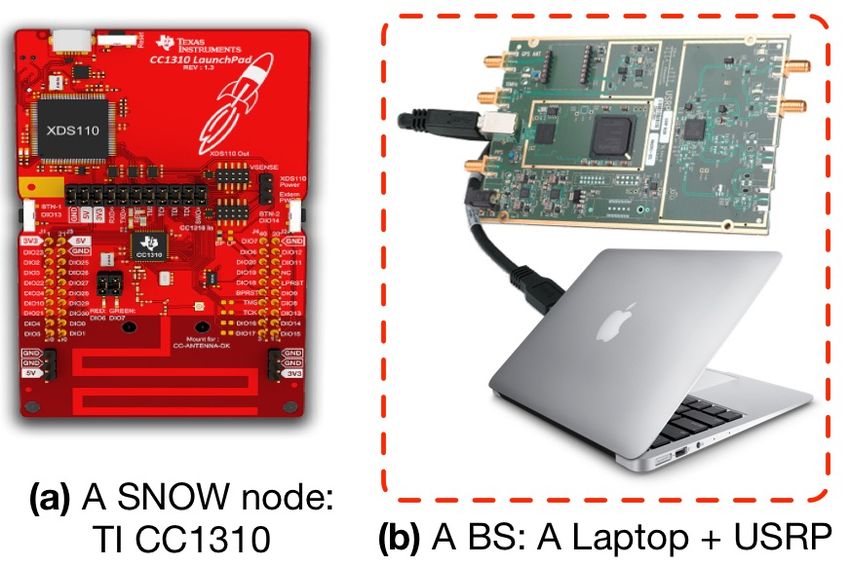
SNOW was implemented on two hardware platforms [39] within the same SNOW (intra-SNOW mobility), and then we
– USRP (universal software radio peripheral) [40] using will present mobility handling across SNOWs (inter-SNOW
GNU radio [16] and TI CC1310 [6] (Figure 2). A dual-radio mobility).
USRP connected to Raspberry PI or Laptop is used as the 5.1 Handling Mobility within the Same
BS. A CC1310 device or a single-radio USRP can be used as SNOW
a SNOW node. CC1310 is a tiny, cheap (
Orthogonally Spaced Overlapping Subcarriers                  A SNOW node calculates the CFO on join subcarrier f
                                                                          using the preambles from the BS to the node using the above
                                                                          approach. In upward communication, the time-domain sam-
                                                                          ples are used for CFO estimation on the join subcarrier f at
                                                                          the BS based on the above approach. Then the ppm (parts
                                                                          per million) on the receiver’s (BS or SNOW node) crystal is
                                                                          given by ppm = 106 ∆ff . Thus, the receiver (BS or a node)
                          With Frequency Offset                           calculates ∆ fi on subcarrier fi as
                                                                                                           fi ∗ ppm
                                                                                                 ∆ fi =             .
                                                                                                              106
                                                                          Thus the BS and a SNOW node that is assigned subcarrier
                                                                           fi calculates CFO on fi on its respective side. As the nodes
Figure 4. The impact of CFO on subcarriers orthogonal-                    asynchronously transmit to the BS, doing the CFO compen-
ity.                                                                      sation for each subcarrier at the BS is quite tricky. Hence,
                                                                          a simple feedback approach for proactive CFO correction
                                                                          in upward communication is adopted. In this approach, a
a node joins the network. SNOW uses one (or more) sub-                    transmitting node adjusts its frequency based on ∆ fi when
carrier for a node joining the network, called join subcarrier,           transmitting on subcarrier fi so that the BS does not have to
that does not overlap with any other subcarrier. Each node                compensate for ∆ fi .
joins the network by first communicating with the BS on a                      Since mobility causes Doppler shift in frequency con-
join subcarrier. Each way, communication (BS to node and                  tributing further to CFO, CFO has to be estimated using the
node to BS) follows a preamble used to estimate CFO on                    above approach while a node moves. If a node moves at
join subcarrier. Specifically, preamble from a node to BS al-             speed v, such Doppler Frequency Offset (DFO), denoted by
lows to estimate CFO at the BS, and that from BS to a node                δ f (v), is upper-bounded by
allows to estimate CFO at the node on the join subcarrier.                                                      v
Later, based on the CFO on a join subcarrier, the CFO on                                            δ f (v) = fc                       (2)
a node’s assigned subcarrier is determined. CFO estimation                                                      c
technique for both upward and downward communication is                   where, c is the speed of light, and fc is the carrier frequency.
similar. However, CFO compensation approaches in upward                   Therefore, considering ∆ fi as the CFO when a node is sta-
and downward communication are different (refer to [39] for               tionary, it experiences a total CFO of ∆ fi + δ fi (v) when it
detailed explanation).                                                    moves at speed v. Therefore, to account for this total CFO,
   First, we explain how CFO is estimated on a join subcar-               the node needs to know its speed. Besides, when the speed
rier f . Since it does not overlap with other subcarriers, it is          changes, δ fi has to be recalculated. But, being energy-
ICI-free. If fT x and fRx are the frequencies at the transmitter          constrained and low-cost, SNOW nodes are not equipped
and at the receiver, respectively, then their frequency offset            to determine their speeds. Hence, we rely on the observa-
∆ f = fT x − fRx . For transmitted signal x(t), the received sig-         tion that when CFO is estimated for a moving node using
nal y(t) that experiences a CFO of ∆ f is given by                        the above CFO estimation technique, its estimation includes
                                                                          both ∆ fi and δ fi , resulting in a CFO of ∆ fi + δ fi . Thus,
                          y(t) = x(t)e j2π∆ f t                     (1)   the node does not need to know its speed. If the node’s
                                                                          speed changes, then the total CFO changes and we need re-
   ∆ f is estimated based on short and long preamble ap-                  estimate. However, the node has no way to determine if its
proach using time-domain samples. A 32-bit preamble is                    speed increases or decreases. To handle this challenge, we
divided into two equal parts, each of 16 bits. First part is for          enable each node to periodically estimate the CFO. This pe-
coarse estimation and the second part is for finer estimation             riod can be set as a tunable system parameter that can be
of CFO [49]. Considering δt as the short preamble duration,               adjusted dynamically. Estimating CFO periodically will en-
                                                                          sure that if the speed changes, the new CFO calculation takes
                    y(t − δt) = x(t)e j2π∆ f (t−δt) .
                                                                          the new speed into account.
Since y(t) and y(t − δt) are known at the receiver,                       5.1.2   Handling Mobility Impacts on Geospatial Vari-
                                                                                  ation of White Spaces
          y(t − δt)y∗ (t) = x(t)e j2π∆ f (t−δt) x∗ (t)e− j2π∆ f t            Due to long range, a node’s mobility even within the same
                                     2 j2π∆ f −δt                         network affects the spectrum availability. For example, a
                           = |x(t)| e
                                                                          subcarrier that is assigned to a node at a particular place may
Taking angle of both sides,                                               not be available if the node moves to another location within
                                                                          the range of the same BS (i.e., within the same SNOW). Cur-
        ^y(t − δt)y∗ (t) = ^|x(t)|2 e j2π∆ f −δt = −2π∆ f δt.             rently, the BS assigns subcarriers to the nodes without con-
                                                                          sidering their mobility. This may affect the communications
                                   ^y(t − δt)y∗ (t)                       of the mobile nodes. Namely, if a node is highly mobile
Thus,                    ∆f =−                                            and may move anywhere inside the network but is assigned a
                                        2πδt
BS subcarrier
   bandwidth

                           BS Spectrum
                  Node subcarrier bandwidth equal
                  to new BS subcarrier bandwidth

                  Node subcarrier bandwidth narrower
                  than new BS subcarrier bandwidth
                      Node subcarrier bandwidth
                       wider than new BS
                        subcarrier bandwidth

          (a) Subcarrier aligned with BS                                                        (b) Scenarios showing unalignment
                                  Figure 5. Alignment between the node subcarrier and BS subcarrier.

subcarrier which is available only in a few locations, its sub-      thogonal when over time T 0 [7]:
carrier assignment is not much useful. To handle this prob-                        Z T0
lem due to geospatial variation of white spaces, we propose                               cos(2π fit) cos(2π f j t)dt = 0.          (3)
a mobility-aware subcarrier assignment policy as follows.                           0

    Note that the BS is already assumed to know the loca-                For example, when the overlap between subcarriers is
tion information of its coverage area. We also assume that           50%, the BS bandwidth is 6 MHz, and the subcarrier width
the BS knows the degree or rate of mobility of each node             is 200 kHz, we can have 59 orthogonal subcarriers. Thus, to
(i.e, how much mobile the node is). A node can provide a             discover a new BS, it is very energy and time consuming for
rough estimate of its mobility when it joins the network. For        a low-power node as the node may need to scan thousands
example, in agricultural IoT, the system designer knows the          of subcarriers. Our approach has to deal with the following
number of mobile nodes (e.g., tractors and drones) and each          challenges as well. (1) Spectrum dynamics due to primary
node’s mobility rate in a specific geographical area. The BS         user activity is handled using backup subcarriers in SNOW.
orders the nodes based on their mobility, where the station-         However, such an approach does not work under mobility
ary nodes come first and the most mobile node is the last.           as the backup channels may be unavailable in a new loca-
The BS then orders the subcarriers based on their availabil-         tion. A SNOW node has no access to the database and thus
ity, from the least widely available (inside its communication       does not know the white space spectrum availability in its lo-
range) subcarrier to the most widely available one. That is,         cation. Spectrum sensing is highly energy consuming and is
the subcarrier that is available in the minimum number of lo-        not feasible for it. (2) It cannot transmit any probing message
cations comes first and that available in the maximum num-           to explore a BS as it can interfere with primary users. The
ber of locations (inside the network) comes at the last of this      node hence needs to depend only on listening to SNOW’s
order. If there are m subcarriers and n nodes, each subcarrier       communication. (3) The nearby BS may be using subcarri-
is roughly shared by d mn e nodes. Starting from the beginning       ers of different bandwidth, and thus the node subcarrier may
of the ordered subcarriers, each subcarrier is then assigned         be unaligned (as depicted in Figure 5) and listening to noth-
roughly to d mn e nodes that are not yet assigned a subcarrier       ing. Aligning with a BS channel is quite difficult as the BS
starting from the beginning of the ordered nodes. In this way,       subcarrier bandwidth is unknown to the moving node. (4)
we ensure that the widely available subcarriers are assigned         The node should be able to distinguish between a primary
to highly mobile nodes and the least widely available subcar-        user and a secondary user (BS). Our steps to address these
riers are assigned to stationary or less mobile nodes.               challenges are as follows.
                                                                     5.2.1   BS Discovery
                                                                         A direct approach to minimizing BS discovery over-
5.2    Handling Mobility across SNOWs                                head is that the current BS can provide a node, before it
                                                                     moves, the channels that the BS would find at 8 locations
   In this section, we present our approach to addressing the        (0, ±r), (±r, 0), (±r, ±r), considering its (estimated) com-
mobility across different SNOWs. Specifically, we handle             munication range r and location at (0, 0) assuming a Carte-
mobility problem that arises when a node goes out of the             sian plane as shown in Fig. 6. After a node moves out of the
range of a BS. When a node goes out of the range of a BS, it         current BS range, it can scan only those channels to find a
needs to discover a new BS and get associated with it. Hand-         neighboring BS. However, this approach would only work if
off becomes an issue when a node moves to an uncoordinated           it can inform the BS of its intention to move before it starts
SNOW whose operating spectrum is unknown.                            to move. Second, the node needs to know the direction of its
   For SNOW, the white space range is very wide, and the             movement and inform the BS. Hence, we also propose an-
SNOW BS may be using a channel anywhere in that spec-                other energy-efficient and fast BS discovery technique that
trum. A node operates on a narrowband subcarrier. Two                does not depend on these requirements. It utilizes the spec-
subcarriers at center frequencies fi and f j , fi 6= f j , are or-   trum information by combining the received signal features
to distinguish between primary users (TV stations) and a the results for TV station detection. It is clear from Fig-
SNOW BS, and considers the trade-off between discovery ure 7(a) that without considering the antenna correction fac-
latency and energy consumption to allow efficient handoff tor, CC1310 fails to detect TV transmission in all occu-
management. pied channels. Operating in a low-frequency spectrum gives
SNOW a tremendous obstacle penetration performance [42].
Additionally, extensive experiments on TV detection perfor-
0,r mance is found in [41].
-r,r r,r We utilize a number of features of the received signals
to distinguish between primary users (TV stations) and a
SNOW BS. In addition to the common observation that RSS
!"#$%"$#
-r,0 !" r,0 of the TV transmission is high and the signal amplitude is
constant, primary user communication is observed to be con-
tinuous over a long duration (see Figure 8(a)). In contrast,
-r,-r r,-r SNOW BS signal amplitude is fluctuating during transmis-
0,-r sion and the BS may not have continuous communication
for long periods as shown in Figure 8(b). In addition, if mul-
Figure 6. Channel availability information in 8 locations. tiple consecutive channels have similar RSS, it is likely to be
a BS because a BS typically uses more than one TV channel.
After a node goes out of range of its BS, it will scan one For primary users, two consecutive channels should belong
or more of its subcarriers. In either case, if it senses signal to two different primary users, and their signal strengths on
strength on a subcarrier, then it has to determine whether it two consecutive channels should be a lot different. To en-
is a BS or a primary user. If its subcarrier is not aligned with able faster discovery, we also consider using a wider band
that subcarrier (in case of BS), it may not decode the received for sensing, which will enhance the BS detection probability
packets. To distinguish between the TV signal and the BS but will consume more energy. Since using a narrow sub-
signal, we first need to detect the presence of primary users. carrier for searching can take a longer time, thus consuming
The FCC regulation for protecting primary incumbents de- much energy, such tradeoff is left as a design choice.
fine a protection contour for TV station as the area where the 5.2.2 Subcarrier Alignment
received signal strength (RSS) is > −84dBm [34]. We fol- Different SNOWs can have different subcarrier band-
low an approach similar to the one presented in Waldo [41]. width, e.g., camera or audio may use a wider subcarrier.
Waldo’s results show that low-cost sensors can efficiently de- Thus upon discovery of a new BS, as shown in Figure 5,
tect white spaces ignored in the databases and existing ap- a node’s subcarrier may not be aligned with a BS subcar-
proaches. Furthermore, depending on the white space de- rier. Alignment is needed to start communication. Exist-
vice’s antenna height, further separation (6 km for portable ing channel rendezvous techniques are not applicable as they
devices) is required to protect the primary incumbent. To de- consider the channels of equal bandwidth. Thus, this prob-
tect white spaces, FCC recommends a typical antenna height lem is specific to SNOW. By Equation (3), an overlap can
of 10 meters. We consider an antenna height of 2 meters start from many points of a nearby subcarrier. Such an over-
and compensate for the difference (8 meters) using the an- lap makes the problem highly challenging. To solve the
tenna correction factor using Hatas’ urban area propagation problem, we exploit several characteristics of SNOW design.
model [41] considering hm as the antenna height in meters as Even though SNOW can use any subcarrier bandwidth, we
follows. consider that subcarrier bandwidth does not vary arbitrarily,
and we assume each BS uses a subcarrier bandwidth from the
a(hm ) = 3.2(log 11.5hm )2 − 4.97 (4) values 100kHz, 200kHz, 400kH, or 600kHz. Upon discov-
ering the presence of a BS, this assumption helps us simplify
Using Hata’s model, the calculations result in a(hm ) = the synchronization with its subcarrier. This will be done us-
7.5dB, which will be added uniformly to the RSS measure- ing a wider bandwidth at the node and combining time and
ments. The addition of the antenna correction factor di- frequency domain energy-sensing.
rectly impacts the noisy measurements by making it closer The time-domain sensing is the typical carrier sensing
to the threshold. Hence, improving the probability of false that calculates the energy level using a moving average of
TV channel detection. We also follow Waldo’s approach the digital signals, i.e., the sequence of discretized, com-
by considering the location safe for white space operation plex samples from the analog-to-digital converter, within a
if the RSS ≥ −84dBm, and the nearest measurement is 6 km short period. A channel is considered busy if the output ex-
away [41]. We record the measurements in a large metropoli- ceeds the predefined threshold. The moving average’s win-
tan city for five different TV channels (14, 22, 33 are occu- dow size is set to half of the length of the preamble to ensure
pied by TV stations, 16 and 25 are white spaces). Addition- prompt sensing of a packet. Although time-domain sens-
ally, we use the spectrum analyzer measurements and Google ing alone can sense a busy channel, it does not distinguish
spectrum database as the ground truth to evaluate the SNOW between different subcarriers. A node needs to analyze the
nodes’ TV channel detection performance. We collect 1500 frequency domain of the signals further. Specifically, it cal-
spectrum measurements using four low-cost SNOW nodes culates the power spectrum density (PSD) of the recent M
(TI CC1310 [6]) over a period of 48 hours. Figure 7 shows samples using Fast Fourier Transformation (FFT). The nodeAvg. Detection Error (%)
Avg. Detection Error (%)
100 100
CC1310 CC1310
Spectrum Analyzer Spectrum Analyzer
50 50
0 0
14 16 22 25 33 14 16 22 25 33
Channel # Channel #
(a) Channel detection before adding antenna cor- (b) Channel detection after adding antenna correc-
rection factor tion factor
Figure 7. Performance of TV detection
(a) TV transmission (b) SNOW transmission
Figure 8. TV and SNOW signal transmission recorded using a spectrum analyzer.
analyzes the power distribution and compares it with all pos-
sible channel-overlapping patterns based on the PSD. Intu- 6
200 kHz
itively, if the power is uniformly distributed over the entire 5 400 kHz
spectrum, then the signals on the air come from a fully- 600 kHz
Time (ms)
4
overlapped subcarrier; otherwise, only a fraction of the chan-
3
nel is occupied. The exact fraction of channel in use is hard
to calculate because different subcarriers may exhibit differ- 2
ent power levels due to frequency-selective fading, and the 1
imperfect hardware filter (used to confine the radio’s band-
0
width) spreads over the boundary of the PSD curve. But 200 400 600
considering a limited number of bandwidths, the node can Subcarrier bandwidth (kHz)
explore possible overlapping patterns and select the one with Figure 9. Subcarrier alignment latency
maximum matching with the PSD. The number of such pat-
terns will also be limited as it is done after determining the
presence of a BS. 6 Experiments
In SNOW, a node is less powerful and energy-constrained. We have first implemented our mobility approaches using
The complexity of time-domain sensing is the same as the TI CC1310 devices as SNOW nodes. TI CC1310 is a tiny,
RSSI calculation in typical communications systems, which low-cost, and low-power COTS device with a programmable
is linear with respect to the number of incoming samples. PHY which was recently adopted as SNOW node [39]. To
Since frequency sensing is performed only after a sequence perform experiments at much longer communication ranges,
of signals pass the time domain sensing, it takes constant we have also implemented our mobility approaches using
time irrespective of the number of samples. The constant de- USRP devices as SNOW nodes based on its current open-
pends on the number of packets that cause the time-domain source implementation in GNU Radio [47]. GNU Radio is
sensing to return busy. Note that such an approach is needed an open-source development toolkit that provides signal pro-
only when a node moves to an uncoordinated SNOW. Once cessing blocks to develop software-defined radio [16]. USRP
the node is aligned with any subcarrier of the new BS, it can is a hardware platform designed for RF application [40]. We
use CSMA/CA approach to transmit to the BS and ultimately have used two USRP 210 devices, each having a dual radio,
join the network. Figure 9 shows the subcarrier alignment la- as two BSs in each experiment for inter-SNOW mobility ex-
tency for different subcarrier bandwidths. periments. In the first set of experiments, we have used 10TI CC1310 devices as SNOW nodes. In the other set of ex- ing packet sizes. Figure 10(b) demonstrates the impact of
periments, we have used 7 USRP 200 devices, each with a packet size on our mobility approach. With 20-byte packet,
single radio, as SNOW nodes. The USRP devices operate in the stationary node PER is 0% (no packet loss). For the same
the band 70MHz – 6GHz. Packets generation, decoder, and packet size, the mobile node PER is around 4.5%. Further-
other implementation are adopted from SNOW open source more, for the 40-byte packet, the PER is 0.1% and 5.2% for
implementation [47]. the stationary and mobile node. With a 100-byte packet, the
Note that our experiments are performed mainly consid- mobile node achieves 5.4% PER, while the PER for the sta-
ering inter-SNOW mobility to show that our approach can tionary node is 0.39%. This result shows that packet size has
enable such mobility. We cannot compare the results against an impact on reliability. Larger packets require more air time
the scenario when our approaches are not adopted because to receive, resulting in more interference leading to increased
inter-SNOW mobility cannot be enabled without our ap- PER. The difference in the reliability performance between
proaches. However, we compare the performance against the two results is due to the channel condition changing. For
the stationary scenario to observe the performance degrada- the mobile node, moving from one BS to another might in-
tion under mobility. In our experiments we shall demonstrate crease the PER due to the channel condition at the new lo-
that such degradations are not high and our approaches show cation, which might increase the PER. However, the results
robustness in terms of reliability, latency, and energy con- prove that our approach offers reliable communication under
sumption under various mobility scenarios. mobility.
6.1 Default parameters
Parameters of interests are calibrated in different experi- 1
ments based on requirements and the rest are left as defaults. Stationary
0.8 Mobile
The default experimental parameter settings are as follows.
• Frequency band: varying (470 MHz - 599 MHz) 0.6
CDF
• Modulation: ASK/OOK 0.4
• Packet size: 40 bytes
0.2
• BS bandwidth: 6 MHz
0
• Node bandwidth: TI CC1310: 200 kHz, USRP: 400 0.2 0.4 0.6 0.8
kHz Packet Error Rate (%)
• TX power: TI CC1310: 15 dBm, USRP: 0 dBm (a) Reliability under mobility
• Receiver sensitivity: -110 dBm
• Distance: Indoor: 10 - 50 m, Outdoor: 900 m 10 Stationary
Packet Error Rate (%)
Mobile
6.2 Experiments with TI CC1310: Indoor and
Outdoor Deployment
6.2.1 Indoor Deployment 5
The experiments with CC1310 were carried out in a hall-
way on the third floor inside the computer science build-
ing at Wayne State University. We fixed the position of the
BSs while a person is continuously moving at average walk- 0
20 40 60 80 100
ing speed from one end of the hallway to the other for 30 Packet Size (byte)
minutes. We kept the antenna height at 2 meters above the
(b) Reliability with varying packet size
ground for all experiments. In all the experiments, the CFO
and CSI are estimated and compensated based on SNOW im- Figure 10. Reliability under mobility and varying packet
plementation in [39]. We used the default setting for all the size.
experiments.
Reliability under Mobility. We kept the distance between Maximum Achievable Throughput. The maximum
the node and BSs at approximately 10 meters to observe our achievable throughput is the total maximum number of bits
proposed mobility approach’s reliability. One node is sta- the BS can receive per second. In this experiment, we calcu-
tionary at this distance, and another node is continuously late the maximum achievable throughput using our approach
moving from one BS towards the other. The stationary node compared to the stationary nodes. In both scenarios, each
transmits 5000 packets to the BS while the mobile node node transmits 1000 40-byte packets. Figure 11 shows that
transmits 2500 packets to the first BS and 2500 to the sec- in a stationary scenario, the maximum achievable throughput
ond BS after the joining process. The results in Figure 10(a) is 240 kbps compared to 174 kbps during mobility when ten
demonstrate that with minor human mobility, the Packet Er- nodes transmit simultaneously. This result is not surprising
ror Rate (PER) slightly increases under our approach. For since mobility increases the packet loss rate, which affects
the stationary node, the PER is around 0.02%, while the mo- the throughput.
bile node is 0.72%. Also, we observe reliability with vary- Energy Consumption and Latency. To estimate the en-300 1800
Stationary Stationary
Throughput (kbps) 250 Mobile Mobile
1700
Time (ms)
200
150
100 1600
50
1500
1 2 3 4 5 6 7 8 9 10 1 2 3 4 5 6 7 8 9 10
# of nodes # of nodes
Figure 11. Throughput with varying # of nodes. Figure 13. CC1310 Latency
ergy consumption and latency of CC1310 during mobility,
we measure the average energy consumed at the nodes and inside a moving vehicle. The distance between the node and
the time it takes to transmit 1000 packets per node success- the BSs is approximately 900 meters. The vehicle speed
fully. We placed ten nodes, each 50 m away from BS1. We varies between 5 mph and 40 mph. The data is collected
performed two sets of experiments (stationary nodes and mo- at the BSs for further analysis.
bile nodes). In the mobility experiment, the nodes are placed Maximum Achievable Throughput. In this experiment,
10 m away from BS1 and 50 m away from BS2. And the we compare the maximum achievable throughput at different
nodes move from BS1 to BS2. Also, we measure the over- speeds (5 mph, 20 mph, 40 mph). Each node transmits 1000
head of the BS discovery and subcarrier alignment offline 40-byte packets, and we calculate the combined throughput
and add the results accordingly. To calculate the energy con- at the BSs. Figure 14 shows that the maximum achievable
sumption, we use the energy model of CC1310 (Voltage is throughput is approximately 12.5 kbps at 5 mph speed com-
3.8v, RX 5.4mA, and TX 13.4mA). We measure the time pared to 11.89 kbps and 11.83 kbps At 20 mph and 40 mph,
required to collect 10.000 packets at BS1 for the stationary respectively. This shows that the speed (up to 40 mph) has
nodes and 2500 packets and 7500 packets at BS1 and BS2, an insignificant impact on the nodes’ maximum achievable
respectively, in the mobile scenario. Figure 12 shows that in throughput.
a stationary scenario, the average energy consumed by the
node is 81.4mJ compared to 87.1mJ in during mobility. We
observe similar behavior for the latency. As shown in Fig- 15
ure 13, the average latency for stationary nodes is 1.6s com-
Throughput (kbps)
pared to 1.712s in mobile nodes. This result indicates that the 10
number of nodes has an insignificant impact on the energy
and latency regardless of mobility. This is due to the capa-
5
bility of SNOW BS, which allows multiple nodes to transmit
in parallel.
0
5 20 40
Avg. Energy Consumption (mJ/node)
Speed (MPH)
90
89 Stationary Figure 14. Throughput vs. node speed
88 Mobile
87
Energy Consumption and Latency. To estimate the energy
86 consumption and latency in outdoor deployment, we place
85 the BSs at varying distances from the nodes (up to 900 me-
84 ters). We set the nodes inside a moving vehicle. We measure
83 the average energy consumed at each node and the time it
82
81
takes to transmit 1000 packets per node successfully. Fig-
80 ure 15 shows that the average energy consumed by the node
1 2 3 4 5 6 7 8 9 10 moving 5 mph is to 87.1mJ and 87.3 mJ at 100 m and 900
# of nodes m, respectively. At 20 mph, the energy consumption is 87.1
mJ and 87.4 mJ at 100 m and 900 m, respectively. The av-
Figure 12. CC1310 Energy consumption erage energy consumption is 87.8 mJ and 87.9 mJ at 100 m
and 900 m for 40 mph. These results are similar to the in-
6.2.2 Outdoor Deployment door scenario where the node is moving at walking speed.
In this experiment, we evaluate our mobility approach’s In Figure 16, the average latency for all nodes, regardless of
performance in the city of Detroit, Michigan (see Figure 17), the distance, is 1.735s. This result shows that the energy and
in terms of maximum achievable throughput, energy con- latency for all nodes are similar except for the energy con-
sumption, and latency using CC1310 devices in outdoor de- sumption at a 40 mph speed and a distance of 900 m where
ployments. We fix the location of the BSs and place the node the results slightly vary due to higher PER.90 the reliability over various distances from the BS when the
Energy Consumption (mJ/node)
89 node is moving from one BS to the other. At 300 meters, the
88 BSs can decode on average 96.6% of the packets from the
87
86
mobile node compared to 100% for the stationary node. Fur-
85 thermore, at 500 meters away, the mobile node’s reliability
84 reduces to 96%, while the stationary node achieves 99.99%
83 5 mph reliability. At 900 meters, the reliability is 80% for the mo-
82 20 mph bile node compared to 99.95% at the stationary node. These
81 40 mph
80
results show that the distance between the mobile node and
100 200 300 400 500 600 700 800 900 BS has a significant impact on decoding reliability. However,
Distance (meter)
Even for the stationary node, its’ performance is slightly im-
Figure 15. CC1310 Outdoor energy consumption pacted by the distance from the BS.
Avg. Correctly Decoding Rate (%)
100
1800
95
Latency (ms)
1700
90
1600 Stationary
5 mph 85 Mobile with CSI and CFO compensation
20 mph
40 mph
80
1500 300 500 700 900
100 200 300 400 500 600 700 800 900
Distance (meter)
Distance (meter)
Figure 18. Reliability over distances
Figure 16. CC1310 Outdoor latency
6.3.2 Performance of SNOW with CFO
In this experiment, we observe the performance of SNOW
6.3 Experiments with USRP: Deployment in a to demonstrate the effect of CFO estimation and compen-
Metropolitan City sation in mobile environments. We compare the CDR of
Figure 17 shows the distances in Detroit city in Michigan, a mobile SNOW node in two cases, with CFO estimation
where the mobility data were collected from nodes placed and compensation and without CFO compensation. Also, we
inside a moving car. The BSs are kept stationary. The vehi- compare the performance of each case to the performance of
cle is continuously moving at varying speeds (up to 40 mph) a stationary SNOW node. All the nodes were 500m away
from one BS to the other in the mobile scenario. The antenna from the BS. The mobile nodes were placed in a car mov-
height was kept at 2 meters above the ground in all the exper- ing at varying speeds. Each node transmits 5000 packets
iments. We used the default setting in all the experiments. asynchronously to the BSs. For mobile nodes, each node
transmits 2500 packets to BS1 and 2500 to BS2. Figure 19
demonstrates the effect of CFO under mobility. For station-
ary nodes, the average CDR is around 99.97% for all the
transmitted packets. Without compensation for CFO, the av-
erage CDR is around 80% for all the nodes. However, we
compensate for CFO; the average CDR increases to 96%,
which is significant. This result demonstrates that in mobile
environments, CFO could severely impact the transmission
reliability. Thus, CFO estimation and compensation could
significantly increase the reliability of the transmission in
inter-SNOW communication.
6.3.3 Maximum Achievable Throughput
Figure 17. USRP experimental setup In this experiment, we compare the maximum achiev-
able throughput in mobile inter-SNOW with the stationary
6.3.1 Reliability over Distance SNOW. For both scenarios, each node transmits 100 40-byte
To observe the effect of distance on the reliability of packets. We calculate the combined throughput at the BSs.
SNOW in mobile scenarios, we collect the data at 300m, Figure 11 shows that when 8 nodes are transmitting, the max-
500m, 700m, and 900m from the BS, respectively. Each imum achievable throughput is 298 kbps and 393 kbps for
node transmits 5000 packets. To measure the reliability, we mobile and stationary SNOWs, respectively. During mobil-
chose Correctly Decoding Rate (CDR), which is the ratio of ity when 10 nodes transmit simultaneously. Due to the in-
the number of correctly decoded packets at the BS to the creased packet loss rate during mobility, stationary SNOW
total number of transmitted packets [43]. Figure 18 shows achieves better throughput.Avg. Energy Comsumption (mJ / node)
Avg. Correctly Decoding Rate (%)
100
50
Stationary
95 49 Mobile
90 48
Stationary
Mobile with CFO compensation 47
85 Mobile without CFO compensation
46
80
1 2 3 4 5 6 7 45
# of nodes 1 2 3 4 5 6 7
# of nodes
Figure 19. Performance under mobility with CFO
500
Figure 21. Energy consumption
450 Stationary
Mobile
400
850
Throughput (kbps)
350 Stationary
300 Mobile
840
250
Time (ms)
200
830
150
100
820
50
1 2 3 4 5 6 7 8 810
# of nodes
Figure 20. Throughput vs # of node 1 2 3 4 5 6 7
# of nodes
Figure 22. Latency
6.3.4 Energy Consumption and Latency
In this experiment, we demonstrate the efficiency of our
mobility approach for USRP in terms of energy consump- proposed a dynamic CFO estimation and compensation tech-
tion and latency. Specifically, we compare the efficiency of nique to handle mobility impacts on ICI. We have also pro-
mobile SNOW with stationary SNOW. We observed that the posed to circumvent the mobility impacts on geospatial vari-
performance of SNOW under mobility is affected by the dis- ation of white space through a mobility-aware spectrum as-
tance from the BS. Hence, for a fair comparison with sta- signment to nodes. To enable mobility of the nodes across
tionary SNOW, we place 7 mobile node 900m away from different SNOWs, we have proposed an efficient handoff
the BS2 while continuously moving at approximately 20mph management through a fast and energy-efficient BS discov-
towards BS1. Furthermore, since USRP devices allow for ery and quick association with the BS by combining time
bidirectional communication, each node transmits 100 pack- and frequency domain energy-sensing. Experiments through
ets (50 to BS1 and 50 to BS2 during mobility) during the SNOW deployments in a large metropolitan city and indoors
upward duration (1s) and waits until the end of the upward have shown that our proposed approaches enable mobility
duration to receive an acknowledgment (ACK) from the BSs. across multiple different SNOWs and provide robustness in
We then calculate the average energy consumption per node terms of reliability, latency, and energy consumption under
and the time needed to collect all the packets at the BS. mobility.
Figure 21 shows that the average energy consumed at the
mobile nodes is around 47.4mJ compared to 47.32% in sta- 8 Acknowledgments
tionary nodes when 7 nodes transmit. This shows that mobil- This work was supported by NSF through grants
ity has a minimal impact on the energy efficiency of the node. CAREER-1846126, CNS-2006467, and by Wayne State
Similar to the average energy consumption, Figure 22 shows University through the Rumble Fellowship.
that the latency of collecting all packets in mobile SNOW is
comparable to the stationary SNOW. These results demon- 9 References
strate that the efficiency of SNOW is not affected by mobil- [1] Telensa, 2017. https://www.telensa.com.
ity. [2] M. Ali, T. Suleman, and Z. A. Uzmi. Mmac: A mobility-adaptive,
collision-free mac protocol for wireless sensor networks. In IPCCC,
7 Conclusions pages 401–407. IEEE, 2005.
In this paper, we have addressed mobility in SNOW (Sen- [3] P. Bahl, R. Chandra, T. Moscibroda, R. Murty, and M. Welsh. White
sor Network Over White spaces), an LPWAN that is de- space networking with wi-fi like connectivity. ACM SIGCOMM Com-
puter Communication Review, 39(4):27–38, 2009.
signed based on D-OFDM and that operates in the TV white [4] K. Bian and J. M. Park. Asynchronous channel hopping for estab-
spaces. SNOW supports massive concurrent communication lishing rendezvous in cognitive radio networks. In 2011 Proceedings
between a base station (BS) and numerous nodes. We have IEEE INFOCOM, pages 236–240, 2011.[5] T. Camp, J. Boleng, and V. Davies. A survey of mobility models 1785-nb_iot_complete.
for ad hoc network research. Wireless Communication and Mobile [34] F. F. Order, 2008. FCC, ET Docket No FCC 08-260, November 2008.
Computing, 2:483–502, 2002. [35] F. S. Order, 2010. FCC, Second Memorandum Opinion and Order, ET
[6] Ti CC1310. http://www.ti.com/product/CC1310. Docket No FCC 10-174, September 2010.
[7] C.-T. Chen. System and Signal Analysis. Thomson, 1988. [36] D. Patel and M. Won. Experimental study on low power wide area
[8] X. Chen and J. Huang. Game theoretic analysis of distributed spec- networks (LPWAN) for mobile internet of things. In VTC, 2017.
trum sharing with database. In ICDCS, pages 255–264, 2012. [37] J. PetArvi, K. Mikhaylov, M. Pettissalo, J. Janhunen, and J. Iinatti.
[9] DASH7. http://www.dash7-alliance.org. Performance of a low-power wide-area network based on lora tech-
[10] Q. Dong and W. Dargie. A survey on mobility and mobility-aware mac nology: Doppler robustness, scalability, and coverage. International
protocols in wireless sensor networks. IEEE communications surveys Journal of Distributed Sensor Networks, 13(3):1550147717699412,
and tutorials, 15(1):88–100, 2013. 2017.
[11] P. Dutta and D. Culler. Practical asynchronous neighbor discovery and [38] H. Pham and S. Jha. An adaptive mobility-aware mac protocol for
rendezvous for mobile sensing applications. In SenSys, 2008. sensor networks (ms-mac). In MASS, pages 558–560. IEEE, 2004.
[12] E. Ekici, Y. Gu, and D. Bozdag. Mobility-based communica- [39] M. Rahman, D. Ismail, V. P. Modekurthy, and A. Saifullah. Implemen-
tion in wireless sensor networks. IEEE Communications Magazine, tation of lpwan over white spaces for practical deployment. In Pro-
44(7):56–62, 2006. ceedings of the International Conference on Internet of Things Design
[13] S. Fahmida, V. Modekurthy, M. Rahman, A. Saifullah, and M. Bro- and Implementation (IoTDI ’19), pages 178–189, 2019.
canelli. Long-Lived LoRa: Prolonging the lifetime of a LoRa network. [40] E. Research, 2017. http://www.ettus.com/product/details/
In IEEE ICNP ’20, pages 1–12, 2020. UB210-KIT.
[14] FarmBeats: IoT for agriculture, 2015. https://www.microsoft. [41] A. Saeed, K. A. Harras, E. Zegura, and M. Ammar. Local and low-cost
com/en-us/research/project/farmbeats-iot-agriculture/. white space detection. In Distributed Computing Systems (ICDCS),
[15] D. Floreano and R. J. Wood. Science, technology and the future of 2017 IEEE 37th International Conference on, pages 503–516. IEEE,
small autonomous drones. Nature, 521(7553):460–466, 2015. 2017.
[16] GNU Radio. http://gnuradio.org. [42] A. Saifullah, M. Rahman, D. Ismail, C. Lu, R. Chandra, and J. Liu.
[17] gsma. https://www.gsma.com/iot/wp-content/uploads/2016/ SNOW: Sensor network over white spaces. In SenSys ’16, 2016.
10/3GPP-Low-Power-Wide-Area-Technologies-GSMA-White- [43] A. Saifullah, M. Rahman, D. Ismail, C. Lu, J. Liu, and R. Chandra.
Paper.pdf. Enabling reliable, asynchronous, and bidirectional communication in
[18] J. Harri, F. Filali, and C. Bonnet. Mobility models for vehicular ad hoc sensor networks over white spaces. In SenSys, pages 1–14, 2017.
networks: a survey and taxonomy. IEEE Communications Surveys and [44] A. Saifullah, M. Rahman, D. Ismail, C. Lu, J. Liu, and R. Chandra.
Tutorials, 11(4):19–41, 2009. Low-power wide-area networks over white spaces. ACM/IEEE Trans-
[19] Ingenu. https://www.ingenu.com/technology/rpma. actions on Networking, 26(4):1893–1906, 2018.
[20] IQRF. http://www.iqrf.org/technology. [45] J. Shin, D. Yang, and C. Kim. A channel rendezvous scheme for
[21] S. R. Islam, D. Kwak, M. H. Kabir, M. Hossain, and K.-S. Kwak. cognitive radio networks. IEEE Communications Letters, 14(10):954–
The internet of things for health care: a comprehensive survey. IEEE 956, 2010.
Access, 3:678–708, 2015. [46] SIGFOX. http://sigfox.com.
[22] D. Ismail, M. Rahman, and A. Saifullah. Low-power wide-area net- [47] Snow implementation. https://github.com/snowlab12/gr-
works: opportunities, challenges, and directions. In ICDCS, pages snow.
1–6, 2018. [48] Y. Song and J. Xie. Prospect: A proactive spectrum handoff frame-
[23] A. Jhumka and S. Kulkarni. On the design of mobility-tolerant tdma- work for cognitive radio ad hoc networks without common control
based media access control (mac) protocol for mobile sensor net- channel. TMC, 11(7):1127–1139, 2012.
works. In ICDCIT, pages 42–53. Springer, 2007. [49] E. Sourour, H. El-Ghoroury, and D. McNeill. Frequency offset esti-
[24] LoRaWAN. https://www.lora-alliance.org. mation and correction in the ieee 802.11 a wlan. In VTC, volume 7,
[25] LTE Advanced Pro, 2017. https://www.qualcomm.com/ pages 4923–4927. IEEE, 2004.
invention/technologies/lte/advanced-pro. [50] TinyOS. http://www.tinyos.net.
[26] Lte-cat-m1. https://www.u-blox.com/en/lte-cat-m1. [51] USDA, 2007. http://www.nrcs.usda.gov/Internet/FSE_
[27] N. Lu, N. Cheng, N. Zhang, X. Shen, and J. W. Mark. Connected DOCUMENTS/stelprdb1043474.pdf.
vehicles: Solutions and challenges. IEEE Internet of Things Journal, [52] D. Vasisht, Z. Kapetanovic, J. Won, X. Jin, R. Chandra, S. N. Sinha,
1(4):289–299, 2014. A. Kapoor, M. Sudarshan, and S. Stratman. Farmbeats: An iot plat-
[28] G. Mao, B. Fidan, and B. D. O. Anderson. Wireless sensor network lo- form for data-driven agriculture. In NSDI, pages 515–529, 2017.
calization techniques. Computer networks, 51(10):2529–2553, 2007. [53] WeightLess. http://www.weightless.org.
[29] Monsanto. https://www.rcrwireless.com/20151111/ [54] W. Ye, J. Heidemann, and D. Estrin. An energy-efficient mac protocol
internet-of-things/agricultural-internet-of-things- for wireless sensor networks. In INFOCOM. IEEE, 2002.
promises-to-reshape-farming-tag15. [55] A. Zanella, N. Bui, A. Castellani, L. Vangelista, and M. Zorzi. Internet
[30] R. Murty, R. Chandra, T. Moscibroda, and P. Bahl. SenseLess: A of things for smart cities. IEEE Internet of Things journal, 1(1):22–32,
database-driven white spaces network. In DySpan ’11, 2011. 2014.
[31] R. Murty, R. Chandra, T. Moscibroda, and P. Bahl. Senseless: A [56] M. Zareei, A. K. M. Muzahidul Islam, N. Mansoor, S. Baharun, E. M.
database-driven white spaces network. IEEE Transactions on Mobile Mohamed, and S. Sampei. Cmcs: a cross-layer mobility-aware mac
Computing, 11(2):189–203, 2012. protocol for cognitive radio sensor networks. EURASIP Journal on
[32] M. Nabi, M. Blagojevic, M. Geilen, T. Basten, and T. Hendriks. Mc- Wireless Communications and Networking, 2016(1):1–15, 2016.
mac: An optimized medium access control protocol for mobile clus- [57] Y. Zhang, G. Yu, Q. Li, H. Wang, X. Zhu, and B. Wang. Channel-
ters in wireless sensor networks. In SECON, pages 1–9. IEEE, 2010. hopping-based communication rendezvous in cognitive radio net-
[33] NBIoT, 2017. http://www.3gpp.org/news-events/3gpp-news/ works. IEEE/ACM Trans. Netw., 22(3):889–902, 2014.You can also read