DOLLARS & SENSE: Addressing False Assumptions about the Energy & Economics of the Lower Snake Dams - Clallam County PUD
←
→
Page content transcription
If your browser does not render page correctly, please read the page content below
DOLLARS & SENSE:
            Addressing False Assumptions about the Energy &
                        Economics of the Lower Snake Dams

                                                                                  Abstract
           Federal reports show the lower Snake River dams (LSRD) are some of the most cost-
            effective dams in the Federal Columbia River Power System. However, some anti-
             dam advocates repeatedly claim the LSRD lose money and are unnecessary. This
                        whitepaper examines those assumptions and conclusions.

7/1/2021
Table of Contents
INTRODUCTION.................................................................................................................................................. 2
SUMMARY OF KEY FINDINGS ............................................................................................................................. 2
APPROACH......................................................................................................................................................... 4
DISCUSSION ....................................................................................................................................................... 4
FALSE ASSUMPTION 1: THE REGION ALWAYS HAS A POWER SUPPLY SURPLUS ................................................... 5
    1.1 DEFINING THE SURPLUS ............................................................................................................................................. 5
    1.2 THE NEED FOR RESERVES ........................................................................................................................................... 6
    1.3 RESOURCE OWNERSHIP ............................................................................................................................................. 7
FALSE ASSUMPTION 2: TODAY’S SURPLUS MEANS TOMORROW’S SURPLUS ....................................................... 7
    2.1 LEGISLATION CALLING FOR A DECARBONIZED GRID ......................................................................................................... 8
    2.2 MASSIVE BUILD-OUT OF SOLAR POWER IN CALIFORNIA AND DESERT SOUTHWEST ............................................................... 9
FALSE ASSUMPTION 3: THE REPLACEMENT OF HYDROPOWER TURBINES IS COST-PROHIBITIVE .......................... 9
FALSE ASSUMPTION 4: BPA SECONDARY MARKET SALES RESULT IN A FINANCIAL LOSS...................................... 11
FALSE ASSUMPTION 5: ELECTRICITY PRODUCTION IS A HOMOGENOUS GOOD ................................................... 12
FALSE ASSUMPTION 6: THE LSRD HAVE LITTLE STORAGE CAPABILITY ................................................................. 13
FALSE ASSUMPTION 7: TRANSPORTATION OF GOODS COULD BE EASILY TRANSFERRED TO RAIL ........................ 14
    7.1 CAPITAL INVESTMENTS ............................................................................................................................................ 15
    7.2 COMPETITION IN THE BARGING AND RAIL INDUSTRIES ................................................................................................... 16
    7.3 INCREASED POLLUTION............................................................................................................................................ 17
FALSE ASSUMPTION 8: RECREATIONAL USE SURVEY RESULTS ARE ACCURATE ................................................... 17
CONCLUSION .................................................................................................................................................... 18
ACKNOWLEDGEMENTS ..................................................................................................................................... 19
APPENDIX A ...................................................................................................................................................... 20
    A.1 MODEL OUTLINE ................................................................................................................................................... 20
    A.2 MODEL RESULTS.................................................................................................................................................... 21

                                                                                                                                                                         1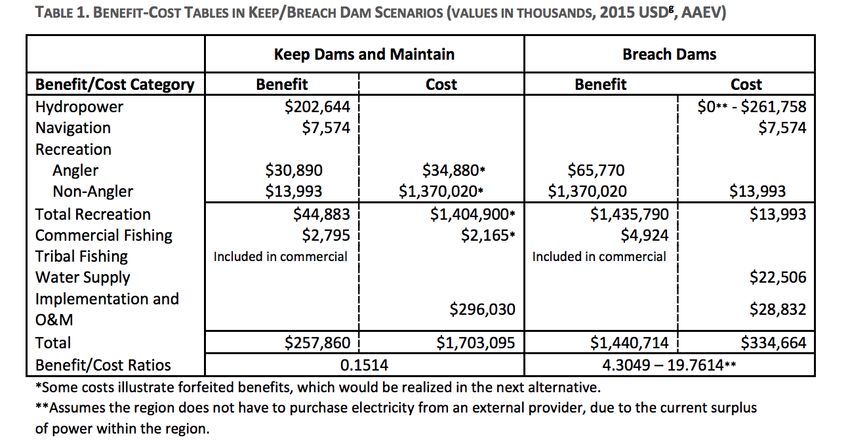
Introduction
Due to concerns regarding salmonid health, some salmon conservation groups have advocated
the removal or breaching of the lower Snake River dams (LSRD). However, pro-hydropower
groups – like Northwest RiverPartners – have made the case that removing productive, zero-
carbon generating resources is a step in the wrong direction for salmon recovery.

Given the acknowledged, harmful impacts of climate change on salmon survival in rivers and
ocean environments, it can be logically argued the region needs more carbon-free resources,
like hydropower dams, to help reverse dangerous warming trends.

Additionally, the societal benefits from the dams are sizable. The 2020 Columbia River System
Operations Final Environmental Impact Statement indicates it would cost $16 billion over a 20-
year period just to replace the full generating capabilities of the LSRD.

Similarly, in early-2021 Representative Mike Simpson (R – ID) proposed a $33.5 billion package
that would help to mitigate the loss of these valuable hydropower resources, considering their
importance to electricity production, river transportation/barging, irrigation, and recreation.

While some groups have debated the magnitude of the societal value that the LSRD represent,
most agree that their contributions are significant. However, one group has made the oppositive
claim. An advocacy group called DamSense has produced a number of papers declaring large
positive economic benefits would directly result from breaching the LSRD.

The objective of this whitepaper is to examine and analyze assumptions that lead to these
DamSense claims and determine if methodological, logical, or calculational deficiencies
germane to anti-LSRD conclusions are present.

Summary of Key Findings
Analyzing the information provided in DamSense reports uncovers multiple areas where faulty
assumptions caused the benefits of dam breaching to be overstated, the costs of dam
breaching to be understated, or both.

The following is a summary of key errors included in DamSense materials. 1

DamSense…

       •   concludes the Northwest has a power supply surplus under all circumstances. This
           DamSense assumption is based on a narrow examination of average energy demand.
           Because DamSense disregards official forecasts of peak energy needs, it fails to
           properly assess the region’s true energy supply/demand balance.

1
    Footnotes and references to source materials are provided in the body of this whitepaper.

                                                                                                 2
• neglects to properly account for generating plants located inside the Pacific Northwest
but owned and controlled by extra-regional entities. This omission results in over-
counting the true amount of generation available for Pacific Northwest customers.
• ignores the need for utilities to carry reserves (i.e., available sources of backup
generation) in case of a power plant failure or if energy demand is higher than
anticipated. This omission results in under-counting the amount of generation required to
keep the grid safely supplied.
• disregards the implications of legislation requiring a decarbonized grid, which is reducing
the region’s power supply portfolio, particularly in terms of firm and dependable power
resources.
• contends that future hydropower turbine replacements at the LSRD are cost-prohibitive,
without considering that other generating resources also have limited useful lives and
will also need to be replaced.
• determines that secondary market sales made by the Bonneville Power Administration
(BPA) below its Priority Firm Rate occur at a financial loss. In actuality, BPA covers
almost all of its power supply costs under long-term power sales contracts. As a result,
secondary sales at prices above BPA’s near-zero marginal cost are profitable (i.e., go
towards reducing BPA’s overall power costs).
• utilizes a cost-benefit methodology that wrongly assumes electricity production is a
homogenous good, irrespective of economic, locational, and technical capabilities of
different electric generation resources.
• characterizes the LSRD as typical run-of-river dams (i.e., without storage capabilities).
However, the four dams can shape a significant amount of power generation into periods
of peak demand.
• implies barging can be eliminated and barged goods can be transferred to rail with little
strain on the rail system. However, such a switch would likely involve major capital
investments to expand the rail system to support the additional freight. Additionally, rail
and trucking are more carbon-intensive forms of transportation compared to barging.
• claims a large economic benefit from the added recreational value from breaching the
four lower Snake River dams. This value is largely dependent on the results of a
recreational use survey that likely overstates expected visitation levels.
3Approach
This analysis examines the major position papers and technical analyses publicly available from
DamSense. We consider the economic principles underpinning the DamSense work and its
ultimate conclusions as well as sampling DamSense calculations for mathematical accuracy.
DamSense citations were also sampled for accuracy. Additionally, initial cursory literature
review of certain Bonneville Power Administration (BPA), Public Power Council (PPC), PNGC
Power, Pacific Northwest Waterways Association (PNWA), and other regional stakeholder
groups was also included to provide a stronger foundational understanding of the issues.
Discussion
DamSense refers to multiple reports to support its conclusion that the LSRD are uneconomic. A
useful way to understand the information is to focus on a report by Earth Economics, “National
Economic Analysis of the Four Lower Snake River Dams,” 2 and use the other reports as
supporting materials for the arguments in that analysis. (The Earth Economics report was co-
produced by the DamSense founder.)
Earth Economics provides a cost-benefit analysis for keeping and maintaining the LSRD vs
breaching them.
The analysis categorizes the costs and benefits into the components: Hydropower, Navigation,
Recreation, Water Supply, Implementation, and Operations and Maintenance. Each section
provides cost and benefit values and a brief explanation of the values. The results of the cost
benefit analysis are in the following table.
2
Earth Economics. National Economic Analysis of the Four Lower Snake River Dams: A Review of the 2002 Lower
Snake Feasibility Report/Environmental Impact Statement Economic Appendix(I). 2016. Available at:
https://damsense.org/wp-content/uploads/2014/12/National-Economic-Analysis-of-the-Four-Lower-Snake-River-
Dams-2.16.pdf
4Table 1 3
Although these numbers might indicate a clear choice to breach the dams, many of the values
rely on incorrect assumptions which push the analysis in favor of breaching the dams;
underestimating the costs and overestimating the benefits. The following sections highlight eight
assumptions that were used in the report that result in an incorrect benefit-cost ratio for dam
breaching.
False Assumption 1: The Region Always Has a Power Supply Surplus
Multiple DamSense reports contend the LSRD produce very little energy relative to the region’s
overall surplus energy production. DamSense uses this logic to contend the power from the
LSRD is easily discarded. This logic is flawed in multiple respects.
1.1 Defining the Surplus
The surplus DamSense refers to is derived from a report by Rocky Mountain Econometrics and
is determined by forecasts provided by BPA’s 2014 White Book. 4 The 2014 White Book
provides firm load and resource predictions for both average energy and January 120-Hour
capacity needs. The DamSense stated surplus is based solely on the average energy
predictions.
3
Earth Economics. National Economic Analysis of the Four Lower Snake River Dams: A Review of the 2002 Lower
Snake Feasibility Report/Environmental Impact Statement Economic Appendix(I). 2016. Available at:
https://damsense.org/wp-content/uploads/2014/12/National-Economic-Analysis-of-the-Four-Lower-Snake-River-
Dams-2.16.pdf
4
Rocky Mountain Econometrics. “Lower Snake River Dam Alternative Power Costs,” 22 June 2015, p. 5. Available
at: https://damsense.org/wp-content/uploads/2014/12/Report_LSD-alt-power-costs.pdf
5While the White Book does forecast surpluses in average energy through 2025, the January
120-Hour forecast—based on five consecutive days of extremely cold weather—predicts
potential deficits beginning in 2020, which indicates the region may not have enough electricity
during severe weather events. In the more recent 2019 White Book by BPA, average energy
forecasts show surpluses, but the January 120-Hour forecasts predict deficits through 2030. 5
It is important to note that these predictions are all determined under the assumption that 100%
of Independent Power Producers (IPP) generation located in the Pacific Northwest will be
available to meet Northwest energy needs. Under the assumption that 50% IPP generation is
sold outside the region, average energy deficits are forecasted from 2026 onward. Under the
assumption that 0% is available for Northwest users, average energy deficit predictions begin in
2022 and persist.
A more complete determination of surplus would consider the predictions for the January 120-
Hour measure, because having firm capacity is vital for a balanced power system.
In short, using average energy values to determine our total energy needs means we would
only have enough energy to meet demand 50% of the time.
The problem arises when actual demand is greater than average demand. The periods of higher
demand can be seen during the summer and winter months, when higher levels of power are
needed to match household’s usage of air conditioning and heating.
1.2 The Need for Reserves
DamSense’s choice to consider only average annual energy to determine the surplus does not
recognize the importance of reserves for the region. The aforementioned analysis by Rocky
Mountain Econometrics, provided by DamSense, states, “In 2016, the Pacific Northwest will use
about 84 percent of its energy generating potential” 6. This report assumes the remaining 16
percent to be surplus power.
Since the aim in operating the power system is to continuously match the supply of energy to
the demand of energy at all times, reserves (i.e., available sources of backup generation) are
used to ensure that the power supply has sufficient energy, capacity, and balancing capability to
cover variations in generation and load, such as unexpected power plant failure. 7
By not including reserves in its calculations, the Rocky Mountain Econometrics report fails to
provide the grid with any sort of appropriate safety margin. To determine if there is an actual
5
2019 BPA White Book: https://www.bpa.gov/p/Generation/White-Book/Pages/White-Book-2019.aspx
6
Rocky Mountain Econometrics. “Lower Snake River Dam Alternative Power Costs,” 22 June 2015, p. 6 Available
at: https://damsense.org/wp-content/uploads/2014/12/Report_LSD-alt-power-costs.pdf
7
Northwest Power and Conservation and Council. “Seventh Power Plan. Chapter 10:Operating and Planning
Reserves,” 10 February 2016, p. 10-3 Available at:
https://www.nwcouncil.org/sites/default/files/7thplanfinal_chap10_opplanningreserves_1.pdf
6surplus, peak generating capacity needs to be considered, and peak capacity must include
allowance for necessary reserves, operating and planning.
1.3 Resource Ownership
DamSense does not consider the significant portion of the Northwest’s wind generation fleet is
under long-term contract to California. Because that electricity is exported to California,
DamSense assumes it is “surplus” by ignoring who actually owns the resource or the region to
which it is committed. 8
The DamSense suggestion that the region has a power supply surplus also does not recognize
that Public Power customers would be particularly harmed by the loss of the LSRD. For
example, most of the region’s Public Power utilities get at least a portion of their electricity from
BPA. As a result, the federal hydropower system’s firm capabilities are 100% committed in long-
term sales contracts to community-owned utilities across the Pacific Northwest.
According to the 2020 Columbia River System Operations Environmental Impact Statement, it
would cost customers of BPA $16 billion over a 20-year period to replace the full capabilities of
the dams with solar panels and batteries 9. That is equivalent to a 50% increase in power supply
costs to BPA customers.
False Assumption 2: Today’s Surplus Means Tomorrow’s Surplus
The Earth Economics benefit-cost analysis assumes that the average power surplus will persist
for years to come, stating, “Due to the region’s power surplus, new infrastructure would not
need to be built. The NWPCC 7th Northwest Power Plan from 2016 states that efficiency gains
could cover all increased demand, with the grid remaining in surplus for at least the next 20
years.” 10
The Rocky Mountain Econometrics study agrees with this claim. It explains that despite
projections expecting energy loads to grow, the average surplus will still exist in 2025, just much
smaller in size. 11 The study also states that even with the much smaller surplus, the removal of
8
It is possible other long-term resource sales have been made to California aside from wind generation, which
would reduce the amount of energy available for use in the Northwest.
9
Columbia River System Operations, “Final Environmental Impact Statement,” Appendix Q. Available at:
https://usace.contentdm.oclc.org/utils/getfile/collection/p16021coll7/id/14965
10
Earth Economics. National Economic Analysis of the Four Lower Snake River Dams: A Review of the 2002 Lower
Snake Feasibility Report/Environmental Impact Statement Economic Appendix(I). 2016. p. 9 Available at:
https://damsense.org/wp-content/uploads/2014/12/National-Economic-Analysis-of-the-Four-Lower-Snake-River-
Dams-2.16.pdf
11
Rocky Mountain Econometrics. “Lower Snake River Dam Alternative Power Costs,” 22 June 2015, p. 7. Available
at: https://damsense.org/wp-content/uploads/2014/12/Report_LSD-alt-power-costs.pdf
7the LSRD with no other resources installed will still allow the surplus to be capable of
accommodating energy loads.
Neither study, however, envisioned the region’s move to aggressive decarbonization policies, as
noted below.
2.1 Legislation Calling for A Decarbonized Grid
The 2014 White Book used in the Earth Economics study includes some planned retirements of
carbon-emitting resources but does not completely account for all early retirements of carbon-
emitting resources due to recent legislation.
In Washington state in 2019, the Clean Energy Transformation Act was signed into law, which
committed Washington to an electricity supply free of greenhouse gas emissions by 2045. 12 As
a result of this legislation and a regional desire to move away from fossil fuels, thousands of
megawatts of coal-fired generation will have been shuttered within the next few years.
In June 2021, Oregon’s legislature passed a similar measure for the state’s largest investor-
owned utilities.
Due to this move away from fossil-fueled generating resources, groups like the Northwest
Power & Conservation Council, the Northwest Power Pool, Pacific Northwest Utilities
Conference Committee, and Energy Strategies have all revised their forecasts, which now show
the region may face an energy shortage and potential rolling blackouts within the next five
years. 13 Similarly, the federal action agencies, in the 2020 joint Environmental Impact
Statement, indicated that breaching the four LSRD would double the region’s likelihood of facing
blackouts.
Importantly, additional decarbonization policies are also gaining traction. Very recently,
President Biden issued an executive order addressing the climate crisis, with goals for a carbon-
free power sector by 2035. 14 This pledge includes the elimination of natural gas-fired resources
12
Washington State Department of Commerce. https://www.commerce.wa.gov/growing-the-
economy/energy/ceta/
13
Northwest Power and Conservation Council. “Pacific Northwest Power Supply Adequacy Assessment for 2024,”
31 October 2019 Available at:
https://www.nwcouncil.org/sites/default/files/2024%20RA%20Assessment%20Final-2019-10-31.pdf
Northwest Power Pool. “Exploring a Resource Adequacy program for the Pacific Northwest,” October 2019
Available at: https://www.nwpp.org/private-
media/documents/2019.11.12_NWPP_RA_Assessment_Review_Final_10-23.2019.pdf
Pacific Northwest Utilities Conference Committee. “2020 Northwest Regional Forecast,” March 2020 Available at:
https://www.pnucc.org/wp-content/uploads/2020-PNUCC-NRF_0.pdf
14
The White House. Executive Order on Protecting Public Health and the Environment and Restoring Science to
Tackle the Climate Crisis, 20 January 2021. Available at: https://www.whitehouse.gov/briefing-room/presidential-
actions/2021/01/20/executive-order-protecting-public-health-and-environment-and-restoring-science-to-tackle-
climate-crisis/
8in addition to coal-fired generation, which would further reduce the region’s power supply
portfolio.
2.2 Massive Build-Out of Solar Power in California and Desert Southwest
Recently, DamSense has pointed to preliminary predictions of surpluses from the Northwest
Power and Conservation Council (NWPCC) beginning in 2027 but fails to acknowledge the
unusually high probability of energy shortages predicted by the Council between now and
2023 15.
Additionally, the NWPCC’s forecasted surplus is predicated on three important assumptions:
1. California and the Desert Southwest complete a massive build of solar power.
2. Transmission is available to import that power daily into the Pacific Northwest
3. The existing hydropower system—including the lower Snake River dams—are in place
help balance all of the imported solar power (i.e., to hold back water during the daytime
and generate with it in the evenings and at night). 16
DamSense, in its comments, does not recognize any of these important prerequisites.
False Assumption 3: The Replacement of Hydropower Turbines is Cost-
Prohibitive
A concern DamSense raises is the large cost of rehabilitation, or replacement, the 24 turbines
that generate hydropower from the four LSRD. 17 The major concern over these costs comes
from the notion that the useful life of a hydropower turbine is 35-45 years (according to
DamSense but disputed by BPA). 18
Also acknowledged is the fact that these turbines are already far into their useful life, with the
construction of the LSRD occurring in the 1960s and 1970s. Therefore, over the 100-year cost
projection DamSense considers, DamSense assumes a minimum two rehabilitations, but likely
15
Northwest Power and Conservation Council. “Update On Power Plan Needs Assessment: Revised Baseline ARMs
and Capacity Contribution Studies.” 9 March 2021. Slide 28. Available at:
https://www.nwcouncil.org/sites/default/files/2021_03_p1.pdf
16
In its June update on the 2021 Power Plan, the Northwest Power & Conservation Council included the following
statement, “Hydro flexibility and assessment is fundamental to adequacy results.”
https://www.nwcouncil.org/sites/default/files/2021_06_p2.pdf p156
17
Jim Waddell. “Costs of Keeping the Four Lower Snake River Dams: A Reevaluation of the Lower Snake River
Feasibility Report,” 28 July 2015 Available at: https://damsense.org/wp-content/uploads/2015/07/Cost-LSR-Dams-
1-1-2015F-2-vers-7-30-15.pdf
18
BPA disagrees with this DamSense claim. Per a conversation with BPA, “[These hydropower] turbines see greater
than 50 years of service before they are replaced.”
9three. 19 In its estimates, DamSense calculates the average annual cost of turbine rehabilitation
to be $26.2 million (in 2021 dollars, assuming 3% per year realized inflation). 20
Although this number may seem intimidating in size, breaking it down according to the amount
of energy produced offers a better viewpoint of the cost of turbine rehabilitation. Using
DamSense’s own numbers, consider the average annual cost to be $26.2 million. DamSense
indicates the LSRD to generate 795 average MegaWatts (aMW) over 8760 hours per year in the
cited Earth Economics analysis. Dividing $26.2 million by 795 aMW yields $32,956 per aMW.
Then, dividing by 8760 hours in a year gives $3.76 per MWh.
Note that this value was calculated using the average annual output of the LSRD to be 795
aMW based on the value claimed in the Earth Economics report, despite this measure being
lower than the 1000 aMW official output stated by the federal operating agencies. Using official
values, the dollar amount per MWh is $2.99.
This is not a significantly large cost, highlighting again, these results are the logical outcomes of
DamSense’s own reported assumptions. Further, based upon DamSense’s estimate of capital
costs for replacement of 24 turbine generators of $776 million (in 2013 dollars) 21, this is
equivalent to an overnight capital cost of $314/kW (in 2021 dollars, assuming 3% per year
realized inflation). 22
DamSense’s analysis does not address that wind and solar resources also have a limited useful
life and a significant upfront capital cost. The useful life for these resources is typically 20 years
for wind turbines and 25-40 years for solar resources. 23 Thus, using wind and solar power
resources will require at least equivalent rehabilitation cycles as hydropower turbines.
Moreover, a comparable cost expectancy for these replacement resources is omitted from the
Earth Economics analysis. Preliminary investigation indicates an overnight capital cost of
approximately $1500/kW for onshore wind and $1000/kW - $1400/kW for utility scale solar PV. 24
19
The estimated 2-3 future turbine replacements are based on a life expectancy of 35-45 years. BPA’s 50 year-plus
assumption means a single replacement in the study period is fairly certain, potentially with a second round
occurring toward the end of the study period.
20
Jim Waddell. “Costs of Keeping the Four Lower Snake River Dams: A Reevaluation of the Lower Snake River
Feasibility Report,” 28 July 2015 p. 7 Available at: https://damsense.org/wp-content/uploads/2015/07/Cost-LSR-
Dams-1-1-2015F-2-vers-7-30-15.pdf
21
Jim Waddell. “Costs of Keeping the Four Lower Snake River Dams: A Reevaluation of the Lower Snake River
Feasibility Report,” 28 July 2015 p. 7 Available at: https://damsense.org/wp-content/uploads/2015/07/Cost-LSR-
Dams-1-1-2015F-2-vers-7-30-15.pdf
22
Overnight capital cost provides a simplistic comparison of the costs of building power plants. It is the ratio of the
overnight cost of construction – the cost of construction if no interest was incurred during construction – to the
maximum instantaneous power the plant can deliver.
23
National Renewable Energy Laboratory. https://www.nrel.gov/analysis/tech-footprint.html
24
National Renewable Energy Laboratory. https://www.nrel.gov/analysis/tech-cost-dg.html
Northwest Power and Conservation Council. “Wind Reference Plant for the 2021 Power Plan.” 5 Nov 2019.
Available at: https://www.nwcouncil.org/sites/default/files/2019_1112_p3.pdf
10Levelized costs of electricity for these resources, built new, appears to be between are $26-
$54/MWh for wind, $31- $42/MWh for utility scale Crystalline solar PV, and $29 - $38/MWh for
utility scale thin film solar PV, none of which include the cost of battery back-up. 25 Since the
LSRD have the ability to store energy (in the form of water), in order to make an apples-to-
apples comparison, battery costs would have to be added to the wind/solar costs, which would
double or triple their price tag. 26
While not having performed a full levelized cost of electricity for the lower Snake River Dams, it
does appear that the marginal cost per megawatt-hour of the new turbines and generators is
much less than the levelized cost of wind and solar.
False Assumption 4: BPA Secondary Market Sales Result in a Financial
Loss
As noted above, BPA makes long-term firm power sales to Public Power Customers. These are
sales of power are made under BPA’s Priority Firm (PF) power rate of roughly $36 per MWh. 27
This power is considered firm or dependable under the driest of historical water supply
conditions, and so represents a purposely conservative estimate of likely hydropower
production.
If more water is available to generate energy – as is normally the case – BPA will make
additional or secondary sales into the wholesale power market.
DamSense contends that anytime secondary sales occur below the PF rate, that BPA is
suffering a financial loss 28. This contention is incorrect.
The PF rate contracts are established at a level intended to recover all of BPA’s power supply-
related costs. Because of this rate setting mechanism, nearly all costs of operating the LSRD
are fixed – particularly over rate-period time horizons – which means BPA’s marginal cost of
production at the LSRD is at or near zero per MWh.
Northwest Power and Conservation Council. “Solar, Battery Storage, and Solar + Battery Storage. Reference Plants
for the 2021 Power Plan.” 8 Oct 2019. Available at:
https://www.nwcouncil.org/sites/default/files/2019_1015_p4.pdf
25
National Renewable Energy Laboratory. https://www.nrel.gov/analysis/tech-cost-dg.html
Lazard. https://www.lazard.com/perspective/levelized-cost-of-energy-and-levelized-cost-of-storage-2020/
26
National Renewable Energy Laboratory. https://www.nrel.gov/analysis/tech-cost-dg.html
Lazard. https://www.lazard.com/perspective/levelized-cost-of-energy-and-levelized-cost-of-storage-2020/
27
Bonneville Power Association. “Tiered Rate Methodology.” Sept 2020. Available at:
https://www.bpa.gov/news/pubs/FactSheets/fs-202009-Tiered%20Rate%20Methodology.pdf
28
DamSense. “Lower Snake Dams.” Available at: https://damsense.org/lower-snake-dams/
“Understanding Energy with Dam Sense.” YouTube, uploaded by James Waddell, 1 June 2020. Available at:
https://youtu.be/b6fHE4v6WIc
11Therefore, in the short run, secondary sales made at prices in excess of zero produce additional
net revenue (i.e., are profitable) for BPA. Because BPA is a not-for-profit agency, these
additional revenues help reduce rates for customers.
BPA has stated that the LSRD are some of its most cost-effective dams and that they have a
marginal cost of production well below the PF rate, even under critical water conditions, and
therefore help to reduce BPA’s average cost of production in all cases even if they produced no
secondary sales revenue.
DamSense also implies that secondary sales prices will often be below BPA’s costs, but market
prices during the summer of 2020 approached $1000 per MWh during certain hours. BPA’s
secondary sales into this market greatly reduced BPA’s power supply costs for the year.
Market prices for power can and do vary, and any snapshot in time may show market prices
above or below the then prevailing PF rate.
False Assumption 5: Electricity Production Is a Homogenous Good
A homogenous good is one in which every unit is identical. A kilowatt of electricity delivered to
the same location at the same time fits this description. However, the Earth Economics report
incorrectly ignores important and distinct attributes of electric generation.
Energy sources have varying properties which differentiate the product. One important property
to consider is the availability of the power source.
In the case of dam removal, the Earth Economics analysis suggests a combination of open
market purchases and solar power can meet energy needs if the LSRD are breached or
removed. 29 However, solar panels do not have the built-in storage capability the LSRD provide.
Neither do wind turbines. As a result, solar and wind resources are often referred to as
“intermittent,” meaning that they don’t produce power on a continual or dependable basis.
DamSense calls the LSRD run-of-river dams 30, implying they don’t have storage. However, the
LSRD have reservoirs that provide energy storage capability (in the form of stored water) over a
multi-hour or multi-day period. This storage allows the dams to ramp up power production (i.e.,
release more water) when more energy is needed and reduce output (i.e., hold back more
water) when demand declines. Resources that can be controlled in this manner are referred to
as “dispatchable” resources.
29
Earth Economics. National Economic Analysis of the Four Lower Snake River Dams: A Review of the 2002 Lower
Snake Feasibility Report/Environmental Impact Statement Economic Appendix(I). 2016. p. 9 Available at:
https://damsense.org/wp-content/uploads/2014/12/National-Economic-Analysis-of-the-Four-Lower-Snake-River-
Dams-2.16.pdf
30
“Understanding Energy with Dam Sense.” YouTube, uploaded by James Waddell, 1 June 2020. Available at:
https://www.youtube.com/watch?v=b6fHE4v6WIc&t=3844s
12Importantly, supply and demand for electricity must be in perfect balance every moment of the
day, or uncontrolled blackouts can occur. Because solar is intermittent and hourly blocks of
wholesale (i.e., utility-to-utility) market purchases can’t fill in the minute-to-minute variations,
dispatchable resources are needed to keep the grid up and running. Sub-hourly markets also
have limitations. 31
Importantly, relying on wholesale market purchases can backfire during periods of high demand.
California, ERCOT, the Southwest Power Pool, and the Midwest ISO instituted rolling blackouts
in the past year due to extreme weather paired with high demand and a lack of sellers in the
wholesale energy markets.
Ignoring the important characteristics of electric grid reliability, therefore, significantly
underestimates the LSRD’s value to the region.
False Assumption 6: The LSRD Have Little Storage Capability
An important benefit that the LSRD provide is the ability to provide critical winter energy and
capacity to serve regional loads during peak periods. This benefit is very important, because the
region’s solar and wind power resources tend to produce very little energy during extreme
weather events. However, DamSense claims that a peaking power scenario by the LSRD is
nearly infeasible, 32 stating that the LSRD operation more closely follows that of a run-of-river
dam, essentially eliminating any ability to provide power during peak demand.
As mentioned, although the LSRD are not big storage dams, they are not simply typical run-of
river dams either. This can be seen by looking through the historical inflow and generation of the
four dams. They are able to generate higher level of power throughout the peak demand hours
and lower levels during the off-peak hours despite there not being large levels of variation in the
amount of water flowing into each dam during each time period.
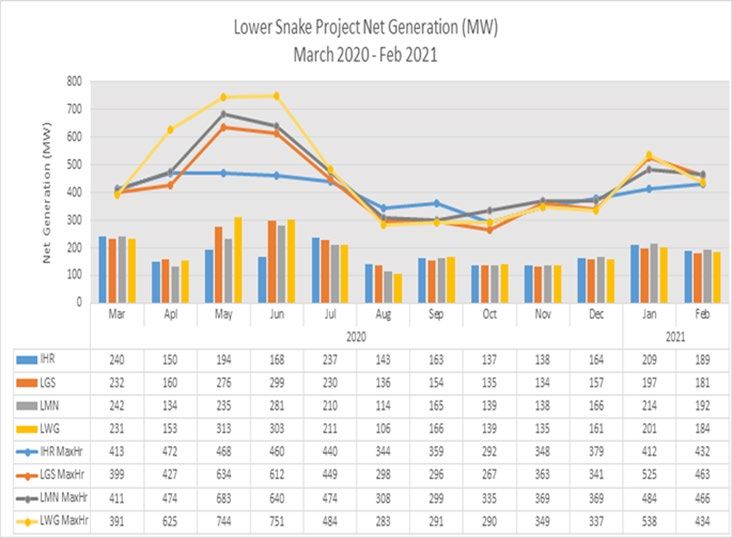
The following figure graphs the actual month average energy output and the 1-hour peak
generation values for the LSRD using actual generation between March 2020 and February
2021. It is shown that throughout the year, the LSRD are able to peak above their average
output. Furthermore, the values do not include the reserves that were held, meaning that the
projects could generate even more than they did, but had to stop to maintain the spare
generation capability in case the reserves were called upon.
31
Even sub-hourly markets like the Western Energy Imbalance Market require participants to demonstrate each
hour that they can provide sufficient dispatchable resources to balance the variations of intermittent renewables
and demand. If the participants cannot demonstrate this capability, they are locked out of the market for the
subsequent hour.
32
DamSense. “Peak Power Demand Is A Phony Excuse For Keeping the Lower Snake River Dams.” 19 Oct 2016.
Available at: https://damsense.org/wp-content/uploads/2017/02/Peaking-Power-Fact-Sheet-10.17.16.pdf
13Figure 1 33
Additionally, the ability of the LSRD to adjust their generation output based on demand needs
can be shown through a model of the four-dam system. The dams are able to build up their
respective reservoir storage and release the extra water for power generation when needed to
serve the critical winter loads. Results from such a model can be found in Appendix A. The
model workbooks are available upon request. (“LSRD_Peaking - Winter” and “LSRD_Peaking –
Summer.”)
False Assumption 7: Transportation of Goods Could be Easily Transferred
to Rail
The LSRD allow the river to be used to transport goods via barging. DamSense recognizes this
fact but implies barging can be replaced by railroads with little strain on the rail system.
Similarly, although the Earth Economics analysis shows the dams offer a benefit in the
33
Courtesy of BPA
14navigation category due to barging, it only examines the difference between cost per ton-mile
for truck/rail and truck/barge, not taking rail constraints into consideration. 34
7.1 Capital Investments
The Earth Economics report relies on the assumption that the existing road, bridge, rail, and
grain elevator systems are capable of safely handling the change.
Importantly, the analysis does not consider the capital investments required to expand the rail
system so that it can transport the additional freight. This omission is sizable, because
significant amounts of goods are transported by barge via the lower Snake River; over 3.9
million tons in 2019 35.
Using comparisons provided by Pacific Northwest Waterways Association, an estimation of 0.74
four-Barge Tows (four barges per tow) a day transport goods on the lower Snake River. 36 One
Tow is equivalent to 1.4 Unit trains (100 cars per Unit train), resulting in an approximate one
additional Unit train needed a day.
If the railroads are not able to transport the incremental freight, then trucks would be the next
available method. One Tow is equivalent to 538 trucks. 37 Thus, 0.74 tows a day would be
around 398 trucks a day.
Switching from barging to trucking would require a large quantity of trucks that would need to be
obtained, as well as drivers. In the Earth Economics report, the economic analysis of using
trucks is not considered, so the report’s assumed cost is not known.
As a comparison to the Earth Economics report, the Lower Snake River Dams replacement
concept floated by Representative Simpson in 2021 acknowledges that the existing rail system
is insufficient to meet the incremental needs associated with the loss of barging on the lower
Snake River. Simpson’s plan calls for $1.5 billion of infrastructure investment specifically to build
out the necessary additional rail capacity if the dams were breached. 38
34
Earth Economics. National Economic Analysis of the Four Lower Snake River Dams: A Review of the 2002 Lower
Snake Feasibility Report/Environmental Impact Statement Economic Appendix(I). 2016. p. 10 Available at:
https://damsense.org/wp-content/uploads/2014/12/National-Economic-Analysis-of-the-Four-Lower-Snake-River-
Dams-2.16.pdf
35
Pacific Northwest Waterways. “Snake River 2008 -2019”
36
Pacific Northwest Waterways. “Columbia Snake River System Facts.” Available at:
https://www.pnwa.net/wp-content/uploads/CSRS.pdf
37
Pacific Northwest Waterways. “Columbia Snake River System Facts.” Available at:
https://www.pnwa.net/wp-content/uploads/CSRS.pdf
38
Representative Mike Simpson. “The Northwest In Transition”. Available at
https://simpson.house.gov/uploadedfiles/websiteslides2.4.pdf
157.2 Competition in the Barging and Rail Industries
The Earth Economics cost-benefit analysis mentions a potential overstatement of benefits to
barging. It states, “A recalculated analysis of the benefits of navigation presented in the 2002
FR/EIS finds that the additional rail rate charged to farmers is only seven cents per ton more
than barging, reducing benefits to $0.44 million.” 39
The mentioned “recalculated analysis” finds that this reduction in calculated benefits is a result
of pinpointing faults in the model the EIS used, and then adjusting for those faults. The analysis
claims the models produced barge rates that were much lower than the actual rates used in the
industry. 40 Instead of barge shipment rates reflecting the marginal cost, the actual rates were
higher allowing for high profits for the barging companies.
The report states, “The wide disparity between rates and costs suggests that in many cases
rates are not set in a competitive environment, which is the condition required for rates to be
used in NED analysis.” 41 A look into the barging companies with service on the LSR does not
immediately refute this idea, with only two of the listed companies seeming to be barges that
would be used to transport goods. 42
DamSense claims that had the higher rates been used in the EIS cost-benefit analysis, the
navigational benefit of keeping the LSRD would be reduced to zero, which refutes the need for
the LSRD. 43 However, addressing the lack of competition in the barging market does not
necessarily mean that removing barging is the optimal choice.
For example, DamSense discusses the cost of maintenance for sediment management and
locks, while overlooking potential costs of switching to rail (as noted above). Further, the
railroads also operate in a non-competitive market, hence regulation of rail rates by the Surface
Transportation Board.
Thus, it needs to be considered how rail rates would change in response to the new demand
and limited supply of rail cars in a market that already suffers from a lack of competition. As the
39
Earth Economics. National Economic Analysis of the Four Lower Snake River Dams: A Review of the 2002 Lower
Snake Feasibility Report/Environmental Impact Statement Economic Appendix(I). 2016. p. 11 Available at:
https://damsense.org/wp-content/uploads/2014/12/National-Economic-Analysis-of-the-Four-Lower-Snake-River-
Dams-2.16.pdf
40
Jim Waddell. “Commercial Navigation on the Lower Snake River: The Truth About Benefits vs. Costs,” January
2019 p. 2 Available at: https://damsense.org/wp-content/uploads/2019/02/B-Commercial-Navigation-The-Truth-
About-Benefit-vs-Cost.pdf
41
Jim Waddell. “Commercial Navigation on the Lower Snake River: The Truth About Benefits vs. Costs,” January
2019 p. 2 Available at: https://damsense.org/wp-content/uploads/2019/02/B-Commercial-Navigation-The-Truth-
About-Benefit-vs-Cost.pdf
42
Columbia River Towboat Association. https://columbiarivertowboatassociation.com/about-us
43
Jim Waddell. “Commercial Navigation on the Lower Snake River: The Truth About Benefits vs. Costs,” January
2019 p. 2 Available at: https://damsense.org/wp-content/uploads/2019/02/B-Commercial-Navigation-The-Truth-
About-Benefit-vs-Cost.pdf
16demand for rail increases and the expenditure of rail infrastructure also increases due to the
need for more of it, basic economics indicates the rail rates would also increase.
DamSense’s own statement acknowledges, “Of importance here is not only the fact that barging
rates were much higher than the costs, but also the comparison of shipping rates for truck/barge
with shipping rates for truck/rail. [There are] relatively small differences between actual shipping
rates across modes from the same location, indicating that a competitive market was in place”. 44
The removal of the option of barging would take away this competitive choice, forcing farmers
and other shippers to enter the non-competitive rail market and bear the costs.
7.3 Increased Pollution
The increased pollution impact from switching away from barging to the use of truck and rail is
also a cost that needs to be considered. A report for Pacific Northwest Waterways estimates
that shifting from barge to rail and truck will increase annual carbon dioxide emissions by
860,000 tons 45. Using these methods to transport goods produces much more pollution,
ultimately contributing to the current climate crisis.
False Assumption 8: Recreational Use Survey Results Are Accurate
The Earth Economics analysis assumes a large benefit from the added recreational value from
dam removal - around $1.5 billion. 46 This value was calculated by using the results of a survey
assessing the public’s likelihood of using the potential recreational area. The survey results
were analyzed, then used to determine a willingness-to-pay value for residents of California,
Oregon, Washington, Idaho, and Montana.
This value is used to calculate the general recreation benefit to the area. This method relies on
a variety of assumptions. To determine visitation interest, survey recipients were asked whether
they would “Definitely Visit”, “Probably Visit”, “Probably Not Visit”, or “Definitely Not Visit” a free-
flowing lower Snake River. Earth Economics uses these responses and the following strategy
for determining visitation:
The study states the following methodology:
44
Jim Waddell. “Commercial Navigation on the Lower Snake River: The Truth About Benefits vs. Costs,” January
2019 p. 3 Available at: https://damsense.org/wp-content/uploads/2019/02/B-Commercial-Navigation-The-Truth-
About-Benefit-vs-Cost.pdf
45
Pacific Northwest Waterways, “National Transportation Impacts and Regional Economic Impacts Caused by
Breaching Lower Snake River Dams,” 10 Jan 2020. Available at:
https://files.constantcontact.com/9a08bcf9001/8768ec34-9437-4adb-badb-477bde47019b.pdf
46
Earth Economics. National Economic Analysis of the Four Lower Snake River Dams: A Review of the 2002 Lower
Snake Feasibility Report/Environmental Impact Statement Economic Appendix(I). 2016. Available at:
https://damsense.org/wp-content/uploads/2014/12/National-Economic-Analysis-of-the-Four-Lower-Snake-River-
Dams-2.16.pdf
17“…all respondents indicating they would ‘definitely’ and ‘probably’ visit, would in fact visit
[in years 1-5]. In years 5-100, California respondents that marked they would ‘definitely’
visit would visit, while ‘probably’ (yes) respondents would not visit. Response
assumptions for Washington, Idaho, Oregon, and Montana stay consistent through years
1-100, assuming visitation by ‘definitely’ and ‘probably’ (yes) responses” 47
To summarize, the analysis assumes that anyone who replied “definitely yes” or “probably yes”
would, in fact, visit. However, responding either of these answers was of no cost to the
respondent. There was no requirement to visit in the future or any other obligating cost, so it is
easy for a participant to answer yes without later following through. Assuming every participant
would follow through likely overestimated visitation.
Importantly, Earth Economics assumes that this usage persists every year for 100 years, even
though the report is unclear if the survey question only required if respondents would visit
someday or each year. The results of these assumptions will likely lead to spurious results.
Conclusion
The DamSense contention is that it makes economic sense to breach the four lower Snake
River dams. This contention is primarily predicated on benefit-cost ratios determined in a paper
by Earth Economics that was co-produced by the DamSense founder. These ratios suggest that
breaching the dams is the more economically efficient choice, but multiple assumptions used in
that analysis contribute to inflating that ratio to a higher-than accurate value.
There are significant potential methodological problems regarding the costs and benefits of
replacement power. Additionally, the importance of resource adequacy and the significance of
firm and dependable capacity is overlooked. These problems can be expected to have a
material effect on the ultimate conclusions.
Claims surrounding replacement of barging with rail or trucks provide little to no supporting
evidence that these modes are viable. Absent a clear quantifiable assessment as to scale of the
replacement modes of transport, the ability of existing infrastructure to accommodate this shift,
and estimation of any capital investment in new infrastructure if current capabilities are not
sufficient, means that DamSense’s conclusions cannot be relied upon. This deficiency is
compounded by a failure to assess the socioeconomic cost of increased emissions resulting
from a transportation mode shift.
47
Earth Economics. National Economic Analysis of the Four Lower Snake River Dams: A Review of the 2002 Lower
Snake Feasibility Report/Environmental Impact Statement Economic Appendix(I). 2016. p. 15 Available at:
https://damsense.org/wp-content/uploads/2014/12/National-Economic-Analysis-of-the-Four-Lower-Snake-River-
Dams-2.16.pdf
18There are also methodological questions regarding recreational services valuation. There
appear to be logical errors associated with usage rates, especially for those visitors from outside
the immediate area that may be important.
DamSense’s cited analyses provide a number of engineering and operating parameter
assumptions that are not well supported. Although these analyses seemingly indicate a clear
choice to breach the dams, the assumptions push the analysis in favor of breaching the dams,
resulting in an underestimate of the costs and an overestimate of the benefits.
For more information on Northwest hydropower issues, please see our website:
www.nwriverpartners.org
Acknowledgements
We would also like to thank Bonneville Power Administration personnel for taking time to
answer questions related to BPA’s operating costs and rate setting methodology. We would also
like to thank the Public Power Council for its review of an earlier draft of this whitepaper.
19Appendix A
This appendix serves to offer a modeled view of the ability of the LSRD to store water for later
use when needed for periods of high demand. The model workbooks are available upon request
in Excel documents titled, “LSRD_Peaking - Winter” and “LSRD_Peaking – Summer.”
A.1 Model Outline
The model covers one-hour increments over a five day period – a total of 120 hours. The winter
model is set for operation between late December and February and the summer for operation
between late June and August. These timeframe were selected because they are the seasons
when peaking capabilities are most critical.
The average inflow into the system is based on historical flow data 48. The average daily flow
data into Lower Granite Dam in the months of January and July were calculated. Then, the
three water levels – low, mid, high, were determined based on the 25th, 50th, and 75th percentile
average daily flow values over the years 1976-2020 for each of the two months used to
represent winter and summer.
Historical flow data was then used to determine the inflow into the system by selecting five-day
periods in January and July between 2012 and 2020 that had a five-day average equivalent to
the previously calculated 25th, 50th, and 75th percentiles. These dates were selected to allow for
the use of real flow data which was roughly equivalent to the average daily inflow. The data is
reported at six-hour intervals. To account for the gaps, each recorded value was used for its
actual time, as well as the two hours immediately before and the three hours immediately after.
In total, each recorded value was used for a six-hour interval.
For each of the four LSRD: Lower Granite(LWG), Little Goose(LGS), Lower Monumental(LMN),
and Ice Harbor(IHR), the following values of interest are calculated at each hour: Beginning
Reservoir Elevation, Beginning Reservoir Content, Outflow, Ending Reservoir Content, and
Ending Reservoir Elevation. The Generation for each dam is an input at each hour.
The model mimics the actual system by including a one-hour lag between each dam. Thus, the
inflow at a specific dam is the outflow of the dam immediately upstream one hour earlier, except
for LWG which takes its inflow as an input. Similarly, the beginning elevation at a time t for a
specific dam is the ending elevation at the same dam at time t-1, the hour immediately prior.
Each dam is set with a beginning elevation of midway between the operating pool at the very
start of the model.
The H/k value for each dam at each hour is determined using a function dependent on the
beginning elevation of the reservoir. The function is as follows:
H/k = ((Maximum H/k – Minimum H/k) * x ) + Minimum H/k
US Army Corps of Engineers. “LWG.Flow-In.Inst.~6Hours.” 2012-2020. Available at: https://www.nwd-
48
wc.usace.army.mil/dd/common/dataquery/www/
20Where x = (Beginning Elevation – Minimum Operating Pool)/ (Maximum Operating Pool – Minimum Operating Pool)
For the winter model, late December to February, the LSRDs “nighttime” hours allowance is
used. This allows for no generation between 6 pm and 6 am, as well as up to three daytime
hours of no generation between Dec 15 – Feb 28 49. The summer model does not include any
“nighttime” hours but does take into account the required summer spill and the required
minimum operating pool for each reservoir, based on 2021 regulations. 50
A.2 Model Results
The results of the model show that the LSRDs do provide the ability to store water as needed by
reducing generation during low winter demand hours, and then produce large generation levels
during hours of high winter demand. The results of the summer model have less flexibility due to
the reduced operating pool, but the LSRD still have some capability to shape generation during
those months.
The following figure shows the planned generation versus the average generation in the
modeled mid-water winter peaking scenario.
Planned vs Average Generation
Mid Water Winter Peaking
Average System Inflow: 29.6 kcfs
3000
Generation (MW)
2500
2000
1500
1000
500
0
1
5
9
13
17
21
25
29
33
37
41
45
49
53
57
61
65
69
73
77
81
85
89
93
97
101
105
109
113
117
Time (Hour)
Planned Gen Average Gen
The figure shows that the LSRDs are able to generate power levels well above the average
power production when needed, and then use lower demand periods to refill the reservoir to
49
“2021 Water Management Plan.” Dec 31, 2020. P. 38. Available at:
http://pweb.crohms.org/tmt/documents/wmp/2021/Final/20201231_WMP_2021_Final.pdf
50
Army Corps of Engineers. “2021 Fish Operations Plan.” March 31, 2021. Available at:
http://pweb.crohms.org/tmt/documents/fpp/2021/final/FPP21_AppE_03-31-21.pdf
21allow for more peaking capability if necessary. Simply looking at the average hourly output in
this scenario would not show the entire picture of the LSRDs power generation.
Each of the six modeled scenarios (low, high, and mid water for both winter and summer) were
able to show the ability of the LSRD to provide peak power to varying extents – as mentioned,
the winter flexibility was greater than that of the summer. Although, the actual peaking
capabilities at a specific time depend on the river flow at that time, the LSRD do have the ability
to shape power generation. The results of the other five scenarios can be found in the attached
spreadsheets, under the “Charts” tab.
The following figures show the reservoir elevations for the mid-water winter scenario throughout
the period for each of the four dams. Each dam is able to fluctuate its reservoir levels in order to
allow for peaking capabilities.
Lower Granite Reservoir Elevation
737
736
Generation (MW)
735
734
733
732
731
1 5 9 13 17 21 25 29 33 37 41 45 49 53 57 61 65 69 73 77 81 85 89 93 97 101105109113117
Time (Hour)
22You can also read