Is BC a Net Power Importer or Exporter? - UVic
←
→
Page content transcription
If your browser does not render page correctly, please read the page content below
Is BC a Net Power Importer or Exporter?
                             Amy Sopinka and G. Cornelis van Kooten

                                        University of Victoria

Introduction

       On April 28, 2010, the province of British Columbia introduced the Clean Energy Act.
While the purpose of the Act has many repercussions for the provincial electricity sector, one of
its primary objectives is to create and promote opportunities for energy exports. As the
government’s background document to the Clean Energy Act states: “in addition to supplying
domestic needs [the province will] work in partnership with renewable power producers to
actively seek opportunities to sell clean, reliable electricity to neighbours in Canada and the
U.S.” (Government of British Columbia 2010, p.1). Yet, substantial controversy appears to
surround the viability of British Columbia’s electricity system. One side argues that BC already
has abundant energy resources and uses them to generate sales in lucrative adjacent markets.
The other side says energy demand in BC is growing so quickly that it has already outpaced the
province’s ability to meet it, with the province forced to purchase electricity from adjacent
markets. Which of these stories is true? The short answer is both and neither.
       The question of whether British Columbia is a net exporter or net importer of electricity
is misleading because any answer fails to tell the full story. It is necessary to distinguish
between revenues and volumes when assessing whether the province is a net exporter or net
importer. In this regard, one also needs to distinguish between the capacity to generate
electricity and actual power production.

British Columbia’s Electricity Infrastructure

       BC Hydro is the single largest entity in BC’s electricity sector and the third largest utility
in Canada. The crown‐owned corporation serves 94% of the province’s population. BC Hydro’s
franchise area is the entire province of British Columbia, but excludes the area serviced by
FortisBC, which is a regulated public utility that operates in the province. FortisBC’s
transmission system connects with BC Hydro to form an integrated provincial electricity grid.
                                                                                                        1
But FortisBC is not the only player in the provincial system.
Nelson Hydro operates generation, transmission and distribution facilities for the City of
Nelson. The cities of New Westminster, Grand Forks, Kelowna, Penticton, as well as
Summerland Power and Hemlock Valley Utilities, distribute power to their customers after
purchasing electricity from BC Hydro or FortisBC.
In addition to publicly‐owned generation facilities, independent power projects (IPP)
have been and are being built and operated by private firms. Teck Cominco Metals Ltd. is an
international mining corporation operating in British Columbia that owns the Waneta Dam near
Trail on the Pend d'Oreille River, just before it enters the Columbia River. The dam was
completed in 1954 to provide power to the company’s smelter and has a generating capacity of
450 MW; there is a (2009) proposal to expand the Waneta’s generating capacity by 335 MW. 1
Rio Tinto Alcan owns the Kemano hydroelectric facility on the Nechako River, a tributary
of the Fraser River, and the accompanying transmission assets connect the company’s
aluminum smelter at Kitimat to BC Hydro’s grid. The Kenney dam was completed in 1954 and
has a generating capacity of 896 MW.
BC Hydro manages the largest share of the provincial capacity, although generation by
independent power producers (IPPs) is growing in importance. British Columbia is able to sell
and purchase power in adjacent markets due to interconnections with Alberta and the United
States. BC's grid is linked to Alberta via two 138 kV lines and one 500 kV line. Two 500 kV lines
and two 230 kV lines connect BC to the U.S. Complicating the supply picture are the flows of
‘Treaty power’ that were negotiated through the Columbia River and Skagit Valley Treaties, plus
the Libby Coordination agreement.
The Columbia River Treaty
The Canadian side of the Columbia River originates in British Columbia, Montana and
Idaho, and, after leaving Canada, flows through Washington and Oregon into the Pacific Ocean.
The Columbia River Treaty was negotiated between Canada and the U.S. during the period
1
See http://www.columbiapower.org/projects/wanetaexpansion.asp (viewed June 8, 2010). Teck sold
one‐third of its interest in the Waneta dam to BC Hydro for $850 million as of March 5, 2010. This
represents Teck’s historical surplus generation that was sold to BC Hydro. Teck also owns 15 km of
transmission line connecting its BC operations to the United States.
2following major flooding on the Columbia River in the U.S. in 1948; the Treaty was signed in
1961 and ratified by Canada in 1964. 2 It resulted in the construction of the Duncan (1967),
Hugh Keenleyside (1968) and Mica (1973) dams in BC and the Libby Dam (1975) in Montana on
the Kootenay River – a tributary that accounts for 20% of the water in the to the Columbia River
leaving Canada. The purpose of the Treaty was primarily flood control, but the operation of the
Canadian dams increased power generation in downstream dams, with half of this additional
electricity and half of the power output from Libby Dam allocated to BC. As part of the Treaty, a
Pacific Northwest‐Southwest intertie was also built to transfer BC’s share of this electricity to
California. The Treaty obliges BC to operate the Mica, Arrow and Duncan dams for the purpose
of flood control benefitting the U.S.; thus, BC cannot operate its reservoirs in a way that would
adversely affect the stream flow of the Columbia River in the U.S.
In 1977, BC Hydro installed a powerhouse at the Mica dam with a capacity of 1792 MW
– the only Treaty dam to produce power within a few years of construction. In 2003, a
powerhouse with a capacity of 185 MW was built at the Keenleyside Dam. Further, although
not mentioned in the Columbia River Treaty, the developments on the Columbia River
facilitated construction of the Kootenay Canal Plant (1975) and Revelstoke Dam (1984), located
between the Keenleyside and Mica dams just north of the town of Revelstoke. After recent
upgrades, the Kootenay Canal Plant has a generating capacity of 580 MW, while the Revelstoke
Dam has a generating capacity of 2480 MW (after the addition of another 500 MW unit in
2010).
Libby Coordination Agreement
The Libby Coordination Agreement was negotiated in 2000 resolving a dispute between
2
The federal government negotiated the Treaty on behalf of the province of British Columbia, which
assigned the task of constructing and operating the Treaty dams to BC Hydro and the power generated
in the U.S. that is allocated to BC to BC Hydro’s marketing subsidiary, Powerex. A history of the Columbia
River Treaty, including the controversies and its costs and benefits is available at (viewed June 7, 2010):
http://www.empr.gov.bc.ca/EAED/EPB/Documents/History%20ofColumbiaRiverNov139web).pdf.
3BC Hydro and the Bonneville Power Authority (BPA)/US Army Corps of Engineers. 3 The
agreement allows the Corps of Engineers and BPA to spill water for in‐stream purposes, namely,
to protect the endangered Kootenai sturgeon. This water is not used to generate electricity,
thereby reducing the overall power generated in the system and reducing the power that
would otherwise accrue to BC. The agreement enables spilling of water for in‐stream purposes
without reducing the power benefits that British Columbia is entitled to under the Columbia
River Treaty.
Skagit Valley Treaty
The Skagit Valley Treaty (1982) came about because Seattle wished to raise the height
of the Ross Dam on the Upper Skagit River in Washington, which would raise the level of Ross
Lake. Ross Lake straddles the international boundary and Canada opposed raising the lake level,
because this would reduce the generating capacity of BC’s Seven Mile Dam (1979), which is a
run‐of‐river facility. The agreement requires that BC Hydro deliver the equivalent of 35.4 MW of
capacity to the Seattle load centre at prices to be determined through negotiation.
Generating Capacity vs. Power Production
To determine whether BC is a net exporter or importer of electricity, it is important to
distinguish between generated power (energy) and generating capacity. Generating capacity
refers to the full‐load continuous rating of a generator, also known as the nameplate rating or
maximum continuous rating (MCR). Thermal generators are able to provide power consistently
near to their MCR because of the constant and unvarying fuel supply. The electricity that is
generated from renewable energy technologies depends on the availability of the fuel source,
whether it is water, wind or sun. Hydroelectric units are reliant upon sufficient water inflows
and, even where they are supported by reservoir infrastructure, reservoir levels (also known as
3
The Bonneville Power Administration is a U.S federal energy agency in the Pacific Northwest. BPA
markets wholesale electrical power from 31 federal hydro projects in the Columbia River Basin, a non‐
federal nuclear plant and several other non‐federal power plants. The dams are operated by the U.S.
Army Corps of Engineers and the Bureau of Reclamation. BPA also operates and maintains about three
quarters of the high‐voltage transmission lines in its service territory of Idaho, Oregon, Washington,
western Montana and parts of eastern Montana, California, Nevada, Utah and Wyoming.
4elevations). Treaty and in‐stream environmental considerations, such as flood control and fish
habitat, affect the dam owner’s ability independently to manage these elevations. Thus, the
power output from hydroelectric generators may vary significantly from their capacity values in
any given hour, day, month, season and/or year.
Independent power projects with a variable fuel source are likely to have an even
greater discrepancy between capacity values and energy output (BC Hydro 2010a). Run‐of‐river
hydroelectric generation uses only the actual flow of water to generate electricity; there is no
associated water storage capability. Wind energy output will also be less than its installed
capacity value, as power is produced only during periods of sufficient wind. If the wind is too
strong, wind turbines are required to shut down due to safety concerns, while too little wind
will not enable power production at anything near a turbine’s generating capacity (or may even
result in zero output).
Capacity vs. Peak load
When the BC electricity system was built, the additional cost of adding turbines to large‐
scale dams was relatively small; it was rather easy to add capacity. Even though not all dams
constructed under the Columbia River Treaty initially included generation facilities, British
Columbia nevertheless purposefully overbuilt the electricity system’s capacity relative to
immediate and foreseeable demands. Excess capacity continues to exist even today. As of 2010,
excluding the Burrard thermal plant, 4 we estimate that the province of British Columbia has
some 13,250 MW of generating capacity. Total generating capacity is comprised of 9,491.8 MW
of BC Hydro capacity, 850 MW of FortisBC managed hydro capacity and 1,578 MW of existing
IPPs. Further, Rio Tinto Alcan can provide 162 MW of net‐to‐grid power from its Kemano facility
under the Alcan/BC Hydro 2007 Long‐Term Electricity Purchase Agreement (LTEPA). In addition,
the Columbia River Treaty provides British Columbia a capacity equivalent to 1,170 MW of
installed generation. The composition of currently available capacity is shown in Figure 1.
4
The Burrard natural gas plant is a peaking plant that was used in rare times when (peak) demand and
export commitments happen to exceed immediate generation. On October 28, 2009, BC Ministry of
Energy and Mines announced that the Burrard plant would be used to provide electricity to the grid only
in cases of generation and transmission outages.
5FortisBC
6% Alcan EPA
1%
IPP
Generation
12%
BC Hydro
72% Columbia
River
Entitlement
9%
Figure 1: Composition of currently capacity available to meet total provincial electricity demand.
Total Generating Capacity: 13,250 MW
In the future, BC Hydro (2008a) is planning an upgrade the Mica dam site with two
turbines providing an additional 1,000 MW of capacity, and 500 MW was recently added to the
Revelstoke Dam (and not included in the above figures). Provincial capacity will be further
supplemented when projects from BC Hydro’s Clean Power Call become operational. BC Hydro
anticipates approximately 1,116 MW of renewable energy projects will be constructed by the
selected proponents. In addition, the province is seriously considering the construction of the
proposed Site C hydro facility on the Peace River, which will provide an additional 900 MW of
capacity to the province and a reservoir with a surface area of 9,310 hectares. 5 If the project
goes ahead, it could be completed as soon as 2020.
In theory, BC’s total generating capacity is sufficient to meet future provincial demand.
However, because the vast majority of generating capacity is hydroelectric, capacity varies
according to water availability, in‐stream requirements and Treaty obligations related to flood
control and power generation in the U.S.
Forecasts of future electricity demand have been made by BC Hydro (2008a) and by
FortisBC (2009). Since these two utilities serve 100% of the provincial load, aggregating the two
demand forecasts provides an indication of the province’s electricity demand over 2010 ‐2027.
5
This raises the future possibility in the Peace River region of using the reservoir associated with Site C
and the upstream Williston reservoir (behind Bennett Dam) in pumped‐hydro storage system associated
with potential wind‐farm developments in the region.
6Peak load is the demand‐side equivalent of installed capacity. It is defined as the maximum
instantaneous load or the maximum average load over a designated interval of time (usually no
longer than one hour). In the BC Hydro (2008b) and FortisBC (2009) forecasts, the peak load is
the maximum load in any one hour within a given year. Estimates of provincial peak load are
provided in Figure 2.
Provincial peak demand is forecast to exceed the current capacity of 13,250 MW no
earlier than in 2019. Until then electrical generation capacity is expected to remain above peak
load requirements – the province currently has and is expected to continue to have excess
generating capacity for at least the next nine years. Only if no additional capacity is added to
the system (which is unlikely given BC’s Clean Energy Act) will demand exceed the potential to
generate power. Of course, this conclusion depends crucially on the availability of sufficient
water to facilitate operation at full generating capacity at the same time that a peak load is
encountered.
16,000
14,000
12,000
10,000
MW
8,000
6,000
4,000
2,000
0
2010
2011
2012
2013
2014
2015
2016
2017
2018
2019
2020
2021
2022
2023
2024
2025
2026
2027
Figure 2: Total forecasted provincial peak load (MW), 2010 to 2027
The excess capacity argument is corroborated by data on BC Hydro’s System Capacity
Supply (BC Hydro 2008a, Table 6‐12). BC Hydro assumes there will be a reduction in load as a
result of its demand‐side management programs. Then, under normal load conditions and
taking into account supply reserves, BC Hydro does not anticipate a shortage in capacity until
F2028. In its LTAP, BC Hydro (2008a) subtracts 14% minus 400 MW of its available generating
7capacity to set aside for reserves. These reserves are maintained to ensure that the system is
able to meet domestic demand in all but the most extreme cases; typically a loss of load event
occurs once in 10 years. By dedicating 14% of supply to reserves, BC Hydro calculates that it can
ensure appropriate system dependability; it further assumes that 400 MW of the reserves can
be procured in the market.
The LTAP states that total BC Hydro capacity is comprised of 9,700 MW of heritage
hydroelectric generation, although available hydro capacity appears to be closer to 9,450 MW.
This discrepancy requires further investigation. The second line item provides generating
capacity figures for Heritage Thermal assets and Market Purchases. The Long Term Acquisition
Plan (BC Hydro 2008a) was filed prior to the government’s announcement to reduce the
availability of the Burrard thermal gas plant, and so the forgoing figures include the capacity of
that generating plant. The total capacity associated with thermal and market purchases was
950 MW, of which Burrard plant capacity accounts for 900 MW – intended market purchases
are quite small. Interestingly, the System Capacity Supply includes 656 MW of Electricity
Purchase Agreements, excluding the Alcan LTEPA. However, “as of April 1, 2010, BC Hydro has
63 Electricity Purchase Agreements (EPAs) with IPPs whose projects are currently delivering
power to BC Hydro. These projects represent 10,343 GWh of annual supply and 2,629 MW of
capacity” (BC Hydro 2010a, p.1). Removing Alcan’s capacity from BC Hydro’s list of EPAs
reduces total available IPP capacity to 1,733 MW, a figure substantially greater than the 656
MW enumerated in the System Capacity Supply table (BC Hydro 2008a, Table 6‐14). Capacity
from Site C and the Mica upgrades appear as line items under proposed future supply, but
there is zero capacity associated with these facilities through F2028. There appears to be a
discrepancy between the amount of capacity available and the amount enumerated by BC
Hydro (2008a), something which clearly needs further investigation. The Canadian Entitlement
from the Columbia River Treaty is treated as “additional supply potential” but with zero
associated MW of capacity after fiscal 2010.
BC Hydro (2008a, Table 6‐15) also details its electricity flows over a fiscal year. As with
System Capacity Supply, the supply of electricity appears to have the same types of distortion:
underestimating the electricity from heritage hydro assets, existing EPAs and a failure to
8include the potential future electricity to be generated from Site C or the Mica upgrades.
Available Electricity
Since capacity exceeds load, theoretically and under ideal conditions British Columbia
could meet all its electricity needs from domestic supply. However, capacity and demand (load)
do not tell the whole story. A turbine’s capacity is amount of power that can be generated or
produced under normal conditions. Unlike thermal generating facilities where the fuel source is
constant, a hydroelectric facility’s output depends on water flows (as noted earlier). Hydro
electricity is generated when flowing/falling water flows propels the turbine blades. The
amount of power that can be generated from a large‐scale hydroelectric unit – consisting of a
dam, reservoir and generator(s) – depends on the quantity of water stored in the reservoir
(elevation), water inflows from rainfall or snowpack runoff, and head height. Head height is the
vertical height of the water in a reservoir above the turbine. In periods of drought, or at times
when storage conditions are unfavourable, water volume may be lower than that required to
operate the turbines at their capacity. Conversely, during periods of sufficient precipitation,
water volumes must be managed for flood control and power generation while satisfying in‐
stream uses.
The fuel the drives large‐scale hydropower generation is variable, but predictable and
controllable to some extent because of reservoirs. The disparity between installed capacity and
the actual ability to generate electricity is an issue for variable energy sources, principally run‐
of‐river hydro, tidal power, solar photovoltaic (PV) and wind. It may even be a problem for
biomass sources of energy, as the ability to generate power at full capacity depends on the
availability of sufficiently low priced wood fiber and whether biomass is backstopped by coal or
some other fuel source if wood biomass is too expensive. 6
We define the capacity factor of a generating facility as the ratio of the actual power
produced by a generator during the year to the generator’s rated capacity multiplied by the
6
Wood fiber prices depend largely on lumber production, with more fiber available as lumber
production increases, and competition for fiber by other users (pulp mills, OSB manufacturers, pellet
producers, etc.). If fiber prices are too high, biomass generating facilities will close even with lucrative
feed‐in subsidies. This issue is discussed in detail by Stennes et al. (2010) and Niquidet et al. (2010). The
most likely and sensible backup fuel would be coal, despite its high CO2 emissions.
9number of hours in one year (8760). For most base‐load, thermal power plants (including
nuclear), the capacity factor is 85 percent or more. For wind farms, the capacity factor can
reach 40 percent at almost ideal sites, but average around 18 to 20 percent in most places (Pitt
et al. 2005; van Kooten and Timilsina 2009; van Kooten 2010). Less is known about tidal
systems, but capacity factors are comparable to those of wind turbines; for solar plants,
capacity factors are also low due to clouds and nighttimes, which is particularly acute in
northern climes because power is most needed in the winter when the sun’s duration and
intensity are less. Capacity factors for run‐of‐river facilities also vary considerably from one
season to the next, unlike large‐scale hydro.
Under the Clean Energy Act, installed generating capacity will consist to a much greater
extent of assets that rely on variable energy sources and are characterized by low (and often
unknown) capacity factors. (In BC, run‐of‐river, wind and biomass appear to be the most
popular forms of IPP energy.) Even so, it remains likely that power output will exceed domestic
requirements. To the extent that external conditions (climate, environmental or economic)
affect the decision to generate electricity, British Columbia can export or import energy as
desired.
Information on power flows is collected by Statistics Canada (CANSIM), the National
Energy Board (NEB 2010a, 2010b) and BC Stats (2010). The CANSIM data are collected via a
monthly survey from provincial electricity generators. Survey respondents must provide
information on the quantity of electricity generated, the primary fuel source used in its
generation, and gross receipts and deliveries of electricity to other provinces. These are
aggregated across respondents and available in CANSIM tables 1270001 and 1270003. The
CANSIM, NEB and BC Stats data are identical, but breakdown the information differently. For
example, CANSIM provides monthly data and has information on the types of delivery (firm and
non‐firm) as well as the source or delivery point (U.S., other provinces). From the NEB data, it is
possible to determine the amount of power imported and exported for non‐revenue purposes
(i.e., ‘Treaty power’ and ancillary services/losses, etc.). BC Stats data are a summary of CANSIM
figures.
In Figure 3, we track BC electricity exports, imports and net exports (exports minus
10imports) between 1978 and 2008 using monthly CANSIM data. The data are aggregated over
the province’s fiscal year, April 1 to March 31, to provide consistency with BC Hydro
documents. The grey bars indicate net exports. Prior to 1993, BC was exclusively a net exporter.
Beginning in 1993, BC varied its position from being a net exporter to net importer and back
again on various occasions. In essence, British Columbia was exclusively a net exporter of
electricity prior to 1993 – the amount of energy leaving the province consistently exceeded the
amount entering. Between 1993 and 2008, BC was both a net importer and a net exporter of
electricity. Over the past eight years (2000 to 2008), BC was a net importer in four years (2001,
2004, 2005 and 2008) and a net exporter in four years (2000, 2002, 2003 and 2007).
Figure 3: Net exports, total exports and total imports, 1978‐2008
While the net export data from BC Stats (2010), CANSIM and the National Energy Board
(2010b) are equivalent, none of the data sources agree with the dates and volumes of net
exports from BC Hydro’s (2006) Integrated Energy Plan (IEP). The IEP states that BC Hydro was a
net importer in five of the eight years – F2001, F2002, F2003, F2004 and F2005. The
discrepancy around the net export question may be because BC Hydro generates a large
portion, but not all, of the province’s electricity. It could also be related to the accounting
measures used for BC Hydro sales to Powerex. As the electricity marketing subsidiary of BC
Hydro, Powerex is responsible for marketing BC Hydro’s surplus electricity, including the
Canadian Entitlement energy derived from the Canada‐U.S. Columbia River Treaty. Clearly, it is
important to distinguish between the net position of BC Hydro, its subsidiaries and the province
11as a whole.
The CANSIM data are the aggregation of provincial survey results. Raw data on hourly
power flows, both inter‐provincial and international, are provided by British Columbia
Transmission Corporation (BCTC) and are shown in Figure 4. The maximum available transfer
capacity (ATC), or transmission capacity, for BC to the U.S. is 3,150 MW from north to south and
2,000 MW from south to north. With respect to the transmission capacity between Alberta and
BC, the east to west capacity is 1,000 MW while the west to east ATC is 1,200 MW; however,
operating limitations within Alberta often restrict the east‐to‐west capacity to 760 MW and the
west‐to‐east capacity to 600MW. (The reasons for this are discussed in more detail below.) The
ATC limits represent the maximum power that can flow along the transmission interties.
In Figure 4, the lighter line shows aggregated monthly flows between Alberta and BC,
while the darker line provides the aggregated monthly flows along the BC‐U.S. intertie. The
aggregation masks the true volatility of the power flows. Imports are indicated by negative
values and exports with positive ones. The raw data are from the BC Transmission Corporation
(BCTC). Trends in the intertie data appear to be consistent with information from Statistics
Canada and the NEB. BC was net exporter to Alberta and a net importer from the U.S. in 2008
and 2009, but a net exporter to both jurisdictions in 2007. The explanation for this import and
export pattern is likely the result of variation in electricity prices in the adjacent markets and
the revenue maximizing behavior on the part of British Columbia, as discussed in the next
section. However, it is important to note that discrepancies of the sort discussed above may
be a function of how BC Hydro and Powerex account for internal transfers and forward trades.
121,500
net exports
1,000
500
GWh
0
net imports
‐500
‐1,000
Jan‐08
Jan‐09
Jan‐06
Jan‐07
Jan‐03
Jan‐04
Jan‐05
Jan‐99
Jan‐00
Jan‐01
Jan‐02
Jul‐09
Jul‐07
Jul‐08
Jul‐04
Jul‐05
Jul‐06
Jul‐01
Jul‐02
Jul‐03
Jul‐99
Jul‐00
US Flows Alberta Flows
Figure 4: BC imports and exports of electricity along transmission interties with Alberta and the
U.S. Pacific Northwest, January 1999 through July 2009
Net Revenues Associated with Exports and Imports
Alberta is likely the electricity industry’s bellwether; the absence of regulation allows
the market to act unencumbered. While operating with fully deregulated wholesale (and retail)
energy markets, Alberta has already integrated over 600 MW of wind energy. The effect of this
high wind penetration has been to increase the volatility of wholesale market prices. As the
market price in Alberta rises, there is greater value to generating electricity (i.e., installing
added capacity), including, importantly, renewable capacity.
Given the desire across North America to reduce CO2 emissions associated with fossil
fuel generation of power, particularly generation from coal, there may be increased
opportunities for lucrative exports of clean energy to the U.S. U.S. renewable energy policies
have left many jurisdictions supply constrained, resulting in higher prices. The restrictive
conditions on the types of energy these states are permitted to import may benefit British
Columbia because of its predominantly hydroelectric generation portfolio. As a result of its
excess capacity, BC continues to be in a position to take advantage of higher prices in adjacent
markets. Fundamentally, BC must decide at which price point it is economically beneficial to
produce power for export; it must also determine at what price point it reduces domestic
13production and meets domestic load by purchasing power from another jurisdiction. As prices
rise in adjacent markets, BC will need to increase its capacity to leverage its naturally long
position.
British Columbia exports and imports electricity from the United States and Alberta, and
receives or pays the prevailing market price. In general, Alberta prices are determined by the
Alberta Electric System Operator (AESO) on an hourly basis as a result of supply and demand. In
the U.S., the price of electricity is determined at the Mid‐Columbia (Mid‐C) trading hub. BC
Hydro sells ‘excess’ power to Powerex under the Transfer Price Agreement, which guarantees
BC Hydro the Mid‐C price. The Mid‐C price is an index based on bilateral trades. Electricity
markets in California as well as Palo Verde, Meade and the Four Corners affect the market price
at Mid‐C because electricity flows to the highest priced region. In the absence of transmission
constraints, electricity prices would be equalized throughout the Western Electricity
Coordinating Council (WECC). However, transmission constraints are prevalent throughout the
Western provinces and states. Differences in the average electricity prices between Alberta and
Mid‐C provide evidence of this discontinuity in electricity flows, as indicated in Figure 5.
Figure 5: Average electricity prices in Alberta and at Mid‐Columbia, 2000‐2009
Differences in prices are a key factor explaining BC’s import and export pattern. For
14example, in 2008 Alberta’s prices were high (Figure 5) and BC’s net export position with that
province was positive (BC was a net exporter of power); but BC was a net importer of energy
from the U.S in the same year. There are times when it is prudent for BC to purchase electricity
from its neighbours in Alberta and the U.S. Pacific Northwest because the price is low; other
times, it will be lucrative to export energy to those areas. The price point that triggers imports
and exports depends on the relative internal cost of producing electricity. According to the BC
Hydro (2006), from 2001 to 2005 BC Hydro was a net importer of electricity, because “market
purchases were economic to serve domestic requirements when compared to greater use of
Burrard or greater drawdown of major reservoir” (BC Hydro 2006, p.3‐7). An increase in imports
is not indicative of an inability to meet load with domestic assets, but, rather, should be
interpreted as prudent use of assets from a financial perspective – import prices were low
relative to the cost of domestic generation.
In Figure 6, we plot Alberta electricity prices and power flows along the Alberta‐BC
transmission intertie. There is clear evidence of a strong correlation between the two series: as
the price of electricity in Alberta rises, BC sends more energy along the intertie. This strongly
suggests that BC acts as a revenue maximizing entity. Interestingly, the same pattern does not
emerge when one compares Mid‐C prices and flows along the BC‐U.S. intertie. One reason for
this may be that BC‐generated electricity is primarily designed to meet demand in California, in
which case the California/Oregon Border (COB) price is relevant. That is, the price dynamics at
Mid‐C may not capture the true value of BC power exports to the U.S.
15Figure 6: Hourly pool prices for Alberta electricity (dark line) and the power flows (grey line)
along the Alberta‐BC Intertie
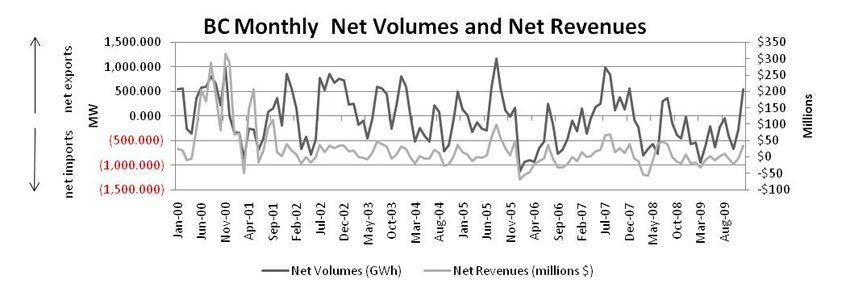
In Figure 7, we plot British Columbia’s net exports of electricity and net revenues using
CANSIM data from the NEB (2010b). BC has been both a net importer and exporter of power.
The graph indicates that, in periods when net imports were large, net payments were often
quite small, indicating that there was an economic rationale for imports. In December 2000, BC
was a net importer a small amount of energy (< 1 GWh), but it received over $288 million in net
revenues that month. Export volumes in December 2000 were nearly identical to import
volumes (577.09 GWh vs. 578.04 GWh), but export revenues were four times larger than
import revenues ($387 vs. $99 million). A similar situation where net revenues were positive
while net exports of electricity were negative occurred in 21 months over the past nine years of
NEB data. The differences between power flows along interties and electricity revenues may be
explained by the province’s net export profile.
Figure 7: Monthly net electricity exports (dark line) and net revenues from sales/purchases of
electricity (grey line), British Columbia, 2000‐2009
Net Export Profile
Under the presumption that BC is using its storage capacity to maximize revenues, it is
expected that BC imports would occur during low price periods – during low demand hours –
and that BC would export during peak daytime hours when prices are high. In Figure 8, we
16provide an average of the hourly flows along the two transmission interties for selected years
(2000, 2001, 2008 and 2009). Negative values indicate a net import position, while positive
values represent exports. Due to the aggregation of both positive and negative values, some
information has undoubtedly been lost. Nonetheless, the general trends are indicative of
provincial import and export behaviour.
Net exports to Alberta increased from 7 am (HE 7) to 10 pm (HE 22) which corresponds
to Alberta’s peak demand hours. During Alberta’s off‐peak hours, BC is importing. Overall, BC
tends to be a net exporter to Alberta (Figures 5 and 6), but it is generally a net importer relative
to the United States (Figure 5). Yet, BC appears to be practicing the same revenue maximizing
strategy with respect to the U.S. market as imports are relatively larger during off‐peak hours
and during peak times, when they fall.
Figure 8: Annual average hourly flows along the BC‐Alberta and BC‐U.S. Interties, selected years
17British Columbia’s export pattern varies depending on the market and capacity of the
transmission interties. The east‐west relationship is diurnal. It is expensive for Alberta’s coal‐
fired power plants to ramp down at night only to ramp back up a few hours later. Although
some ramping does take place, the assets in question prefer to sell power to BC, even at low
prices, to avoid the costs of tracking nighttime load downwards. BC takes advantage of low
Alberta prices at nighttime by importing excess power, saving water for future electricity
generation. In the daytime, when prices are higher in Alberta, BC exports power thereby
increasing its revenues. This pattern has existed since 2000. Even if the amount exported is less
than what is imported, the higher price of exports relative to imports results in an overall
advantage to British Columbia. For this reason, Alberta has been reluctant to increase the
capacity of its infrastructure to enable the trade to take place at the rated capacities of the
intertie. We discuss this further in the next section.
With respect to the U.S. markets, it is important to recognize that BC exports and
imports of electricity are small relative to the overall size of the market. The export‐import
relation is less diurnal (as was the case with Alberta) than it is seasonal. During winter, BC
requires more electricity for heating (because it is colder) and lighting (because it is dark
longer). Further south, principally in California, Arizona and Nevada, the demand for electricity
is lower than during summer because heating needs are not onerous and the summer‐winter
contrast between daylight and night time is less pronounced. Hence, there is less demand for
electricity in winter than summer while demand in BC (and much of the northern states in the
WECC system) is higher. During summer (July, August, September), BC requires less electricity,
but demand is high in the United States, mainly for air conditioning. Therefore, we would
expect BC to export power (or import less) during summer. This pattern is confirmed in Figure
9, where we observe that BC is generally a net importer of electricity from the United States in
the winter and spring, and a net exporter in the summer and sometimes fall. Notice that BC
does import electricity from the U.S. some summers (2001, 2006, 2009), but the amount is
much less than what is imported at other times of the year (except if imports continue into the
fall). Compared to years when electricity is exported in summer, imports are much smaller.
183,000
net exports
2,000
1,000
GWh
0
‐1,000
net imports
‐2,000
‐3,000
2000 2001 2002 2003 2004 2005 2006 2007 2008 2009
Winter (Jan Feb Mar) Spring (Apr May June) Summer (July Aug Sep) Fall (Oct Nov Dec)
Figure 7: Historic seasonal volumes on the U.S. transmission intertie
Not included in the discussion of the exchange between the U.S. and British Columbia is
the issue of Columbia Treaty power that is generated in the United States but attributed to BC.
Discussion
It would appear as though the province of British Columbia currently has sufficient
generating capacity to meet its demand for electricity, including peak load needs. This excess of
capacity over load is expected to continue for the next several years at least, even without the
addition of new generating capacity. The construction and operation of the Clean Power Call
selected proposals, upgrades to existing facilities and the Site C project will further increase the
gap between capacity and forecasted peak load. As that gap grows BC will be in the position to
export increasingly larger volumes of energy to adjacent markets.
There is also no reason to believe that domestic load will and should be met entirely by
domestic generation. Indeed, it may be financially beneficial for British Columbia to import
electricity when prices in other markets are low relative to the internal opportunity cost of
generating electricity. Likewise, when market prices in adjacent markets are high, it makes
economic sense to export electricity. These exports and imports are over and above transfers
required to enable other system operators to stabilize the overall WECC grid.
There are several issues that need to be considered. First, the policymaker needs to
19know BC’s internal cost of generation and the shadow prices of storing water behind dams for
future release and power generation if the financial benefits of exchange are to be maximized.
The non‐market benefits are a separate issue, but mainly relate in‐stream requirements and to
CO2 emissions. We consider the former but not the latter.
It is not clear whether British Columbia is importing coal‐generated power from Alberta
during off‐peak hours, or that it will continue to do so in the future. The story told in the
previous section about the expense of having coal‐fired generators ramping down to track
nighttime load is likely correct. Currently, it would appear that BC imports electricity from
Alberta that is generated using coal, implying has high CO2 emissions. However, there may be
little environmental benefit should BC decide to stop power imports for that reason, 7 while
there might well be a large loss in revenues. Suppose BC stopped purchasing nighttime power
from Alberta. This would require substituting Alberta electricity with that generated by existing
hydro assets, or some other source (perhaps biomass). This does not mean that Alberta reduces
its emissions of CO2 on a one‐for‐one basis. Alberta’s coal generators are likely to continue
operating, burning fossil fuel, but not dispatching electricity to the grid. In that case, BC’s action
has done nothing to reduce the two province’s overall CO2 emissions and may even increase
overall emissions, which would clearly be the case if the substitute power were produced from
biomass (see Searchinger et al. 2009). Thus, this strategy needs to be carefully thought out if
one objective is to address climate change concerns. There is likely little to be gained and a lot
to lose by putting a stop to a profitable exchange of electricity.
But there is another problem that BC policymakers might need to address. As noted
earlier, Alberta’s decision makers appear reluctant to increase the capacity of the transmission
lines between Alberta and BC, focusing instead on enhancing the transmission capacity
between southern and northern regions of the province and construction of a transmission
intertie into the U.S. grid through Montana. Alberta has invested in more than 600 MW of wind
capacity and plans to increase this further. Although BC is the logical place to store wind‐
generated power, this does not seem to register on the Alberta side. The increase in north‐
7
The Clean Energy Act implies that BC clean energy will displace “electricity generated by hydrocarbon‐
based fuel sources such as coal” (p. 1).
20south transmission capacity is one way in which Alberta is seeking to benefit from greater wind
power. But this does not get around the problem of intermittency that storage can address (see
Scorah et al. 2010; van Kooten 2010; Pitt et al. 2005). And unless the problem of intermittency
is addressed, Alberta cannot reduce its reliance on coal‐fired power.
Alberta can avoid the intermittency associated with wind and yet reduce coal‐fired,
base‐load capacity by combining large‐scale wind farms with fast‐responding gas plants that
employ the latest technology to reduce the costs associated with frequent stops and starts.
(Such a facility would also supply peak load.) A combined wind‐gas plant might produce
electricity at higher costs and with greater emissions of CO2 than a wind‐hydro alternative, but
it will certainly produce less CO2 than a coal plant providing the same power output. However,
research is required to determine the associated costs and benefits, including environmental
costs and benefits, of such base‐load facilities.
It is not clear why Alberta appears to be choosing the wind‐gas option over the wind‐
hydro alternative, but it might see that it is at a disadvantage in its dealings with BC. Because
power output from wind farms tends to be greater at night than during the day, BC would
continue to be able to exploit the diurnal relation that it now enjoys, but to an even greater
extent if a higher‐capacity transmission link were to be built. Unless British Columbia is willing
to share some of this windfall rent, Alberta’s actions appear justified. Alberta will continue to
replace coal‐fired capacity with wind‐gas, while enhancing intra‐province transmission to take
advantage of the best wind sites. Unless it is willing to bargain with Alberta, BC could lose out
on an opportunity to generate large windfall revenues while, at the same time, reduce overall
CO2 emissions. After all, the BC government (2010) intends “to work in partnership with
renewable power producers to actively seek opportunities to sell clean, reliable electricity to
neighbours in Canada and the U.S.”
With regard to the transfer of power between BC and the U.S. Pacific Northwest, clean
energy from BC would likely displace natural gas generators not coal units. Although the
portfolio used to generate energy moving to the Mid‐C hub is larger and more complex, the fuel
at the margin is typically natural gas. It is the marginal unit that would be affected by BC clean
energy exports.
21It is not clear, therefore, that so‐called clean energy exports from BC will displace ‘dirty’
energy in an adjacent market, as required under the Clean Energy Act. Indeed, it might even be
the case that exports of BC clean energy displace another form of renewable energy, or that
they simply result in wasted energy. Clearly, before BC embarks on a trajectory that makes it a
major exporter of clean power, some serious research needs to be undertaken to determine
the overall financial and environmental costs.
22References
BCUC, 2008. British Columbia Hydro and Power Authority: A Filing of Electricity Purchase
Agreement with Alcan Inc. As An Energy Supply Contract Pursuant To Section 71
Decision, January 29, 2008 accessed from
http://www.bchydro.com/etc/medialib/internet/documents/info/pdf/info_2007_electri
city_purchase_agreement_dated_august_13.Par.0001.File.info_2007_electricity_purcha
se_agreement_dated_august_13.pdf
BC Hydro, 2010a. About Independent Power Projects accessed from
http://www.bchydro.com/etc/medialib/internet/documents/planning_regulatory/acqui
ring_power/2010q2/20100401_ipp_supply0.Par.0001.File.20100401_IPP_Supply_List.p
df
BC Hydro, 2010b. Clean Power Call Selected Projects accessed from
http://www.bchydro.com/planning_regulatory/acquiring_power/clean_power_call/sele
cted_proposals.html
BC Hydro, 2008a. Long Term Acquisition Plan accessed from
http://www.bchydro.com/planning_regulatory/long_term_electricity_planning/2008_lt
ap.html
BC Hydro, 2008b. Load Forecast accessed from
http://www.bchydro.com/etc/medialib/internet/documents/planning_regulatory/meeti
ng_demand/Electric_Load_Forecast_2008.Par.0001.File.Electric_Load_Forecast_2008.p
df
BC Hydro, 2006. Integrated Energy Plan accessed from
http://www.bchydro.com/planning_regulatory/long_term_electricity_planning/past_pl
ans/2006_iep.html
BC Stats, 2010. http://www.bcstats.gov.bc.ca/data/bus_stat/busind/trade/trade‐elec.asp
British Columbia Transmission Corporation, 2010a. BCTC Tie Flows accessed from
http://www.bctc.com/transmission_system/actual_flow_data/
British Columbia Transmission Corporation, 2010b. Control Area Load accessed from
http://www.bctc.com/transmission_system/balancing_authority_load_data
CANSIM (Canadian Socio‐Economic Information Management System) Data Tables 1270001
and 1270003 access from web.uvic.ca/library
FortisBC, 2009. Resource Plan accessed from
http://fortisbc.com/downloads/about_fortisbc/rates/other_applications/2009resourcep
lan/FortisBC%202009%20Resource%20Plan.pdf
Government of British Columbia, 2010. Clean Energy Act Backgrounder‐ Pursuing Export
Opportunities accessed from
http://www.mediaroom.gov.bc.ca/DisplayEventDetails.aspx?eventId=490
National Energy Board, 2010a. Electricity Export Authorizations accessed from
http://www.neb.gc.ca/clf‐nsi/rnrgynfmtn/sttstc/lctrctyxprtmprt/lctrctyxprtmprt‐
eng.html
National Energy Board, 2010b. Electricity Import Export Tables accessed from
http://www.neb.gc.ca/clf‐nsi/rnrgynfmtn/sttstc/lctrctyxprtmprt/lctrctyxprtmprt‐
eng.html
23Niquidet, K., B. Stennes and G.C. van Kooten, 2010. Bio‐energy from Mountain Pine Beetle
Timber and Forest Residuals: The Economics Story. Submitted to Biomass & Bioenergy.
Pitt, L., G.C. van Kooten, M. Love and N. Djilali, 2005. Utility‐Scale Wind Power: Impacts of
Increased Penetration: Paper No. IGEC‐097 in Proceedings of the International Green
Energy Conference, 12‐16 June, Waterloo, Ontario, Canada.
Searchinger, T.D., S.P. Hamburg, J. Melillo, W. Chameides, P. Havlik, D.M. Kammen, G.E. Likens,
R.N. Lubowski, M. Obersteiner, M. Oppenheimer, G.P. Robertson, W.H. Schlesinger, G.D.
Tilman, 2009. Fixing a Critical Climate Accounting Error, Science 326(23 October): 527‐
528.
Stennes, B., K. Niquidet and G.C. van Kooten, 2010. Implications of Expanding Bioenergy
Production from Wood in British Columbia: An Application of a Regional Wood Fibre
Allocation Model, Forest Science In press.
Scorah, Hugh, Amy Sopinka and G. Cornelis van Kooten, 2010. The Impact of Potential Drought
on Power Generation, Electrical Grid Stability and Renewable Wind Power in British
Columbia and Alberta. Submitted to Energy Economics.
van Kooten, G. C., 2010. Wind Power: The Economic Impact of Intermittency, Letters in Spatial
& Resource Sciences 3: 1‐17.
van Kooten, G.C. and G.R. Timilsina, 2009. Wind Power Development: Economics and Policies.
Policy Research Working Paper 4868. Washington, DC: The World Bank, Development
Research Group, Environment and Energy Team. March. 32pp.
24You can also read