Proton range verification with MACACO II Compton camera enhanced by a neural network for event selection
←
→
Page content transcription
If your browser does not render page correctly, please read the page content below
www.nature.com/scientificreports
OPEN Proton range verification
with MACACO II Compton camera
enhanced by a neural network
for event selection
Enrique Muñoz1*, Ana Ros1, Marina Borja‑Lloret1, John Barrio1, Peter Dendooven2,3,
Josep F. Oliver1, Ikechi Ozoemelam2, Jorge Roser1 & Gabriela Llosá1
The applicability extent of hadron therapy for tumor treatment is currently limited by the lack of
reliable online monitoring techniques. An active topic of investigation is the research of monitoring
systems based on the detection of secondary radiation produced during treatment. MACACO, a
multi-layer Compton camera based on LaBr3 scintillator crystals and SiPMs, is being developed
at IFIC-Valencia for this purpose. This work reports the results obtained from measurements of
a 150 MeV proton beam impinging on a PMMA target. A neural network trained on Monte Carlo
simulations is used for event selection, increasing the signal to background ratio before image
reconstruction. Images of the measured prompt gamma distributions are reconstructed by means of
a spectral reconstruction code, through which the 4.439 MeV spectral line is resolved. Images of the
emission distribution at this energy are reconstructed, allowing calculation of the distal fall-off and
identification of target displacements of 3 mm.
Hadron therapy is a growing technique that has been employed to treat over 350,000 cancer patients worldwide1.
The reason for its increasing importance is its beneficial dose deposition profile, which enables highly focalised
treatments and better sparing of the surrounding healthy tissue. However, the high concentration of the deliv-
ered dose at the Bragg peak makes hadron therapy very sensitive to any source of deviation from the treatment
planning or to uncertainties in the plan itself. As a consequence, additional safety margins of several millimeters
are set in the treatment planning in order to ensure that the clinical volume target receives the prescribed dose
and that organs at risk are not irradiated2. The reduction of safety margins would allow a better delineation of
the irradiated volume and a wider use of hadron therapy in tumors close to organs at risk. This can be achieved
by monitoring online the particle range inside the patient.
Online monitoring can be realized by detecting the secondary radiation emitted along the beam path. Sec-
ondary particles are produced in the de-excitation of nuclei and nuclear fragments formed in the interactions
between the beam and the irradiated tissue. Positron Emission Tomography (PET) has already been used clini-
cally to monitor the distributions of β+ emitters generated during i rradiation3–5. However, PET imaging presents
some intrinsic drawbacks: displacement of β + emitters due to biological washout, delayed signal with respect
to irradiation time due to the half-lives of the most abundant β + emitters and the high background of prompt
emissions6,7. In addition, PET imaging devices must be adapted for in-beam imaging, requiring a dedicated
design to integrate the scanner with the b eam8. To overcome the delayed emission and displacement caused
by washout, PET imaging of very short-lived β + emitters is currently under investigation9–11. Alternatively, the
prompt emission of high energy photons or prompt gamma-rays (PG), which do not suffer from the mentioned
drawbacks, can also potentially be used for online v erification12,13.
The PG emission spectrum exhibits a decreasing continuum, extending up to several MeV, with the presence
of prominent lines corresponding to discrete transitions between nuclear energy levels14. In particular, an intense
peak of emission is found at 4.439 MeV, originating from the de-excitation of 12C to its ground state. During
irradiation, the excited state of 12C is produced following inelastic proton scattering off 12C and proton induced
spallation of 16O15, both of which are relatively abundant in human tissues. The cross section of the involved
1
Instituto de Física Corpuscular (IFIC), CSIC/Universitat de València, València, Spain. 2KVI‑Center for Advanced
Radiation Technology, University of Groningen, Groningen, The Netherlands. 3Department of Radiation Oncology,
University Medical Center Groningen, University of Groningen, Groningen, Netherlands. *email: Enrique.Munoz@
ific.uv.es
Scientific Reports | (2021) 11:9325 | https://doi.org/10.1038/s41598-021-88812-5 1
Vol.:(0123456789)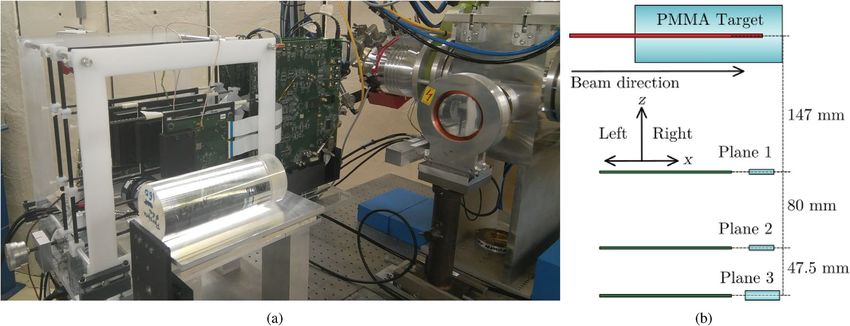
www.nature.com/scientificreports/
Total True signal Background Percentage of true signal (%)
Events before selection 6.1 · 105 4.7 · 104 5.6 · 105 7.6
NN selected events 3.8 · 105 3.9 · 104 3.4 · 105 10.3
Table 1. Signal and background events in the validation set before and after NN selection.
nuclear reactions have a maximum at low proton energies16. As a consequence, the emission distribution of PG at
this energy presents a peak of intensity near the end of the beam range and can be correlated to the delivered dose.
Several monitoring techniques based on the detection of PG are currently under investigation. Mechanical
collimation has been proposed with different collimator g eometries17–20. Clinical tests with a collimated gamma
camera have also been r eported21. However, a disadvantage of this modality is the collimator thickness required
to fully absorb the high energy PG, which reduces drastically the detection efficiency. Other methods based
on measuring the PG time of flight distribution, correlated to the ion range inside the patient, are also being
investigated22,23. A review of the state of the art in hadron therapy monitoring through PG can be found in24.
Another imaging modality currently under study for treatment monitoring is based on electronic collimation.
Compton imagers have emerged as a promising candidate due to their ability to image photons at the PG energy
range and the fact that they do not require mechanical collimation. Compton cameras are also being investigated
for Single Photon Emission Computed Tomography (SPECT) with high e fficiency25–27. In Compton imaging,
the initial energy of a measured photon must be known in order to constrain its origin to a conical surface
containing its emission position. To deal with the polychromatic nature of the PG spectrum, Compton imaging
can be achieved by detecting three-interaction events, which allow reconstruction of the initial energy photon
energy28,29. If only two-interaction events are detected, images can be reconstructed by selecting well-known PG
emission lines, requiring full energy absorption in the second interaction or employing spectral reconstruction
methods to estimate both the spatial and the spectral emission distribution30–32. Different Compton camera
prototypes and reconstruction methods have been designed for this purpose33–38. To the end of reconstructing
the measured activity distribution by means of a Compton camera, the background component in the measured
data must be taken into account. Event selection for background reduction is usually employed in Compton
imaging, both in its application to astronomy39 and to medical imaging40. Event selection is of great importance
in PG reconstruction for hadron therapy monitoring, since high intensity clinical beams can lead to an increase
of random coincidences produced by different incoming p articles41. In addition to photons, a high background
of neutrons and protons can reach the detectors, triggering the acquisition of unwanted events that contaminate
the true signal.
At IFIC-Valencia, the MACACO (Medical Applications CompAct COmpton camera) prototype is being
developed for the purpose of hadron therapy online treatment monitoring. It is a three-plane Compton camera
based on LaBr3 crystals coupled to silicon photo-multiplier (SiPM) a rrays42. The first prototype was previously
fully characterised and tested in the laboratory with a variety of s ources43 and in-beam44,45. The promising results
obtained with the first version led to the development of MACACO II, a second prototype with enhanced energy
resolution46. This paper presents the results obtained in-beam with MACACO II operated with two detector
planes and using a spectral method to estimate the PG energy. The experiment was conducted at the irradiation
facility of the AGOR cyclotron at KVI-Center for Advanced Radiation Technology, University of Groningen. A
Polymethyl methacrylate (PMMA) target placed at different locations with respect to the camera was irradiated
by a 150 MeV proton beam.
In this paper, a fully connected neural network (NN) is employed for event selection. NNs have been pre-
viously applied to identification of sequence ordering in a multi-layer Compton telescope47. In this work, the
implemented NN is trained to discriminate signal from background events, and a simulation study is performed
to demonstrate that this discrimination improves identification of the PG peak of emission. Finally, the trained
NN is used for background reduction in the experimental data. Images are reconstructed using a spectral recon-
struction method for two-plane Compton cameras32, with particular emphasis on the 4.439 MeV PG emission
line. The reconstructed images and profiles are presented, demonstrating the system capability of detecting
range shifts of 3 mm.
Results
Event selection with simulated data employing a neural network. The event selection procedure
is performed by means of a NN, described in the event selection subsection of the methods section. A total of
1.2 · 106 events were obtained from Monte Carlo simulations using G ATE48, labeled as true signal or background
events as explained in the simulations subsection. The simulated dataset was divided into two equally sized
training and validation sets with 6.1 · 105 events each. The NN parameters are optimized with the training data-
set, and the validation dataset is then used to analyse the NN performance. The percentage of true signal and
background events in the validation set before and after event selection by the trained NN is shown in Table 1.
Events in the validation set are selected by the trained NN with a recall (percentage of the total true signal cor-
rectly classified) of 84.0% and a precision (percentage of true signal over the accepted events) of 10.3%, improving
the percentage of signal from the original 7.6% registered in the raw data. This constitutes a relative increase of
35.4% in the ratio of signal events, which has an important effect in the reconstructed images.
Images of the photon emission distribution produced by the simulated proton irradiation have been recon-
structed using three different sets of data extracted from the validation set: only true signal, all events and events
selected by the NN. The images obtained at the energy of 4.4 MeV are shown in Figs. 1a,b,c. The longitudinal
Scientific Reports | (2021) 11:9325 | https://doi.org/10.1038/s41598-021-88812-5 2
Vol:.(1234567890)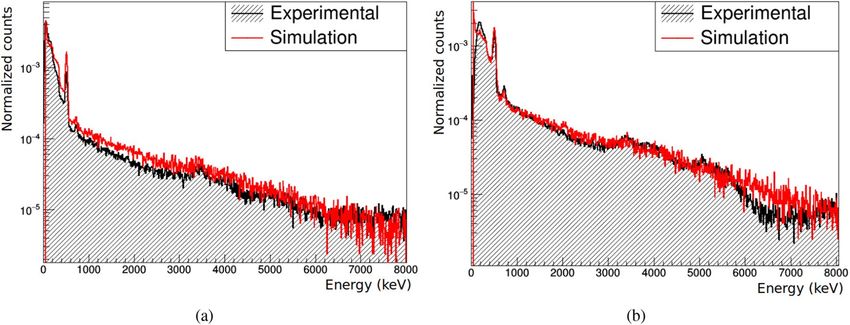
www.nature.com/scientificreports/

                                  Figure 1.  Reconstructed images at 4.4 MeV using three different simulated data sets: only true signal events
                                  (a), all events (b) and events selected by the trained NN (c). (d) Line profiles along the beam direction from
                                  the above images. (e) Transverse line profiles at the maximum position. (f) Energy spectra recovered after
                                  integration over the reconstructed image spatial domain.

                                                                               Signal events       All events         NN selected
                                   Relative Max, R80 and R50 positions (mm)    –                   –44.8 –41.3 13.1   3.0 4.1 11.1
                                   Relative value at true peak position        1                   0.83               0.98
                                   Relative average background value           (6.3 ± 9.6) ·10−3   0.24 ± 0.15        0.18 ± 0.10
                                   Contrast-to-noise ratio                     100                 4.0                7.7
                                   FWHM in transverse beam direction (mm)      19.6 ± 0.8          63 ± 3             47 ± 2
                                   Reconstructed energy peak (MeV)             4.4 ± 0.4           4.8 ± 1.2          4.3 ± 0.7

                                  Table 2.  Studied parameters of the reconstructed images with the three simulated datasets.

                                  profiles along the beam direction are plotted in Fig. 1d, where the reconstructed emission peaks can be identified.
                                  Different parameters have been calculated from the reconstructed images in order to assess the effect of the event
                                  selection technique (see the image assessment and range estimation subsection). The calculated parameters are
                                  listed in Table 2. All the parameters obtained with NN selected events improve with respect to those obtained with
                                  all events. The peak height and position along the beam direction are calculated relative to the values obtained
                                  using only signal events. As seen from Fig. 1d, the maximum peak position using all events is displaced by 45 mm,
                                  while the deviation obtained from the selected events is reduced to 3 mm. In the transverse beam direction, the
                                  full with at half maximum (FWHM) is also reduced with this dataset, showing a better reconstruction of the
                                  beam lateral spread. This can be seen in Fig. 1e, where the transverse profiles from the three datasets are plot-
                                  ted. The image reconstructed with selected events also assigns a higher value at the true peak position, and the
                                  background voxels outside the region of interest have lower average value and standard deviation. This results
                                  in an enhanced contrast-to-noise ratio (CNR), improving from 4.0 to 7.7. Finally, the reconstructed energy
                                  spectra in the three cases are also plotted in Fig. 1f. In this plot, a better identification of the 4.4 MeV line is also
                                  obtained with the NN selected events. Gaussian fits to the peaks around this energy yield a mean and sigma of
                                  4.3 ± 0.7 MeV when NN selected events are used, improving from the 4.8 ± 1.2 MeV calculated with all events.
                                  The R2 coefficients of determination of these fits range from 0.9798 to 0.9947.

Scientific Reports |   (2021) 11:9325 |                      https://doi.org/10.1038/s41598-021-88812-5                                                  3

                                                                                                                                                    Vol.:(0123456789)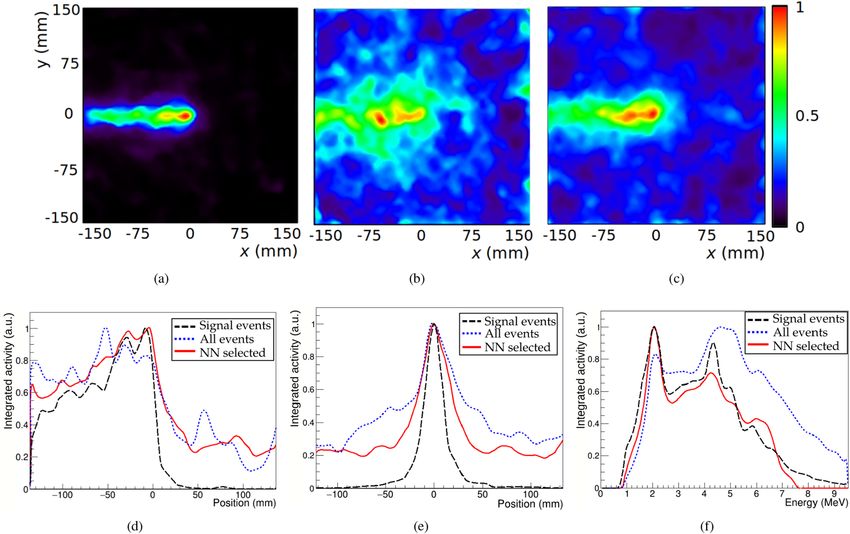
www.nature.com/scientificreports/
Figure 2. Reconstructed image from measurement at position 0. (a) Image integrated over the whole spectral
domain. (b) Image obtained at the energy slices of 4.4 MeV. (c) Line profiles along the beam direction from
the above images: whole energy range (black dashed line) and 4.4 MeV (red solid line). (d) Energy Spectrum
recovered after integration over the reconstructed image spatial domain.
Reconstructed images with experimental data. Images of the distribution of photons generated by
the proton beam irradiation of a PMMA target placed at different positions with respect to the prototype have
been reconstructed. An initial measurement was performed with high statistics in time coincidence to obtain a
detailed reconstruction of the PG emission distribution profile. In addition, six more measurements at different
positions were performed aimed at the identification of shifts in the Bragg peak location. In order to emulate
shifts in the Bragg peak without altering the beam parameters, measurements were taken with the target at dif-
ferent positions with respect to the system. Data were taken with target displacements of ±2, ±5 and ±25 mm
along the beam direction, with a precision of ±5 µm. The measurement time was 2 hours for the initial measure-
ment and 35 minutes for each of the six measurements at different positions.
The NN trained in the previous simulation study was also employed for event selection in the experimen-
tally measured data. The number of events used for image reconstruction, after selection with the NN, was
13.9 · 104 events for the 0 mm position and (4.11 ± 0.07) · 104 on average for the six measurements with target
displacements.
Images reconstructed from the measurement with higher statistics (position 0) are shown in Fig. 2. Figure 2a,b
show the spatial distributions obtained after integration over the whole spectral domain and at 4.4 MeV, cal-
culated by integrating the reconstructed image between 4.3-4.5 MeV. The reconstructed spectrum is plotted in
Fig. 2d. This spectrum is obtained after integration of the spatial domain in the reconstructed images, and repre-
sents the emission activity of PG estimated from the data employed for reconstruction. As in the reconstructed
spatial images, this estimation is contaminated by the background present in the measured dataset. Nevertheless,
a local maximum can be appreciated at 4.4 MeV. The peak at 2.2 MeV corresponds to the line produced by the
de-excitation of deuterium after neutron capture by hydrogen. Since this distribution is not correlated to the
primary proton range24, it is not expected to contain usable beam information, and it has not been employed in
this work for the determination of target shifts. The 2.2 MeV line is the main contribution to the high background
in the image integrated over the whole energy range. A region of higher activity at the expected peak position
can be seen in this image, but the wide spread of intensity over the whole image makes it difficult to estimate
Scientific Reports | (2021) 11:9325 | https://doi.org/10.1038/s41598-021-88812-5 4
Vol:.(1234567890)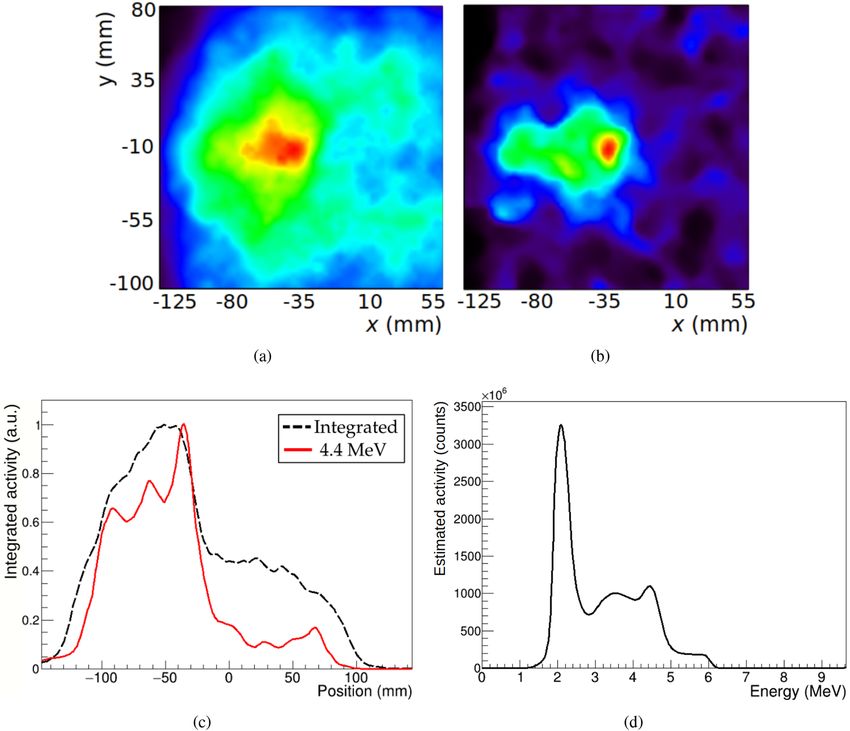
www.nature.com/scientificreports/
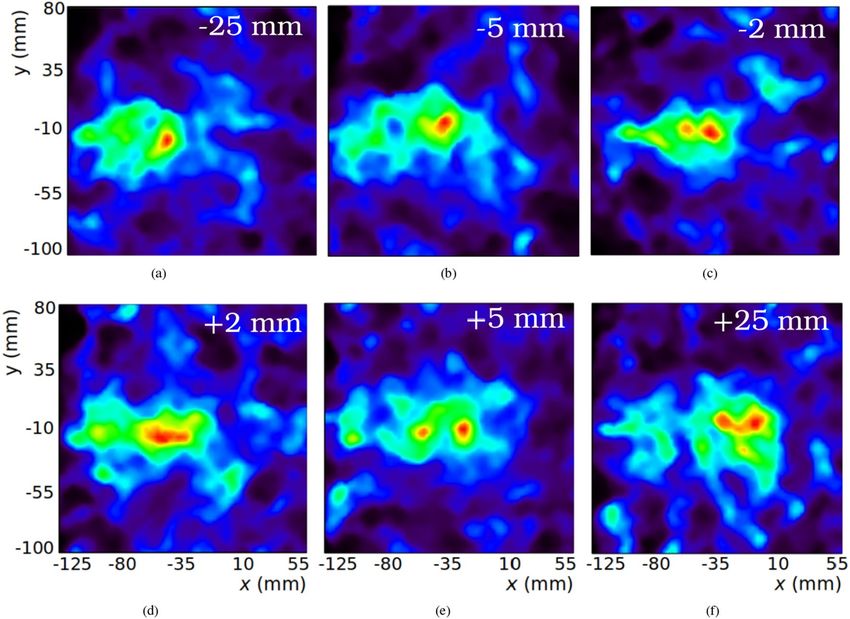
Figure 3. Reconstructed images at 4.4 MeV at 6 different target positions. Top row, from left to right: target at
–25 (a), –5 (b) and –2 mm (c). Bottom row, from left to right: target at +2 (d), +5 (e) and +25 mm (f).
the beam range from it. The beam direction and range are much better defined in the 4.4 MeV image, where the
emission intensity increases steadily until reaching a peak, after which the intensity quickly drops. This can be
better appreciated in the longitudinal profiles plotted in Fig. 2c.
The reconstructed spatial images corresponding to target displacements at the energy of 4.4 MeV are shown
in Fig. 3. Since these measurements have lower statistics than the previous one, the images obtained are noisier,
leading to local peaks in the reconstruction. Nevertheless, the emission distribution along the beam direction, as
well as a peak of intensity at the end of the beam range, can be seen in all cases. The calculated lateral spread of
the reconstructed beam in these figures is 46 ± 3 mm FWHM on average, degraded from the 35 ± 1 mm obtained
from the reference image with higher statistics. These images also present a higher background level, causing the
CNR to be degraded from 6.9 in the reference image to 5.7 ± 0.3 for the six displaced positions. Regarding the
reconstructed emission spectra, the reconstructed peak position was 4.5 ± 0.4 MeV on average, demonstrating
that the PG emission line at 4.4 MeV can also be recovered from these measurements.
In order to estimate the range from the different images, the position of the maximum of the reconstructed
photon emission distribution and the positions at R80 and R50 after the maximum are calculated. These features
are obtained from the longitudinal profiles along the beam direction, plotted in Fig. 4. Figure 4a,b plot together
the longitudinal profiles obtained from measurements in which the PMMA target was shifted to the left (–25, –5
and –2 mm) and right (+2, +5 and +25 mm) of the central position, respectively. From all profiles, it can be seen
that the distal edge is shifted in agreement with the displacement of the target along the beam direction. Relative
displacements at the different target positions have been quantified taking as a reference the values obtained for
each of the three parameters (maximum, R80 and R50) at position 0. These values at position 0 are –35.7 mm
for the maximum peak, –29.9 mm for R80 and –23.4 mm for R50. Considering these relative displacements, the
best results are achieved using the R80 parameter, with an average relative deviation from the expected values of
3.4 mm (2.2 mm if we consider only the central positions, with target displacements between –5 and 5 mm). The
average relative deviations from the expected values obtained using the other two parameters is 6.2 mm for the
maximum peak and 5.5 mm for R50. All the parameters calculated for each of the images are listed in Table 3.
For a better visualization, the reconstructed maximum, R80 and R50 positions from the different measure-
ments are plotted in Fig. 5. In this figure, discontinuous lines with slope 1 and containing the reference values of
the maximum, R80 and R50 at position 0 are also drawn to indicate the expected reconstruction positions. The
biggest deviation from the expected value is found in the reconstructed peak position from the measurement with
a target displacement of +2 mm. As seen from its corresponding profile in Fig. 4b, in this case the reconstructed
region with highest activity is distributed over an elongated area before the beam range, and the peak position
is found at a longer distance from R80 and R50. As shown in Fig. 5, the reconstructed positions of R80 and R50
Scientific Reports | (2021) 11:9325 | https://doi.org/10.1038/s41598-021-88812-5 5
Vol.:(0123456789)
www.nature.com/scientificreports/

                                            Figure 4.  Line profiles along the beam direction from images at 4.4 MeV shown in Fig. 3: (a) top row,
                                            (b) bottom row.

                                                                     Relative position (mm)                                      Lateral spread
                                             Target position (mm)    Max                                 R80         R50         FWHM (mm)        CNR         Energy peak (MeV)
                                             0                       –                                   –           –           35 ± 1           6.9         4.4 ± 0.3
                                             –25                     –17.9                               –18.7       –18.1       42 ± 1           6.8         4.4 ± 0.3
                                             –5                      –5.7                                –4.7        –4.0        47 ± 1           5.8         4.4 ± 0.4
                                             –2                      –3.0                                –0.2        +4.0        38 ± 3           5.5         4.5 ± 0.4
                                             +2                      –17.9                               +2.6        +8.1        41 ± 2           5.0         4.6 ± 0.4
                                             +5                      +11.9                               +10.9       +11.6       51 ± 2           6.2         4.7 ± 0.3
                                             +25                     +26.8                               +30.3       +31.4       54 ± 4           4.7         4.6 ± 0.3
                                                                     Average deviation from expected value
                                             Average values          6.2 ± 7.3                           3.4 ± 2.8   5.5 ± 2.4   46 ± 3           5.7 ± 0.3   4.5 ± 0.4

                                            Table 3.  Calculated parameters from the images reconstructed with measurements at different target
                                            positions. Positions along beam direction are calculated relative to the values obtained at position 0. Average
                                            values on the last row are calculated excluding position 0.

                                            Figure 5.  Range estimation for the six measured target positions using the maximum peak position (black),
                                            R80 (blue) and R50 (red) distances. Positions obtained from the longitudinal profiles at 4.4 MeV shown in Fig. 4.
                                            The error bars represent one voxel width. Dotted lines indicate the expected experimental positions, taking the
                                            values obtained from position 0 as a reference. The x axis is discontinued to include the two extreme points.

          Scientific Reports |   (2021) 11:9325 |                   https://doi.org/10.1038/s41598-021-88812-5                                                                    6

Vol:.(1234567890)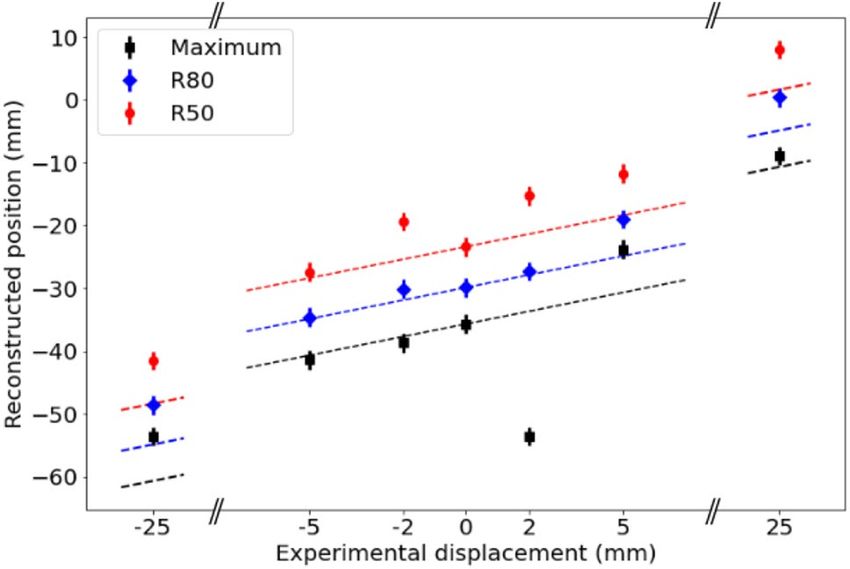
www.nature.com/scientificreports/
are in better agreement with the expected values, which indicates that these parameters might be more robust
to statistical fluctuations for the determination of range shifts.
Discussion
The aim of this work was to test the ability of our two-layer Compton camera to detect experimentally and quan-
tify range shifts of proton beams. The results presented in the previous section show that this can be achieved
by the current version of the prototype.
With the aim of recovering PG emission images from the experimental measurements, two aspects regarding
the nature of the detected data have been addressed: the high background of coincidences produced by unwanted
events and the spectral distribution of the PG that convey the sought signal information. Background reduction
in the dataset before image reconstruction was accomplished through the implementation of a NN for event
selection or rejection. After event selection, image reconstruction was performed using the four-dimensional
(space and energy) model described in (Muñoz et al. 2020)32.
The NN was trained with synthetic data obtained from simulations. Results with simulated data show that
the percentage of true signal increased from 7.6 to 10.3%, with a recall of 84.0%, after event selection with the
NN. In relative terms, the ratio of true signal events is increased by 35.4%. In the reconstructed four-dimensional
images (Fig. 1), this translates into a better recovery of the 4.4 MeV spectral line. From the spatial images and
profiles obtained at this energy, it can be seen that the peak position is better determined after event selection
with the NN. All the parameters studied to analyse the reconstructed images show an improvement when the
dataset of events selected by the NN is employed (Table 2): the images obtained present a narrower lateral spread,
more accurate positioning of the peak in both spatial and spectral dimensions, a lower background component
and a higher CNR. When all events are included in the reconstruction, the reconstructed spectrum shows a
peak of intensity at 4.8 ± 1.2 MeV. In this dataset, the 4.44 MeV peak is contaminated by the non-signal events
−
generated by PG undergoing a e+e pair production followed by the detection of an annihilation photon. These
background events cannot be properly reconstructed by the spectral algorithm and hinder the determination of
the correct energy of emission. The peak at 4.44 MeV is better determined in the spectra reconstructed from the
set of selected events, showing that the NN effectively reduces this kind of background. Given the enhancement
produced by the used event selection technique, the use of different NN architectures with increasing complex-
ity is also foreseen to study a possible enhancement of the method. Another studied technique for background
reduction is the employment of time of flight (ToF) measurements to reject neutron c ontributions49. Since the
timing performance of the current prototype does not allow using ToF information, the development of an
experimental prototype with improved time resolution is under investigation.
After application of the trained classification NN to experimental data, the production distribution of PG
has been reconstructed. The reconstructed four-dimensional image for the measurement at position 0 (Fig. 2),
with higher statistics (13.9 ·104 events after NN selection), can be analysed in more details. The recovered experi-
mental spectrum is similar to the one obtained from simulations after event selection, with intensity peaks at
2.2 and 4.4 MeV.
In order to consider the contribution of all emission energies, an image of the emission distribution of all PGs
can be obtained by integrating over the whole considered energy range (0.8–9.9 MeV, see the image reconstruc-
tion subsection). In the integrated image obtained from our measured data (Fig. 2a), a region of higher activity is
recovered at the end of the beam range. Since the irradiated target is made of PMMA, with a high 12C component,
the most intense PG line correlated to the beam range is emitted at 4.44 MeV, and this energy is the best suited for
imaging in this case. In the image obtained at 4.4 MeV (Fig. 2b), an emission distribution along the beam path
ending in a peak is reconstructed, beyond which the intensity quickly drops. Other energies, such as the emission
of 6.13 MeV photons by 16O, are also expected to produce images correlated to the Bragg peak position in the
irradiation of human t issue50,51. In the case of beam irradiations on targets of different material compositions,
for which the 6.13 MeV line may become more important, the procedure followed in this work is expected to
yield similar results as long as the NN for event selection is re-trained with an appropriately generated set of data.
For the detection of range shifts, data from the target at six different positions with respect to the system were
taken. The PG emission distribution at the energy of 4.4 MeV was reconstructed in all cases. The longitudinal
profiles extracted from the images show that the reconstructed distributions for the different positions are dis-
placed according to the experimental shifts, demonstrating the system capability of detecting range shifts of at
least 3 mm. Due to statistical fluctuations, in some cases the reconstructed longitudinal profiles present several
peaks of high intensity before the distal edge. For this reason, the maximum peak position is not always the best
indicator to detect range shifts. In the case of measurement at position P0+2 mm, a more extended region of
high intensity is reconstructed at the end of the beam range, and the maximum of intensity is placed further from
the distal edge than in the other measurements. The parameters R80 and R50 are also evaluated at the different
positions. Based on the results obtained in this work, with the limited available statistics, the parameters R80
and R50 appear as more robust indicators of the beam range inside the target. As seen from Fig. 5, the calculated
R80 and R50 values for the different measurements are shifted in the correct direction of the experimental target
displacements in all cases. The best results are achieved using the R80 parameter, with an average relative devia-
tion from the expected values of 3.4 mm.
The correct identification of 3 mm range shifts is compatible with the results reported in the literature with
similar systems. I n52, a shift of 2 mm is identified using a four-stage Compton camera based on CZT detectors.
In that work, the first plane of the camera was placed at 15 cm from the beam, and the D2C filter40, based on the
prior spatial knowledge of the beam position, is employed for event selection and assignment of the initial energy.
Systems employing PG imaging modalities other than Compton cameras for beam range estimation, and more
advanced towards their clinical application, have demonstrated higher precision at clinical rates with full-scale
Scientific Reports | (2021) 11:9325 | https://doi.org/10.1038/s41598-021-88812-5 7
Vol.:(0123456789)www.nature.com/scientificreports/
prototypes. In Xie et al.21, the authors claim that a precision of 2 mm can be achieved with a system based on
knife-edge slit collimation using spot aggregation. In the case of Hueso-Gonzalez et al.53, a system for beam
range monitoring using PG spectroscopy and a single-slab collimator is presented, and a precision of 1.1 mm at
a 95% confidence level is reported using spot aggregation as well. While the results obtained with our current
prototype still lie behind the ones obtained with more advanced systems, they show its viability to detect range
shifts with the technology employed and its potential for performance improvement.
The results obtained demonstrate the feasibility of the employed technique to detect range shifts inside the
target. While the technique is promising, the measurements reported in this work were performed with a total of
2.1 ·1011 protons, which is between 3 and 4 orders of magnitude more than the number used per spot in a clinical
scenario. In order to reach the statistics achieved in the reported measurements in a clinical treatment scenario,
the detection efficiency of the experimental prototype must be upgraded. New detectors with a detection area
four times larger than the ones employed in this work are already under development. Using the methodology
for the calculation of the system sensitivity validated in a previous work54, the efficiency of a two-plane Compton
camera at 4.4 MeV with the new detectors is estimated to increase by a factor of around 14 with respect to the
current prototype. The use of detectors with larger area will lead to an increase of the count rate. However, the
number of fortuitous coincidences is also expected to be amplified, which will require an improvement of the
event selection technique. To this end, NNs with more complex architectures will be investigated. In order to cope
with higher measurement rate, new acquisition electronics are under investigation to be able to process the data.
An additional factor of 2 can be gained when all two- and three-coincidence events can be measured43 and the
detection efficiency can also be enhanced by reducing the distance between the beam and the first working plane.
Even with the foreseen geometry optimization, spot aggregation might be required in order to reach the neces-
sary statistics for range determination. In addition to the efficiency improvement, the larger detection surface,
an optimized geometry and the use of all the available coincidences in a three-plane system is also expected to
enhance the quality of the reconstructed images, improving the system capability of recovering the Bragg peak
position and achieving similar results with fewer statistics. All these aspects are being addressed by the group
for clinical applicability of a future prototype.
Methods
Experimental set‑up. The Compton camera consists of three independent detectors operating in time
coincidence. Each of these detectors is composed of a monolithic LaBr3 scintillator crystal coupled to an array of
64 SiPMs. Crystals in the first two planes have an active volume of 25.8×25.8×5.0 mm3 , whereas the size of the
third one is 36.0×32.4×10.0 mm3 . The coincidence time window used to associate events in different planes is
50 ns. A detailed description of the system can be found in (Barrio et al. 2017)46.
Tests were performed on-beam at the irradiation facility of the AGOR cyclotron at KVI-Center for Advanced
Radiation Technology, University of Groningen, the Netherlands. The AGOR cyclotron can deliver proton beams
with energies between 20 MeV and 190 MeV, with a radio frequency of 55 MHz. The experiments in this work
were performed with proton beams with fixed energy of 150 MeV and an irradiation rate of about 108 protons
s−1, monitored by an open air ionization chamber that allows measuring the beam intensity during irradia-
tion. At this energy, the Bragg peak position is calculated at 133.5 mm from the entrance surface in the PMMA
target. The target was placed on a motorized stage using a Newport LTA-HS high speed motorized actuator,
with an accuracy of ±5 µm, which allows its displacement over a range of 50 mm. The collimated beam has an
estimated spot size of 7 mm FWHM in both horizontal and vertical directions at the target entrance. Changes in
the beam range due to energy losses in air are estimated below 50 µm for the target displacements measured in
this study, and can therefore be neglected. The beam broadening in air for the distance between the two extreme
target positions is calculated to be 0.38 mm FWHM, which is not expected to cause significant differences in
the reconstructed beam ranges. The employed beam intensity was selected due to the limited count rate of the
current version of the experimental prototype.
A picture of the experimental set-up is shown in Fig. 6a, where the beam exit, PMMA target and Compton
camera are visible. A diagram of the system positioning with respect to the target and particle beam can be seen
in Fig. 6b. Although the system was assembled with three planes for the entire experiment, only two-detector
coincidence events from the pair formed by the second and third detectors have been used for image reconstruc-
tion, due to the worse performance of the first detector observed in the data analysis.
Simulations. The experiment was simulated with G
ATE48 version 8.2, using G
eant455 version 10.05, to gain
insight into the measured data. A 150 MeV proton beam impinging on a PMMA cylinder with the same dimen-
sions as the experimental target was simulated. The physical processes and probabilities were defined using the
predefined QGSP-BIC-HP-EMZ physics list, which yielded results compatible with the experimental measure-
ments. For these simulations, the different detector planes were placed at the distances corresponding to the
experimental measurements. In order to increase the statistics and reduce simulation time for this study, the
area of the three planes was set to 100 × 100 mm 2 . For this study, a total of 4 · 1010 protons have been simulated,
distributed among 2000 different simulations. Each simulation was performed with a total of 2 · 107 primary
protons, which took 35 hours of computing on a single core. The total computing time needed to achieve the
obtained statistics was approximately 7 · 104 hours, computed in parallel on 20 different cores on the GRID com-
puting farm at IFIC56. The precision achieved by the NN as a function of the number of events used for training
reached a plateau after 80% of the simulated events, so the results are not expected to improve significantly for
higher statistics with the employed NN architecture.
The purpose of the simulations is twofold: in the first place, to use the realistic simulated spectra, including all
by-products generated during irradiation, to calibrate the energy response of our system in the measured data;
Scientific Reports | (2021) 11:9325 | https://doi.org/10.1038/s41598-021-88812-5 8
Vol:.(1234567890)www.nature.com/scientificreports/
Figure 6. (a) Picture of the experimental set-up showing beam exit, PMMA target and Compton camera. (b)
Diagram of relative distances in the experimental set-up.
Figure 7. Experimental and simulated spectra in singles mode measured in the second (a) and third (b) planes.
in the second place, to use the energy distributions of signal and background events to train the NN designed
for event selection to maximize the ratio of true signal events in the data employed for image reconstruction. For
the purpose of event selection, the simulated data are first classified as true signal or background. The set of true
signal events includes all events in which a photon generated during irradiation reaches the system and under-
goes a Compton scatter in the scatterer, followed by any interaction in the absorber. All other events, including
photon interactions with wrong ordering and those produced by other particles, are classified as background.
It should be noted that this criterion classifies as signal all events produced by any photon reaching the system,
irrespective of its creation process, so secondary photons are also classified as signal. In order to exclude low
energy photons produced by radiative processes, which are not correlated to the deposited d ose57, a low energy
threshold of 750 keV was applied in the combined deposited energy before event selection.
Calibration of measured spectra. The individual detector planes have been calibrated using the spectra
measured in-beam in singles mode, that is, working independently from the other planes (not in time coinci-
dence). The measured energy response of each detector is calibrated by comparing the identifiable peaks (511,
718 and 3417 keV) to those obtained in simulations. The calibrated spectra are plotted in Fig. 7, showing good
agreement with simulated results. This calibration has been maintained for the measurements in time coinci-
dence, from which images of the PG emission distribution have been reconstructed.
Event selection. A NN has been implemented using TensorFlow58 to the end of reducing background
events. The energy measured in the two individual planes is fed to the NN as input, and its final output is a
binary classificator to either accept or reject the event. The NN contains two fully connected hidden layers of 80
and 40 nodes respectively, employing the ReLU (Rectified Linear Unit) activation function. A dropout layer with
a rate of 25% after the first layer is included for regularization in the training stage. The output value of the NN
is obtained after a sigmoid activation in the output layer, which yields a numeric result between 0 and 1. The NN
prediction for an event is 1 (true signal) if its output value is greater than 0.5 and 0 (background) otherwise. The
NN is trained by minimizing the binary cross entropy loss function between actual and predicted event labels.
Scientific Reports | (2021) 11:9325 | https://doi.org/10.1038/s41598-021-88812-5 9
Vol.:(0123456789)www.nature.com/scientificreports/
The training and validation sets used to optimize the NN parameters were obtained from simulations and
labeled as signal or background as described in the simulations subsection. After training, the NN was employed
for event selection in the experimentally measured datasets prior to image reconstruction.
Image reconstruction. Images have been reconstructed by means of a spectral reconstruction method that
estimates the spatial and energy distributions of the measured photons. The method considers a four-dimen-
sional (three spatial coordinates and energy) field of view (FoV), in which the four-dimensional voxels are asso-
ciated to an emission energy. Each measured event is backprojected to the FoV using all the possible emission
energies in the range considered. Taking into account the Compton scattering formula, this means that every
event generates a set of conical surfaces, each corresponding to a single emission energy. The different conical
surfaces are modelled as a dense set of rays and backprojected onto the FoV using a ray-tracing technique59. A
detailed description of the implementation of the method and calculation of the system and sensitivity matrices
can be found in (Muñoz et al. 2020)32.
Spatial-spectral images are calculated with the standard list-mode Maximum Likelihood Expectation Maxi-
mization (MLEM) algorithm. In this work, all images have been reconstructed using a FoV with 101 × 101 × 1
spatial voxels of 3 × 3 × 3 mm3 and 92 energy bins of 0.1 MeV, ranging from 0.8 to 9.9 MeV. A median filter with
size 3 × 3 × 1 × 3 (3 voxels in the x,y spatial dimensions and 3 voxels in the energy dimension) and constant
weights is applied to the current image estimate between successive iterations. All reconstructed images shown
in this work correspond to iteration 50 of the algorithm, after convergence is reached.
The reconstructed four-dimensional images provide information on both the spatial distribution and the
spectral emission of the measured dataset. If the spectral domain of the image is integrated out, the spatial
distribution for the whole energy range is obtained. Conversely, the reconstructed energy spectrum can be
recovered by integrating out the spatial extent of the image. In addition, the spatial distribution reconstructed
for a particular emission energy can be extracted by selecting the corresponding three-dimensional slice. Since
4.439 MeV is the most prominent PG emission energy correlated to the absorbed dose, in this work the spatial
image obtained for the energies between 4.3 and 4.5 MeV has been used for the estimation of range shifts within
the irradiated target.
Image assessment and range estimation. A method for range estimation similar to the one employed
in Ortega et al.41 has been followed to calculate the distal fall-off. Longitudinal profiles along the beam direction
are generated by integrating the reconstructed voxels in a 3 cm wide slice in the y direction (perpendicular to the
beam). This width is chosen to include the activity of the beam lateral spread. From these longitudinal profiles,
in order to compare the gradient of the curve, different depths have been considered: the depth at the maximum
peak and the depths at 80% (R80) and 50% (R50) height of the maximum peak. Given that images are recon-
structed with a fixed number of voxels, the minimum resolution of the profiles is limited to the voxel size. For
the calculation of the range estimation parameters, the peak position is taken as the center of the corresponding
voxel, and R80 and R50 are calculated from a linear interpolation between the voxels immediately above and
below the heights of 80 and 50 percent of the peak.
In addition to range estimations, other figures of merit are used to quantify the reconstructed images. The
beam lateral spread is calculated as the FWHM of the beam transverse profiles, obtained at the maximum posi-
tion with a width of 10 voxels in the x direction. The contrast-to-noise ratio (CNR) of the images is calculated
as CNR = |S − µ|/σ , where S is the intensity at the peak position and µ and σ are respectively the mean value
and standard deviation of the background. For this calculation, the background values are taken from the voxels
located outside a region of 150 mm along the beam direction and 60 mm in its perpendicular direction to exclude
the lateral spread of the reconstructed activity.
Conclusion
The tests reported in this work were aimed at assessing the performance of MACACO II with experimental beam
data, using a spectral method to estimate the PG energy and a NN for event selection and background reduction.
The results obtained from in-beam measurements demonstrate that the system is able to detect range shifts in the
irradiated target. Images of the emission distribution of 4.4 MeV prompt gammas have been recovered, allowing
calculation of the distal fall-off and identification of target displacements of 3 mm.
Received: 30 October 2020; Accepted: 13 April 2021
References
1. PTCOG. Patient statistics and facilities under operation. particle therapy co-operative group. http://www.ptcog.ch (2020).
2. Paganetti, H. Range uncertainties in proton therapy and the role of monte Carlo simulations. Phys. Med. Biol. 57, R99 (2012).
3. Enghardt, W. et al. Dose quantification from in-beam positron emission tomography. Radiother. Oncol. 73, S96–S98 (2004).
4. Bisogni, M. G. et al. Inside in-beam positron emission tomography system for particle range monitoring in hadrontherapy. J. Med.
Imaging 4, 011005 (2016).
5. Ferrero, V. et al. Online proton therapy monitoring: clinical test of a silicon-photodetector-based in-beam pet. Sci. Rep. 8, 1–8
(2018).
6. Parodi, K. et al. Random coincidences during in-beam pet measurements at microbunched therapeutic ion beams. Nucl. Instrum.
Methods Phys. Res., Sect. A 545, 446–458 (2005).
7. Moteabbed, M., España, S. & Paganetti, H. Monte carlo patient study on the comparison of prompt gamma and pet imaging for
range verification in proton therapy. Phys. Med. Biol. 56, 1063 (2011).
8. Yamaya, T. Openpet: a novel open-type pet system for 3d dose verification in particle therapy. In Journal of Physics: Conference
Series, vol. 777, 012023 (IOP Publishing, 2017).
Scientific Reports | (2021) 11:9325 | https://doi.org/10.1038/s41598-021-88812-5 10
Vol:.(1234567890)www.nature.com/scientificreports/
9. Ozoemelam, I. S. et al. Feasibility of quasi-prompt pet-based range verification in proton therapy. Phys. Med. Biol. (2020).
10. Buitenhuis, H., Diblen, F., Brzezinski, K., Brandenburg, S. & Dendooven, P. Beam-on imaging of short-lived positron emitters
during proton therapy. Phys. Med. Biol. 62, 4654 (2017).
11. Dendooven, P. et al. Corrigendum: short-lived positron emitters in beam-on pet imaging during proton therapy (2015 phys. med.
biol. 60 8923). Phys. Med. Biol. 64, 129501 (2019).
12. Min, C.-H., Kim, C. H., Youn, M.-Y. & Kim, J.-W. Prompt gamma measurements for locating the dose falloff region in the proton
therapy. Appl. Phys. Lett.89, (2006).
13. Testa, E. et al. Dose profile monitoring with carbon ions by means of prompt-gamma measurements. Nucl. Instrum. Methods Phys.
Res., Sect. B 267, 993–996 (2009).
14. Verburg, J. M., Riley, K., Bortfeld, T. & Seco, J. Energy- and time-resolved detection of prompt gamma-rays for proton range
verification. Phys. Med. Biol. 58, L37–L49 (2013).
15. Kiener, J., de Séréville, N. & Tatischeff, V. Shape of the 4.438 MeV γ -ray line of 12 C from proton and α-particle induced reactions
on 12 C and 16 O. Phys. Rev. C 64, 025803 (2001).
16. Belhout, A. et al.γ -ray production by proton and α-particle induced reactions on 12 C, 16 O, 24 Mg , and fe. Phys. Rev. C 76, 034607.
https://doi.org/10.1103/PhysRevC.76.034607 (2007).
17. Kim, J.-W. Pinhole camera measurements of prompt gamma-rays for detection of beam range variation in proton therapy. J. Kor.
Phys. Soc. 55, 1673 (2009).
18. Bom, V., Joulaeizadeh, L. & Beekman, F. Real-time prompt gamma monitoring in spot-scanning proton therapy using imaging
through a knife-edge-shaped slit. Phys. Med. Biol. 57, 297 (2011).
19. Smeets, J. et al. Prompt gamma imaging with a slit camera for real-time range control in proton therapy. Phys. Med. Biol. 57, 3371
(2012).
20. Pinto, M. et al. Design optimisation of a TOF-based collimated camera prototype for online hadrontherapy monitoring. Phys.
Med. Biol. 59, 7653 (2014).
21. Xie, Y. et al. Prompt gamma imaging for in vivo range verification of pencil beam scanning proton therapy. Int. J. Radiat. Oncol.
Biol. Phys. 99, 210–218 (2017).
22. Golnik, C. et al. Range assessment in particle therapy based on prompt γ -ray timing measurements. Phys. Med. Biol. 59, 5399–5422
(2014).
23. Krimmer, J. et al. A cost-effective monitoring technique in particle therapy via uncollimated prompt gamma peak integration.
Appl. Phys. Lett. 110, 154102 (2017).
24. Krimmer, J., Dauvergne, D., Létang, J. & Testa, É. Prompt-gamma monitoring in hadrontherapy: a review. Nucl. Instrum. Methods
Phys. Res., Sect. A 878, 58–73 (2018).
25. Fontana, M., Dauvergne, D., Létang, J. M., Ley, J.-L. & Testa, É. Compton camera study for high efficiency SPECT and benchmark
with Anger system. Phys. Med. Biol. 62, 8794 (2017).
26. Kishimoto, A. et al. First demonstration of multi-color 3-d in vivo imaging using ultra-compact compton camera. Sci. Rep. 7, 1–7
(2017).
27. Sakai, M. et al. Compton imaging with 99m tc for human imaging. Sci. Rep. 9, 1–8 (2019).
28. Kroeger, R. A., Johnson, W. N., Kurfess, J. D., Phlips, B. F. & Wulf, E. A. Three-Compton telescope: Theory, simulantions, and
performance. IEEE Trans. Nucl. Sci. 49, 1887–1892 (2002).
29. Roser, J. et al. Image reconstruction for a multi-layer Compton telescope: an analytical model for three interaction events. Phys.
Med. Biol. 65, 145005 (2020).
30. Xu, D. & He, Z. Gamma-ray energy-imaging integrated spectral deconvolution. Nucl. Instrum. Methods Phys. Res., Sect. A 574,
98–109 (2007).
31. Gillam, J. et al. A Compton imaging algorithm for on-line monitoring in hadron therapy. In Medical Imaging 2011: Physics of
Medical Imaging, vol. 7961, 79611O (International Society for Optics and Photonics, 2011).
32. Muñoz, E. et al. A spectral reconstruction algorithm for two-plane Compton cameras. Phys. Med. Biol. 65, 025011 (2020).
33. Richard, M.-H. Design study of a Compton camera for prompts-gamma imaging during ion beam therapy. Ph.D. thesis, Université
Claude Bernard-Lyon I (2012).
34. Mackin, D., Peterson, S., Beddar, S. & Polf, J. Evaluation of a stochastic reconstruction algorithm for use in Compton camera
imaging and beam range verification from secondary gamma emission during proton therapy. Phys. Med. Biol. 57, 3537 (2012).
35. Schoene, S. et al. An image reconstruction framework and camera prototype aimed for Compton imaging for in-vivo dosimetry
of therapeutic ion beams. IEEE Trans. Nucl. Sci. 1, 1 (2016).
36. Taya, T. et al. First demonstration of real-time gamma imaging by using a handheld Compton camera for particle therapy. Nucl.
Instrum. Methods Phys. Res., Sect. A 831, 355–361 (2016).
37. Aldawood, S. et al. Development of a Compton camera for prompt-gamma medical imaging. Radiat. Phys. Chem. 140, 190–197
(2017).
38. Yao, Z., Xiao, Y., Chen, Z., Wang, B. & Hou, Q. Compton-based prompt gamma imaging using ordered origin ensemble algorithm
with resolution recovery in proton therapy. Sci. Rep. 9, 1–15 (2019).
39. Ohno, M. et al. Event-selection technique for the multi-layer si- cdte compton camera onboard hitomi. Nucl. Instrum. Methods
Phys. Res., Sect. A 924, 327–331 (2019).
40. Draeger, E. et al. Feasibility studies of a new event selection method to improve spatial resolution of compton imaging for medical
applications. IEEE Trans. Radiat. Plasma Med. Sci. 1, 358–367 (2017).
41. Ortega, P. G. et al. Noise evaluation of Compton camera imaging for proton therapy. Phys. Med. Biol. 60, 1845 (2015).
42. Llosá, G. et al. Second LaBr3 Compton telescope prototype. In 2013 3rd International Conference on Advancements in Nuclear
Instrumentation Measurement Methods and their Applications (ANIMMA), 1–4 (IEEE, 2013).
43. Muñoz, E. et al. Performance evaluation of MACACO: a multilayer Compton camera. Phys. Med. Biol. 62, 7321 (2017).
44. Solevi, P. et al. Performance of MACACO Compton telescope for ion-beam therapy monitoring: first test with proton beams. Phys.
Med. Biol. 61, 5149 (2016).
45. Muñoz, E. et al. Tests of MACACO compton telescope with 4.44 MeV gamma rays. Journal of Instrumentation 13, P05007 (2018b).
46. Barrio, J. et al. Performance improvement tests of MACACO: a Compton telescope based on continuous crystals and SiPMs.
Nuclear Instruments and Methods in Physics Research Section A: Accelerators, Spectrometers, Detectors and Associated Equip-
ment (2017).
47. Zoglauer, A. & Boggs, S. E. Application of neural networks to the identification of the compton interaction sequence in compton
imagers. In 2007 IEEE Nuclear Science Symposium Conference Record, vol. 6, 4436–4441 (IEEE, 2007).
48. Jan, S. et al. GATE: a simulation toolkit for PET and SPECT. Phys. Med. Biol. 49, 4543 (2004).
49. Biegun, A. K. et al. Time-of-flight neutron rejection to improve prompt gamma imaging for proton range verification: a simulation
study. Phys. Med. Biol. 57, 6429 (2012).
50. Polf, J. et al. Measurement and calculation of characteristic prompt gamma ray spectra emitted during proton irradiation. Phys.
Med. Biol. 54, N519 (2009).
51. Kelleter, L. et al. Spectroscopic study of prompt-gamma emission for range verification in proton therapy. Physica Med. 34, 7–17
(2017).
52. Draeger, E. et al. 3d prompt gamma imaging for proton beam range verification. Phys. Med. Biol. 63, 035019 (2018).
Scientific Reports | (2021) 11:9325 | https://doi.org/10.1038/s41598-021-88812-5 11
Vol.:(0123456789)www.nature.com/scientificreports/
53. Hueso-González, F., Rabe, M., Ruggieri, T. A., Bortfeld, T. & Verburg, J. M. A full-scale clinical prototype for proton range verifica-
tion using prompt gamma-ray spectroscopy. Phys. Med. Biol. 63, 185019 (2018).
54. Muñoz, E. et al. Study and comparison of different sensitivity models for a two-plane Compton camera. Phys. Med. Biol. 63, 135004
(2018).
55. Agostinelli, S. et al. Geant4-a simulation toolkit. Nucl. Instrum. Methods Phys. Res., Sect. A 506, 250–303. https://doi.org/10.1016/
S0168-9002(03)01368-8 (2003).
56. Amorós, G. et al. Scientific applications running at IFIC using the grid technologies within the e-science framework. In 2009 Third
International Conference on Advanced Engineering Computing and Applications in Sciences, 73–76 (IEEE, 2009).
57. Chin, M., Cerutti, F., Ferrari, A., Ortega, P. G. & Sala, P. Signal and noise delineation for prompt-gamma detection during had-
rontherapy. In 2013 3rd International Conference on Advancements in Nuclear Instrumentation, Measurement Methods and their
Applications (ANIMMA), 1–8 (IEEE, 2013).
58. Abadi, M. et al. Tensorflow: A system for large-scale machine learning. In 12th {USENIX} symposium on operating systems design
and implementation ( {OSDI} 16), 265–283 (2016).
59. Siddon, R. L. Fast calculation of the exact radiological path for a three-dimensional ct array. Med. Phys. 12, 252–255 (1985).
Acknowledgements
This work has received funding from the Spanish Ministerio de Ciencia e Innovación (PID2019-110657RB-I00,
FPA2017-85611-R) and from European Commission H2020 ENSAR2 project and MediNet network (project
number 654002). Group members are supported by Ramón y Cajal and SEJI programmes, UVEG Atracció de
Talent, Generalitat Valenciana and Spanish Ministerio de Universidades FPU predoctoral contracts.
Author contributions
G.L. conceived the experiment and coordinated the work. E.M., A.R, J.B., J.R. and G.L. conducted the experi-
ment. P.D. and I.O. provided the local support and expertise in the proton beam operation. M.B.L. performed
the simulations and data calibration. E.M. and M.B.L. designed the event selection technique. E.M., J.F.O. and
J.R. developed the image reconstruction method. E.M. wrote the manuscript, which was reviewed by all authors.
Competing interests
The authors declare no competing interests.
Additional information
Correspondence and requests for materials should be addressed to E.M.
Reprints and permissions information is available at www.nature.com/reprints.
Publisher’s note Springer Nature remains neutral with regard to jurisdictional claims in published maps and
institutional affiliations.
Open Access This article is licensed under a Creative Commons Attribution 4.0 International
License, which permits use, sharing, adaptation, distribution and reproduction in any medium or
format, as long as you give appropriate credit to the original author(s) and the source, provide a link to the
Creative Commons licence, and indicate if changes were made. The images or other third party material in this
article are included in the article’s Creative Commons licence, unless indicated otherwise in a credit line to the
material. If material is not included in the article’s Creative Commons licence and your intended use is not
permitted by statutory regulation or exceeds the permitted use, you will need to obtain permission directly from
the copyright holder. To view a copy of this licence, visit http://creativecommons.org/licenses/by/4.0/.
© The Author(s) 2021
Scientific Reports | (2021) 11:9325 | https://doi.org/10.1038/s41598-021-88812-5 12
Vol:.(1234567890)You can also read