Single neuron dynamical effects of dendritic pruning implicated in aging and neurodegeneration: towards a measure of neuronal reserve - Nature
←
→
Page content transcription
If your browser does not render page correctly, please read the page content below
www.nature.com/scientificreports
OPEN Single‑neuron dynamical effects
of dendritic pruning implicated
in aging and neurodegeneration:
towards a measure of neuronal
reserve
Christoph Kirch1,2 & Leonardo L. Gollo1,2,3*
Aging is a main risk factor for neurodegenerative disorders including Alzheimer’s disease. It is often
accompanied by reduced cognitive functions, gray-matter volume, and dendritic integrity. Although
age-related brain structural changes have been observed across multiple scales, their functional
implications remain largely unknown. Here we simulate the aging effects on neuronal morphology
as dendritic pruning and characterize its dynamical implications. Utilizing a detailed computational
modeling approach, we simulate the dynamics of digitally reconstructed neurons obtained from
Neuromorpho.org. We show that dendritic pruning affects neuronal integrity: firing rate is reduced,
causing a reduction in energy consumption, energy efficiency, and dynamic range. Pruned neurons
require less energy but their function is often impaired, which can explain the diminished ability to
distinguish between similar experiences (pattern separation) in older people. Our measures indicate
that the resilience of neuronal dynamics is neuron-specific, heterogeneous, and strongly affected
by dendritic topology and the position of the soma. Based on the emergent neuronal dynamics, we
propose to classify the effects of dendritic deterioration, and put forward a topological measure of
“neuronal reserve” that quantifies the resilience of neuronal dynamics to dendritic pruning. Moreover,
our findings suggest that increasing dendritic excitability could partially mitigate the dynamical
effects of aging.
Aging is often accompanied by cognitive deficits such as forgetfulness, distractibility, inflexibility1, reduction in
speed of processing2, working and episodic memory3, inhibitory function4, and long-term memory. Along with
these cognitive changes, aging is also a major risk factor for dementia and neurodegenerative d isorders5. There are
a number of age-related structural changes that occur in the brain at various levels: synapses6, dendrites7, circuits8,
gray-matter volume9. Furthermore, some dynamic properties associated with aging have been r eported10, how-
ever, the effect of dendritic pruning caused by aging on neuronal dynamics remains largely unknown.
It is well established that neurons can undergo several major structural changes during aging11,12. Firstly, the
number of dendritic spines d ecreases6,11. As spines are regions of dense synaptic connections, neurons with fewer
spines are often subjected to a reduced number of incoming synapses. Secondly, aging can alter the geometry
of dendritic branches. For example, it has been found that aging neurons in humans show lumps and localized
swelling that were not present in the control g roup13. Thirdly, the complexity and size of the dendritic arbor is
progressively reduced. In pyramidal neurons, a recession of basal dendrites has been observed, followed by a
retraction of the apical dendrites towards the main shaft13. Over time, the protrusion and branching order of
neurons can decrease significantly, though the exact timescales over which these changes occur are not well
known. These morphological changes have been observed across s pecies14–17 and in different cell t ypes15,18,19,
with varying severity. The effect of aging is amplified by high s enility13, or in the presence of neurodegenerative
disorders11,20–22.
Given that dendrites perform vital computations that shape the neuron’s o utput23–25, changing the structure
can impede normal neuronal functioning and disrupt neural circuits. Exactly what adverse effects does a receding
1
QIMR Berghofer Medical Research Institute, Brisbane, Australia. 2The Queensland University of Technology,
Brisbane, Australia. 3The Turner Institute for Brain and Mental Health, School of Psychological Sciences, Monash
Biomedical Imaging, Monash University, Melbourne, Australia. *email: Leonardo.Gollo@monash.edu
Scientific Reports | (2021) 11:1309 | https://doi.org/10.1038/s41598-020-78815-z 1
Vol.:(0123456789)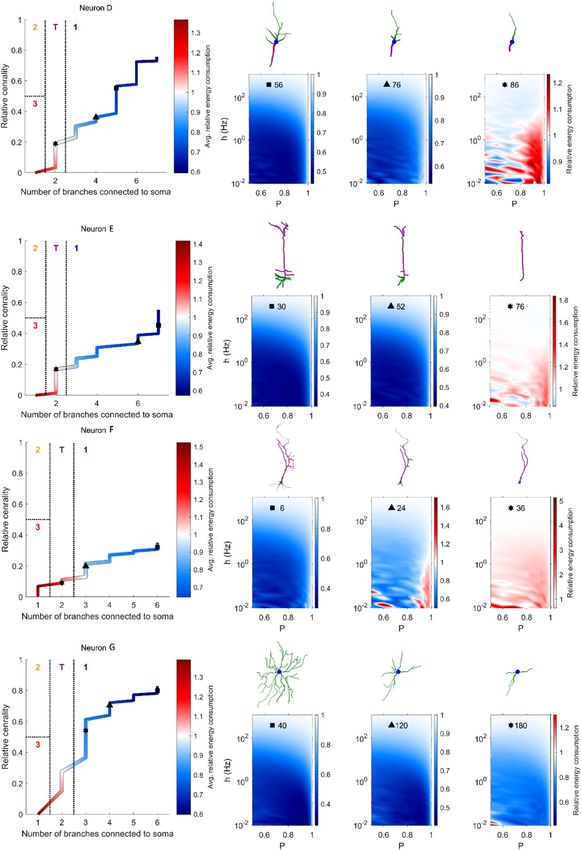
www.nature.com/scientificreports/
dendritic tree induce? What types of structural changes are detrimental? These questions cannot be answered
easily because of the complex biophysical behavior of neurons that depends on a large number of dynamic
internal and external factors. While associations of the effects of aging neurons exist—such as memory loss1, a
decrease in cognitive a bility26, and lower reaction and processing s peeds2—the specific role that topology, and
changes therein, plays in the functioning of single neurons is not well known6,27. Furthermore, a number of
factors (years of education, lifestyle, occupation, genetics, brain size, number of synapses, and so on) have been
proposed to explain the broad diversity that is observed in the impact of cognitive impairments associated with
neurodegeneration. Identifying the importance of some of these factors has been a main approach to explain
differences in resilience to neurodegenerative damage within a population. Within this realm, the accumulation
of protective factors increases this resilience. This is the foundation of influential concepts like brain r eserve28,
and cognitive reserve29. Nonetheless, the neuronal basis of these protective factors is unclear.
Previous work proposed to apply a minimal model to the dynamics of active dendrites and to explore the
behavior of realistic neuron morphologies that have been stored in an open database with over 100,000 neurons30.
In this way, the dendritic structure of the neuronal modes can be extremely detailed and realistic, and provide
insights into the spatial dependence of the dynamics. In this paper, we develop a new pruning algorithm (available
at http://www.sng.org.au/Downloads) that models the effects of aging on neuronal structure to address: How do
topological changes, as seen in aging and neurodegenerative disorders, impede a neuron’s normal functioning?
Specifically, we characterize fundamental dynamical properties (energy consumption and dynamic range) of
different neurons receiving stochastic synaptic input at hundreds to thousands of compartments as the levels of
neuronal degeneration (dendritic pruning) progressively accumulate.
Results
To model the dendritic regression often observed in aging neurons, we iteratively removed the terminal compart-
ments of the neuron reconstructions (see “Methods” for details). This pruning algorithm reproduces a reduction
in the size and complexity of the dendritic arbor (Fig. 1). In this example of a human pyramidal neuron, the basal
dendrites slowly disappear, while the apical tuft retracts towards the main stem. A critical change occurs in the
structure at iteration 24, at which the number of dendritic stems connecting to the soma reduces to 1. Only a
single bifurcation remains at the top of the apical dendrites, which disappears at iteration 27. After this, the stem
linearly reduces in size until disappearing completely at iteration 46.
For the different pruning iterations, we simulated the dynamics of the neuron, considering the dynamics
of each compartment as a minimal excitable system (modeled as a cyclic cellular automaton and illustrated in
Fig. 2a,b). We studied seven neurons (labelled Neuron A, B,…G; see “Methods” for details). As explained in detail
in “Methods”, each quiescent compartment can become active driven by stochastic synapses with a rate h, or by
a propagation of input from a neighbor compartment with probability P. For a full illustration of the dynam-
ics of the model, see Supplementary Video 1. A snapshot of the video is presented in Fig. 2c. As demonstrated
previously30, the average firing rate is heterogeneous and depends on the neuronal topology (Fig. 2d), which may
facilitate dendritic c omputations24. For each compartment, the firing rate and dynamic range can be measured,
and they show specific spatial patterns such as amplification of dynamic range at bifurcation p oints30. Here we
will focus on these measures specifically at the soma (Fig. 2e). In addition, we will also focus on the total energy
consumption and the relative energy consumption of neurons (as a function of the two control parameters: P and
h, and shown in Fig. 2f,g). Here, the total energy consumption is defined as the average number of total dendritic
spikes observed for every one somatic spike. The relative energy consumption indicates the mean number of
dendritic spikes per dendritic compartments observed for each somatic spike (see “Methods”). As demonstrated
in Fig. 2h, the relative energy consumption was previously shown to be an effective index to classify different types
of neuronal dynamics30. This dynamical classification reflects two topological features of dendrites: centrality
of the soma, and the number of dendritic branches connected to the soma. These dynamical features shown in
Fig. 2 will be explored in more detail here as neuronal dendrites are progressively pruned.
The highly heterogeneous structure of the dendrites leads to complex non-linear interactions between signals.
As the size and complexity of the dendrites reduces, the activity in the neuron becomes sparser. This occurs
mainly because the rate of new dendritic spikes due to synaptic input increases with the number of compart-
ments. This dependence of the neuronal size and activity leads to an overall effect on the energy consumption
of the neuron (Fig. 2f). The energy consumption also depends on the main parameters of the model, as it is
more pronounced for larger values of h and P. In general, smaller neurons are more economical, and hence our
model predicts that the energy consumption of a neuron reduces as it ages (Fig. 3). This reduction in energy
consumption with aging is particularly effective during the expensive dynamical regimes (large input rate h and
excitability P).
Another complementary measure is the relative energy consumption, which normalizes the energy consump-
tion by the number of dendritic compartments, and compares the mean activity of dendritic compartments
against the soma (see “Methods”). This relative energy consumption is inversely related to how efficiently the
neuron uses its dendrites to fire. A low relative energy consumption is observed when the mean number of
somatic spikes is larger than the number of dendritic spikes per compartments. In this case, the neuronal topol-
ogy amplifies the activity at the soma. As shown in Fig. 4, the relative energy consumption increases significantly
as the complexity of the dendritic tree decreases. However, once all dendrites except the main apical shaft have
been removed (see Fig. 1), it tends to decrease slightly. This highlights the importance of dendritic topology to
shape the relative energy consumption. If the relative energy consumption is below 1, the neuron is generally
efficient. If it is above 1, the neuron is generally inefficient. Therefore, as neuronal pruning accumulates, although
the total number of dendritic spikes reduces, it becomes less energy efficient.
Scientific Reports | (2021) 11:1309 | https://doi.org/10.1038/s41598-020-78815-z 2
Vol:.(1234567890)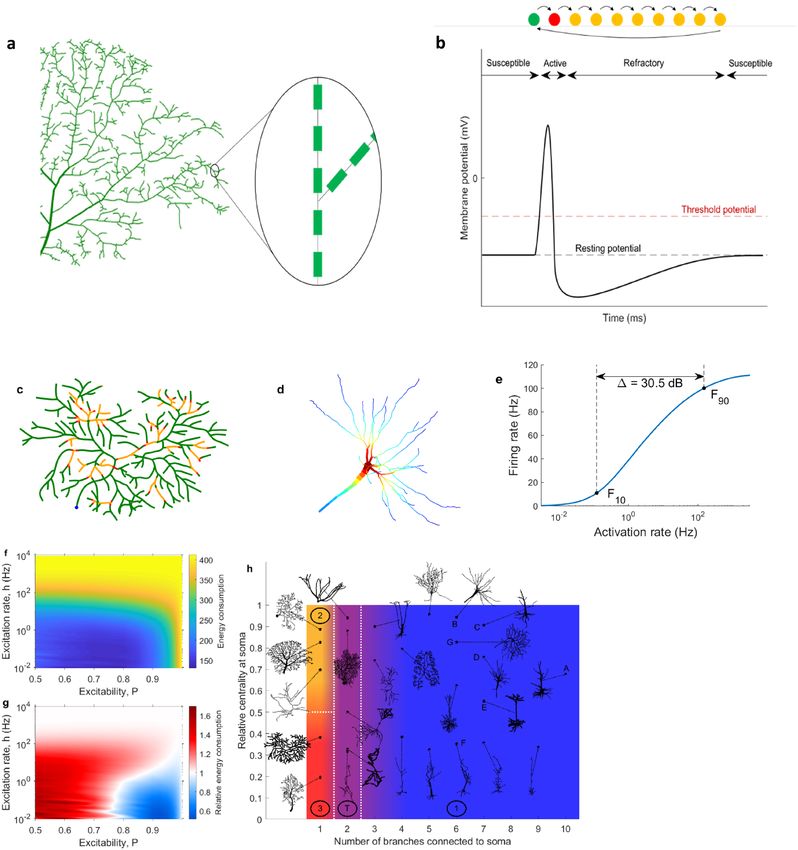
www.nature.com/scientificreports/
Figure 1. Dendritic pruning and neuronal aging. (a) Human neurons in their various aging stages (adapted
with permission from13). (b) Snapshots of a digitally recreated human neuron (Neuron A, see “Methods”)
in various stages of simulated aging. The number below each neuron signifies the pruning iteration (see
“Methods”). Basal dendrites are colored in green, while apical dendrites are colored purple. The soma (blue)
is shown by the black arrow. (c) The number of compartments as a function of the pruning iteration. (d) The
number of bifurcations as a function of the pruning iteration. (e) Relative centrality of the pruned neuron (see
“Methods”). At the red arrow, a single dendritic branch remains, which bifurcates once at the top of the apical
tree.
Large dendritic arbors are known to increase the dynamic range32, which determines what range of input
strength the neuron can effectively encode in its o utput33, and it is quantified based on the response function.
Response functions reveal how the firing rate (output) of the soma changes with the input strength. As shown
in Fig. 5, response functions are substantially affected by dendritic pruning. In general, pruning reduces the
firing rate and the capability of the neuron to respond to weak stimuli. Therefore, the dynamic range is also
progressively reduced with pruning iterations. The higher the signal propagation probability P, the higher the
dynamic range. At high values of P, the dynamic range decreases more evenly over the pruning iterations. At
lower values of P, the decrease in dynamic range occurs abruptly as the neuron approaches the point of major
structural change (red arrow). It indicates the iteration at which only a single dendritic stem is connected to the
soma. In general, the dynamic range decreases with pruning for all neurons following different patterns but they
eventually converge to the same value, and a similar convergence is also seen for the relative energy consumption
(see Supplementary Fig. 1).
We have shown that Neuron A reduces its energy consumption as it ages, but becomes less efficient. Fur-
thermore, the dynamic range at the soma is reduced with age. Figure 6 shows that these findings also hold for
Scientific Reports | (2021) 11:1309 | https://doi.org/10.1038/s41598-020-78815-z 3
Vol.:(0123456789)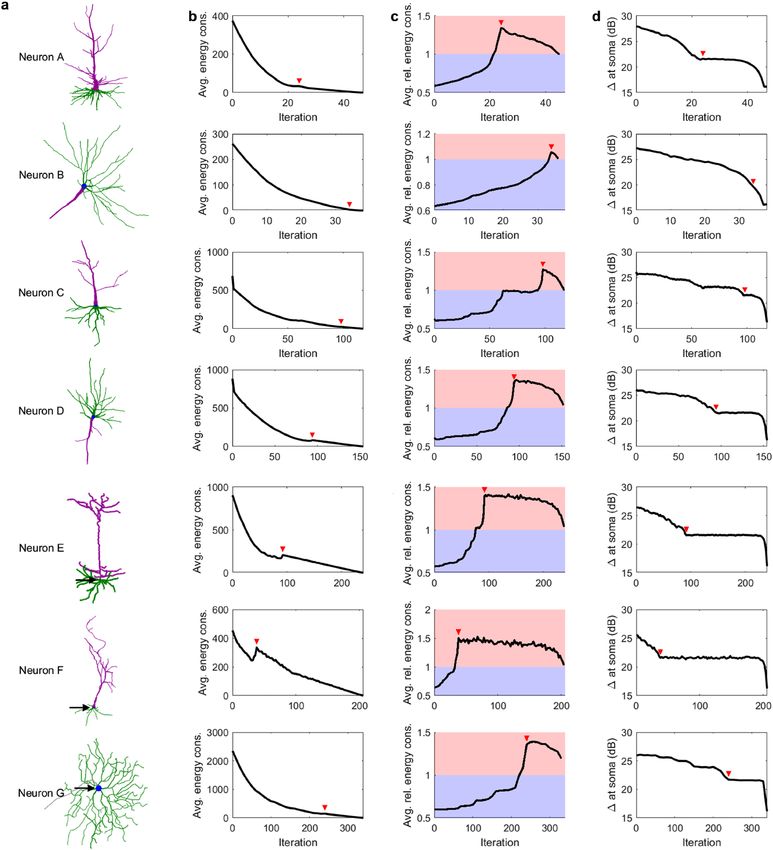
www.nature.com/scientificreports/
Figure 2. Dynamical description of the neuronal model. (a) We use detailed digital neuron reconstructions from NeuroMorpho.
org. The dendrites are partitioned into fine compartments. (b) The network of compartments forms an excitable tree to account
for dendritic spikes. Each compartment undergoes the same type of dynamics. A temporal evolution of states of a compartment is
shown here, corresponding to the susceptible (green), spiking (red), and refractory (yellow) stages of a dendritic spike. (c) Snapshot
of neuronal dynamics with h = 0.5 and P = 0.9630. For a full illustration of the dynamics, please refer to Supplementary Video 1.
(d) The firing rate of each compartment can be plotted for a particular set of parameters h and P (here, h = 1.12 and P = 0.9 using
Neuron B, see “Methods” and Table 1), which govern the external driving and the dendritic excitability (see “Methods” for details),
to obtain a map of most active regions within the neuron. Warm colors correspond to high firing rates, and cold colors to low firing
rates. (e) Plotting the average firing rate of a particular compartment against the input rate h yields the response curve. The range of
h values over which the firing rate varies most (between 10% and 90% of the maximum firing rate, F10 and F90) is called the dynamic
range Δ. This example uses Neuron B with P = 0.9. (f) The energy consumption of a neuron is given by the number of total dendritic
spikes per somatic spike, and is plotted over the parameter space. This example uses Neuron B. (g) The relative energy consumption
represents the number of times a dendritic compartment fires, on average, per somatic spike. If it is less than 1, the neuron is energy
efficient because dendrites effectively amplify the neuronal output (somatic spikes). If it is larger than 1, the neuron is considered
energy inefficient. This example uses an interneuron from the Drosophila30,31. (h) Based on the number of branches connected to the
soma and its centrality, neurons can be classified into four functional types: energy efficient (Type 1), partially efficient/inefficient
(Type 2), energy inefficient (Type 3), and a transitional type (Type T) which can exhibit a mixture of the other types. See r eference30 for
more details on the functional classification of neurons based on energy consumption.
Scientific Reports | (2021) 11:1309 | https://doi.org/10.1038/s41598-020-78815-z 4
Vol:.(1234567890)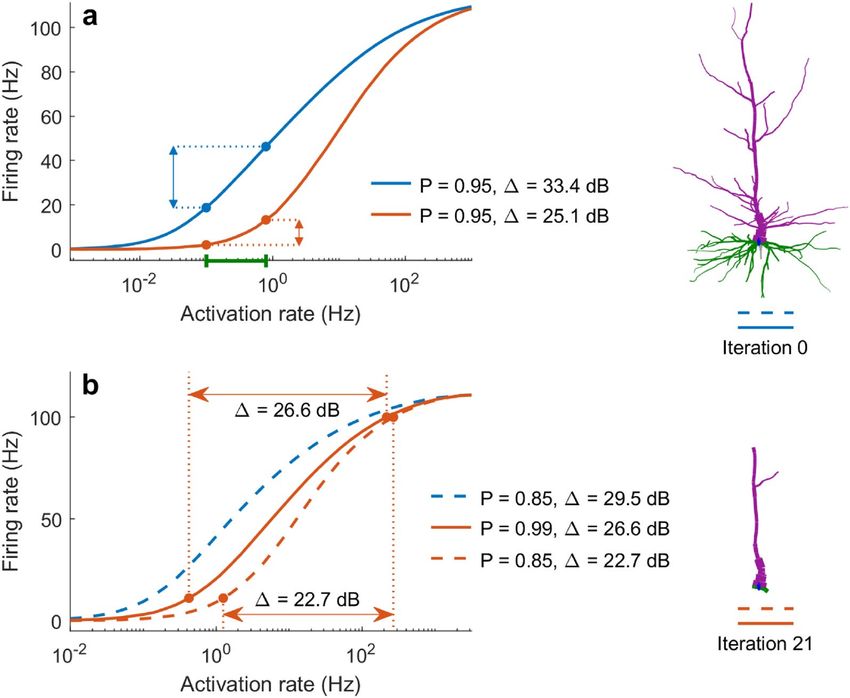
www.nature.com/scientificreports/
Figure 3. Effect of aging on total energy consumption. The total energy consumption is the total number
of dendritic spikes per somatic spikes (see “Methods” for a formal definition). (a) Snapshots of the Neuron
A after pruning iterations. (b) The total energy consumption of the neuron as a function of the pruning
iteration, averaged over the parameter space 0.5 ≤ P ≤ 1 and 10−2 ≤ h ≤ 103. (c) Snapshots of the total energy
consumption at specific pruning iterations over a range of parameters P and h. The number at the top of each
panel represents the iteration (marked by the vertical lines in b).
other neurons. In each case, the point at which the number of somatic stems reduces to 1 (red arrow) closely
corresponds to the most inefficient state (Fig. 6c).
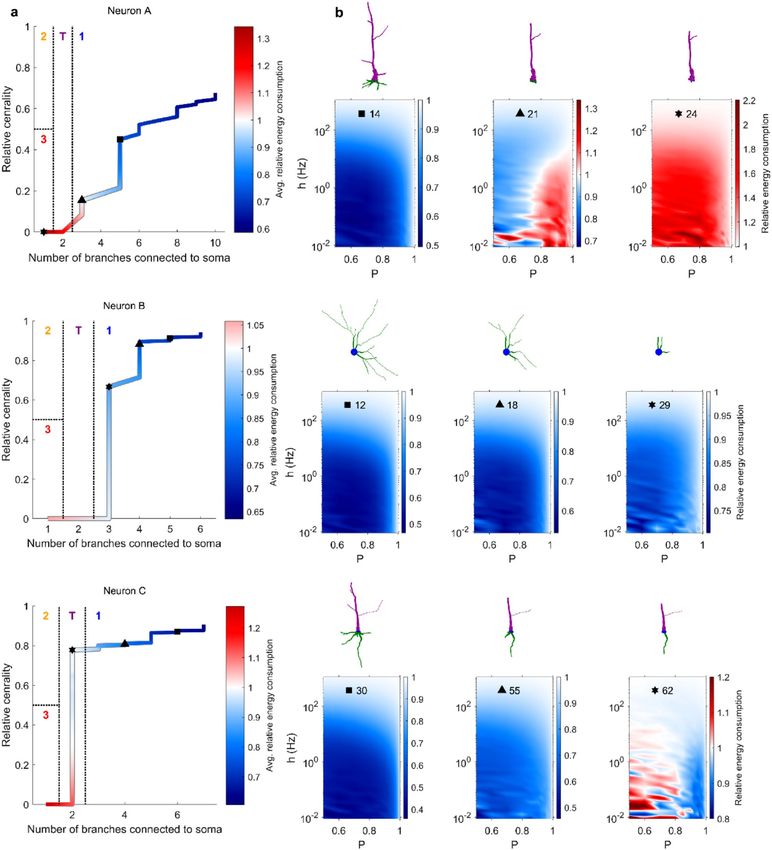
In a previous w ork30, we proposed a functional classification of different types of neurons based on their
relative energy consumption (Fig. 2h). Neurons were grouped into four categories depending on the relative
centrality of the soma, and the number of dendritic branches connected to the soma. Type 1 indicates energy
efficient neurons and have multiple branches connected to the soma; Type 2 neurons and the transition Type
T have both efficient and inefficient regions but Type 2 has only one branch connected to the soma while Type
T has bitufted neurons (which have two dendritic branches connected to the soma); and Type 3 neurons are
inefficient. This classification can be used to explore the relationship between changes in neuronal topology that
takes place with pruning and energy efficiency. We subjected neurons to aging, and mapped them into the clas-
sification space according to the structural changes that occur (Fig. 7). As aging progresses, dendritic pruning
increases, and both centrality and the number of branches connected to the soma decrease. In this process that
takes place with age, energy efficient neurons of Type 1 approach and cross to the transition Type T and then to
Type 3, which is inefficient. Crucially, the process is not homogeneous as some pruning steps yield large jumps
in this parameter space whereas others are essentially harmless.
Discussion
Aging in the brain can have adverse effects on memory and normal cognitive function. Similar impairments can
also be observed in neurodegenerative diseases such as dementia and Alzheimer’s d isease11,21. Understanding
how dendritic recession contributes to this can be an important step in the mitigation and prevention of some
of the negative effects. Here we put forward a model of dendritic pruning to study the dynamical and functional
effects of aging and neurodegeneration at the neuronal level. We find that dendritic pruning reduces the total
energy consumption. However, despite that, the neuron also becomes less efficient, as it usually requires more
dendritic spikes to generate a neuronal spike. Moreover, this pruning reduces the dynamic range, the neuron’s
ability to distinguish incoming input that varies over several orders of magnitude.
There is a notion of “successful” aging, in which the impairments caused by age are m inimal6,34. What are
the criteria under which a neuron may continue to function normally while undergoing dendritic recession?
Our results suggest that the centrality of the soma is a main indicator of the neuron’s resilience to aging, or a
“neuronal reserve”, as an analogy to brain r eserve28, neural r eserve35–37, and cognitive r eserve29. As aging accu-
mulates, the centrality of neurons is reduced and the relative energy consumption increases (Fig. 7c), however,
for all neurons the relative energy consumption only surpasses the threshold of 1 (a turning point at which the
neuron becomes inefficient) for values of centrality smaller than 0.3. For example, neurons B and C have somas
Scientific Reports | (2021) 11:1309 | https://doi.org/10.1038/s41598-020-78815-z 5
Vol.:(0123456789)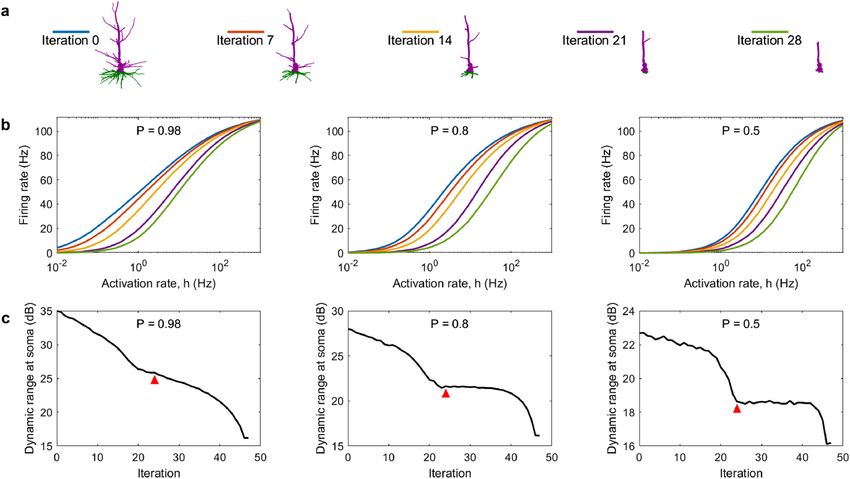
www.nature.com/scientificreports/

                                            Figure 4.  Effect of aging on relative energy consumption. The relative energy consumption is the mean number
                                            of dendritic spikes (across dendritic compartments) per number of somatic spikes (see “Methods” for a formal
                                            definition). (a) Snapshots of the Neuron A after pruning iterations. (b) The relative energy consumption of the
                                            neuron as a function of the pruning iteration, averaged over the parameter space 0.5 ≤ P ≤ 1 and 10−2 ≤ h ≤ 103.
                                            (c) Snapshots of the relative energy consumption at specific pruning iterations over a range of parameters P and h.
                                            The number at the top of each panel represents the iteration (marked by the vertical lines in b).

                                            Figure 5.  Change in dynamic range as a result of dendritic pruning. (a) Neuron A for different pruning
                                            iterations. (b) Response function of the soma at various iterations corresponding to the plots in (a). (c) Dynamic
                                            range at the soma for various P values. The red arrow indicates the point at which the neuron reduces to a single
                                            segment with no bifurcations (iteration 24). Please note the different scales.

          Scientific Reports |   (2021) 11:1309 |                https://doi.org/10.1038/s41598-020-78815-z                                                  6

Vol:.(1234567890)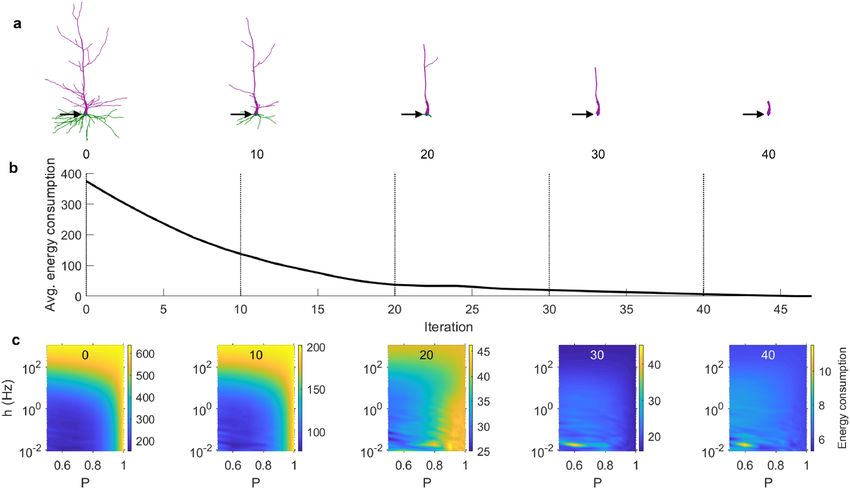
www.nature.com/scientificreports/

                                  Figure 6.  Effect of aging in the dynamics of different neurons. See “Methods” and Table 1 for a detailed
                                  description of the neurons. (a) Digital recreation of intact neurons. The soma is shown in blue, basal dendrites
                                  in green, and apical dendrites in purple. (b) The total energy consumption of the neurons as a function of
                                  the pruning iteration, averaged over the parameter space 0.5 ≤ P ≤ 1 and 10−2 ≤ h ≤ 103. (c) The relative
                                  energy consumption of the neuron as a function of the pruning iteration, averaged over the parameter space
                                  0.5 ≤ P ≤ 1 and 10−2 ≤ h ≤ 103. Energy efficient stages are represented by the blue region, while energy
                                  inefficient stages are represented by the red region. (d) Dynamic range at the soma for P = 0.8. The red arrows
                                  mark the iteration at which the neuron is reduced to a single branch with no bifurcations.

                                  that are located more centrally (Fig. 7). The more central a soma is located, the more evenly the dendrites are
                                  pruned towards the soma, allowing it to maintain its high centrality over many pruning iterations. Neurons with
                                  central somas are able to achieve better efficiency of the dendritic tree (lower relative energy consumption). In

Scientific Reports |   (2021) 11:1309 |                https://doi.org/10.1038/s41598-020-78815-z                                                    7

                                                                                                                                              Vol.:(0123456789)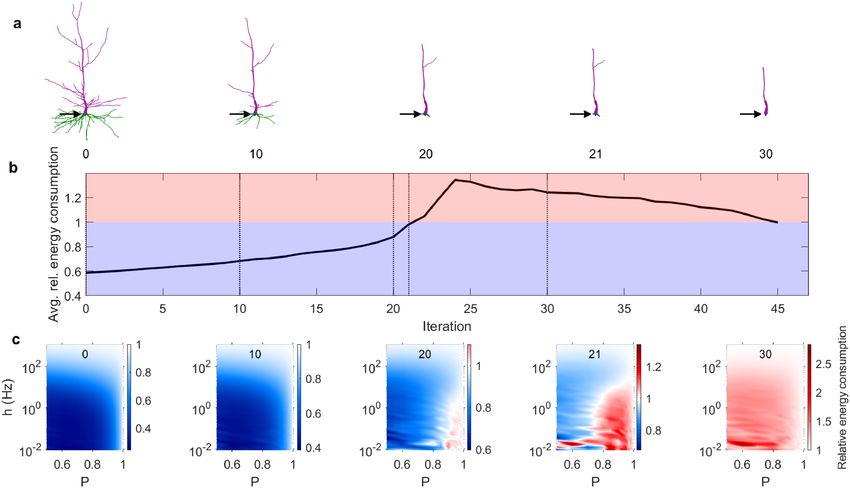
www.nature.com/scientificreports/

                                            Figure 7.  Neuronal classification scheme varies with pruning. (a) Evolution of seven neurons in the branch-
                                            centrality space that is used for classification. Color corresponds to the relative energy consumption, averaged
                                            over the parameter space 0.5 ≤ P ≤ 1 and 10−2 ≤ h ≤ 103. The three symbols (square, triangle, and star)
                                            indicate the points at which snapshots are shown in panel b. (b) Snapshots of the dendritic structure and
                                            corresponding relative energy consumption profile after the specified number of pruning iterations. (c) Relative
                                            energy consumption of neurons as a function of centrality. With pruning iterations, the centrality decreases
                                            (marked by the direction of the black arrow, and also shown in Fig. 1e).

          Scientific Reports |   (2021) 11:1309 |               https://doi.org/10.1038/s41598-020-78815-z                                                     8

Vol:.(1234567890)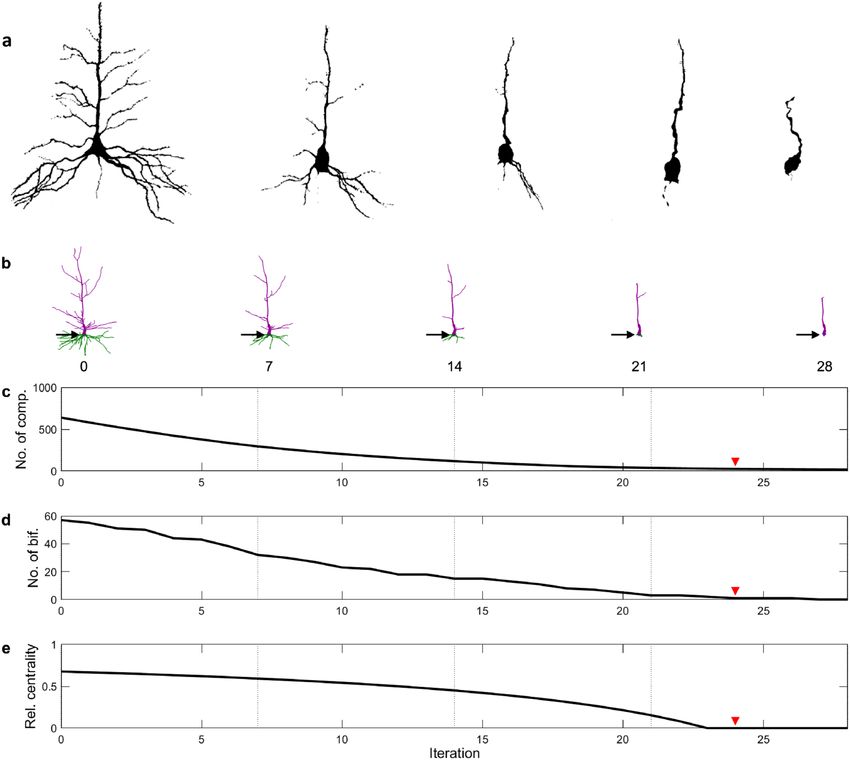
www.nature.com/scientificreports/

                                  Figure 7.  (continued)

Scientific Reports |   (2021) 11:1309 |               https://doi.org/10.1038/s41598-020-78815-z        9

                                                                                                   Vol.:(0123456789)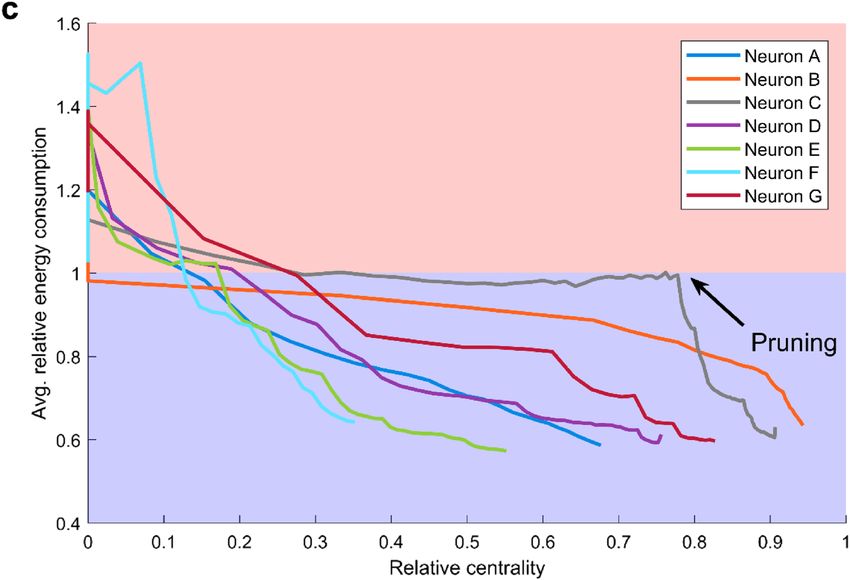
www.nature.com/scientificreports/
Figure 7. (continued)
contrast, a non-central soma results in an asymmetric pruning, which in turn puts the soma at an even less cen-
tral position. This accelerated reduction in centrality is more clearly observed for neurons with lower centrality,
such as Neurons E and F (Fig. 7, see also Fig. 6c). Therefore, our results suggest that the centrality of the soma
can be considered a protective factor that is crucial to preserve neuronal performance, and a main indicator of
neuronal reserve (or m aintenance34), which quantifies the neuronal resilience to aging.
Modeling studies with neurons with idealized and regular tree structure showed that the size of dendritic
trees plays a major role to increase the dynamic r ange38. A prediction from these regular Cayley trees was that
large dendrites amplify weak incoming stimuli and the dynamic r ange32. Our results are consistent with these
predictions. Furthermore, previous work concluded that bifurcations are an important topological feature that
can increase the dynamic range30. Consistently with these results, a reduction in size and complexity of dendrites
implies a lower dynamic range. However, our results also show that the dendritic pruning affects the dynamic
range non-homogenously. We have shown that neurons can eventually reduce to a single-branch neuron dur-
ing their aging process. This is a landmark topology that affects the dynamic range and energy consumption
of neurons. A single-branch neuron is a one-dimensional network of coupled active units, for which analytical
approximations are k nown39. For example, the approximations predict that the dynamic range is enhanced for
higher values of P, which is in agreement with our results (Fig. 4). For the multi-dimensional case, mean-field
approximations also exist to determine the maximum dynamic range a system can attain40. Our results dem-
onstrate that the dynamic range of young neurons decreases as more dendritic compartments are removed.
In contrast, the dynamic range of aged (nearly one-dimensional) neurons remains essentially stable for lower
values of P (Fig. 5). Here, for simplicity, we considered equivalent all dendritic compartments. Future work can
separately assess the effects of dendritic pruning at apical and basal dendrites, which can be particularly relevant
in the context of cortical columns and laminar p rocessing41.
Our aim was to characterize the effects of dendritic pruning at the neuronal level. However, the brain is a
multiscale system, and topological changes caused by dendritic pruning also affect the number of synapses and
the connectivity of neuronal circuits. Numerous modelling studies indicate that changes in the connectivity
between neurons can shape their dynamics33,42–45. Hence, the connectivity and topology of larger ensembles of
interconnected neurons is also important for both neuronal and network activity33,46, and additional factors and
properties that were not accounted for here, such as synaptic plasticity and excitatory-inhibitory balance, emerge
at larger scales. There are many examples of complex phenomena that take place as a collective behavior of many
interacting neurons, and intricate mechanisms involved in the dynamics depend on the topology of the network,
which is clearly shown in neuronal cultures47,48. Future work simulating the dynamics of a large network of neu-
rons may be explored to assess the impact of dendritic loss on the topology and dynamics of neuronal networks.
Currently, the timescales involved in the dendritic recession in aging neurons are not known. Here, we have made
the assumption that the dendrites are pruned progressively and evenly. Over time, this successfully reproduces
morphologies with reduced complexity and size that have been observed experimentally (Fig. 1). In the future,
our algorithm can be modified to stochastically remove N terminal compartments per iteration. Furthermore,
it has also been suggested that aging neurons can lose whole branches at a t ime13. This could be implemented by
removing random compartments, and all of their children, per iteration. By observing the severity in the change
of dynamic range caused by such a removal, it may be possible to identify dendritic segments that are critical in
maintaining the proper functioning of the neuron.
Scientific Reports | (2021) 11:1309 | https://doi.org/10.1038/s41598-020-78815-z 10
Vol:.(1234567890)www.nature.com/scientificreports/
Figure 8. Effects of aging on the neuronal dynamic range. (a) The response functions of a young (blue) and
aged (orange) neuron reveal that young neurons can more effectively distinguish and encode similar strengths of
input (green) because they have a larger dynamic range. Here, P = 0.95. (b) Aging-related pruning decreases the
dynamic range of neurons. By increasing the dendritic excitability, P, ageing neurons can partially mitigate this
effect (solid orange line).
Functional decline in working memory that takes place during aging can be associated to the function
of specific neuron types1. Cognitive studies of human subjects have revealed that memory degradation can
especially inhibit the ability to discern similar experiences, called pattern s eparation49,50. Our results suggest a
neural basis of these behavioral effects of aging. If we assume that similar patterns correspond to similar rates
of synaptic input, we can compare the neuronal output for these values of input of an aged neuron to a neuron
whose dendritic integrity is intact (Fig. 8a). Because young neurons have larger dynamic range, for slight varia-
tions in relatively weak stimuli, we can see that dendritic pruning adversely affects the neuron’s ability to discern
changes of input strength, which can lead to an impairment in pattern separation, or the ability to distinguish
between the different input values.
Moreover, it has been shown in primates that by manipulating potassium channels, it is possible to partially
restore the physiological integrity of neurons1. Following a similar approach, our results indicate that excitability
could also be explored to mitigate reduced cognitive abilities in elderly. In particular, the dynamical effects of
aging on the response function and dynamic range can be at least partially restored by increasing the neuronal
excitability P (Fig. 8b). Because this parameter in our model is rather general and unspecific, multiple possible
electrophysiological manipulations could give rise to this net effect over P. Although further work is required,
these ideas of rejuvenating neuronal dynamics can be a promising avenue of future research in an aging society.
Methods
Neurons and database. Detailed digital reconstructions of neurons were taken from the NeuroMorpho
database51–56. The dendritic branches are made up of often thousands of connected compartments and include
many bifurcations. Here, the soma is represented as a single compartment. The list of neuron reconstructions
used here is given in Table 1.
Pruning algorithm. It has been shown that the dendritic arbor in aging neurons can retract, decreasing
both in size and complexity (branching order)13,15,19. For this study, we considered an iterative approach to simu-
late these changes. We start with the full neuron reconstruction, as provided by NeuroMorpho. A compartment
that does not have any children is considered a terminus. In each iteration, we remove all terminal dendritic
compartments. This has the effect of progressively pruning each branch towards the soma. Our main focus is
Scientific Reports | (2021) 11:1309 | https://doi.org/10.1038/s41598-020-78815-z 11
Vol.:(0123456789)www.nature.com/scientificreports/
Number of somatic Number of Number of
Label Cell type Species branches compartments bifurcations NeuroMorpho ID Reference
58
A Pyramidal Human 10 640 49 NMO_84457
59
B Pyramidal Human 6 413 24 NMO_03500
57
C Pyramidal Human 7 1091 222 NMO_01064
57
D Pyramidal Human 7 1441 213 NMO_01058
60
E Purkinje Mouse 1 1568 129 NMO_54509
61
F Pyramidal Rat 6 708 17 NMO_34958
62
G Ganglion Mouse 6 3936 50 NMO_08168
Table 1. List of neuron reconstructions used in this study, taken from NeuroMorpho.Org (version 7.6).
Neurons C and D were obtained from the same individual57.
on the effects of topology on neuronal dynamics. Since the neurodynamical model used here does not explicitly
model synapses, synaptic changes relating to aging6 are ignored. Similarly, changes in the shape or radius of
dendritic branches13, as well as chemical changes63, are not explicitly modeled.
Neuronal dynamics. Dendritic spikes were modeled using an excitable network of dendritic compart-
ments seen in previous studies32,33,64. Compartments are modelled as probabilistic cellular automata with syn-
chronous update65. A compartment in the susceptible state can be activated either by receiving the signal from
a neighboring compartment with probability P, or by external input with rate h30,32,43. External inputs represent
dendritic spikes invoked by synapses. Since not much data is available regarding the locations of synapses along
the dendrites (there can be thousands), and since many underlying factors are responsible in the synaptic trans-
mission process, the external input was modeled stochastically, with the probability of activation at some time
step given by r = 1 − exp(−h × δt), where δt is the time resolution (0.001 s). Active compartments will transi-
tion to the refractory state in the next time step, in which they remain for 7 steps, preventing sustained activity66,
then revert to the quiescent state. The three states correspond to the spiking behavior of electrically excited
compartments (Fig. 2b,c).
Average compartmental firing rates as a function of h are used to construct the response function (illustrated
in Fig. 2e). It maps the input–output behavior of the compartment30. A characteristic quantity derived from the
response function is the dynamic range, defined as
h90
= log10 × 10,
h10
where h10 is the input rate required to produce F10, and h90 is the input rate required to produce F90. Fx is the
firing rate that corresponds to x % of the maximum possible firing r ate33.
The simulations were run for a duration of 500,000 time steps for neurons A–D and 100,000 time steps for
neurons E–G on each pruning iteration. The activation rate h was varied over several orders of magnitudes, and
the propagation probability P was varied over 0.5 ≤ P ≤ 1. We have neglected P < 0.5 because the signal dies
out quickly in this regime.
Energy consumption. Energy is required to control the movement of ions during a dendritic spike. Despite
differences in behavior due to variations in chemical and geometric properties of the dendritic membrane, we
generalize spikes such that a firing compartment consumes one unit of energy30. Therefore, the energy required
to generate a spike at the soma is given by the ratio of the number of spikes in dendritic compartments to the
number of somatic spikes during the course of the simulation:
N
Si
E = i=1 ,
S0
where Si refers to the total number of spikes in compartment i , compartment 0 refers to the soma, and there are
N dendritic compartments.
To gauge how effectively the neuron uses its dendrites to generate somatic spikes, we use a similar measure,
called the relative energy consumption,
N
Si /N
Erel = i=1 .
S0
If Erel < 1, dendritic compartments generally fire less often than the soma. Dendritic spikes are required only
for integration24, whereas somatic spikes are vital because they directly govern the functioning of the n
euron67,68.
Thus, we say that the neuron is energy efficient. Conversely, if Erel > 1, the neuron is energy inefficient.
Soma centrality. A compartment’s centrality is defined as the distance (number of compartments) to the
farthest terminal compartment, located in one of the edges of the neuron. It is then normalized and scaled
Scientific Reports | (2021) 11:1309 | https://doi.org/10.1038/s41598-020-78815-z 12
Vol:.(1234567890)www.nature.com/scientificreports/
between 0 and 1, relative to the centralities of all other compartments30. The least central compartment has a
centrality of 0 and has the farthest distance to a terminal compartment, while the most central compartment in a
neuron has a centrality of 1 and it has the shortest distance to the most far compartment of the neuron. Because
neurons are trees, which can be considered as connected networks without loops, this measure of centrality is
well defined for each compartment. Here we will focus on the centrality of the soma, and for simplicity, we will
call it only “centrality”. In Graph theory, there are various measures of node centrality69–71, including degree72,
participation index73, betweenness centrality74,75, and eigenvector centrality76. These metrics were designed to
estimate the relevance of a node arbitrary complex networks and have found applications in many systems69.
Our simple mesure of centrality proposed here is designed to capture a basic topological feature of the soma
position with respect to dendritic compartments. Detailed examples of relative centrality in a variety of neurons
are presented in reference30.
Code availability
MATLAB code for simulating neurodynamics and dendritic pruning for any neuron in the NeuroMorpho
database is available at http://www.sng.org.au/Downloads.
Received: 18 February 2020; Accepted: 13 November 2020
References
1. Wang, M. et al. Neuronal basis of age-related working memory decline. Nature 476(7359), 210 (2011).
2. Cabeza, R. et al. Task-independent and task-specific age effects on brain activity during working memory, visual attention and
episodic retrieval. Cereb. Cortex 14(4), 364–375 (2004).
3. Cabeza, R. et al. Age-related differences in neural activity during item and temporal-order memory retrieval: a positron emission
tomography study. J. Cogn. Neurosci. 12(1), 197–206 (2000).
4. Turner, G. R. & Spreng, R. N. Executive functions and neurocognitive aging: dissociable patterns of brain activity. Neurobiol. Aging
33(4), 826 (2012).
5. Yankner, B. A., Lu, T. & Loerch, P. The aging brain. Annu. Rev. Pathmech Dis. Mech. Dis. 3, 41–66 (2008).
6. Dickstein, D. L. et al. Dendritic spine changes associated with normal aging. Neuroscience 251, 21–32 (2013).
7. Mavroudis, I. A. et al. Age-related dendritic and spinal alterations of pyramidal cells of the human visual cortex. Folia Neuropathol.
53(2), 1–11 (2015).
8. Samson, R. D. & Barnes, C. A. Impact of aging brain circuits on cognition. Eur. J. Neurosci. 37(12), 1903–1915 (2013).
9. Marstaller, L. et al. Aging and large-scale functional networks: white matter integrity, gray matter volume, and functional con-
nectivity in the resting state. Neuroscience 290, 369–378 (2015).
10. Thibault, O., Gant, J. C. & Landfield, P. W. Expansion of the calcium hypothesis of brain aging and Alzheimer’s disease: minding
the store. Aging Cell 6(3), 307–317 (2007).
11. Dickstein, D. L. et al. Changes in the structural complexity of the aged brain. Aging Cell 6(3), 275–284 (2007).
12. Peters, A. Structural changes that occur during normal aging of primate cerebral hemispheres. Neurosci. Biobehav. Rev. 26(7),
733–741 (2002).
13. Scheibel, M. E. et al. Progressive dendritic changes in aging human cortex. Exp. Neurol. 47(3), 392–403 (1975).
14. Peters, A., Sethares, C. & Moss, M. B. The effects of aging on layer 1 in area 46 of prefrontal cortex in the rhesus monkey. Cereb.
Cortex 8(8), 671–684 (1998).
15. Shimada, A. et al. Apical vulnerability to dendritic retraction in prefrontal neurones of ageing SAMP10 mouse: a model of cerebral
degeneration. Neuropathol. Appl. Neurobiol. 32(1), 1–14 (2006).
16. Duan, H. et al. Age-related dendritic and spine changes in corticocortically projecting neurons in macaque monkeys. Cereb. Cortex
13(9), 950–961 (2003).
17. Zhang, C. et al. Age-related changes of structures in cerebellar cortex of cat. J. Biosci. 31(1), 55–60 (2006).
18. Nakamura, S. et al. Age-related changes of pyramidal cell basal dendrites in layers III and V of human motor cortex: a quantitative
Golgi study. Acta Neuropathol. 65(3–4), 281–284 (1985).
19. Zhang, C., Zhu, Q. & Hua, T. Aging of cerebellar Purkinje cells. Cell Tissue Res. 341(3), 341–347 (2010).
20. Burke, S. N. & Barnes, C. A. Neural plasticity in the ageing brain. Nat. Rev. Neurosci. 7(1), 30 (2006).
21. Luebke, J. I. et al. Dendritic vulnerability in neurodegenerative disease: insights from analyses of cortical pyramidal neurons in
transgenic mouse models. Brain Struct. Funct. 214(2–3), 181–199 (2010).
22. Zhang Y. et al. Dendritic complexity change in the triple transgenic mouse model of Alzheimer’s disease. PeerJ 8, e8178 (2020).
23. Häusser, M. & Mel, B. Dendrites: bug or feature?. Curr. Opin. Neurobiol. 13(3), 372–383 (2003).
24. London, M. & Häusser, M. Dendritic computation. Annu. Rev. Neurosci. 28, 503–532 (2005).
25. Cuntz, H. et al. One rule to grow them all: a general theory of neuronal branching and its practical application. PLoS Comput. Biol.
6(8), e1000877 (2010).
26. Elias, M. F. et al. Framingham stroke risk profile and lowered cognitive performance. Stroke 35(2), 404–409 (2004).
27. Cuntz, H., Borst, A. & Segev, I. Optimization principles of dendritic structure. Theor. Biol. Med. Model. 4(1), 21 (2007).
28. Valenzuela, M. J. & Sachdev, P. Brain reserve and dementia: a systematic review. Psychol. Med. 36(4), 441–454 (2006).
29. Stern, Y. Cognitive reserve. Neuropsychologia 47(10), 2015–2028 (2009).
30. Kirch, C. & Gollo, L. L. Spatially resolved dendritic integration: Towards a functional classification of neurons. PeerJ 8, e10250
(2020).
31. Cuntz, H. et al. Preserving neural function under extreme scaling. PLoS ONE 8(8), e71540 (2013).
32. Gollo, L. L., Kinouchi, O. & Copelli, M. Active dendrites enhance neuronal dynamic range. PLoS Comput. Biol. 5(6), e1000402
(2009).
33. Kinouchi, O. & Copelli, M. Optimal dynamical range of excitable networks at criticality. Nat. Phys. 2(5), 348 (2006).
34. Nyberg, L. et al. Memory aging and brain maintenance. Trends Cogn. Sci. 16(5), 292–305 (2012).
35. Steffener, J. & Stern, Y. Exploring the neural basis of cognitive reserve in aging. Biochim. Biophys. Acta 1822(3), 467–473 (2012).
36. Wilson, R. S. et al. Neural reserve, neuronal density in the locus ceruleus, and cognitive decline. Neurology 80(13), 1202–1208
(2013).
37. Perani, D. & Abutalebi, J. Bilingualism, dementia, cognitive and neural reserve. Curr. Opin. Neurol. 28(6), 618–625 (2015).
38. Gollo, L. L., Kinouchi, O. & Copelli, M. Statistical physics approach to dendritic computation: the excitable-wave mean-field
approximation. Phys. Rev. E 85(1), 011911 (2012).
39. Furtado, L. S. & Copelli, M. Response of electrically coupled spiking neurons: a cellular automaton approach. Phys. Rev. E 73(1),
011907 (2006).
Scientific Reports | (2021) 11:1309 | https://doi.org/10.1038/s41598-020-78815-z 13
Vol.:(0123456789)www.nature.com/scientificreports/
40. Assis, V. R. & Copelli, M. Dynamic range of hypercubic stochastic excitable media. Phys. Rev. E 77(1), 011923 (2008).
41. Hirsch, J. A. & Martinez, L. M. Laminar processing in the visual cortical column. Curr. Opin. Neurobiol. 16(4), 377–384 (2006).
42. Gollo, L. L. et al. Mechanisms of zero-lag synchronization in cortical motifs. PLoS Comput. Biol. 10(4), e1003548 (2014).
43. Gollo, L. L., Mirasso, C. & Eguíluz, V. M. Signal integration enhances the dynamic range in neuronal systems. Phys. Rev. E 85(4),
040902 (2012).
44. Sanzeni, A., Histed, M. H. & Brunel, N. Response nonlinearities in networks of spiking neurons. PLoS Comput. Biol. 16(9), e1008165
(2020).
45. Bojanek, K., Zhu, Y. & MacLean, J. Cyclic transitions between higher order motifs underlie sustained asynchronous spiking in
sparse recurrent networks. PLoS Comput. Biol. 16(9), e1007409 (2020).
46. Runyan, C. A. et al. Distinct timescales of population coding across cortex. Nature 548(7665), 92–96 (2017).
47. Faci-Lázaro, S., Soriano, J. & Gómez-Gardeñes, J. Impact of targeted attack on the spontaneous activity in spatial and biologically-
inspired neuronal networks. Chaos 29(8), 083126 (2019).
48. Orlandi, J. G. et al. Noise focusing and the emergence of coherent activity in neuronal cultures. Nat. Phys. 9(9), 582–590 (2013).
49. Toner, C. K. et al. Visual object pattern separation deficits in nondemented older adults. Learn. Mem. 16(5), 338–342 (2009).
50. Stark, S. M., Yassa, M. A. & Stark, C. E. Individual differences in spatial pattern separation performance associated with healthy
aging in humans. Learn. Mem. 17(6), 284–288 (2010).
51. Ascoli, G. A. Sharing neuron data: carrots, sticks, and digital records. PLoS Biol. 13(10), e1002275 (2015).
52. Ascoli, G. A., Donohue, D. E. & Halavi, M. NeuroMorpho.Org: a central resource for neuronal morphologies. J. Neurosci. 27(35),
9247–9251 (2007).
53. Ascoli, G. A. et al. Win–win data sharing in neuroscience. Nat. Methods 14(2), 112 (2017).
54. Halavi, M. et al. Digital reconstructions of neuronal morphology: three decades of research trends. Front. Neurosci. 6, 49 (2012).
55. Halavi, M. et al. NeuroMorpho. Org implementation of digital neuroscience: dense coverage and integration with the NIF. Neu-
roinformatics 6(3), 241 (2008).
56. Parekh, R. & Ascoli, G. A. Neuronal morphology goes digital: a research hub for cellular and system neuroscience. Neuron 77(6),
1017–1038 (2013).
57. Watson, K. K., Jones, T. K. & Allman, J. M. Dendritic architecture of the von Economo neurons. Neuroscience 141(3), 1107–1112
(2006).
58. Jacobs, B. et al. Comparative morphology of gigantopyramidal neurons in primary motor cortex across mammals. J. Comp. Neurol.
526(3), 496–536 (2018).
59. Jacobs, B. et al. Regional dendritic and spine variation in human cerebral cortex: a quantitative golgi study. Cereb. Cortex 11(6),
558–571 (2001).
60. Fukumitsu, K. et al. Mitochondrial fission protein Drp1 regulates mitochondrial transport and dendritic arborization in cerebellar
Purkinje cells. Mol. Cell. Neurosci. 71, 56–65 (2016).
61. Routh, B. N. et al. Anatomical and electrophysiological comparison of CA1 pyramidal neurons of the rat and mouse. J. Neurophysiol.
102(4), 2288–2302 (2009).
62. Mazzoni, F., Novelli, E. & Strettoi, E. Retinal ganglion cells survive and maintain normal dendritic morphology in a mouse model
of inherited photoreceptor degeneration. J. Neurosci. 28(52), 14282–14292 (2008).
63. Wojda, U., Salinska, E. & Kuznicki, J. Calcium ions in neuronal degeneration. IUBMB Life 60(9), 575–590 (2008).
64. Gollo, L. L., Copelli, M. & Roberts, J. A. Diversity improves performance in excitable networks. PeerJ 4, e1912 (2016).
65. Greenberg, J. M. & Hastings, S. Spatial patterns for discrete models of diffusion in excitable media. SIAM J. Appl. Math. 34(3),
515–523 (1978).
66. Gollo, L. L., Kinouchi, O. & Copelli, M. Single-neuron criticality optimizes analog dendritic computation. Sci. Rep. 3(1), 1–9 (2013).
67. Gautrais, J. & Thorpe, S. Rate coding versus temporal order coding: a theoretical approach. Biosystems 48(1–3), 57–65 (1998).
68. Perkel, D. H. & Bullock, T. H. Neural coding. Neurosci. Res. Bull. 6, 221–348 (1968).
69. de Pasquale, F. et al. Cortical cores in network dynamics. Neuroimage 180, 370–382 (2018).
70. Kale, P., Zalesky, A. & Gollo, L. L. Estimating the impact of structural directionality: how reliable are undirected connectomes?.
Netw. Neurosci. 2(02), 259–284 (2018).
71. Freeman, L. C. Centrality in social networks conceptual clarification. Soc. Netw. 1(3), 215–239 (1978).
72. Sporns, O., Honey, C. J. & Kötter, R. Identification and classification of hubs in brain networks. PLoS ONE 2(10), e1049 (2007).
73. Guimera, R. & Amaral, L. A. N. Functional cartography of complex metabolic networks. Nature 433(7028), 895–900 (2005).
74. Zuo, X.-N. et al. Network centrality in the human functional connectome. Cereb. Cortex 22(8), 1862–1875 (2012).
75. Nigam, S. et al. Rich-club organization in effective connectivity among cortical neurons. J. Neurosci. 36(3), 670–684 (2016).
76. Lohmann, G. et al. Eigenvector centrality mapping for analyzing connectivity patterns in fMRI data of the human brain. PLoS
ONE 5(4), e10232 (2010).
Author contributions
Conceived and designed the simulations: C.K. and L.L.G. Performed the simulations and analyzed results: C.K.
Contributed to analysis: L.L.G. Wrote the paper: C.K and L.L.G.
Funding
Funding was provided by Australian Research Council and the Australian National Health and Medical Research
Council (Grant no. APP1110975).
Competing interests
The authors declare no competing interests.
Additional information
Supplementary Information The online version contains supplementary material available at https://doi.
org/10.1038/s41598-020-78815-z.
Correspondence and requests for materials should be addressed to L.L.G.
Reprints and permissions information is available at www.nature.com/reprints.
Publisher’s note Springer Nature remains neutral with regard to jurisdictional claims in published maps and
institutional affiliations.
Scientific Reports | (2021) 11:1309 | https://doi.org/10.1038/s41598-020-78815-z 14
Vol:.(1234567890)www.nature.com/scientificreports/
Open Access This article is licensed under a Creative Commons Attribution 4.0 International
License, which permits use, sharing, adaptation, distribution and reproduction in any medium or
format, as long as you give appropriate credit to the original author(s) and the source, provide a link to the
Creative Commons licence, and indicate if changes were made. The images or other third party material in this
article are included in the article’s Creative Commons licence, unless indicated otherwise in a credit line to the
material. If material is not included in the article’s Creative Commons licence and your intended use is not
permitted by statutory regulation or exceeds the permitted use, you will need to obtain permission directly from
the copyright holder. To view a copy of this licence, visit http://creativecommons.org/licenses/by/4.0/.
© The Author(s) 2021
Scientific Reports | (2021) 11:1309 | https://doi.org/10.1038/s41598-020-78815-z 15
Vol.:(0123456789)You can also read