Resting Energy Expenditure of Master Athletes: Accuracy of Predictive Equations and Primary Determinants - eLib
←
→
Page content transcription
If your browser does not render page correctly, please read the page content below
ORIGINAL RESEARCH
                                                                                                                                                 published: 22 March 2021
                                                                                                                                          doi: 10.3389/fphys.2021.641455

                                                Resting Energy Expenditure of
                                                Master Athletes: Accuracy of
                                                Predictive Equations and Primary
                                                Determinants
                                                Petra Frings-Meuthen 1* , Sara Henkel 1 , Michael Boschmann 2 , Philip D. Chilibeck 3 ,
                                                José Ramón Alvero Cruz 4 , Fabian Hoffmann 1,5 , Stefan Möstl 1 , Uwe Mittag 1 ,
                                                Edwin Mulder 1 , Natia Rittweger 1 , Wolfram Sies 1 , Hirofumi Tanaka 6 and Jörn Rittweger 1,7
                                                1
                                                 German Aerospace Center (DLR), Institute of Aerospace Medicine, Cologne, Germany, 2 Experimental and Clinical
                                                Research Center – a joint co-operation between Charité Universitätsmedizin Berlin and Max Delbrück Center for Molecular
                                                Medicine, Berlin, Germany, 3 College of Kinesiology, University of Saskatchewan, Saskatoon, SK, Canada, 4 Facultad
                                                de Medicina, Instituto de Investigación Biomédica de Málaga, Universidad de Málaga, Málaga, Spain, 5 Department
                                                of Internal Medicine III, University Hospital Cologne, Cologne, Germany, 6 Department of Kinesiology and Health Education,
                                                The University of Texas at Austin, Austin, TX, United States, 7 Department of Pediatrics and Adolsecent Medicine, Hospital
                                                Cologne, Cologne, Germany

                                                Resting energy expenditure (REE) is determined mainly by fat-free mass (FFM). FFM
                                                depends also on daily physical activity. REE normally decreases with increased age due
                                                to decreases in FFM and physical activity. Measuring REE is essential for estimating
                                                total energy expenditure. As such, there are a number of different equations in use to
                          Edited by:
                     Romuald Lepers,
                                                predict REE. In recent years, an increasing number of older adults continue to participate
     Université de Bourgogne, France            in competitive sports creating the surge of master athletes. It is currently unclear if
                       Reviewed by:             these equations developed primarily for the general population are also valid for highly
                      Manfred Müller,
                                                active, older master athletes. Therefore, we tested the validity of six commonly-used
          University of Kiel, Germany
                   Luke Del Vecchio,            equations for predicting REE in master athletes. In conjunction with the World Masters
  Southern Cross University, Australia          Athletic Championship in Malaga, Spain, we measured REE in 113 master athletes
                   *Correspondence:             by indirect calorimetry. The most commonly used equations to predict REE [Harris &
                 Petra Frings-Meuthen
          petra.frings-meuthen@dlr.de
                                                Benedict (H&B), World Health Organization (WHO), Müller (MÜL), Müller-FFM (MÜL-
                                                FFM), Cunningham (CUN), and De Lorenzo (LOR)] were tested for their accuracies. The
                   Specialty section:           influences of age, sex, height, body weight, FFM, training hours per week, phase angle,
         This article was submitted to
                   Exercise Physiology,
                                                ambient temperature, and athletic specialization on REE were determined. All estimated
               a section of the journal         REEs for the general population differed significantly from the measured ones (H&B,
               Frontiers in Physiology
                                                WHO, MÜL, MÜL-FFM, CUN, all p < 0.005). The equation put forward by De Lorenzo
       Received: 14 December 2020
                                                provided the most accurate prediction of REE for master athletes, closely followed by
        Accepted: 17 February 2021
         Published: 22 March 2021               FFM-based Cunningham’s equation. The accuracy of the remaining commonly-used
                               Citation:        prediction equations to estimate REE in master athletes are less accurate. Body weight
           Frings-Meuthen P, Henkel S,          (p < 0.001), FFM (p < 0.001), FM (p = 0.007), sex (p = 0.045) and interestingly
          Boschmann M, Chilibeck PD,
 Alvero Cruz JR, Hoffmann F, Möstl S,
                                                temperature (p = 0.004) are the significant predictors of REE. We conclude that REE in
      Mittag U, Mulder E, Rittweger N,          master athletes is primarily determined by body composition and ambient temperature.
     Sies W, Tanaka H and Rittweger J
                                                Our study provides a first estimate of energy requirements for master athletes in order
    (2021) Resting Energy Expenditure
       of Master Athletes: Accuracy of          to cover adequately athletes’ energy and nutrient requirements to maintain their health
      Predictive Equations and Primary          status and physical performance.
                          Determinants.
             Front. Physiol. 12:641455.         Keywords: resting energy expenditure, master athletes, energy metabolism, predictive equation, body
      doi: 10.3389/fphys.2021.641455            composition

Frontiers in Physiology | www.frontiersin.org                                          1                                          March 2021 | Volume 12 | Article 641455
Frings-Meuthen et al. Energy Expenditure of Master Athletes
INTRODUCTION was calculated using the modified Weir equation (Weir, 1949)
as follows:
Master athletes are individuals older than 35 years who continue
physical training and take part in athletic competitions, often
throughout their entire life, which can be regarded as a model REE(kcal/day) = [(VO2 × 3.941) + (VCO2 × 1.11)
of active aging (Tanaka et al., 2019). Over the past decades, + (uN2 × 2.17)] × 1, 440.
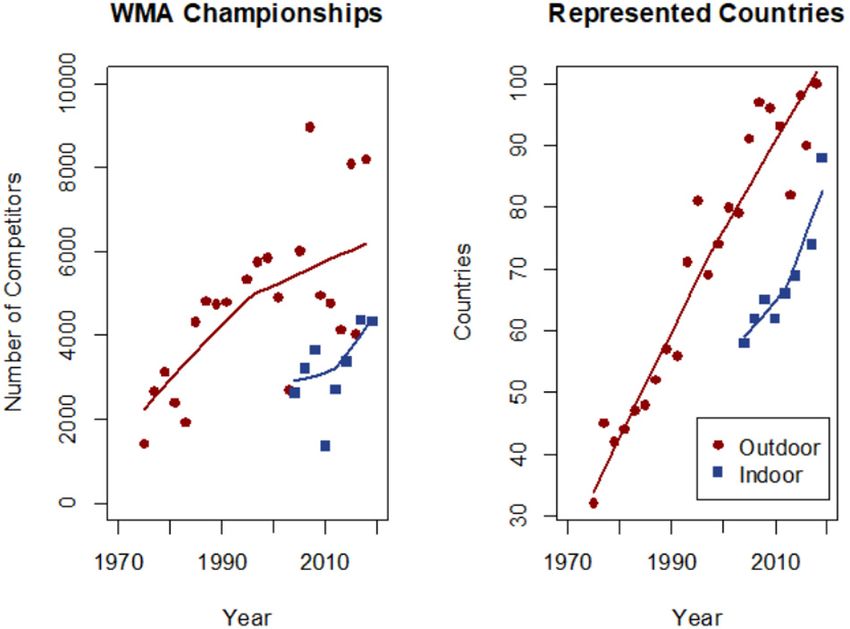
the number of master athletes has increased steadily (Figure 1).
Because of their strenuous training routine and specific demands The urinary nitrogen component (uN2 ) is often excluded when
that age-related physiological changes place, master athletes calculating EE because it only accounts for around 4% of the
have distinct nutritional requirements (Desbrow et al., 2019). true energy expenditure. It contributes only to a small error
A sufficient energy intake is mandatory to maintain overall of 1–2% in the calculation of final REE in both inpatients and
health and competitive performance of these aging athletes outpatients. Thus, the abbreviated equation below is commonly
(Schofield et al., 2019). Resting energy expenditure (REE), the used (Ferrannini, 1988).
fraction of energy at rest to maintain essential body functions,
contributes 60–70% to total daily energy expenditure (TEE). REE (kcal/day) = [(VO2 × 3.941) + (VCO2 × 1.11)] × 1, 440.
REE is determined by fat-free mass (FFM) (Sullo et al., 2004;
Schofield et al., 2019). FFM accounts for 60–70% of the total However, the IC technique is time-consuming, expensive,
REE, and fat mass (FM) for only 5–7% of REE (Johnstone and, unavailable in daily practice. Accordingly, REE as well as
et al., 2005). REE declines with increasing age, which is TEE are often predicted via one of various prediction equations
thought to be primarily driven by the gradual decline in FFM (Vander Weg et al., 2004; ten Haaf and Weijs, 2014; Cherian
due to a loss of muscle mass (Tzankoff and Norris, 1977; et al., 2018; Amaro-Gahete et al., 2019; Schofield et al., 2019). The
Welle and Nair, 1990). Additionally, albeit to a lesser extent, Harris & Benedict (H&B), World Health Organization (WHO),
reduced physical activity contributes to this decline in REE Müller (MÜL), Müller-FFM (MÜL-FFM) and Cunningham
(Poehlman et al., 1991a,b,c; Vaughan et al., 1991). Master (CUN) equations are most commonly used, but none of these
athletes can theoretically counteract such age-related decreases standard prediction equations fits for every individual. While
in FFM and thereby in REE, provided that energy intake H&B, WHO, MÜL only take age, sex, body weight and/or height
levels are sufficient. Having valid and reliable REE values is into account, the equations by Müller-FFM and Cunningham
crucial to establish achievable goals for dietary and exercise also use FFM as a contributing factor (Harris and Benedict,
interventions involving master athletes (Amaro-Gahete et al., 1918; Cunningham, 1980; WHO, 1985; De Lorenzo et al., 1999;
2019). Indirect calorimetry (IC) has been established as a non- Müller et al., 2004). Given that all predictive equations include
invasive method for measuring REE with good precision and age as covariate and that the underlying study cohorts likely
accuracy (Haugen et al., 2007; Pinheiro Volp et al., 2011; only involved relatively sedentary older adults, it remains unclear
Delsoglio et al., 2019). IC is based on measuring oxygen (O2 ) whether these predictive equations would be accurate for highly
consumption and carbon dioxide (CO2) dissipation, which active, older master athletes. To further highlight this concern,
is coupled to the metabolism of energy-rich substrates such the accuracy of REE equations has already been questioned for
as carbohydrates and fats. Total average daily REE in kcal athletic populations in general (Thompson and Manore, 1996;
FIGURE 1 | Participation in world masters athletics championship in the past 4 decades, quantified by the number of competing athletes (left) and by the number of
countries represented (right). Data are courtesy by the World Master Athletics (WMA).
Frontiers in Physiology | www.frontiersin.org 2 March 2021 | Volume 12 | Article 641455Frings-Meuthen et al. Energy Expenditure of Master Athletes
De Lorenzo et al., 1999; ten Haaf and Weijs, 2014; Jagim et al., championship as a competing athlete was allowed to participate.
2018; Schofield et al., 2019) because data concerning subjects’ Exclusion criteria were injuries or illnesses that affected jump
physical activity involved in the development of the various tests or contraction of the calf muscle, another main outcome
equations were not considered. Studies on young athletes show measure of the MAFS-18. Criteria for early termination of
increased energy requirements, but also emphasize substantial the study were pathological findings during measurements or
individual differences depending on the type of exercise activity voluntary termination by participants. Athletes were made aware
(Fraczek
˛ et al., 2019). The most widely-used equation for athletes of the study in advance by direct e-mails and posters. The
comes from De Lorenzo (De Lorenzo et al., 1999). These authors study protocol was approved by the ethical committee of the
studied seven published REE equations for estimating REE in North Rhine Medical Association (Ärztekammer Nordrhein
young male athletes, aiming to create a specific equation for male lfd Nr. 2018171), and the study had been registered on the
athletes. Currently, the American College of Sports Medicine German register for clinical trials1 with registration number
(ACSM) recommends the prediction equations developed by DRKS00015172. All the participants signed informed consent to
Cunningham and, interestingly, also the one by Harris & participate in the present study.
Benedict for estimating REE in athletes (Rodriguez et al., 2009), A hundred and thirteen athletes (79 men, 34 women),
although these equations have not been developed for the 35–84 years old, were studied. Athletes were asked to fast
athletic population. More importantly, the accuracy of REE overnight, at least 12 h, before the test session. They were
prediction models has not been validated specifically for these requested to minimize high intensity physical activity or
populations, and certainly not for master athletes. The number competitions 24 h before testing.
of studies measuring REE in older athletes is small. Available
studies suggest that older men who are competitively physically Experimental Design
active have a higher REE compared with age-matched sedentary The MAFS-18 study is a field study in an analytical cross-sectional
individuals (Poehlman and Horton, 1990; Campbell et al., 1994). design, performed once under field conditions. The study flow
This is confirmed by a later study (Ryan et al., 1996; Van involved to first sign in at the registration office, the collection
Pelt et al., 1997) that REE was greater in both young and of anthropometric and training data, and body composition.
older female athletes than in sedentary controls of the same Then, an appointment was made for a subsequent day to take
age. A significant increase in REE was also observed in older REE-measurements.
female athletes after a short training phase of only 6 weeks
(Stavres et al., 2019).
Thompson & Manore (Thompson and Manore, 1996) Measurements
reported that traditionally-used equations for estimating All the measurements were conducted in the morning between
metabolic rates do not apply well to about 50% of athletes and 7.00 and 11.00 am in a dedicated room of the main stadium
that the Cunningham equation provides an accurate estimate close to the registration office (room temperature 27.6 ± 1.9◦ C,
of REE when determining energy needs of highly active people. ambient pressure 765 mmHg, ambient humidity 60%).
Equations taking FFM into account seem to be the most
reasonable approach to predict REE in athletes (ten Haaf and Anthropometric Measurements
Weijs, 2014). However, De Lorenzo failed to determine FFM A stadiometer was used for assessing height to the nearest of
as the best predictor of REE for male athletes, instead the 0.1 cm, body weight was measured by a calibrated balance scale
combination of height and body mass were the best predictors with an accuracy of 100 g, both measured standing.
(De Lorenzo et al., 1999).
With this information as background, the purpose of this Body Composition
study was to test the accuracy of six common equations for Body composition was measured by a segmental multi-frequency
predicting REE in master athletes and to address which other bioelectrical impedance analyzer (BIA) (InBody S10, Eschborn,
anthropometric and environmental characteristics influence REE Germany), following manufacturer’s instructions. The electrodes
in this specific cohort. We hypothesized that most of the existing were attached to the participant in supine position on the
equations would underestimate REE because of the higher FFM right hand and right foot with legs apart. Resistance and
proportion in master athletes vs. sedentary adults. reactance were determined using an electric alternating current
of 800 mA and multiple frequencies of 5, 50, and 250 kHz. Body
composition indicators including skeletal muscle mass (SMM),
MATERIALS AND METHODS soft lean mass (SLM), percentage of body fat (PBF), fat free mass
(FFM), fat mass (FM), intracellular water (ICW), extracellular
Study Setting and Subjects water (ECW), total body water (TBW), mineral content and
The Masters Athletic Field Study 2018 (MAFS-18) aimed to protein content were measured. Phase angle at 50 kHz was
assess physiological and mental constituents of physical fitness calculated by using the equation: phase angle (◦ ) = arctan
and well-being in master athletes. The present investigation (reactance/resistance) x (180/ ).
is a sub-study of the MAFS-18, which was implemented
during the 23rd World Masters Athletics Championship in
September 2018 in Malagà, Spain. Any who was admitted to the 1
www.drks.de
Frontiers in Physiology | www.frontiersin.org 3 March 2021 | Volume 12 | Article 641455Frings-Meuthen et al. Energy Expenditure of Master Athletes
Indirect Calorimetry included to define prediction equations including sex, body
Resting energy expenditure was measured by indirect calorimetry weight and age as greatest influencing factors:
using a canopy device (Quark RMR, COSMED Deutschland
GmbH, Fridolfing, Germany), following manufacturer’s Men 30 − 60 years : REE(kcal/d) = 11.6 × Bodyweight(kg)
instructions and settings. After gas- and flowmeter-calibration, + 879.
a two-minute REE test-measurement was conducted, before the
main measurement over 30 min started. Oxygen consumption Men > 60 years : REE(kcal/d) = 13.5 × Bodyweight(kg)
(VO2, ml/min) and carbon dioxide production (VCO2 , ml/min) + 487.
were measured for calculating REE. Indirect calorimetry was
performed in the morning between 7.00 and 11.00 a.m. after Women 30 − 60 years : REE(kcal/d) = 8.7 × Bodyweight(kg)
an overnight fast in a separate corner of the examination + 829.
room with an ambient temperature of 27.6 ± 1.9◦ C. The
minimum duration of measurement was 30 min and the Women > 60 years : REE(kcal/d) = 10.5 × Bodyweight(kg)
first 5 min were discarded. During measurements, subjects + 596.
had to remain motionless, were not allowed to speak, or fall
asleep. A protocol was taken whether they moved or felt Müller et al. (2004) compared equations of WHO with new data
asleep. Corresponding data points were excluded from the of a compiled German database, where REE measurements were
analysis. The device collected a measured value every 10 s conducted on 2,528 German participants to specify the WHO
for 30. The flow rate under the hood was adjusted so that equations for the German population. He defined two different
the expiratory air (FeCO2) was between 0.9–1.0 l and the equations, one containing body composition data including fat
urinary nitrogen value was set to 8.00064 g/day. Data were free mass (FFM) and fat mass (FM):
collected every 10 s for 30 min. The experimental conditions
were standardized for each subject by means of a checklist. REE(kcal/d) = [0.047 × Bodyweight(kg) + 1.009
The CVs for the repeated REE-measurements were 13% in × sex(0 = female, 1 = male) − 0.01452
and 14% in women.
× age(years) + 3.31] × 1, 000/4.184.
Data Processing REE(kcal/d) = [0.05192 × FFM(kg) + 0.04036 × FM(kg)
The first 5 min and some outliers of the indirect
calorimetry data collection were removed and average + 0.869 × sex(0 = female, 1 = male) − 0.01181
values of VO2 and VCO2 were taken to calculate REE and
× age(years) + 2.992] × 1, 000/4.184.
respiratory exchange ratio (RER) as previously described
(Ferrannini, 1988). Cunningham solidified Harris & Benedict’s idea that FFM could
Directly-measured REE values were compared with a be the greatest influencing factor on REE and developed an
variety of REE values predicted based on anthropometric equation with FFM as the only parameter with participants from
data. Equations of Harris & Benedict (H&B) (Harris and the Harris & Benedict’s study (Cunningham, 1980):
Benedict, 1918), WHO (WHO, 1985), Müller et al. (MÜL)
(Müller et al., 2004), Müller-FFM (MÜL-FFM) (Müller et al., REE(kcal/d) = 500 + 22 × FFM(kg).
2004), Cunningham (CUN) (Cunningham, 1980), and De
Lorenzo et al. (LOR) (De Lorenzo et al., 1999) were used for De Lorenzo et al. (1999) defined an equation specifically for
comparison. athletes. REE of 51 young (age 23.3 ± 3.5 years) male subjects,
Harris & Benedict defined REE as an individual’s heat who exercised regularly at least 3 h per day was measured and the
production assessed 12–14 h after the last meal at rest (Harris and following equation was derived:
Benedict, 1918). The underlying cohort consisted of 333 subjects,
and height, age, body weight, and sex were reported as strongest REE = −857 + 9 × Bodyweight(kg) + 11 × Height(cm).
predictors of REE:
Statistical Analyses
Men : REE(kcal/d) = 66.47 + 13.75 × Bodyweight(kg) Data were collected with Research Electronic Data Capture
+ 5.0 × Height(cm) − 6.76 × Age(years). with (REDCap ). Statistical Package for Social Sciences (SPSS
R
Version 26, IBM) was used for all statistical analyses. At first,
Women : REE(kcal/d) = 655.1 + 9.56 × Bodyweight(kg) all parameters were tested for normality by Shapiro-Wilk-
+ 1.85 × Height(cm) − 4.68 × Age(years). Test. Non-parametric Mann-Whitney-U-Test was selected for
comparison of estimated and measured REE. Bland-Altman
World Health Organization equation were calculated using analysis was selected to assess differences between measured
several studies aimed at estimating the food requirements of and predicted REE. The differences between the measured
certain populations by measuring REE and physical activity and predicted values were set against their mean values, and
(WHO, 1985). A total of 7,549 subjects were measured and the limits of agreement were defined. A twofold standard
additional mean REEs of 3,874 other study measurements were deviation is accepted as the tolerance limit, as it should
Frontiers in Physiology | www.frontiersin.org 4 March 2021 | Volume 12 | Article 641455Frings-Meuthen et al. Energy Expenditure of Master Athletes
cover 95% of all data. Linear regression analysis was used (12% deviation), H&B with 157.5 ± 26.5 kcal/d (12% deviation)
to evaluate the REE-FFM association. Multiple-regression and MÜL-FFM with 164.5 ± 26.8 kcal/d (13% deviation).
analysis was used to evaluate independent relationships Figure 3 shows Bland-Altman plots for the six selected
between REE and sex, age, height, body weight, FFM, training equations in men and women. The limits of agreement, based
hours per week, phase angle, and athletic specialization. Sex on the Bland-Altman plots, show the interval of two standard
and sport speciality (endurance, power, or mixed) represent deviations of the measurement differences either side of the
categorical variables, which first needed to be encoded. mean difference and were large in all six cases. For men, the De
Female sex and power as sports were chosen as reference Lorenzo equation showed the smallest range with 615.2 kcal/d.
categories, which allows a quantitative comparison of all For women, the Cunningham equation showed the smallest range
categories with the reference categories. Significance level with 523.3 kcal/d (Table 2).
for all tests was set at 0.05. Subjects characteristics and Table 3 shows the percentage of accuracy and the
environmental data are expressed as mean ± SD, all other results percentage of under- and overestimation of REE predictive
as mean ± SEM. equations. The De Lorenzo equation resulted in the highest
percentage accurate predicted equations for men (72.2%),
the Cunningham equation for women (63.6%). The Harris &
RESULTS Benedict equation showed in both sexes less than 50% accuracy.
The WHO and the MÜL equations showed less than 50%
Subject characteristics’ are presented in Table 1. accuracy only in women.
Comparison of Measured REE and
Predicted REE Linear Regression Analysis for
As illustrated in Figure 2, predicted REEs (REEp) using equations REEm/FFM Ratio
created for the general population differed significantly from the The relationship between REE and FFM was evaluated by linear
directly-measured REE (REEm ) (p < 0.001 for H&B; p = 0.001 regression. In the simple linear model, the FFM has a significant
for WHO; p = 0.004 for MÜL; p = 0.004 for MÜL-FFM; p = 0.003 influence on the REE (p < 0.001) (Figure 4). The contribution of
for CUN). More specifically, the equations H&B, WHO, MÜL, FFM to REE was calculated as 29.17 ± 0.34 kcal/kg FFM for men
and MÜL-FFM underestimated, and CUN overestimated REE in and 30.42 ± 0.52 for women.
both sexes. Predicted REE by LOR was not significantly different
from the measured REE (p = 0.750).
For male athletes, mean differences between measured and Multiple Regression Analyses
predicted REE were smallest for LOR with 15.3 ± 17.7 kcal/d For multiple regression analyses, six participants were excluded
(1% deviation from the measured REE) followed by due to missing body composition measurements (2 men, 1
CUN with −76.8 ± 18.4 kcal/d (−4% deviation), MÜL woman), no indication of the sporting event (1 man), or no
with 81.7 ± 18.0 kcal/d (5% deviation), MÜL-FFM with indication of the training hours per week (1 man, 1 woman),
110.6 ± 17.7 kcal/d (7% deviation) and WHO with so the remaining 107 (75 men, 32 women) participants were
113.6 ± 19.9 kcal/d (8% deviation). The mean difference is included for the multiple regression analysis.
highest for H&B with 174.56 ± 18.56 kcal/d (12% deviation). Body weight, age, sex, height, FFM, FM, training hours
For women, mean differences between measured per week, phase angle, ambient temperature, and athletic
and predicted RER were also smallest for LOR with specialization, assessed via their self-rated best event, (endurance:
−62.0 ± 26.7 kcal/d (−4% deviation from the measured n = 31, Power: n = 57, mixed: n = 19) were selected as
REE) followed by CUN with −99.8 ± 23.2 kcal/d (−6% predictor variables. The results of different models are given
deviation) and WHO with 128.9 ± 28.1 kcal/d (10% deviation). in Table 4. Body weight as the only predictor can explain
The mean difference is highest for MÜL with 156.1 ± 7.0 kcal/d 55.7% of the variance (p < 0.001, Model 1), while FFM
as the only predictor can explain 63.0% of the variance
(p < 0.001, Model 2). All other predictors increase the
TABLE 1 | Subjects characteristics’. explained variance only slightly. A hierarchical analysis of
all measured predictors selects the best combination of
Men Women
variables, which is shown in Model 7. FFM (p < 0.001), FM
Age (years) 57.14 ± 11.65 (35–84) 54.91 ± 11.60 (35–80) (p = 0.007), temperature (p = 0.004) and gender (p = 0.045)
Height (cm) 174.86 ± 7.25 (160.0–197.1) 164.95 ± 5.99 (153.1–178.8) are the only significant predictors of REE in this model,
Weight (kg) 74.24 ± 10.31 (56.0–100.7) 62.12 ± 9.97 (45.7–91.4) they explain 69.0% of the variance. By extending the model
BMI (kg/m2 ) 24.22 ± 2.46 (18.93–32.29) 22.79 ± 3.26 (18.54–32.17) by anthropometric and sport-specific predictors, the explained
FFM (kg) 60.75 ± 8.36 (48.0–88.9) 48.20 ± 6.41 (36.6–63.5) variance increases only slightly. These variables have only small
FFM (%) 81.84 ± 6.10 (71.3–94.1) 77.72 ± 6.75 (54.9–91.5) influence on REE and are therefore only partially suitable
FM (kg) 13.71 ± 5.50 (3.5–32.6) 14.27 ± 6.50 (5.9–38.8) for predicting it.
FM (%) 18.16 ± 6.10 (7.8–32.4) 22.28 ± 6.75 (8.5–54.1) One of the next steps could be to simplify the model by
Training (h/w) 8.50 ± 4.60 (1.0–30.0) 9.91.50 ± 6.66 (1.0–30.0) excluding all non-significant independent variables, in order to
Frontiers in Physiology | www.frontiersin.org 5 March 2021 | Volume 12 | Article 641455Frings-Meuthen et al. Energy Expenditure of Master Athletes
FIGURE 2 | Directly-measured resting energy expenditure (REE) (REEm) and predicted REE (REEp) using a variety of equations including Harris & Benedict (H&B),
World Health Organization (WHO), Müller (MÜL), Müller-FFM (MÜL-FFM), Cunningham (CUN), and De Lorenzo (LOR) in males and female master athletes.
*p < 0.005 vs. REEm.
obtain a new predictive equation especially for master athletes to third on men and about 50% on women with underestimation,
be tested and validated in independent cohort of master athletes. but only in a few percent in overestimation. The Cunningham
REE = −202.088 + 18.577 × FFM (kg) + 6.753 × FM equation also resulted in about two thirds of both men and
(kg) + 23.910 × temperature (◦ C) + 78.479 × sex women with accurate estimation of REE, in less than 20% of
(0 = female, 1 = male). cases in underestimation, but in more than 20% of cases a clear
overestimation, specifically in women.
In general, our results of higher REE in master athletes
DISCUSSION are in accordance with the findings in other cross-sectional
studies performed in young athletes (Ballor and Poehlman,
The main aims of this study were to assess the accuracy of 1992; Poehlman et al., 1992). The multiple regression analysis
existing predictive equations for REE applied to master athletes shows that this is mainly due to higher FFM in master athletes,
and to ascertain the primary determinants of REE in this group compared with that of the general population. A previous study
of athletes. The data presented herein show underestimation (ten Haaf and Weijs, 2014) pointed out that the Cunningham
errors in most predicting equations by Harris & Benedict (12%), and De Lorenzo equations predicted REE in athletes more
WHO/FAO (8%) and Müller (5 and 7% without and with FFM, accurate than other commonly-used REE predictive equations
respectively), whereas Cunningham’s equation overestimated the (e.g., Harris & Benedict, WHO, Schofield, Mifflin, Owen), with
actual REE by 4%. Whilst predictions errors in the order of the De Lorenzo equation being slightly less accurate than the
magnitude of 5% may seem acceptable in many other areas of Cunningham equation. It should, however, be noted that these
research, they are of concern when it comes to providing dietary notions were based on data of recreational athletes of 18–35 years
recommendations based on energy expenditure. Very clearly, (ten Haaf and Weijs, 2014) and were not based on data obtained
overestimating the required caloric intake by such amounts will from highly trained master athletes as presented in this study.
lead to obesity in the long run, and underestimation to starvation. Interestingly, the De Lorenzo’s equation is the only predictive
The only equation that provided an accurate prediction on equation that was constructed based on a population of athletes.
average was the one by De Lorenzo et al. (De Lorenzo et al., 1999), In their study, seven published REE equations were compared to
which is explained by the fact that it was specifically made for assess the validity and reliability of REE estimations, based on a
athletes. However, even though De Lorenzo’s REE prediction may population of 51 young male athletes (22 water polo, 12 judo, and
have been acceptable on average, it still over- or underestimated 17 karate) with a secondary aim of creating a specific equation
in 30% of master athletes. for male athletes. In an attempt to improve the accuracy of the
The Harris & Benedict equation, which is probably the most predictive equation, De Lorenzo et al. (De Lorenzo et al., 1999)
widely used approach in the clinical settings, resulted in about incorporated body composition constituents, such as lean and
50% of cases in accurate estimation of REE, in about 50% of fat mass obtained from DEXA scans. Contrary to expectations,
cases in underestimation, but almost no overestimation in both FFM was not found to be the best predictor of REE, but rather a
men and women. The WHO and Müller equations (using body combination of height and body mass.
weight and FFM) resulted in about two thirds of men and almost It is also of interest that the present study only found
50% of women with accurate estimation of REE, about one body weight, FFM, FM and sex as significant anthropometric
Frontiers in Physiology | www.frontiersin.org 6 March 2021 | Volume 12 | Article 641455Frings-Meuthen et al. Energy Expenditure of Master Athletes FIGURE 3 | Bland-Altman plots for six [Harris & Benedict (HB), WHO (WHO), Müller (MÜL), MÜL -FFM (MÜL-FFM) Cunningham (CUN), De Lorenzo (LOR)] resting energy expenditure (REE) predictive equations (REEp). The solid lines represent the mean difference (BIAS) between predicted and measured REE (REEm). The upper and lower dashed lines represent 95% limits of agreement. ◦ female • male. predictors, but not age and height. This is noteworthy for two and remodeling processes. Second, the finding of a significant reasons. First, the absence of significant age effect suggests that contribution by FFM, FM and indicates that age effects by the master athletes maintain relatively high levels of basal metabolic previous predicting equation could be explained by age-related rate, which also encompasses energy consumption as per repair increases in body fat percentage. Frontiers in Physiology | www.frontiersin.org 7 March 2021 | Volume 12 | Article 641455
Frings-Meuthen et al.                                                                                                         Energy Expenditure of Master Athletes

TABLE 2 | Limits of agreement.                                                         main study outcome, it is unfortunate that previous researchers
                                                                                       had failed to analyze the effect of the ambient temperature
                                 Limits of agreement (range) (kcal/d)
                                                                                       information during their REE assessments. However, some
                                  Men                          Women                   simple calculations with the regression equation obtained from
                                                                                       the present data suggest an excess REE by 23.91 kcal/day can be
Harris & Benedict       −148.84 to 497.96 (646.79)    −144.81 to 459.72 (604.54)
                                                                                       attributed to each 1◦ C-increase in ambient temperature (Table 4),
WHO                     −233.16 to 460.37 (693.53)    −192.06 to 449.86 (641.86)
                                                                                       and that therefore a deviation by 5 × 23.91 ∼120 kcal could
Müller                  −231.43 to 394.86 (626.29)    −151.96 to 464.20 (616.16)
                                                                                       be cause by elevating ambient from 22.5◦ C to 27.5◦ C. This
Müller-FFM              −139.91 to 415.16 (609.07)    −137.44 to 466.50 (603.93)
                                                                                       amount is certainly a sizeable confounder, and it could potentially
Cunningham              −393.04 to 239.50 (632.54)    −361.05 to 162.25 (523.30)
                                                                                       explain a good fraction of the excess REE observed in the present
De Lorenzo              −292.28 to 322.93 (615.21)    −366.87 to 242.84 (609.71)
                                                                                       cohort, if not all of it. However, one also needs to consider
                                                                                       that such model calculations involve extrapolation to ambient
                                                                                       temperature levels below the range for which we have data, and
    Finally, we also checked the effect of ambient temperature. The                    that no information exists about temperature effects on REE in
average value during testing within the present study was 27.5◦ C                      the 20–25◦ C range. Therefore, and given that the DeLorenzo
which is higher than the above the temperature of 20–25◦ C that                        equation predicts higher REE in athletes than non-athletes, we
                                                                                       still hold it likely that athletic participation is also associated with
is recommended for the IC measurement by the manufacturer.
                                                                                       increased REE levels at old age.
Naturally, RMR assessments should normally be performed at
                                                                                           The present study shows that the De Lorenzo equation, by
a standard temperature, or at least controlled for it. Moreover,
                                                                                       taking height and body weight into account, is remarkably similar
5◦ C spread in this range seems per se quite wide, given the
                                                                                       to the Cunningham equation that takes the athlete’s FFM into
significant temperature effects observed in the present study.
                                                                                       account. These results are in accordance with the result of our
Unfortunately, the published literature neglects the temperature
                                                                                       multiple regression analysis that body weight as well as FFM
effect, and there is, to the best of our knowledge, only one study
                                                                                       are both significant predictors of REE in master athletes. One
(Abreu-Vieira et al., 2015) that has investigated the effects of
                                                                                       explanation for this equality in predictiveness could be the
ambient temperature as influence factor on REE in mice.                                lower fat mass of the master athletes (18.2 ± 6.1% in men and
    Looking at the consequences that the elevated ambient                              22.3 ± 6.8% in women) in comparison to the general elderly
temperature of the Málaga measurements may have had for the                            population (Deurenberg et al., 1989; Ofenheimer et al., 2020).

TABLE 3 | Accuracy of predictive equations.

                                      Underestimation (%)                          Accurate estimation (±10%)                             Overestimation (%)

                               Men                   Women                  Men                       Women                        Men                     Women

Harris & Benedict              51.9                   50.0                  48.1                        47.1                        0                        2.9
WHO                            36.7                   52.9                  63.3                        41.2                        0                        5.9
Müller                         27.9                   50.0                  65.8                        47.1                        6.3                      2.9
Müller-FFM                     32.5                   51.5                  66.2                        45.5                        1.3                      3.0
Cunningham                      6.6                    0                    68.4                        63.6                       25.0                     36.4
De Lorenzo                     17.7                   11.8                  72.2                        61.8                       10.1                     26.5

Bolded values denotes that, this is the most accurate estimation in men and in women.

  FIGURE 4 | Relationship between the measured resting energy expenditure (REEm) and fat free mass (FFM) of master athletes. On the left: men (r = 0.69,
  p < 0.001), on the right: women (r = 0.76, p < 0.001).

Frontiers in Physiology | www.frontiersin.org                                      8                                        March 2021 | Volume 12 | Article 641455
Frings-Meuthen et al. Energy Expenditure of Master Athletes
TABLE 4 | Multiple regression model to determine independent predictors of resting energy expenditure (REE) (kcal/d).
Equation Tested variables Equation Explained
number variance (R2 )
Model 1 Body weight REE = 505.233 + 16.372 × body weight (kg) 55.7%
Model 2 FFM REE = 494.873 + 20.623 × FFM (kg) 63.1%
Model 3 FFM, FM REE = 439.574 + 20.462 × FFM (kg) + 4.645 × FM (kg) 64.2%
Model 4 FFM, FM, gender, age, height REE = 431.859 + 17.6 × FFM (kg) + 5.462 × FM (kg) + 73.951 × sex (female = 0, 65.3%
male = 1) – 0.602 × age (years) + 0.821 × height (cm)
Model 5 FFM, FM, gender, age, height, REE = −99.565 + 19.664 × FFM (kg) + 5.761 × FM (kg) + 62.716 × sex (female = 0, male = 1) 68.0%
temperature −0.308 × age (years) – 0.610 × height (cm) + 23.531 × temperature (◦ C)
Model 6 FFM, FM, gender, age, height, REE = −131.956 + 18.823 × FFM (kg) + 6.994 × FM (kg) + 77.484 × sex (female = 0, 69.3%
temperature, training hours, male = 1) + 0 × age (years) −0.567 × height (cm) + 22.550 × temperature
phase angle, kind of sports* (◦ C) + 0.007 × training hours (hours) + 7.104 × phase angle (◦ ) + 24.245 × endurance –
9.736 × mixed
*based on strength as reference
Model 7 FFM, FM, temperature, gender REE = −202.088 + 18.577 × FFM (kg) + 6.753 × FM (kg) + 23.910 × temperature 69.0%
(◦ C) + 78.479 × sex (female = 0, male = 1)
A lower fat mass would effectively mean that FFM makes up a not considered in the evaluation (Van Pelt et al., 1997). In
larger proportion of the total body mass in master athletes than terms of the multiple linear regression, some variables affected
in comparable non-exercising populations. This is supported others (e.g., FFM affecting body weight), which can lead to
by the comparison of the two Müller equations, which show multicollinearity. On the other hand, this is hard to avoid
similar results despite different predicators. While MÜL only when analyzing anthropometric data. Despite all being master
uses the total body mass, MÜL-FFM additionally includes FFM. athletes, the participants were heterogeneous in terms of the
Though important determinants, body weight and FFM are different sports disciplines and the associated FFM. For further
not the sole predictors of REE; despite the inclusion of the investigations, it may be useful to stratify more by age, height, sex
FFM, for instance, the Müller equation showed less accuracy in and sports to define the influence of FFM on REE. In this context,
predicting REE compared with the Cunningham equation. Since it would also be desirable to measure the FFM with devices that
Müller et al. (2004) developed their equation primarily for the are specifically validated for athletes. In order to normalize the
German, predominantly Caucasian population, the differences REE data for organ and tissue masses according to Bosy-Westphal
are potentially due to ethnic differences, which would require et al. (2013) and Muller et al. (2018) MRI data of master athletes
further investigation. However, it is interesting that the Bland- would be of great interest for future studies.
Altman Plots of the Müller equation show two separate clusters In summary, it is important to be careful when using REE
for men and women, which were not observed within the equations in athletic individuals, given the body compositional
other equations. differences between athletic and non-exercising populations.
A bias ranging from −587 kcal/d to 0 kcal/d was observed Typically, REE will be underestimated with REE equations that
when the REE was predicted in master athletes. The question do not account for FFM and are not specifically developed for an
of what is an acceptable bias, needs to be evaluated from a athletic population. For the special collection of older competitive
practical perspective and depends on the individual training athletes, the present study provides an initial overview of
situation. However, the primary goal should be to avoid an energy their energy requirements. Further investigations under more
deficiency in master athletes relative to what can be achieved standardized study conditions (e.g., controlled environmental
through individual dietary advice. conditions, standardized diet some days before the measurement)
The championship setting offered a unique opportunity to would be desirable in order to predict REE of master athletes
measure REE in many competitive master athletes over a short more precisely than previously possible.
period with a modern, non-invasive technique. This was met
by high interest and demand by master athletes participating
in the Championship (n = 113). Unfortunately, this strength DATA AVAILABILITY STATEMENT
was also a limitation regarding the environmental conditions.
There was only one test room for all measurements available The original contributions presented in the study are included
in the stadium, although an REE-measurement requires a calm in the article/supplementary material, further inquiries can be
atmosphere. Ambient temperature (25–31◦ C) and humidity were directed to the corresponding author/s.
relatively high (43–70%), which made calm breathing under the
canopy difficult for some of the athletes. Unfortunately, day-to-
day variations of temperature and humidity were unavoidable ETHICS STATEMENT
and reduced the required standardization. Independent of the
environmental conditions, the age range (34–84 years) was The studies involving human participants were reviewed and
large within the participants and the menopausal status was approved by Ärtzekammer Nordrhein, Düsseldorf, Germany.
Frontiers in Physiology | www.frontiersin.org 9 March 2021 | Volume 12 | Article 641455Frings-Meuthen et al. Energy Expenditure of Master Athletes
The patients/participants provided their written informed FUNDING
consent to participate in this study.
This research was funded by the German Aerospace Center.
AUTHOR CONTRIBUTIONS
PF-M, NR, WS, SM, EM, and FH carried out the experiment. ACKNOWLEDGMENTS
PF-M and SH wrote the manuscript with support from MB and
JR. PF-M and SH performed the analytical calculations. HT, PC, The authors are grateful to Alvaro del Pozo and Daniel Pérez
JA, and JR helped supervise the project. UM and WS managed Martínez of the Royal Athletic Spanish Federation, to the World
the data. PF-M and MB conceived the original idea. All authors Masters Athletics (WMA), Irmtrud Schrage, lab technician, and
discussed the results and contributed to the final manuscript. naturally to all study participants.
REFERENCES mass, fat mass, age, and circulating thyroxine but not sex, circulating leptin,
or triiodothyronine. Am. J. Clin. Nutr. 82, 941–948. doi: 10.1093/ajcn/82.5.941
Abreu-Vieira, G., Xiao, C., Gavrilova, O., and Reitman, M. L. (2015). Integration Müller, M. J., Bosy-Westphal, A., Klaus, S., Kreymann, G., Lührmann, P. M.,
of body temperature into the analysis of energy expenditure in the mouse. Mol. Neuhäuser-Berthold, M., et al. (2004). World Health Organization equations
Metab. 4, 461–470. doi: 10.1016/j.molmet.2015.03.001 have shortcomings for predicting resting energy expenditure in persons from
Amaro-Gahete, F. J., Sanchez-Delgado, G., Alcantara, J. M. A., Martinez-Tellez, B., a modern, affluent population: generation of a new reference standard from a
Muñoz-Hernandez, V., Merchan-Ramirez, E., et al. (2019). Congruent validity retrospective analysis of a German database of resting energy expenditure. Am.
of resting energy expenditure predictive equations in young adults. Nutrients J. Clin. Nutr. 80, 1379–1390. doi: 10.1093/ajcn/80.5.1379
11:223. doi: 10.3390/nu11020223 Muller, M. J., Geisler, C., Hubers, M., Pourhassan, M., Braun, W., and Bosy-
Ballor, D. L., and Poehlman, E. T. (1992). Resting metabolic rate and coronary- Westphal, A. (2018). Normalizing resting energy expenditure across the life
heart-disease risk factors in aerobically and resistance-trained women. Am. J. course in humans: challenges and hopes. Eur. J. Clin. Nutr. 72, 628–637. doi:
Clin. Nutr. 56, 968–974. doi: 10.1093/ajcn/56.6.968 10.1038/s41430-018-0151-9
Bosy-Westphal, A., Braun, W., Schautz, B., and Muller, M. J. (2013). Issues in Ofenheimer, A., Breyer-Kohansal, R., Hartl, S., Burghuber, O. C., Krach, F., Schrott,
characterizing resting energy expenditure in obesity and after weight loss. Front. A., et al. (2020). Reference values of body composition parameters and visceral
Physiol. 4:47. doi: 10.3389/fphys.2013.00047 adipose tissue (VAT) by DXA in adults aged 18–81 years-results from the LEAD
Campbell, W. W., Crim, M. C., Young, V. R., and Evans, W. J. (1994). Increased cohort. Eur. J. Clin. Nutr. 74, 1181–1191. doi: 10.1038/s41430-020-0596-5
energy requirements and changes in body composition with resistance training Pinheiro Volp, A. C., Esteves de Oliveira, F. C., Duarte Moreira Alves, R., Esteves,
in older adults. Am. J. Clin. Nutr. 60, 167–175. doi: 10.1093/ajcn/60.2.167 E. A., and Bressan, J. (2011). Energy expenditure: components and evaluation
Cherian, K. S., Shahkar, F., Sainoji, A., Balakrishna, N., and Yagnambhatt, V. R. methods. Nutr. Hosp. 26, 430–440. doi: 10.1590/s0212-16112011000300002
(2018). Resting metabolic rate of Indian junior soccer players: testing agreement Poehlman, E. T., Gardner, A. W., Ades, P. A., Katzman-Rooks, S. M., Montgomery,
between measured versus selected predictive equations. Am. J. Hum. Biol. S. M., Atlas, O. K., et al. (1992). Resting energy metabolism and cardiovascular
30:e23066. doi: 10.1002/ajhb.23066 disease risk in resistance-trained and aerobically trained males. Metabolism 41,
Cunningham, J. J. (1980). A reanalysis of the factors influencing basal metabolic 1351–1360. doi: 10.1016/0026-0495(92)90107-l
rate in normal adults. Am J. Clin. Nutr. 33, 2372–2374. doi: 10.1093/ajcn/33.11. Poehlman, E. T., and Horton, E. S. (1990). Regulation of energy expenditure
2372 in aging humans. Annu. Rev. Nutr. 10, 255–275. doi: 10.1146/annurev.nu.10.
De Lorenzo, A., Bertini, I., and Candeloro, N. (1999). A new predictive equation 070190.001351
to calculate resting metabolic rate in athletes. J. Sports Med. Phys. Fitness. 39, Poehlman, E. T., Melby, C. L., and Badylak, S. F. (1991a). Relation of age and
213–219. physical exercise status on metabolic rate in younger and older healthy men.
Delsoglio, M., Achamrah, N., Berger, M. M., and Pichard, C. (2019). Indirect J. Gerontol. 46, B54–B58. doi: 10.1093/geronj/46.2.b54
calorimetry in clinical practice. J. Clin. Med. 8:1387. doi: 10.3390/jcm809 Poehlman, E. T., Melby, C. L., and Goran, M. I. (1991b). The impact of exercise
1387 and diet restriction on daily energy expenditure. Sports Med. 11, 78–101. doi:
Desbrow, B., Burd, N. A., Tarnopolsky, M., Moore, D. R., and Elliott-Sale, K. J. 10.2165/00007256-199111020-00002
(2019). Nutrition for special populations: young, female, and masters athletes. Poehlman, E. T., Viers, H. F., and Detzer, M. (1991c). Influence of physical activity
Int. J. Sport Nutr. Exerc. Metab. 29, 220–227. doi: 10.1123/ijsnem.2018-0269 and dietary restraint on resting energy expenditure in young nonobese females.
Deurenberg, P., van der Kooy, K., Hulshof, T., and Evers, P. (1989). Body mass Can. J. Physiol. Pharmacol. 69, 320–326. doi: 10.1139/y91-049
index as a measure of body fatness in the elderly. Eur. J. Clin. Nutr. 43, 231–236. Rodriguez, N. R., DiMarco, N. M., and Langley, S. (2009). Position of the american
Ferrannini, E. (1988). The theoretical bases of indirect calorimetry: a review. dietetic association, dietitians of canada, and the american college of sports
Metabolism 37, 287–301. doi: 10.1016/0026-0495(88)90110-2 medicine: nutrition and athletic performance. J. Am. Diet. Assoc. 109, 509–527.
Fraczek,
˛ B., Grzelak, A., and Klimek, A. T. (2019). Analysis of daily energy doi: 10.1016/j.jada.2009.01.005
expenditure of elite athletes in relation to their sport, the measurement method Ryan, A. S., Nicklas, B. J., and Elahi, D. (1996). A cross-sectional study on body
and energy requirement norms. J. Hum. Kinet. 70, 81–92. doi: 10.2478/hukin- composition and energy expenditure in women athletes during aging. Am. J
2019-0049 Physiol. 271, E916–E921. doi: 10.1152/ajpendo.1996.271.5.E916
Harris, J. A., and Benedict, F. G. (1918). A biometric study of human basal Schofield, K. L., Thorpe, H., and Sims, S. T. (2019). Resting metabolic rate
metabolism. Proc. Natl. Acad. Sci. U.S.A. 4, 370–373. doi: 10.1073/pnas.4.12.370 prediction equations and the validity to assess energy deficiency in the athlete
Haugen, H. A., Chan, L. N., and Li, F. (2007). Indirect calorimetry: a population. Exp. Physiol. 104, 469–475. doi: 10.1113/ep087512
practical guide for clinicians. Nutr. Clin. Pract. 22, 377–388. doi: 10.1177/ Stavres, J., Zeigler, M. P., and Bayles, M. (2019). Six weeks of moderate functional
0115426507022004377 resistance training increases basal metabolic rate in sedentary adult women. Int.
Jagim, A. R., Camic, C. L., Kisiolek, J., Luedke, J., Erickson, J., Jones, M. T., et al. J. Exerc. Sci. 11, 32–41.
(2018). Accuracy of resting metabolic rate prediction equations in athletes. Sullo, A., Cardinale, P., Brizzi, G., Fabbri, B., and Maffulli, N. (2004). Resting
J. Strength Cond. Res. 32, 1875–1881. doi: 10.1519/jsc.0000000000002111 metabolic rate and post-prandial thermogenesis by level of aerobic power in
Johnstone, A. M., Murison, S. D., Duncan, J. S., Rance, K. A., and Speakman, J. R. older athletes. Clin. Exp. Pharmacol. Physiol. 31, 202–206. doi: 10.1111/j.1440-
(2005). Factors influencing variation in basal metabolic rate include fat-free 1681.2004.03979.x
Frontiers in Physiology | www.frontiersin.org 10 March 2021 | Volume 12 | Article 641455Frings-Meuthen et al. Energy Expenditure of Master Athletes Tanaka, H., Tarumi, T., and Rittweger, J. (2019). Aging and physiological lessons Vaughan, L., Zurlo, F., and Ravussin, E. (1991). Aging and energy expenditure. Am. from master athletes. Compr. Physiol. 10, 261–296. doi: 10.1002/cphy.c180041 J. Clin. Nutr. 53, 821–825. doi: 10.1093/ajcn/53.4.821 ten Haaf, T., and Weijs, P. J. (2014). Resting energy expenditure prediction in Weir, J. B. (1949). New methods for calculating metabolic rate with special recreational athletes of 18–35 years: confirmation of Cunningham equation reference to protein metabolism. J. Physiol. 109, 1–9. and an improved weight-based alternative. PLoS One 9:e108460. doi: 10.1371/ Welle, S., and Nair, K. S. (1990). Relationship of resting metabolic rate to body journal.pone.0108460 composition and protein turnover. Am. J. Physiol. 258, E990–E998. doi: 10. Thompson, J., and Manore, M. M. (1996). Predicted and measured resting 1152/ajpendo.1990.258.6.E990 metabolic rate of male and female endurance athletes. J. Am. Diet. Assoc. 96, WHO (1985). Energy and Protein Requirements. Geneva: WHO. 30–34. doi: 10.1016/s0002-8223(96)00010-7 Tzankoff, S. P., and Norris, A. H. (1977). Effect of muscle mass decrease on Conflict of Interest: The authors declare that the research was conducted in the age-related BMR changes. J. Appl. Physiol. Respir. Environ. Exerc. Physiol. 43, absence of any commercial or financial relationships that could be construed as a 1001–1006. doi: 10.1152/jappl.1977.43.6.1001 potential conflict of interest. Van Pelt, R. E., Jones, P. P., Davy, K. P., Desouza, C. A., Tanaka, H., Davy, B. M., et al. (1997). Regular exercise and the age-related decline Copyright © 2021 Frings-Meuthen, Henkel, Boschmann, Chilibeck, Alvero Cruz, in resting metabolic rate in women. J. Clin. Endocrinol. Metab. 82, Hoffmann, Möstl, Mittag, Mulder, Rittweger, Sies, Tanaka and Rittweger. This is an 3208–3212. open-access article distributed under the terms of the Creative Commons Attribution Vander Weg, M. W., Watson, J. M., Klesges, R. C., Eck Clemens, L. H., Slawson, License (CC BY). The use, distribution or reproduction in other forums is permitted, D. L., and McClanahan, B. S. (2004). Development and cross-validation of provided the original author(s) and the copyright owner(s) are credited and that the a prediction equation for estimating resting energy expenditure in healthy original publication in this journal is cited, in accordance with accepted academic African-American and European-American women. Eur. J. Clin. Nutr. 58, practice. No use, distribution or reproduction is permitted which does not comply 474–480. doi: 10.1038/sj.ejcn.1601833 with these terms. Frontiers in Physiology | www.frontiersin.org 11 March 2021 | Volume 12 | Article 641455
You can also read