Wetland Assessment Tool for Condition & Health (WATCH) v 2.0
←
→
Page content transcription
If your browser does not render page correctly, please read the page content below
Wetland Assessment Tool for Condition &
                 Health (WATCH) v 2.0
      A user’s guide for operating WATCH v 2.0
    including definitions, data input, interpreting
               outcomes, and training scenarios

                                                                         March 2020
       A publication of the Partnership for the Delaware Estuary—A National Estuary Program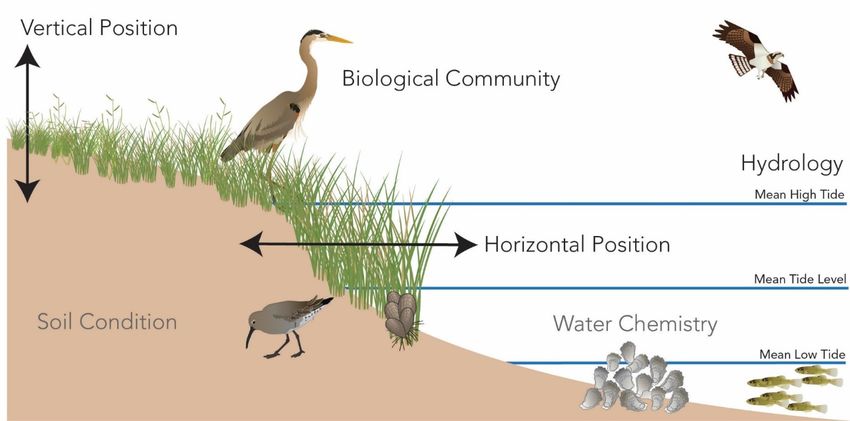
Wetland Assessment Tool for Condition &
Health (WATCH): User Guide v 2.0
Authors

Joshua Moody, Ph.D.
LeeAnn Haaf

Acknowledgements

The authors are deeply grateful for the generous funding provided for this effort by the National Fish
and Wildlife Foundation Delaware River Program award through Delaware Watershed Conservation
Fund for the grant titled Developing a Site-based Decision Tool for Targeted Implementation of Living
Shoreline Strategies (DE, NJ) Grant ID: 0403.19.065232 to the Partnership for the Delaware Estuary.
The authors wish to acknowledge the input of Irina Beal, Ella Rothermel, Kaitlin Tucker, Sarah
Bouboulis, Beatrice O’Hara, Robert Tunstead, David Steinmann, Metthea Yepsen, Elizabeth Semple,
Anna Hamilton, Jennifer Stamp, and Jordan West. Participants of the July 2019 workshop also
provided valuable input for the development of the WATCH: Jill Aspinwall, Julie Blum, David
DuMont, Dave Fanz, Dorina Frizzera, Keith Hanson, Shannon Harris, Mike Hayduk, Tom Herrington,
Rebecca Hill, Steven Jacobus, Andrew Jensen, Colleen Keller, Martha Maxwell-Doyle, Danielle
McCulloch, Kendall Miller, Jon Miller, Robin Murray, Emily Pirl, Michael Rehman, Zach Royale,
Bill Shadel, Jenny Shinn, Joe Smith, Garret Warren, Amy Williams, and Adrianna Zito-Livingston.

Suggested Method for Citing this Report

Moody, J., L. Haaf. 2021. Wetland Assessment Tool for Condition & Health (WATCH): User Guide
v 2.0. PDE Report No. 21-04. 29 pg.

The Partnership for the Delaware Estuary brings together people, businesses, and governments to
restore and protect the Delaware River and Bay. We are the only organization that focuses on the entire
environment affecting the river and bay — beginning at Trenton, including the greater Philadelphia
metropolitan area, and ending in Cape May, New Jersey and Lewes, Delaware. We focus on science,
encourage collaboration, and implement programs that help restore the natural vitality of the river and
bay, benefiting the plants, wildlife, people, and businesses that rely on a healthy estuary.

           User Guide for the Site-Specific Salt Marsh Decision Support Tool

           A publication of the Partnership for the Delaware Estuary—A National Estuary Program

                                                                                                     1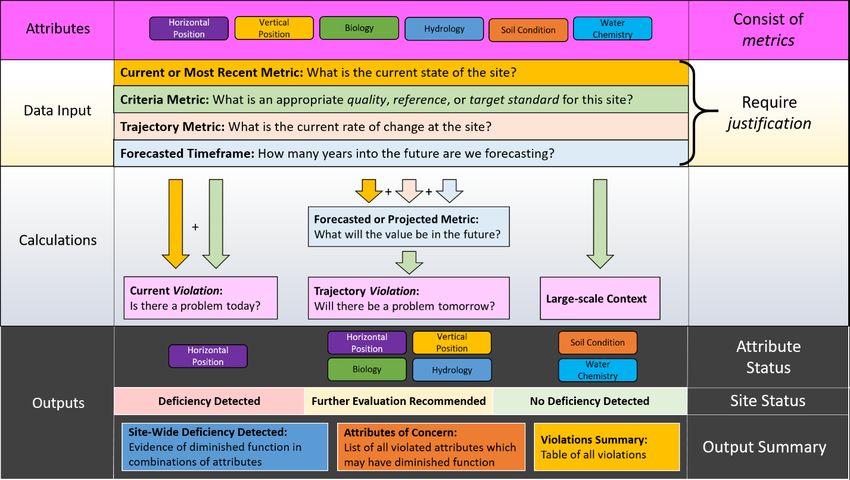
Version History
Site-Specific Salt Marsh Decision Support Tool version 1.0….…………………….…...March 2020
        User Guide provides description and guidance on using the Decision Tool. Version 1.0
        incorporates feedback from one workshop (held in July 2019).
Wetland Assessment Tool for Condition & Health: User Guide version 2.0…………….March 2021
        Guides data input, interpreting output, and includes training scenarios. Produced for the
        release of WATCH at the March 30, 2021 training webinar and was provided to all attendees
        and made available on the PDE website.

Disclaimer: Conclusions drawn from the output of the WATCH tool are the sole responsibility of the
user. A comprehensive attempt was made to ensure that all relationships and model output reflect the
best available science to date. The Partnership for the Delaware Estuary, National Fish and Wildlife
Foundation, and NJ Department of Environmental Protection, along with all other collaborators,
assume no liability for any damages caused by inaccuracies in WATCH or the accompanying
documentation; and make no warranty, expressed or implied, as to the accuracy, completeness, or
utility of this information, nor does the fact of distribution constitute a warranty.

           User Guide for the Site-Specific Salt Marsh Decision Support Tool

           A publication of the Partnership for the Delaware Estuary—A National Estuary Program

                                                                                                    2
Table of Contents
Version History .........................................................................................................................................2
Table of Contents ......................................................................................................................................3
List of Figures ...........................................................................................................................................4
List of Tables ............................................................................................................................................4
1.      Introduction .......................................................................................................................................5
     Purpose ..................................................................................................................................................5
     Goals......................................................................................................................................................6
2.      Decision Tool Approach ................................................................................................................... 6
3.      Stepwise Data Input Instructions...................................................................................................... 8
4.      Input and Calculations ...................................................................................................................... 9
     Regulatory Checklist ............................................................................................................................9
     Attributes ...............................................................................................................................................9
     Metrics & Methods .............................................................................................................................10
     Criteria & Trajectories ........................................................................................................................10
     Violations ............................................................................................................................................11
     Violations: Metrics, Criteria, & Trajectories ..................................................................................... 11
     Required Justifications .......................................................................................................................12
5.      Output Summary .............................................................................................................................12
6.      Output Reflection ............................................................................................................................12
     Regulatory Checklist ..........................................................................................................................12
     Interpretive Guidance .........................................................................................................................12
     Additional Considerations ..................................................................................................................13
7.      Training Scenarios ..........................................................................................................................13
     Scenario 1: Bird Blind ........................................................................................................................13
     Scenario 2: Evacuation Route Buffer.................................................................................................16
     Scenario 2: Modification A ................................................................................................................19
     Scenario 2: Modification B ................................................................................................................20
     Scenario 2: Modification C ................................................................................................................21
Bibliography and Works Cited...............................................................................................................24
Appendices ..............................................................................................................................................26
     Appendix A: Attribute & Metric Table..............................................................................................26
     Appendix B: Soil Condition Attribute Information ........................................................................... 27

                   User Guide for the Site-Specific Salt Marsh Decision Support Tool

                   A publication of the Partnership for the Delaware Estuary—A National Estuary Program

                                                                                                                                                               3
List of Figures
Figure 1 Workflow for WATCH and relationships among the various components............................. 7
Figure 2 WATCH attributes ...................................................................................................................10
List of Tables
Table 1 WATCH attributes and associated metric descriptions and citations ..................................... 26
Table 2 Levels of soil characteristics and their associated categories. Combinations of which lead to
an overall stability determination are reported int the last thee rows. .................................................. 27
Table 3 General soil type based on organic thickness and parent material. Classifications are based
on USDA NRCS descriptions. ...............................................................................................................28
User Guide for the Site-Specific Salt Marsh Decision Support Tool
A publication of the Partnership for the Delaware Estuary—A National Estuary Program
41. Introduction
Purpose
Salt marsh acreage decline, and the contemporaneous loss of ecosystem services, is a principal concern
to natural resource stakeholders in the Delaware Estuary. Intervening these losses is a high regional
priority. It is difficult, however, to assess the vulnerability of a salt marsh to the suite of stressors that
it may experience. Many tools and data products currently exist to quantify site-specific metrics, but
they tend to focus on a singular outcome (e.g., habitat quality, inundation, erosion) without considering
the variety of feedbacks that contribute to a cohesive diagnosis. Although multi-metric monitoring
protocols exist to score overall health, these relative, instantaneous measures are not intended to serve
as diagnostic tools for intervention tactics. Yet, holistic assessments of current and future site-specific
salt marsh function are a necessary step to inform enhancement efforts. A consistent means to integrate
multiple salt marsh attributes to diagnose sources of functional deficiency among factors that
contribute to marsh health is an important component of developing or designing intervention
strategies.
The Wetland Assessment Tool for Condition and Health (WATCH) is a flexible, systematic
framework that integrates data regarding a suite of attributes, shown to be fundamental in salt marsh
function, to gain a holistic understanding of site-specific salt marsh condition. For each attribute
(lateral and vertical position, biology, hydrology, soil condition, and water quality), WATCH
evaluates data against user-defined criteria and trajectories to identify evidence of current and/or future
deficiencies. These attribute-specific deficiencies are subsequently integrated to identify unique
combinations indicative of diminished functionality. When the data suggest diminished functionality
for one or more attributes, but the evidence is not strong enough to indicate site-wide deficiency,
WATCH identifies interrelated attributes for continued monitoring. The output of this tool will inform
the user whether there is enough evidence to further consider an intervention project, and discuss this
potential with landowners, funding agencies, and regulatory agents. Additionally, it will facilitate the
gathering and documentation of pertinent regulatory information (e.g., endangered species, critical
habitat) prior to regulatory conversations and/or application submission.
This user’s guide describes the basic purpose and applications of WATCH, as well as general
instruction for site evaluation.
For in depth descriptions of WATCH features (e.g., attributes, criteria standards), cell-specific
calculations, and integration formulas, please see Moody et al 2020, located here:
https://www.delawareestuary.org/data-and-reports/science-reports/.
Stepwise data input instructions are listed in Section 3 Stepwise Data Input Instructions (this
report, page 9). You can also find them in the Instructions tab (first tab) of the WATCH
spreadsheet.
More detailed background information and definitions used throughout this user’s guidance can
be found in Section 4 Input and Calculations.
User Guide for the Site-Specific Salt Marsh Decision Support Tool
A publication of the Partnership for the Delaware Estuary—A National Estuary Program
5Goals
WATCH provides a holistic overview of site-specific functionality and encourages users to consider
multiple aspects of wetland function independently and holistically. WATCH evaluation is relevant to
those planning restoration projects (e.g., restoration practitioners, municipalities) and those evaluating
the merits of proposed projects (e.g., regulatory agents, funding agencies).
• Restoration Project Planning: For restoration practitioners or natural resource managers,
WATCH supports two types of evaluations:
1. Within site evaluation: WATCH guides the user in considering the primary attributes
influencing salt marsh function and identifying qualities that are likely either currently
deficient, on a negative trajectory, or both.
2. Among site prioritization: Comparison among multiple sites will allow the user to identify
the magnitude and timeframes of deficiency among prospective sites for either intervention
prioritization or intervention strategy alignment with particular funding agencies or team
membership.
• Proposed Project Evaluation: For those evaluating proposed projects (e.g., regulatory
agencies, funders), this tool will summarize the quantitative findings of site evaluation and
present them alongside user-contributed justifications for all data selection/collection activities
and decisions.
2. Decision Tool Approach
The Decision Tool integrates data produced from any source (personally collected or referenced) to
gain a holistic understanding of site-specific salt marsh condition. The Decision Tool itself is an
interactive spreadsheet into which the user enters data regarding the current state and rates of change
of each described attribute. The user operates WATCH as follows (Figure 1):
• The user selects a metric for each attribute;
• The user inputs data regarding its current state, the criteria against which it will be evaluated,
trajectory data (if available), and a forecasting timeframe (if using trajectory data), along with
written justifications for each entry (see section 3).
• WATCH will evaluate the current data against criteria and, if projecting into the future,
forecast current metric values using the trajectory data (a rate of change) and timeframe.
• WATCH includes a sea-level rise term in the vertical position attribute, which is used to
recalculate the possible change in the acceptable criteria range based on the relative rise in sea
level. Future vertical position (trajectory) is then compared to this new criteria.
• WATCH identifies current or projected attribute violations based on the evidence that the user
provides to the Tool.
User Guide for the Site-Specific Salt Marsh Decision Support Tool
A publication of the Partnership for the Delaware Estuary—A National Estuary Program
6• The user selects the next attribute and repeats these steps until all attributes are evaluated.
• Once the user completes all the attributes, WATCH delivers an output of either deficiency
detected, no deficiency detected, or further evaluation recommended with suggestion of
associated attributes to evaluate, along with summary tables of the results.
Important Notes:
• All WATCH evaluations weigh the evidence supplied by the user (metric values, current and
trajectory) against criteria supplied by the user to determine if there is evidence of a current or
future deficiency.
• WATCH assumes no deficiency at the site and relies on quantitative evidence to suggest one.
• Confidence in the output will match the confidence the user has in their input metric, criteria,
and trajectory values. Since WATCH output is dependent on these values, the burden is on the
user to provide the most accurate and representative values for a high confidence output.
• Soil condition and water quality inputs will not produce violations but are included to provide
context for other violations and overall site condition.
• WATCH will not complete any calculations unless ALL justification boxes are complete
Figure 1 Workflow for WATCH and relationships among the various components.
User Guide for the Site-Specific Salt Marsh Decision Support Tool
A publication of the Partnership for the Delaware Estuary—A National Estuary Program
73. Stepwise Data Input Instructions
1. For each attribute, choose one Metric from the dropdown menu that will be evaluated (column
A).
2. Click on the Method cell for the selected Metric (column B) and select a method from the
dropdown menu.
3. Enter the current Metric value in the Metric Value cell (column C) and its associated units
(column D).
4. Use the Metric Justification (column E) to describe data collection methods or source of the
data, providing detail as appropriate.
5. Enter the appropriate range of values for the Criteria in the row associated with the selected
Metric in columns F & G, along with the appropriate units in column H *Note units should
match in columns D & H.
6. Select the appropriate Reference Criteria type from the drop down menu in column I
7. Use the Justification (column J) to describe Criteria value choice, how they relate to the Metric
and Goal, and from where they were sourced.
8. Enter the Trajectory Metric range values in columns K & L and their associated units in
column M *Note: the numerator units in column M should match units from columns D & H
with year in the denominator, e.g., enter “m” for m/yr.
9. Use the Justification (column N) to describe the source of the trajectory data and why it was
deemed appropriate
10. Enter the number of years over which metric change will be evaluated in the Years in Future
(column O)
11. Use the Justification (column P) to describe the reasoning for selecting the number of Forecast
Years entered in column O.
12. The Forecasted or Projected Metric (columns Q & R) will calculate the projected change in
the metric from today's value based on the Metric Trajectory and the Forecast Years.
13. Columns Q–W will populate automatically.
Notes:
• All Justifications must be filled out for the Decision Tool to calculate violations
User Guide for the Site-Specific Salt Marsh Decision Support Tool
A publication of the Partnership for the Delaware Estuary—A National Estuary Program
8• If there is no data for an attribute, the assumption is that it meets the chosen Criteria; absence
of data cannot trigger a deficiency.
• For binary data types (presence/absence, yes/no, etc…) code the favorable outcome as 1 (e.g.,
no invasive, presence of a species of interest) and the unfavorable as 0 (e.g., invasive, faunal
movement inhibited) where numerical input is required.
• For Horizontal Position data, a negative number indicates erosion and a positive number
indicates accretion/progradation
• For Vertical Position, data should be entered relative to a vertical datum (NAVD88 or local
tidal datum). After inputting the local relative sea level rise rate, WATCH recalculates how
the acceptable criteria changes relative to rising sea levels and then compares the future
elevation (trajectory) to these new criteria. This approach assumes that the vertical datum units
do not change with rising sea levels, as what might be expected through using NAVD88.
Although the tool can be populated using any datum, it is likely that tidal datum (e.g., MHW,
MLW) will also change over time relative to sea level rise.
Points of Contact:
Joshua Moody, Restoration Programs Manager, jmoody@delawareestuary.org
LeeAnn Haaf, Wetlands Coordinator, lhaaf@delawareestuary.org
Ella Rothermel, Science Technical Analyst, erothermel@delawareestuary.org
4. Input and Calculations
Regulatory Checklist
WATCH provides a Regulatory Checklist on the second tab of the spreadsheet to assist DE/NJ users
in compiling information that is useful for determining input metrics and organizing data pertinent to
regulatory applications. This checklist streamlines the data collecting process by identifying attributes
that meet assessment criteria as well regulatory inquiries. For example, a WATCH user may analyze
historical imagery to quantify change for the horizontal position attribute, which, if desired, is also
required to obtain an Army Corps of Engineers NWP27 permit for Bank Stabilization. By selecting a
permit on the Regulatory Checklist tab that the user thinks may be appropriate for a future intervention,
WATCH will track the user’s progress in collecting information for those listed permit requirements
on the Output Reflection Tab. Please note that the regulatory checklist for each included permit,
is NOT a comprehensive list of permit requirements, but a truncated list that identifies where
specific items meet requirements for a specific permit and an attribute-specific metric.
Attributes
“Attribute” refers to the various interactive factors, like inundation, elevation, and plant production,
empirically shown to be fundamental for proper and resilient salt marsh function (Fig. 2). For the
purposes of WATCH, these dynamic factors, or attributes, represent measurable qualities of a marsh
User Guide for the Site-Specific Salt Marsh Decision Support Tool
A publication of the Partnership for the Delaware Estuary—A National Estuary Program
9(Table 1). An important part of WATCH is that it integrates information from multiple attributes to
provide a holistic assessment of condition. For further information, see Appendix A for attributes and
associated metrics table.
Metrics & Methods
Attributes are quantified using relevant metrics, which are characteristics associated with the attribute
that the user derives using scientifically sound methods. For example, the state (current and future) of
the vertical position attribute (unitless) is evaluated using an elevation metric (units; e.g., meters, and
potentially relative to a datum; e.g., mean low water) for which data is collected following a specific
Figure 2 WATCH attributes
method (e.g., LiDAR, RTK-GPS survey). For each attribute, the user selects a single metric, and for
that metric, a single method. All WATCH metrics and methods align with the Framework for
Developing Monitoring Plans for Coastal Wetland Restoration and Living Shoreline Projects in New
Jersey and the Developing Monitoring Plans for Living Shoreline Projects in Delaware: A Goal-Based
Framework.
Criteria & Trajectories
Criteria are a range of values provided by the user that WATCH compares the metric values against
(current and future) to evaluate evidence of deficiency. In this sense, they are analogous to reference
data. A user inputs, what they consider, acceptable criteria values for each metric per attribute.
WATCH delineates criteria into three categories. Quality criteria represent optimal values that have
been peer-reviewed or otherwise published in a high-standard format (e.g., scientific publication,
User Guide for the Site-Specific Salt Marsh Decision Support Tool
A publication of the Partnership for the Delaware Estuary—A National Estuary Program
10textbook, regulatory report). Reference criteria are values sourced from representative sites (e.g.,
public or proprietary databases, or from studies conducted at other representative sites), and typically
represent an “average” reference. Target criteria represent a specific metric value or range that the
user requires at the site (e.g., 0 m yr -1 erosion rate).
Trajectories represents the rate of change for a given metric. For the appropriate application of
restoration efforts, it is important to understand current, and the trajectory of, site function.
Disturbances can have large or small impacts on salt marshes, and current site conditions may not be
indicative of its long-term prognosis. Salt marshes that display reasonable function but are on a
downward/negative trajectory may be susceptible to future impairment without intervention.
Conversely, salt marshes that exhibit a current deficiency but are on an upward/positive trajectory may
be recovering naturally, and an investment of limited resources at this location may be impractical.
Violations
Violations indicate that either the current or projected state of an attribute lays outside the user’s
acceptable bound (criteria), or therefore there is evidence of current or future diminished function.
WATCH evaluates three types of violations: current, trajectory, and attribute. A current violation
indicates current diminished function of an attribute. This type of violation occurs when the current
metric value for a particular attribute does not fall within the criteria range. A trajectory violation
indicates likely diminished function of an attribute over the user-selected timeframe. This type of
violation occurs if the change in forecasted metric value does not fall within the criteria range. An
attribute violation occurs when unique combinations of metric-specific current and trajectory
violations occur.
Violation combinations that trigger an attribute violation are not consistent across attributes. A
horizontal position violation occurs when there is either a current or a trajectory violation (Fig. 1).
Vertical position, biology, and hydrology violations require a trajectory violation unless trajectory data
are unavailable. In that instance a current violation is enough to provide an attribute violation.
WATCH prioritizes trajectories over current data values for attribute because long-term trends account
for temporal variability. For example, a site may currently be in a deficient state, but changing in a
positive direction, or may be OK currently but on a negative trajectory. If trajectory data are not
available and the site displays a deficient current state for that metric, WATCH errs on the side of
caution and provides an attribute violation based on the current deficiency. Soil condition & water
chemistry are considered "global" attributes, in that their condition is likely reflective of the
condition of these qualities at a larger scale than the site level. Although these attributes can
receive violations, soil for instability and water chemistry for not meeting desired criteria, these
violations do not contribute to a site-wide deficiency status. Any violations incurred by these attributes
will be reflected only in the attributes of concern table. For more information on the soil condition and
water quality attributes, please see Appendix B.
Violations: Metrics, Criteria, & Trajectories
User Guide for the Site-Specific Salt Marsh Decision Support Tool
A publication of the Partnership for the Delaware Estuary—A National Estuary Program
11Current metric values, criteria, and trajectories are used together to evaluate the existing and future
state of a site. For example, if a user is evaluating the biological attribute using the percent cover
metric, they may decide that 64-100% cover is an acceptable criteria value based on either primary
literature, other reference sites, or personal research. If the current metric value is 70%, there is no
evidence of current deficiency. If trajectory data (rate of change in percent cover) show a decline in
percent cover by 1% per year, then in 10 years, percent cover might decline by 10%. If the user is
evaluating conditions 10 years from today, WATCH will calculate that the expected percent cover
(based on the user provided data) will be 60%. Thus, there is evidence of a future biological deficiency.
Required Justifications
WATCH requires justifications for the user’s current metric value, criteria ranges, trajectory source,
and forecast timeframe for the chosen metric within each attribute. These justifications should describe
the spatial and temporal resolution of the data collected and/or the rationale regarding metric, criteria,
or trajectory choices. Justifications allow reviewers to understand user-based data decisions and
document the evaluation process. WATCH requires complete justifications for calculations to occur.
5. Output Summary
Based on the unique combination of attribute violations, WATCH will classify the site condition into
one of three groups: Deficiency Detected (DD); Further Evaluation Recommended (FER); or No
Deficiency Detected (NDD). WATCH assigns a site-wide status of Deficiency Detected to
combinations of attribute violations that display evidence of an immediate or imminent deficiency.
This violation occurs when either a horizontal position violation or two or more vertical
position/biological/ hydrologic violations occur. A site-wide Deficiency Detected Table in the output
summary tab lists all combinations of attributes that triggered this status. A status of Further
Evaluation Recommended occurs when attribute violations occur, but the combinations do not merit a
Deficiency Detected classification. In this situation, there is not enough evidence to classify the site as
holistically deficient, but accrued violations are important to note. The Attributes of Concern Table
lists all violated attributes along with any attributes to which they have a close association. A status of
No Deficiency Detected indicates no attribute violations.
6. Output Reflection
Regulatory Checklist
If a permit has been selected, column A will indicate that the requirements are either “complete” or
incomplete”. If incomplete, the user should review selected permits on the Regulatory Checklist tab
to identify any requirements not yet evaluated. Permits not selected are marked “N/A”.
Interpretive Guidance
The Interpretive Guidance section provides the user with troubleshooting advice, data exploration
ideas, and anecdotes to support the synthesis of thoughtful conclusions from WATCH outputs.
User Guide for the Site-Specific Salt Marsh Decision Support Tool
A publication of the Partnership for the Delaware Estuary—A National Estuary Program
12Additional Considerations
This section includes items that, although not explicit permit requirements, are of interest to many
stakeholders and need to be understood before proposing a site-specific intervention.
7. Training Scenarios
The two scenarios provided below are for training purposes, and do not reflect any specific occurrence
or site. The first guides the user in data input, and the second will highlight WATCH versatility in
considering output confidence, timeframes and prioritization, and the value of the multi-attribute
approach.
Scenario 1: Bird Blind
Goal: For the user to become familiar with data input, and answering the question, should there be
site intervention based on the evidence described below?
Scenario Description
An urban wildlife refuge is an important stopover for migratory birds along the Atlantic flyway. The
refuge is beginning restoration and resiliency planning, and want to ensure that the habitat and visitor
features are suitable and protected into the future. Fifteen years ago, the refuge installed a bird blind
10 m from the marsh’s edge to allow visitors to better view and experience the migratory birds, and
safety regulations require a minimum of 5 m distance. In recent years, refuge staff documented active,
ongoing erosion of 0.25 m and 0.75 m per year, using RTK-GPS survey data. The most recent data
placed the bird blind six meters from the shoreline’s edge. In the next five years, will the bird blind
need relocation? Hint: Horizontal Position attribute.
Additionally, annual random plot sampling data showed that salt marsh hay, an important habitat
feature of the refuge, decreased from 50% to 45% coverage in the high marsh areas over the last five
years. Healthy marshes in the region range in 45% to 55% plant species coverage, and decreases in
salt marsh hay coverage have led to increases in common reed coverage, which exhibits low habitat
quality. Should you be worried about the current rate in species change in 5-years? Hint: Biology
attribute.
Refuge staff thinks the habitat loss is due to changes in the vertical position of the high marsh, which
they monitor annually. This year, the average treatment plot elevation was +0.8 m NAVD88, a decline
from +1.4 m NAVD88 eight years prior, respectively. The appropriate vertical position, as provided
by scientific literature, is between +1.0 and +1.2 m NAVD88, mean sea level is +0.15 m NAVD88,
and is increasing by 4 mm yr-1. Is the elevation a current or future concern? Hint: Vertical Positon
attribute.
Pressure sensors deployed for one year showed water levels were above mean higher high water (+1.0
m NAVD88) 100 days out of the year. Preferred inundation for the ideal vegetation is between 25%
User Guide for the Site-Specific Salt Marsh Decision Support Tool
A publication of the Partnership for the Delaware Estuary—A National Estuary Program
13and 35%. Inundation rates are increasing 0.01% to 0.5% per year, according to recent studies in the
area. In the next five years, will the percentage of inundation time be within the appropriate range for
vegetation persistence? Hint: Hydrology attribute.
Data Inputs:
Horizontal Position:
• Inputs:
o Current Metric: 6 m
o Criteria: 5-10 m (regulatory standard and original position)
o Trajectory: -0.25 to -0.75 m yr-1
o Forecast Years: 5
• Output:
o Forecasted Metric: 4.75 m – 2.25 m
o Trajectory and Attribute Violations (green, red, red)
• Interpretation: In the next 5 years the bird blind will need to be moved
Biological:
• Inputs
o Current Metric: 45%
o Criteria: 45% - 55%
o Trajectory: -1% - -1% yr-1
o Forecast Years: 5
• Output:
o Forecast Metric: 40% - 40%
o Trajectory and Attribute Violations (green, red, red)
• Interpretation: There is concern that coverage of optimal plant species will be below the
desired threshold in the next 5 years.
Vertical Position:
• Inputs
o Current Metric: 0.8 m NAVD88
o Criteria: 1.0 – 1.2 m NAVD88
o Trajectory: -0.075 – -0.075 m NAVD88
o Forecast Years: 5
o Sea Level Rise Rate: 0.004 m
• Output:
o Forecast Metric: 0.425 – 0.425 m NAVD88
o Forecasted Criteria:1.020 – 1.220
o Current, Trajectory, and Attribute Violations (all red), current and projected future
position is within range of criteria standard
• Interpretation: There is evidence of a current elevation deficiency, which is expected to
continue into the future.
User Guide for the Site-Specific Salt Marsh Decision Support Tool
A publication of the Partnership for the Delaware Estuary—A National Estuary Program
14Hydrology:
• Inputs
o Current Metric: 27%
o Criteria: 25% - 35%
o Trajectory: 1% – 5%
o Forecasted Years: 5
• Output:
o Forecast Metric: 27.5% - 29.5%
o No Violations (all green)
• Interpretation: Percent inundation time is currently appropriate for the target vegetation, but
it is expected to increase outside of the desired range.
Output Summary
• Table 1: Site-wide Deficiency Detected
o Horizontal Position
o Vertical + Biology+Hydrology
• Table 2: Attributes of Concern & Associated Attributes
o Horizontal Position: N/A
o Vertical Position: Bio, Hydro
o Biology: Vertical Position, Hydro
o Hydrology: Vertical Positon, Biology, Water Chemistry
• Table 3: Violations Summary
o 3 Attribute Violations
o 1 Current Violations (today)
o 3 Trajectory Violations (tomorrow)
• Figure 1: Deficiency Summary
o Current & Trajectory Deficiency: Vertical Position
o Current Deficiency:
o Trajectory Deficiency: Horizontal Position, Biology, & Hydrology
Interpretation
If no intervention occurs (e.g., shoreline stabilization), the bird blind will likely need relocated within
the next five years. Additionally, the expected increase in inundation with the decline in elevation is
likely contributing to the decline in desired vegetation cover, and this trend is projected to continue
over the next five years. The decline in elevation could be due to sediment export, so efforts that aim
to retain sediment while allowing for greater drainage are worth consideration. This site is likely a
good candidate for both shoreline and platform intervention.
User Guide for the Site-Specific Salt Marsh Decision Support Tool
A publication of the Partnership for the Delaware Estuary—A National Estuary Program
15Scenario 2: Evacuation Route Buffer
Goal: The goal of this exercise is to showcase how data and output exploration can provide useful
information regarding attributes without violations, timeframes of concern, and appropriate criteria
selection that can contribute to a more thorough interpretation.
Scenario Description
A salt marsh site tract is located along a back bay adjacent to the only evacuation route from a
barrier island to the mainland. The marsh is currently 500 m in length along the highway and 100 m
wide, with the waterward margin exhibiting a 5 m wide, highly sloped, low marsh fringe before
levelling onto the high marsh platform. Data from previous studies suggest that the marsh needs to
be a minimum of 75 m wide to prevent sunny day flooding on the road at its current elevation.
Analysis around the bay shows an average erosion rate of between 0.25 and 1.5 m yr-1.
The tide range for the region is 1 m, with the average elevation of the marsh platform positioned at
0.77 m relative to MLW. Based on scientific literature regarding proper flooding time for the marsh
platform, and local knowledge of the relationship between the elevation and the tide range, this a
vertical position of 0.75 to 0.95 m relative to MLW is required for the marsh to receive the proper
flooding regime to persist. Data from a local SET suggests that accretion is occurring at a rate
between -1 and 2 mm yr-1, and state authorities plan for 4 mm yr-1 sea level rise.
Vegetation cover was 60% in 2019, but productivity has been declining 2-3% per year for the last
decade. As it is a small, sloped marsh, drainage density was not the primary concern, but pannes
comprise 10% of the total area. Many local marshes deteriorated rapidly when intra-marsh open
water increased beyond 15% of the total area. At this site, pannes have been stable for the past 20
years, with some shrinking by ~0.5% and some increasing by 0.01%.
The community is currently putting together a 10 year resiliency plan and is wondering if they need
to allocate funds for restoration work at this marsh in that timespan to prevent roadway flooding
along the evacuation route.
Data Inputs and Outputs
Horizontal Position
• Inputs
o Current Metric: 100 m
o Criteria: 75-100 m
o Trajectory: -0.25 to -1.5 m yr-1
o Forecasted Years : 10
• Output:
o Forecasted Metric: 97.5 – 85 m
o No Violations (all green), current and projected future position is within range of
criteria
Vertical Position
• Inputs
o Current Metric: 0.77 m MLW
User Guide for the Site-Specific Salt Marsh Decision Support Tool
A publication of the Partnership for the Delaware Estuary—A National Estuary Program
16o Criteria: 0.75 - 0.95 m MLW
o Trajectory: -0.001 to 0.002 m MLW
o Forecasted Years: 10
o SLR Predicted Rate: 0.004 m yr-1
• Output:
o Forecasted Metric: 0.760 – 0.790 m MLW
o Forecasted Criteria: 0.790 – 0.990
o Current Violation: no violation (green) as the current value is within the bounds of
the standard
o Trajectory Violation: violation was identified (red) as the forecasted relative
elevation may be outside the range of the standard.
o Attribute Status: violation occurred (red) since evidence suggests site may be on a
negative trajectory.
Biology
• Inputs
o Metric: Vegetation productivity was the metric of interest, as aboveground
vegetation facilitates sedimentation and attenuates waves.
o Method: Percent cover
o Current Metric: 60%
o Criteria: 50-100%
o Trajectory: - 2% - -3%
o Forecasted Years: 10
• Output
o Forecasted Metric: 40- 30%
o Current Violation: no violation (green) - current vegetation coverage is acceptable to
perform the desired functions,
o Trajectory Violation: violation (red) - percent cover is on the decline
o Attribute Status: violation (red) - evidence suggests site may be on a negative
trajectory.
Hydrology
• Inputs
o Metric: drainage - concerns about pannes changing hydrology
o Method: percent open water within marsh
o Current Metric: 10%
o Criteria: 0-15%
o Trajectory: Between -0.5% - 0.01%
o Forecasted Years: 10
• Outputs
o Forecasted Metric: 5%-10.1%
o No Violations (all green)
Soil Condition: These data are not supplied in the word problem for the sake of simplicity. If
characterizing soils as part of your monitoring activity, these are common metrics. The outcome
User Guide for the Site-Specific Salt Marsh Decision Support Tool
A publication of the Partnership for the Delaware Estuary—A National Estuary Program
17of these inputs is an “A” classification, indicating that the substrate is peaty/sandy, is likely
aerated, and largely stable.
• Input
o Organic Thickness: Depth (cm): 100 cm – Grade = A
o Parent Material: sandy, loamy-sand – Grade = A
o Decomposition State: L1” H1-H4, Fibric. Peat, Oi – Grade = A
• Outputs
o Suggested Soil Type: Mispillion/Pawcatuck
o Attribute Status Final Grade: A
Water Quality: N/A
Output Summary
• Table 1: Site-wide Deficiency Detected
o Vertical + Biology
• Table 2: Attributes of Concern
o Vertical Position: Bio, Hydro
o Biology: Vertical Position, Hydro
• Table 3: Violations Summary
o 2 attribute violations
o 0 current violations (today)
o 2 trajectory violations (tomorrow)
• Figure 1: Deficiency Summary
o Vertical Position and Biology Trajectory Deficiencies
Interpretation
• Vertical position and biology (vegetation percent cover) were both adequate for today, but
exhibited evidence of being on negative trajectories. As these two attribute are closely
related, it is likely that there is a negative feedback between the two – as vegetation declines,
it traps less sediment, which reduces the potential for steady elevation gain, which in turn can
negatively affect vegetation growth.
• Evaluation of unvegetated area (pannes, hydrology attribute) did not provide evidence that
the either the current state or trajectory were concerning regarding expansion, so their
presence was not likely a contributing factor to the vertical and biological deficiencies.
• As hydrology was identified as a close associate of both the vertical position and biology
attribute, the user may want to consider evaluation an additional hydrologic metric such as
drainage density, to confirm confidence in this attribute.
• Soil are largely stable and well drained so likely OK
• Potential drives of poor condition:
o Not enough sediment in system to keep up, but did see up to 2 mm accretion was
possible (Vertical attribute high trajectory), the range of future vertical position was
forecasted at a maximum to be at an acceptable position (0.75 m MLW).
o Trapping potential – check for spatial correlation between vertical position trajectory
and percent cover, if correlated, likely localized
User Guide for the Site-Specific Salt Marsh Decision Support Tool
A publication of the Partnership for the Delaware Estuary—A National Estuary Program
18o Augmenting vegetation in declining areas or adding some sediment may jump start
o The user may want to consider additional drivers such as herbivory and overall water
quality.
Scenario 2: Modification A
Goal: To show user how to investigate the trajectory violations by adjusting timeframe data.
Data Inputs and Outputs
Horizontal Position: Increase erosion rate to trigger a trajectory violation
• Inputs
o Change trajectory: -2 to -4 m yr-1
• Outputs
o Current Violation: no violation (green)
o Trajectory Violation: violation (red)
o Attribute Status: violation (red)
Vertical Position: Increase elevation gain to compensate for SLR. Now there are no violations
• Inputs
o Change trajectory: 0.004 – 0.004 m yr-1 MLW
• Outputs
o Current Violation: no violation (green)
o Trajectory Violation: no violation (green)
o Attribute Status: no violation (green)
Output Summary
• Table 1: Site-wide Deficiency Detected
o Horizontal Position
• Table 2: Attributes of Concern
o Horizontal Position: N/A
o Biology: Vert, Hydro
• Table 3: Violations Summary
o 2 attribute violations
o 0 current violations (today)
o 2 trajectory violations (tomorrow)
• Figure 1: Deficiency Summary
o Horizontal Position and Biology Trajectory Deficiencies
Interpretation
• There is evidence of a future erosion problem, but when will the problem be a real issue?
Adjust the value for “Years in the Future” under the Horizontal Position Attribute tab
Forecasted or Projected Metric section and see when the violation occurs. Here, a horizontal
position violation does not occur until year 9. The user can now decide if there is a need for
direct intervention now, or if it is better to watch the erosion, and reevaluate the horizontal
position and trajectory in a few years.
User Guide for the Site-Specific Salt Marsh Decision Support Tool
A publication of the Partnership for the Delaware Estuary—A National Estuary Program
19• There is no evidence that elevation cannot keep pace with SLR for next decade, or that
excessive panne expansion is occurring. Soils are fine indicating that waterlogging is not an
issue.
• There is evidence that vegetation is on a negative trajectory and will surpass desired percent
cover in 4 years.
• Next steps: As vegetation is on the decline, without a vertical position violation, further
hydrologic evaluation may be a good idea (e.g., drainage density). Additionally, it is
probably a good idea to continue monitoring vertical position and hydrology for next few
years to confirm trajectory and reevaluate
Scenario 2: Modification B
Goal: To highlight the importance of evaluating all attributes, and how global attributes, such as soil
condition, can provide context for other attribute violations.
Data Inputs and Outputs
Horizontal Position: Create violations for criteria and trajectory violations - a problem today that
will continue into tomorrow.
• Input
o Current: 95 m
o Criteria: 100-100 m
• Outputs
o Current Violation: violation (red)
o Trajectory Violation: violation (red)
o Attribute Status: violation (red)
Biology: Create criteria and trajectory violations - a problem today that will continue into tomorrow.
• Input
o Current metric: 40%
• Outputs
o Current Violation: violation (red)
o Trajectory Violation: violation (red)
o Attribute Status: violation (red)
Hydrology: Create criteria and trajectory violations - a problem today that will continue into
tomorrow.
• Input
o Current: .20%
• Outputs
o Current Violation: violation (red)
o Trajectory Violation: violation (red)
o Attribute Status: violation (red)
User Guide for the Site-Specific Salt Marsh Decision Support Tool
A publication of the Partnership for the Delaware Estuary—A National Estuary Program
20Soil Condition: Characterize the soils as being composed of fine, poorly drained material with a
shallow organic layer.
• Input
o Organic Thickness: Depth (cm): 20 cm – Grade = C
o Parent Material: silt, silt-clay – Grade = C
o Decomposition State: L3: H8-H10, Sapric. Muck, Oa – Grade = C
• Outputs
o Suggested Soil Type: Broadkill/Appoquinimink
o Attribute Status Final Grade: C
Output Summary
• Table 1: Site-wide Deficiency Detected
o Horizontal Position
o Biology+Hydrology
• Table 2: Attributes of Concern
o Horizontal Position: N/A
o Biology: Vertical Position, Hydrology
o Hydrology: Vertical Position, Biology, Water Quality
o Soil Condition: Vertical Position, Hydrology
• Table 3: Violations Summary
o 4 attribute violations
o 3 current violations (today)
o 3 trajectory violations (tomorrow)
• Figure 1: Deficiency Summary
o Horizontal Position, Biology, Hydrology, Soil Condition Current & Trajectory
Deficiencies
Interpretation
• Evidence of obvious erosion problem today and projected to continue into tomorrow
• Evidence suggests vertical position is ok and projected to stay that way
• Biology and Hydrology conditions are already below desired threshold (criteria violation)
and evidence suggests that they will continue on that trajectory
• Soil condition is also poor
• These may suggest water logging, and as such a hydrologic intervention
o Water logging results in pond expansion and vegetation die off, with erosion being
observed along the edge
o If just considering the erosion rate, shoreline stabilization may be sought, but if that
is all we do, we will not attend to the underlying problem – we need drainage
o This output said something was necessary, but without looking at the underlying
conditions (Soils + Hydo), we may not have understood it – GET A WETLAND
HYDROLOGIST ON THE TEAM!
Scenario 2: Modification C
User Guide for the Site-Specific Salt Marsh Decision Support Tool
A publication of the Partnership for the Delaware Estuary—A National Estuary Program
21Goal: To show the importance of identifying appropriate reference data (i.e., criteria and trajectory
ranges) in which user confidence.
Data Inputs and Outputs
Horizontal Position: Let us say there are variable erosion and accretion rates measured along the
shoreline of the site, sometimes at the same location at different points in time. As such, requiring
zero erosion may not be necessary, as you expect periods of erosion and accretion. Since the marsh
only needs to be 75 m wide to prevent flooding on the road, and we saw in Modification A that
excessive erosion may not take place for 9 years, lets accept a wider criteria range.
• Inputs
o Current Metric: 100 m
o Criteria 80-100 m
o Trajectory: -0.25 to -1.5 m yr-1
o Forecasted Years: 10
• Outputs
o Forecasted Metric: 85 to 97.5 m
o Current: no violation (green)
o Trajectory: no violation (green)
o Attribute Status: no violation (green)
Vertical Position: If you have been moving through the modification successively, there should be
no current vertical position violations. The scenario description originally described the trajectory as
being within the range of -0.001 m to 0.002 m MLW, so let go back to those measurements.
Additionally, data showed that for the vegetation to persist, the marsh requires an elevation of 0.75
to 0.95 m MLW. These data resulted in trajectory and attribute violations. Let us say that the vertical
position requirements for the vegetation were not ideal, but that the vegetation could actually persist
over a wider range of elevations, but may just not be as robust. The justification for the original data
identifies primary literature as the source, but how transferrable are those values? Maybe the studies
that supplied those data were from a different geography where important factors such as tide range
also differ from this site. At this location, if there are observations of the vegetation persisting at a
wider range with no deficiencies, a wider range of criteria may be appropriate.
• Inputs
o Trajectory: -0.001 to 0.002 m MLW
o Criteria: 0.6 to 0.95 m MLW; justification is that this range is observed in nearby
locations where no deficiencies have been detected.
• Outputs
o Current: no violation (green)
o Trajectory: no violation (green)
o Attribute Status: no violation (green)
Biology: Create a trajectory violations – no evidence of a deficiency today, but likely to be one
tomorrow.
• Input
User Guide for the Site-Specific Salt Marsh Decision Support Tool
A publication of the Partnership for the Delaware Estuary—A National Estuary Program
22o Criteria metric: 40% -100%
• Outputs
o Current Violation: no violation (green)
o Trajectory Violation: violation (red)
o Attribute Status: violation (red)
o
Output Summary
• Table 1: Site-wide Deficiency Detected
o Biology+Hydrology
• Table 2: Attributes of Concern
o Biology: Vertical Position, Hydrology
o Hydrology: Vertical Position, Biology, Water Quality
o Soil Condition: Vertical Position, Hydrology
• Table 3: Violations Summary
o 3 attribute violations
o 1 current violations (today)
o 2 trajectory violations (tomorrow)
• Figure 1: Deficiency Summary
o Hydrology, Soil Condition Current & Trajectory Deficiencies
o Biology Trajectory Deficiency
Interpretation
o Since narrow criteria ranges are easier to violate than wider ranges, careful thought
must be applied when choosing the most appropriate range. In the original scenario,
the ideal vertical position range resulted in trajectory and attribute violations. In this
modification, we suggest that the acceptable vertical position range is wider than the
ideal and applying those data result in no vertical position violations. Here the user
needs to decide: is only the ideal acceptable? Additionally, how confident is the user
in the ideal (i.e., its sources)? If vegetation is seen persisting at a wider range of
elevations in marshes where no deficiencies have been detected, it is plausible for the
user to select the wider range as being appropriate. Criteria selection is not always
clear-cut, and the user will have to make and justify (in the appropriate cells) their
choices.
o Hydrology and Soil Condition are current and likely on-going issues. Biology
(vegetation percent cover) is a future issue without evidence of an elevation
deficiency. It is therefore likely a hydrologic issue (e.g., drainage) needs investigated
BEFORE it causes biological issues.
o In this modification, using the most appropriate vertical criteria range for the site,
allows for a more precise diagnosis of the underlying cause of the issue -hydrology.
User Guide for the Site-Specific Salt Marsh Decision Support Tool
A publication of the Partnership for the Delaware Estuary—A National Estuary Program
23Bibliography and Works Cited
Cahoon, D.R. 2015. Estimating Relative Sea-Level Rise and Submergence Potential at a Coastal
Wetland. Estuaries and Coasts 38, 1077–1084. https://doi.org/10.1007/s12237-014-9872-8
Cahoon, D., and G. R. Gutenspergen. 2010. Climate change, sea level rise, and coastal wetlands. National
Wetlands Newsletter, 32(1):8-12.
Callahan, John A., Benjamin P. Horton, Daria L. Nikitina, Christopher K. Sommerfield, Thomas E.
McKenna, and Danielle Swallow. 2017. Recommendation of Sea-Level Rise Planning Scenarios
for Delaware: Technical Report, prepared for Delaware Department of Natural Resources and
Environmental Control (DNREC) Delaware Coastal Programs.
Costanza, R, MA Wilson, A Troy, and A Voinov. 2006. The value of New Jersey’s ecosystem services
and natural capital: 179.
Costanza, Robert, Ralph Arge, Rudolf De Groot, Stephen Farberk, Monica Grasso, Bruce Hannon,
Karin Limburg, et al. 1997. The value of the world’s ecosystem services and natural capital.
Nature 387: 253–260. doi:10.1038/387253a0.
Deegan, L. a., Johnson, D. S., Warren, R. S., Peterson, B. J., Fleeger, J. W., Fagherazzi, S., & Wollheim,
W. M. 2012. Coastal eutrophication as a driver of salt marsh loss. Nature, 490(7420), 388–392.
http://doi. org/10.1038/nature11533
Donnelly, J P, and M D Bertness. 2001. Rapid shoreward encroachment of salt marsh cordgrass in
response to accelerated sea-level rise. Proceedings of the National Academy of Sciences of the
United States of America 98: 14218–14223. doi:10.1073/pnas.251209298.
Delaware Living Shoreline Committee. 2018. Developing monitoring plans for living shoreline
projects in Delaware: A goal-based framework. A report prepared by the Delaware Living
Shorelines Committee Standards of Practice Subcommittee.
Ganju, N. K., Defne, Z., Kirwan, M. L., Fagherazzi, S., D’Alpaos, A., & Carniello, L. 2017. Spatially
integrative metrics reveal hidden vulnerability of microtidal salt marshes. Nature
Communications, 8(January). https://doi.org/10.1038/ncomms14156.
Haaf, L., D. Kreeger, A. Homsey. 2017. “Chapter 5.2 - Intertidal Wetlands” in the Technical Report
for the Delaware Estuary and Basin. Partnership for the Delaware Estuary. PDE Report No.
17-07, pp. 177-193.
Holling, C S. 1973. Resilience and Stability of Ecological Systems. Annu.Rev.Ecol.Syst.
doi:10.1146/annurev.es.04.110173.000245.
User Guide for the Site-Specific Salt Marsh Decision Support Tool
A publication of the Partnership for the Delaware Estuary—A National Estuary Program
24You can also read