A data mining approach on anonymised mobile location data to provide customer insights in key retail stores Sinead Kavanagh - MSc Research Project ...
←
→
Page content transcription
If your browser does not render page correctly, please read the page content below
A data mining approach on anonymised
mobile location data to provide customer
      insights in key retail stores

             MSc Research Project
               Data Analytics

            Sinead Kavanagh
                   x16137795

             School of Computing
           National College of Ireland

         Supervisor:   Mr. Vikas Sahni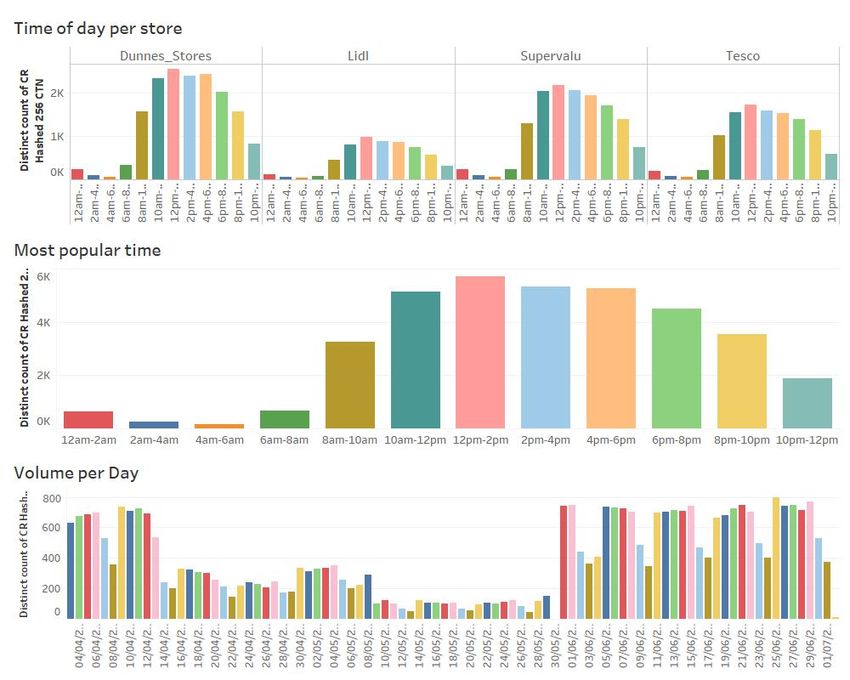
National College of Ireland
                      Project Submission Sheet – 2017/2018
                              School of Computing

 Student Name:             Sinead Kavanagh
 Student ID:               x16137795
 Programme:                Data Analytics
 Year:                     2018
 Module:                   MSc Research Project
 Lecturer:                 Mr. Vikas Sahni
 Submission     Due        13/08/2018
 Date:
 Project Title:            A data mining approach on anonymised mobile location data
                           to provide customer insights in key retail stores
 Word Count:               6,710

    I hereby certify that the information contained in this (my submission) is information
pertaining to research I conducted for this project. All information other than my own
contribution will be fully referenced and listed in the relevant bibliography section at the
rear of the project.
    ALL internet material must be referenced in the bibliography section. Students
are encouraged to use the Harvard Referencing Standard supplied by the Library. To
use other author’s written or electronic work is illegal (plagiarism) and may result in
disciplinary action. Students may be required to undergo a viva (oral examination) if
there is suspicion about the validity of their submitted work.

 Signature:

 Date:                     10th August 2018

    PLEASE READ THE FOLLOWING INSTRUCTIONS:
1. Please attach a completed copy of this sheet to each project (including multiple copies).
2. You must ensure that you retain a HARD COPY of ALL projects, both for
your own reference and in case a project is lost or mislaid. It is not sufficient to keep
a copy on computer. Please do not bind projects or place in covers unless specifically
requested.
3. Assignments that are submitted to the Programme Coordinator office must be placed
into the assignment box located outside the office.

 Office Use Only
 Signature:

 Date:
 Penalty Applied (if
 applicable):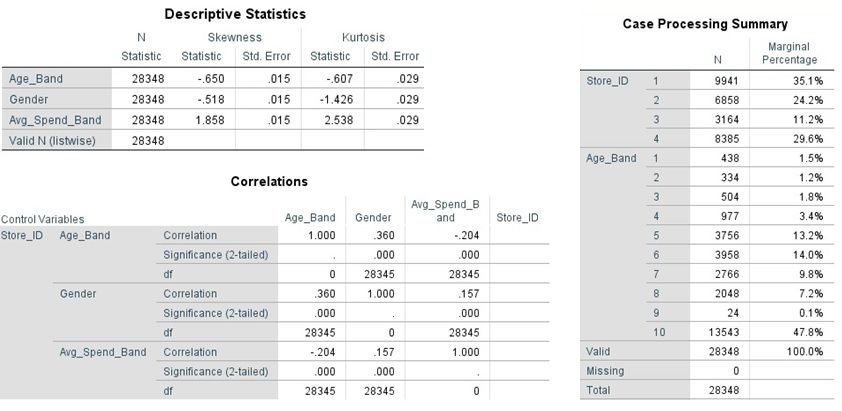
A data mining approach on anonymised mobile
location data to provide customer insights in key retail
                         stores
                              Sinead Kavanagh
                                 x16137795
                    MSc Research Project in Data Analytics
                                  10th August 2018

                                         Abstract
          Mobile devices contain a plethora of information pertaining to an individual.
     The high volume of data collected by telecoms operators coupled with the vast
     knowledge this data can provide can be beneficial to third parties. This informa-
     tion is not currently provided to third parties by the network operators. Therefore
     this study was initiated to identify insights which could conceive a commercial
     product. The network location data that can be extracted from the device along
     with demographic information obtained upon signing up to an operator are the ele-
     ments of the mobile data that this study focused on. The research question required
     a data mining approach on anonymised location data to provide a retail analysis
     insight using four key retail brands in three specific Dublin postcodes. Using SHA
     256 function in R, the customers data was anonymised and then analysed using
     Statistical Analysis, Machine Learning and Data Mining techniques with SPSS, R
     Studio, SQL Server Management Studio and Tableau. Key insights such as volume
     of customers per day and time, overlaid with demographic information and iden-
     tification of customer patterns relating to each store brand were the outputs of
     this study. This research demonstrated a method to provide retail insights using
     telecoms data and recommends a commercial approach in which this analysis can
     be used to provide revenue.

1    Introduction
The research topic underlying this study is: A data mining approach on anonymised
mobile location data to provide customer insights in key retail stores. This research is a
case study to identify if the insights gained using this data can be a commercially viable
product to third parties. The objective was to identify the best approaches that produce
varying levels of analysis.
   As customer data was used, the operators Regulatory Team reviewed all proposed
approaches for this research and approved of the study, on condition that the company
was not referenced throughout the study. The data from the Telecoms Operator was
anonymised using SHA 256 cryptographic hash function, in line with Data Protection

                                             1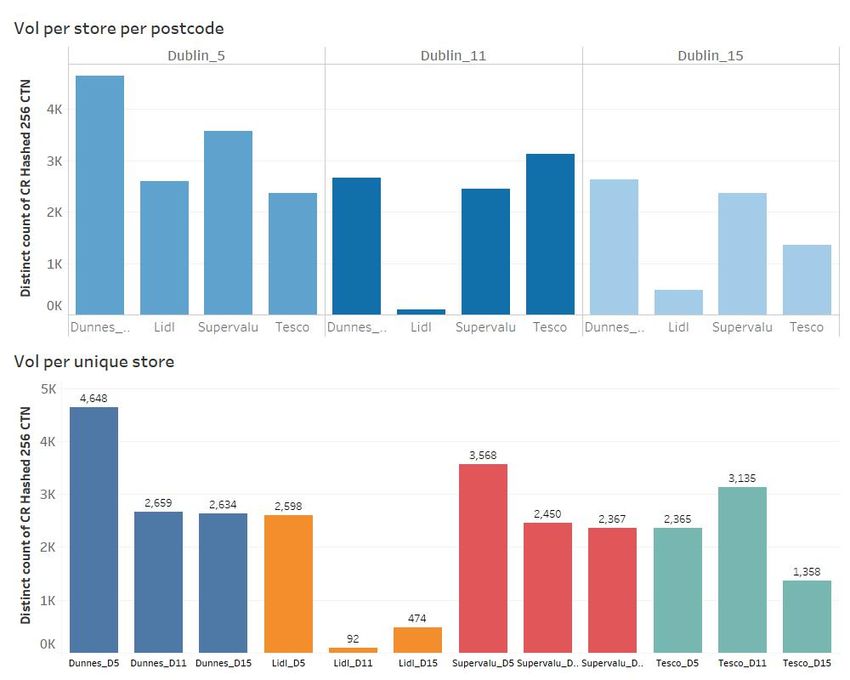
guidelines i.e. data must be anonymised and remove any personally identifiable inform-
ation which cannot be reverse engineered.
    In the following section, Related Works; there are a number of techniques and ap-
proaches currently using mobile location data, however the majority of these approaches
use a type of pseudonymisation which does not guarantee full data privacy of a subject.
Hence, SHA 256 was deemed the most appropriate as SHA 256 enables irreversibility on
the customers unique number i.e. their customer telephone number (CTN).
    Network location data was used by identifying the site towers closest to the retailers in
the various locations. The retailers used were, Dunnes Stores, Lidl, Tesco and Supervalu,
and each of the four retailers were reviewed in Dublin 15, Dublin 11 and Dublin 5.
These are the four main retailers in Ireland, which enabled a sizeable sample dataset
to be extracted due to their popularity and the location in which they are situated.
Demographic information such as Age, Gender and Average Spend was used to overlay
the network location data. It is important to note that the Average Spend refers to a
users monthly mobile spend and not the spend in the stores.
    The paper is organised into six sections as follows; Section 2 is the Related Works
which reviews the current literature in the area of data anonymisation, regulation re-
lating to the telecoms industry and the use of mobile location data in the retail sector.
Section 3 reviews the methodology used in the research, highlighting the techniques and
approaches applied. Section 4 discusses the implementation of the three models used to
produce different levels of analysis i.e. statistical analysis, machine learning and data
mining. Section 5 is the evaluation, discussing the output and the results following the
implementation. Finally Section 6 provides a high level conclusion and a future commer-
cial proposal which the analysis could be used to sell to third parties.

2     Related Work
There are five key elements which the literature review covers. These sections are; data
mining in retail, an overview of how mobile location data has been used in similar studies
regarding data privacy, specifically in regards to location, which govern the processing of
this type of data. Lastly, the chosen technique, SHA 256 will be used to anonymise the
personally identifiable information in this study.

2.1    Data Mining in Retail
Data Mining is the field of discovering potentially useful information from a large amount
of data, a technique used in retail businesses [20]. Recent advances in Information Techno-
logy have made it easier for retailers to collect various types of customer data25. Mining
this data for insights into customer behaviour can help retailers to solidify ephemeral
relations into long term loyalty 4. As grocery shopping is the most common and frequent
type of shopping, it has a higher relevancy for travel implications and data collection
compared to other forms of consumerism. Average distances travelled for shopping trips
have increased significantly in UK over the past twenty years with out of town retail
developments [7]. In the case of shop location selection, sales of a shop rely more on
mobile population size than static population size [27].
    Tsai et al 4, used a Location Preference Evaluation (LPE) procedure to determine
location preference for minor items. This study will use a similar approach to identify
the preferred location of a specific demographic of customer. Tsai et al [3], proposed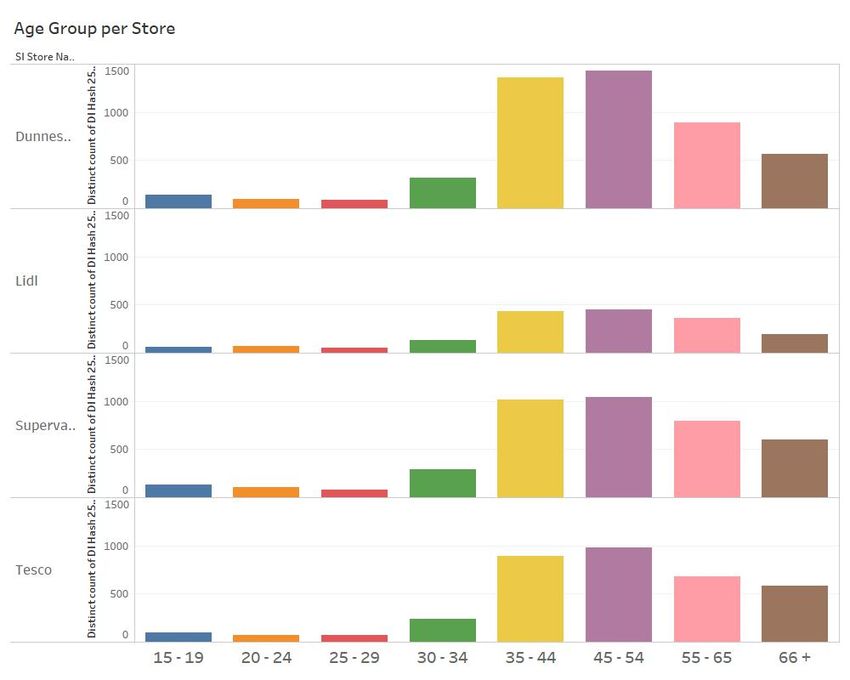
a Shopping Behaviour Prediction (SBP) system that consisted of a behaviour mining
module, a similarity inference module and a behaviour prediction module.
    Tsai et al [4], state that Data Mining is one of the most popular techniques which can
discover potential customer knowledge from human databases to assist in policy decision.
Mining user behaviours in mobile environments has emerged in the field of pattern mining.
    The development of location determination technologies such as GPS, Wi-Fi and
RFID have made it possible to collect location data from moving customers and many
behaviour prediction and recommendation systems have been proposed based on moving
path and purchase transactions [3]. Studies carried out using RFID tags installed in
shopping carts have tracked shopping paths and purchased items by individual customers
[11].
    In [3], a TMSP-MINE algorithm was proposed to generate most appropriate time
segmentation intervals based on fitness function of a genetic algorithm, while mining
mobile sequential patterns associated with moving paths and time intervals in location
based services (LBS) environments. Lu et al [8], state that mobile behaviour predictions
can be divided into two categories:
  1. Vector based predictions: This is broken into linear and non-linear models. Non-
     linear considers objects movements by more sophisticated regression functions so
     predictions are more accurate.
  2. Pattern based predictions: Enables integration of pattern mining and rule matching
     techniques to increase accuracy. Used to predict the next possible moving behaviour
     of a user.
Sleem & Kumar [1] proposed a Handoff Prediction and Enhancement Scheme (HOPES)
that combines mobile hosts movement history, current name and topography of cells.
TMSP temporal mobile sequential patterns was the first work to focus on moving mobile
sequential patterns associated with moving patterns and time intervals in LBS environ-
ments [22].
    Ying et al [10] use Geographic-Temporal-Semantic based Location Predictions (GTSP-
LP) to estimate probability of user visibility at a particular location. The core idea is the
discovery of users trajectory patterns to capture frequent movements triggered by three
types of intentions. GTSP-LP proposes a series of matching strategies to calculate the
similarity between current movement of a user and discovered GTS patterns based on
various moving intentions [10]. On basis of similitude, one can make an online prediction
as to the location the user intends to visit [10]. The three intentions are:
  1. Geographic triggered intentions: Reflect reasons why a user travels from one loca-
     tion to another
  2. Temporal triggered intentions: Reflect why a user visits and leaves a location at a
     certain time
  3. Semantic triggered intentions: Reflects why users travel from same location to
     another location, for example; why they would go food shopping straight after
     work.
Movement of users can be viewed as a contexture of the behaviours that are motivated
by the three types of intentions [10]. The extraction of representative patterns from
heterogeneous trajectory of users has a direct impact on the efficacy of the prediction
task [10].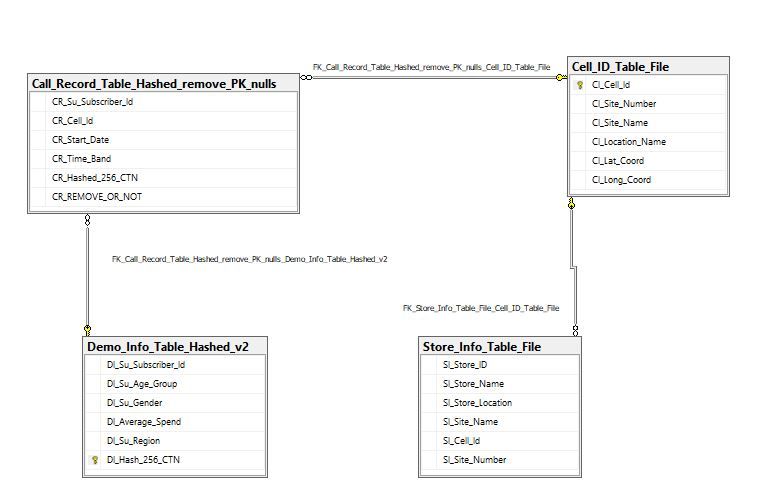
2.2    Mobile Location Data
By 2021, the number of mobile connected devices per capita is predicted to reach 1.5
and mobile data traffic to grow at an annual growth rate of 47% from 2016 to 2021 [23].
Call Detailed Records (CDRs) contain cellular network data that can be used to analyse
telecom traffic and relate users to location; however the following are key limitations of
CDRs [14]:

   • CDRs are only generated when voice, sms or data event is made

   • Location granularity limited to cell tower range, approx. 0.4km (urban) to 3km
     (rural) in Ireland.

Mamei et al [13] outline an approach to aggregate locations from CDRs using clustering.
CDRs are clustered based on regions, then using a set of factors (such as time and duration
of stay) are clustered and weighted.
    Peng et al [21] state that Location Based Services (LBS) are becoming the fastest
growing activity related services that people use in their daily life with the main problem
residing in the preservation of users privacy during usage. LBS explore vulnerability of
spatial and temporal information contained in continuous queries received by Location
Service Providers (LSPs) which may expose users whereabouts and other potential private
information [21]. Users can communicate with LSP through cellular network (3G/ 4G)
or Wi-Fi access points [21]. LSP process users snapshots or continuous queries based on
exact location or a cloaked region. They [21] used a number of assumptions in their study
such as: (1) Anonymisation Degree; including at least k different users i.e. implementing
a minimum threshold whereby they wont use the data unless it is over a specific volume
which is denoted as k and (2) Temporal threshold; users define a threshold to specify
length of timeout for each record in their cache.
    Peng et al [21] considered a heterogeneous network environment where transmission
range of each mobile user was uniformly set to 100m-300m. As the telecom operators
pre-defined base stations were used, the transmission range is approx. 0.4km in this
study. Accuracy of mobile location data is relatively low in two aspects [27]:

  1. Location point is the location of a tower station rather than location of mobile
     phone user.

  2. Sampling frequency of location data is generally low so all users actual movements
     are often not recorded due to a voice, sms or data event being required to initiate
     a sample.

In this study, voice, sms and data events were used to determine the location frequency
of a user over a three month snapshot.
    Velocity is an important parameter for human gridding trajectory which is calculated
by the distance and time interval between two adjacent records [27]. When velocity
is small, it suggests users are more likely to stay local. Fan et al [27] chose to use a
regular grid cells to aggregate very close cell phone towers to help reduce influence of
signal switches. Stevens et al [15] used random forest models to estimate the population
distribution of different cities based on mobile location data.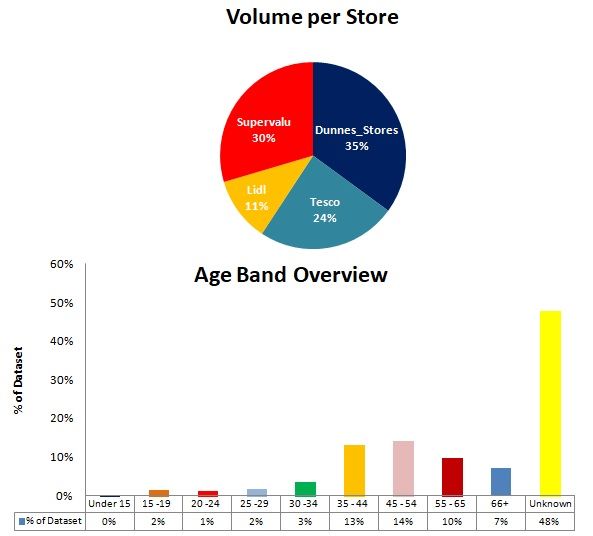
2.3    Location Privacy
The IP-based architecture of 4G networks brings several problems such as mobility, multi-
homing and location privacy [26]. They define location privacy as the ability to prevent
an attacker from deducing users location. Jo et al [9] consider the requirement of achiev-
ing location privacy of mobile node to cause high performance problem such as high
communication, computation cost and huge revocation list. Haddad et al [26] state com-
munication security requirements can be achieved by using two aspects:
  1. Time Stamp: This consists of data and time of message initiation in order to deny
     any internal or external reusing the message
  2. Signature: This allows network entity to sign message and other entities can verify
     this message.
Zhang et al [19] state that a user can save their current location using built-in GPS
features in smart phones prior to sending a query which contains their location to LBS
server. An adversary can collect queries submitted to infer sensitive information about
particular user, such as workplace, behaviour patterns and profiles [19] LBS can use
Trusted Third Party (TTP) architecture. Peng et al [21] provide two approaches for
preserving location privacy in LBS:
  1. Centralized architecture: Principle of k-anonymity was used i.e. a user cannot be
     identified amongst other users who appear in the same release. Some drawbacks for
     centralized architecture are that it is hard to find a Trusted Third Party and the
     anonymizer has all the users info which may cause a performance bottleneck. [19]
     implement a simple matching and comparison operation which effectively alleviates
     the bottleneck of the anonymizer.
  2. Non-Centralized architecture: This doesnt use a Trusted Third Party and instead
     can use obfuscation based methods, cryptographic methods or collaboration meth-
     ods.
      a. Obfuscation enlarges the location area but can provide a low level of accuracy
      b. Cryptographic based methods are not practical for mobile devices as they require
      powerful computational capability and incur a large pre-processing overhead on the
      user side.
This study has used non-centralized approach, as the location data will be directly from
the telecom operator network and not a Third Party on the datacentre. The study also
used a cryptographic method within this non-centralized architecture which [21] referred
to in their study.
    Zhang et al [19] state that the drawbacks of TTP are:
   • If an Anonymizer is compromised by an attacker, they can expose user location
     information
   • Performance bottleneck on Anonymizer
   • Challenging to find a fully Trusted Third Party.
Schlegel et al [17] proposed a dynamic grid structure to preserve privacy in LBS. However
it has the limitation that when users query spatial region is too small, and includes only
one user, the LPE can deduce the true user.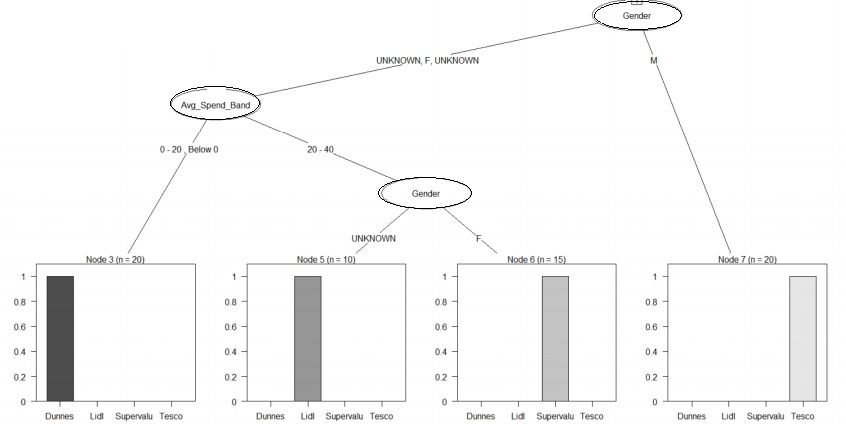
2.4    Data Privacy
The General Data Protection Regulation which replaces the pre-existing, Data Protec-
tion Acts 1988 and 2003, regulates the processing of location data relating to individuals.
Location data has special meaning for purposes of the Privacy & Electronic Communic-
ation Regulation which governs location data obtained from mobile phone base stations
on other public communication networks [5]. Location data means any data processed
in an electronic communication network or by an electronic communications services, in-
dicating the geographic position of the terminal equipment of a users publicly available
electronic communications server [16].
    In principle its permissible to collect aggregated or anonymised location for statist-
ical or service monitoring purposes [5]. The European Data Protection Board (EDPB)
replaced the Article 29 Working Party which published an opinion on the techniques for
anonymisation of data. These techniques are to ensure the consistency of the application
of GDPR throughout the European Union.

2.5    Anonymisation Techniques
Speed, security and reliability are crucial considerations in anonymisation [6]. Keerie
et al [2] declared the first stage of the data anonymisation process is to consider every
variable and assess whether its a direct identifier, indirect identifier or superfluous. They
explain the identifiers as the following:

  1. Direct identifiers: Very likely to immediately identify user, for example: name or
     email address

  2. Indirect identifiers: Pose a risk to identification when combined with others, for
     example: sex or place of birth. These can be modified to reduce risk, such as group
     age into age bands to not directly identify a specific age.

  3. Superfluous: Such as audit trail data.

Chen & Pang [24] state that users spatial and temporal information serve as quasi-
identifiers. Locations or time are replaced with regions or periods so that a certain
number of users share the same quasi-identifiers with real issuer.
    K-anonymity is another privacy technique. The principle of K-anonymity is to guar-
antee that a database entrys identifier is indistinguishable from other K-1 entries [24].
K-anonymity is one of the most popular metrics used for ensuring privacy for LBS and
LSP cant distinguish between location information of user and location information of
other (K-1) users [19]. Vu et al [12] propose a mechanism that uses the locality sensit-
ive hashing technique to divide user location into several groups such that each group
contains at least k users, allowing one to preserve the locality and k-anonymity.
    Hash functions are the main building blocks in security systems which incorporate au-
thentication modules [6]. SHA 1 and SHA 256 are the most widely used hash functions
in current applications with SHA functions being considered as the successor to MD5
function [18] All SHA* functions have some basic granularity, because they process data
by chunks (SHA 256 chunks are 64 byte long) [18]. One way hash functions are iterative
algorithms that operate on an arbitrary length message and return a fixed length output
that is called message digest or hash value [6]. SHA 1 performs 80 iterations whereas SHA
256 performs 64 iterations to produce the message digest [6]. SHA 256 provides greater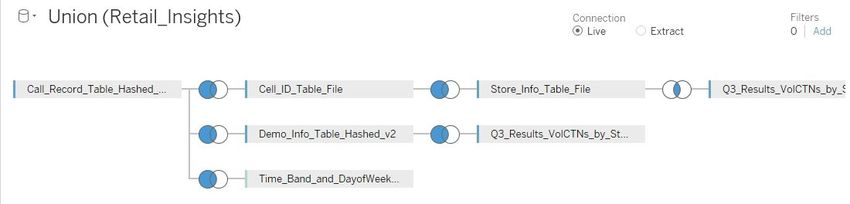
security with fewer steps than SHA 1, with SHA 256 performing faster and yielding smal-
ler code on a 32 bit platform than SHA 1 [18]. They describe message digest and secure
hash as standard algorithms that provide data security for multimedia authentication.
    [6] outline the implementation of SHA 256 architecture transformation as the hash
function receiving an input of 32 bit words. The value W and the constant value KT-1
performs the computations shown and produces the value after 64 iterations. Sarkar et al
[20] studies show restriction in the flow of sensitive information by anonyimising identity
information through hash functions. They used the HMAC-SHA256 algorithm which
is a widely implemented function from the networking field that combines the hashing
algorithm with key information [20] .

3     Methodology
3.1    Design Process
The data mining methodology used was the Cross Industry Standard Process for Data
Mining (CRISP-DM). Other methodologies such as SEMMA focus on the model develop-
ment aspects of data mining, whereas CRISP-DM has a business understanding element.
As the objective of this research was to identify a commercially viable product based on
the analysis, CRISP-DM was deemed the most suitable methodology to use.

                   Figure 1: CRISP-DM Model (Palacios et al 2017).

    The data used was extracted from three specific datasets from the Telecoms Operator
which contained cell tower information, call record information and a subset of demo-
graphic information. Specific caveats for this study were in place due to the business
environment of telecommunications. The first caveat was in relation to the specificity of
the customer location due to the geofence of a cell tower base station being defined at
400m in urban areas. The second caveat related to the data capture process involved in
telecoms, which resulted in a high volume of nulls in age band. The third caveat is that
Average Spend relates to the monthly mobile spend of the user and not spend in store.
    The latitude and longitude coordinates in the cell tower dataset were mapped via
Google Maps to identify the towers closest to the sixteen stores to identify which Cell
ID to use (see Fig.2). The relevant Cell ID information was output into a csv file, which
also included the Store ID and Store Name which it related to. GDPR and e-Privacy
Regulation compliance was a high level priority and was the reason for anonyimising the
Customer Telephone Numbers (CTNs) using SHA 256 hash function and for aggregating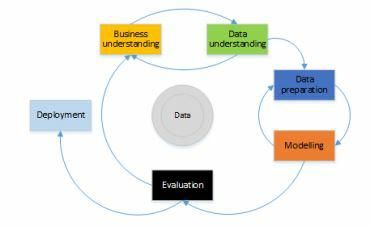
the age and average spends into bands of age and spend. The CTNs contained in the
call record and demographic raw datasets were anonymised using the Digest Package
in R Studio and outputted into a csv file. There were now three csv files containing
cell tower information, anonymised call record information and anonymised demographic
information.

                     Figure 2: Cell Tower Mapping via Google Maps

     The csv files were saved as excel files, and an aggregation formula was applied to trans-
form the age and average spend data to Age Band and Average Spend Band. The excel
files were then re-saved as csv files and loaded using the SQL Import and Export Wizard
into SQL Server Management Studio (SSMS). A Retail Insights warehouse, which fol-
lowed the snowflake normalised schema, was created within SSMS. SQL language within
SSMS was used to analyse the data so that the relevant demographic information was
joined with the call record information and store information.

                  Figure 3: Overview of Retail Insights data warehouse

   Analysis was carried out using SPSS for statistical analysis, R for Machine Learning
and Tableau for data mining. All three tools used the outputs from SSMS. For SPSS,
one file with store and demographic information was used and was pre-processed so
that all columns were transformed to ordinal nominal values. R used a csv file which
had 4 variables (Store ID, Age Band, Gender and Average Spend) with approx. 28,000
observations to create a decision tree using the partykit library in th rpart package.
Tableau was connected to the Retail Insights database which was used to mine the dataset
and visually depict the insights in dashboard format.

3.2    Software Used
A number of software tools were used to analyse the datasets to identify key retail insights
and they are listed as follows:
  1. Google Maps Mapping of all cell towers and stores to identify correct cell tower
2. Microsoft Excel Data manipulation of original datasets, used during the ETL
process
3. R Studio Anonymisation of all personally identifiable CTN records and identifica-
tion of correlation via the decision tree model
4. SQL Server Management Studio Initial data analysis used to join datasets which
are used for further analysis
5. SPSS High level statistical analysis review of dataset
6. Tableau Deep mining of data to identify further insights
4 Implementation
This study used a non-centralised architecture to implement the analysis on the dataset
whereby it employed cryptographic based methods to align with GDPR compliance and
did not use a third party source via the telecoms operator.
4.1 Statistical Analysis
Using SPSS, a number of techniques within the software were used to identify some high
level insights. Descriptive statistics, case processing summaries, parameter estimates and
partial correlation analysis were used to identify specific demographic traits for each of
the four types of retail stores. As previously mentioned, SPSS used the csv file which
had transformed the raw data into ordinal nominal values to carry out the analysis. The
breakdown of when each of the values mean is documented in the Configuration Manual
in Section 1.3.
For descriptive statistics, skew and kurtosis were identifiers used for the distribution
of the demographic data. Age Band and Gender were negatively skewed with platykurtic
kurtosis i.e. a flat and wide distribution of data, identifying a good varied distribution
of ages and gender in our dataset. Average Spend Band was positively skewed with
leptokurtic kurtosis i.e. a tall and thin distribution indicated that a high volume of
customers were within one or two specific average spend bands.
Case Processing Summary showed a high level distribution of customers between Store
ID and Age Band. Dunnes had the highest volume of traffic at 35% of the customers
being located there Lidl produced the lowest volume at 11%. The quality of data from
the telecoms operator was highlighted when the percentage of ’Unknown’ ages was 49%.
However, it was still identified that, 35 to 54 year olds accounted for 27% of the customer
base in the Dublin postcodes where the analysis was carried out.
Parameter Estimates relied on the p-value level to identify insights. Based on a
significance level of 0.05, it was revealed that customers who are 66+ tend to shop in
Dunnes Stores, Tesco was more popular with 45+ year olds and Lidl was age band
agnostic. Partial correlation analysis was used to identify if there was a positive or
negative correlation between Age Band, Gender and Average Spend Band to a specific
retail brand, dependent on how close to +1 or -1 the analysis results were. When there
was no control variable, there was no correlation between Store ID and Age Band and a
very slight positive correlation between Store ID and Gender with a correlation of 0.06.
Whilst there was a negative correlation between Store ID and Average Spend Band, thiswas also very small with a correlation of -0.015. Using Store ID as the control variable,
there was a positive correlation between Age Band & Gender and Average Spend Band &
Gender with the correlation being 0.360 and 0.157 respectively. Based on the categorical
nominal values of each category, the reader identified that there was a higher volume
of females in the older age bands than the volume of males in the same age bands. In
regards to Average Spend and Gender, the analysis revealed that Females spend more
than Males.Age Band and Average Spend Band had a negative correlation at -.204, which
identifies that the older the customer is, the lower average spend they will have.
In the correlation analysis, when there is no control variable, Store ID and Average
Spend Band were the only variables which were statistically significant with a p-value
of 0.14, using a significance level of 0.05. When Store ID is the control variable, all
correlations previously mentioned are statistically significant with a p-value of 0.000.
Figure 4: Output of Statistical Review
4.2 Machine Learning via the Decision Tree Model
This study created a classification decision tree which is a supervised machine learning
model using R software. A csv file that contained the four key variables (Store ID,
Age Band, Gender and Average Spend) and 28,000 observations was used. The partykit
library within the rpart package was used to create the decision tree to identify the
store that the customer would choose based on their gender and average spends. In this
model, the type of store, agnostic to location is termed the class, with the features i.e.
the independent variables being gender and average spend.
The reason age band was not used in the model as a feature was due to the low
data quality identified during the high level statistical analysis. The main package used,
as mentioned previously, was the rpart package which enables recursive partitioning for
classification, regression and survival trees. The partykit library was used to plot the
classification tree using rpart as the source. As the partykit library was dependent on the
libcoin and mvtnorm packages, these packages were also installed. The mvtnorm package
computes multivariate normal distributions and the libcoin package enables a framework
for permutations tests i.e. identifying the several possible ways the decision tree can
be created. The decision tree model produced the same result as the SPSS analysis in
regards to identifying that Females had a higher spend pattern than Males. The decision
tree enabled pattern recognition at a low granularity level.4.3 Data Mining
Following the outputs of the SQL queries within SSMS, Tableau connected to the Retail
Insights database where a number of joins were created to enable a user friendly approach
to visualise the outputs of the analysis (See Fig. 5 for Tableau Data Source). Individual
graphs and tables were created by defining the measures and dimensions required to pro-
duce key insights that would be beneficial to Third Parties. From reviewing commercial
products in the UK which offer a similar retail insights service, there were key insights
which were used to benchmark the outputs to ensure a commercially viable, regulatory
approved service which Third Parties would be interested in. Therefore, the high level
insights the study produced related to:
• Volume of customers per store overlaid with demographic information
• Most popular times and days per store
Figure 5: Output of Statistical Review5 Evaluation
Key insights were produced at different levels which can be used as either an internal
review of one brand of store in each location or as a competitor analysis to review how
the customer marketplace is divided. The following section will identify the key outputs
from the three analytical tools and discuss the results.
5.1 Statistical Analysis
Figure 6: Statistical Analysis Insights
The results SPSS produced were high level and identified initial levels of data quality and
data distribution along with correlation between independent and dependent variables.
As seen in Fig. 4, Average Spend Band & Gender, along with Age Band & Gender had
a positive correlation with the store. Also as Average Spend Band was positively skewed
and had a leptokurtic kurtosis, the Third Party may want to add more data to this
variable to ensure a more normal distribution, similar to the age and gender variables.
The age band variable had a low level of data quality which was identified in the Case
Processing Summary, which may also lead to the client requesting for this age band to
be removed. However by doing so, the Third Party may be leaving themselves open to
errors in the analysis. As the data is from a telecoms operator, a high volume of prepay
customers are not required by law to provide a date of birth, which would naturally lead
to a high volume of null values in the dataset. From a Regulatory point of view, if the
dataset was below a minimum k-value, the customer would be more likely to be identified.5.2 Machine Learning using the Decision Tree Model
Figure 7: Output of Machine Learning Model
The Decision Tree was used as a supervised machine learning technique to classify two
features; Gender and Average Spend Band into 4 classes, which were each of the store
brands.
This provided a deeper understanding of the correlation between Gender, Average
Spend Band and Store Brand which was identified via the Statistical Analysis. This
identified the features which contributed to a customer going to store i.e. recognising a
pattern based on particular demographic traits. This pattern based predictions is similar
to one of the mobile behaviour predictions which Lu et al (2012) referenced in the Related
Works section. The key insights from the above were:
• Dunnes Stores is popular with Females with a low spend average spend
• Lidl is most popular with customers who have a high average spend regardless of
gender
• Supervalu is popular with Females with a high average spend
• Tesco is most popular with Males regardless of spend.
The above is agnostic to location, which generalised each store brand regardless if they
were located in Dublin 11, Dublin 15 and Dublin 5. This type of analysis would work for
Third Parties who would like a high level competitor analysis and enable identification of
key features which impact choice in brand. This could also be used for internal analysis,
by changing the class to specific locations for one store brand, therefore having Dublin
15, Dublin 11 and Dublin 5 as the classes and keeping the features as is, if so desired.
5.3 Data Mining
Government agencies, transport authorities and digital marketing agencies are some ex-
amples with an interest in the deep mining of location data which telecoms operators can
provide. The in-depth analysis was completed using a mixture of SSMS and Tableau,
which enabled both a competitor retail analysis and provided insights across each store
brand in each location. This technique mined the data to the lowest level of granularity
compared to the above two techniques i.e. Statistical Analysis and Machine Learning.
Fig.8 ad Fig.9 are screenshots of the Tableau dashboards created with the evaluation of
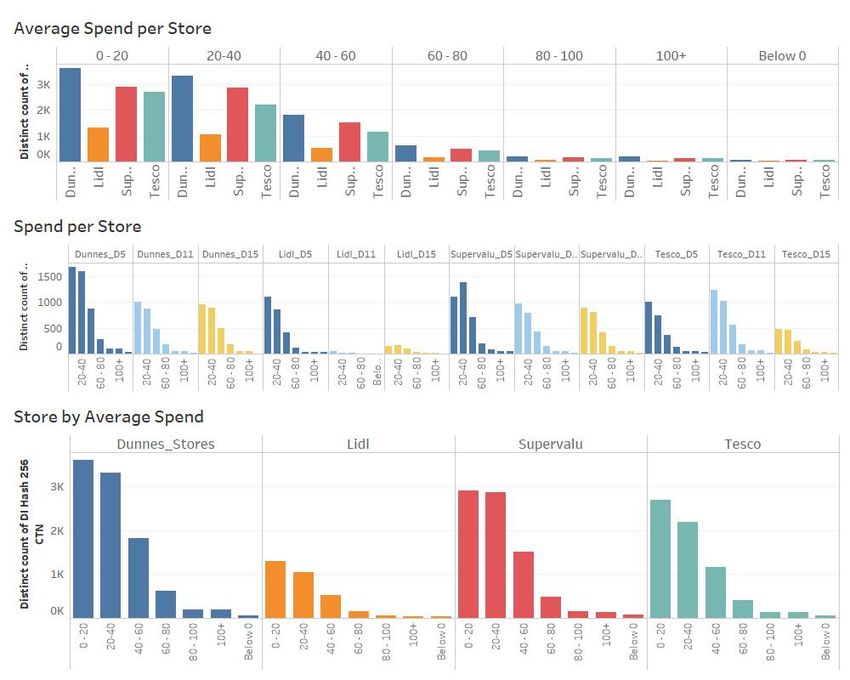
each dashboard explained under the figures.Figure 8: Overview of volume of customers and their spend per store
The analysis shown in Fig. 8 provided the below insights:
• Dunnes Stores had the highest volume of customers in Dublin 5 and Dublin 15,
however Tesco had the highest volume in Dublin 11.
– Whilst the statistical review highlighted that Dunnes had the highest footfall at
35%, this output identifies that this was only in two locations. This highlighted
that perhaps focused marketing efforts should be considered in Dublin 11 to
drive footfall levels in line with the two other locations.
• Dunnes Stores and Supervalu customers had a high average spend (based on their
monthly mobile spend)
– The decision tree model also identified Lidl as having a high spend customer
whereas this model did not.
The following dasboards (as shown in Fig.9) will provide an overview of the age of
customers and also identify the most popular times and days based on footfall.Figure 9: Overview of age band of customers and most popular times and days
The analysis shown in Fig. 9 provided the below insights:
• Customers between 35 and 54 years old appeared in every store more than other
age groups
– Null values were removed for this insight to enable a clear identification of age
group
• Mondays and Fridays were the most popular days for shopping in all four store
brands with 31% of customers having shopped in the afternoon i.e. 12pm to 4pm.
– This insight could assist the store brands in allocation of staff per day and
time period. This can also help with stock balance, identifying when stock
turnover is required.
– Morning (8am to 12pm) contributed to 23% of footfall
– Evening (4pm to 8pm) contributed to 26% of footfall5.4 Discussion
The research topic ”A data mining approach on anonymised mobile location data to
provide customer insights in key retail stores” was researched by reviewing and imple-
menting a three step approach to analysing a telecoms operators data overlaid with
anonymised network location. The process covered extraction, pre-processing, building
three models of analysis, validation and output of results. Whilst the analysis provided
an insight which can be used as a commercially viable product for Third Parties, it is im-
portant to note that the data protection element of this analysis, via the anonymisation
process, was vital before this project could go live.
The General Data Protection Regulation, along with the e-Privacy Regulation, im-
poses strict disciplines on network operators, requiring that all processes protect the per-
sonal identity of their customers. Whilst pseudonymisation was an option, as reviewed
in this project, anonymisation using a cryptographic hash function (SHA 256) was used
to ensure that regulation was upheld before any analysis was carried out.
Upon initial statistical analysis, some anomolies which were identified was the data
distribution of average spends and data quality of age band was highlighted. One hypo-
thesis for these anomalies is that the operators base may have had a high level of prepay
customers who are not required to spend a fixed amount per month and also not required
to provide personal details. This would be stated as a caveat to the Third Party client.
Another caveat to highlight is the distribution of available network in the proximity
of each store. As mentioned before, there was an approx. 400m geofence around each
site within urban cities. This was a limitation on the accuracy of the analysis as it is not
as precise as GPS.
There were a number of benefits and limitation in each of the models used in this
project which are summarised as follows:
Approach Benefit Limitation
Statistical Analysis Identified the distribution Too generalised and high
and quality of dataset vari- level
ables
Machine Learning Provided pattern recogni- Did not identify the pattern
tion per store brand per store per location
Data Mining Provided granular insights Very slow to compute in
for customers per store Tableau edits to be made for
long term solution.
The limitations highlighted in the above are specific to this project and can all be
modified in future research.6 Conclusion and Future Work
The research topic enabled a wide variety of analysis to be carried out with the view
of identifying key insights which may be commercially beneficial to a Third Party. The
main high level insights revealed profiling of footfall patterns,demographic attributes
of customers and pattern recognition across all stores. Within the statistical analysis
and machine learning approaches, more variables can be added to improve granularity
of analysis and the classes can be changed in the machine learning model to alter the
recognition of different patterns. In regards to the data mining model, SSMS could
change the warehouse snowflake schema to star schema which would denormalise the data
and reduce the query time. The design within Tableau could be improved to decrease
computing time.
These insights could be offered to Third Parties at an agreed pricing structure de-
pendent on the level of analysis. The three types of analysis which could be commercially
viable are:
• Review of Third Party base: If the Third Party client had access to their
customers mobile number, a file transfer could be set up from the Third Party
to the telecoms operator. This would enable pattern recognition of their current
customer base i.e. if a large volume of their customers are located around a specific
area where they do not have a store or customer touch point. This could enable
the client to review an opportunity to locate there. It is important to note, that
should this analysis be carried out, both the Third Party and the telecoms operator
would be required to follow the same hashing function process and review with their
Regulatory teams to ensure the data processing adheres to current legislation.
• Internal analysis: The Third Party client can provide a list of locations where
they would like the analysis to be carried out, for example: a list of transport areas
such as bus or train stations or a list of their store locations to identify the customer
demographic of each area along with volumes of traffic. This could also be used
for marketing purposes; in revealing locations of high footfal, associated marketing
campaigns should yield more value.
• Competitor analysis: This offering could be configured in line with the approach
adapted by this project i.e. reviewing a number of competitors within specific
locations to identify the similarities and differences in customers along with other
key insights such as footfall data.
The above analysis could be used as a commercial product to drive revenue for the
operator. Dependent on the type of analysis, the below is an overview of a pricing
structure that may be implemented:
• Bronze Level Analysis: The statistical analysis model could be used to provide
an initial review of the clients data. This model would identify the data quality
i.e. skews or kurtosis and highlight any correlations between the independent and
dependent variable.. The client could request this on a monthly basis to identify a
trend analysis.
• Silver Level Analysis: The machine learning approach using the decision tree
model would enable 3rd parties to recognise patterns of a specific customer basewhich they are interested in. They could provide the features and classes that they would like to investigate or using the output from the bronze level analysis, could investigate further the features which correlated with a statistical significance with each other or with a specific class. Following the initial output of this analysis, the client may want to modify a specific feature and request the analysis again to identify any change in pattern. Based on this project, an example of modification following the initial output would be to run a TV or outdoor campaign targeting a specific gender and then requesting another analysis to see if this feature changed pattern. • Gold Level Analysis: The data mining approach would be used as this requires a more in-depth build using two different softwares and techniques. The telecoms operator would identify whether the client would like an analysis of their own base, an internal analysis or competitor analysis (as discussed above) which would en- able the telecoms operator to confirm what type of insights the client would like produced. Once this is confirmed, a dashboard would be connected via a real-time update to the pre-defined server. The dashboard would have all insights required by the client which they could access via a log in. The dashboard could be updated on a weekly or daily basis, dependent on the update frequency of the server which could be agreed between the client and the telecoms operator.
References
 [1] Sleem Alaaeldin and Kumar Anup. Handoff management in wireless data
     networks using topography-aware mobility prediction. Journal of Parallel and
     Distributed Computing, 65:963–982, 2005.

 [2] Keerie Catriona, Tuck Christopher, Milne Garry, Eldridge Sandra, Wright Neil,
     and Lewis Steff C. Data sharing in clinical trials practical guidance on an-
     onymising trial datasets. Trials, pages 1–9, 2018.

 [3] Tsai Chieh-yuan, Li Ming-hong, and Kuo R J. Computers & Industrial Engin-
     eering A shopping behavior prediction system : Considering moving patterns
     and product characteristics. Computers & Industrial Engineering, 106:192–204,
     2017.

 [4] Tsai Chieh-yuan and Huang Sheng-hsiang. A data mining approach to optimise
     shelf space allocation in consideration of customer purchase and moving beha-
     viours. International Journal of Production Research, 53(3):850–866, 2015.

 [5] Data Protection Commission.           Guidance note for data control-
     lers on location data.            https://www.dataprotection.ie/docs/
     Guidance-Note-for-Data-Controllerson-Location-Data/1587.htm,
     2017. [Online; accessed 29-March-2018].

 [6] Michail Harris E, Athanasiou George S, Theodoridis George, Gregoriades An-
     dreas, and Goutis Costas E. Microprocessors and Microsystems Design and
     implementation of totally-self checking SHA-1 and SHA-256 hash functions ’
     architectures. Microprocessors and Microsystems, 45:227–240, 2016.

 [7] Suel Esra and Polak John W. Development of joint models for channel store
     and travel mode choice : Grocery shopping in London. Transportation Research
     Part A, 99:147–162, 2017.

 [8] Lu Eric Hsueh-chan, Lee Wang-chien, and Tseng Vincent S. A Framework for
     Personal Mobile Commerce Pattern Mining and Prediction. IEEE Transactions
     on Knowledge and Data Engineering, 24(5):769–782, 2012.

 [9] Jo Hyo Jin, Paik Jung Ha, and Lee Dong Hoon. Efficient Privacy-Preserving
     Authentication in Wireless Mobile Networks. IEEE Transactions on Mobile
     Computing, 13(7):1469–1481, 2014.

[10] Wang-Chien Lee Josh Jia-Ching Ying and Tseng Vincent. Mining geographic-
     temporal-semantic patterns in trajectories for location prediction. ACM Trans-
     actions on Intelligent Systems and Technology, 5:1–33, 2014.

[11] Hui S A M K, Bradlow Eric T, and Fader Peter S. Testing behavioral hypo-
     theses using an integrated model of grocery store shopping path and purchase
     behavior. Journal of Consumer Research, 36, 2009.

[12] Vu Khuong and Zheng Rong. Efficient Algorithms for K-Anonymous Location
     Privacy in Participatory Sensing. 2012 Proceedings IEEE INFOCOM, pages
     2399–2407, 2012.
[13] Colonna Massimo Mamei Marco and Galassi Marco. Automatic identification
of relevant places from cellular network data. Pervasive and Mobile Computing,
31:147–158, 2016.
[14] Trestian R Shah P Nguyen H Vien Q Gemikonakli O and Barn B. Towards con-
necting people, locations and real-world events in a cellular network. Telematics
and Informatics, 34:244–271, 2017.
[15] Stevens Forrest R, Gaughan Andrea E, Linard Catherine, and Tatem Andrew
J. Disaggregating Census Data for Population Mapping Using Random Forests
with Remotely-Sensed and Ancillary Data. PLOS ONE, 19:1–22, 2015.
[16] European Communities Regulations. European communities (electronic
communications networks and services) (privacy and electronic communic-
ations) regulations 2011. https://www.dataprotection.ie/documents/
legal/SI336of2011.pdf, 2011. [Online; accessed 24-May-2018].
[17] Schlegel Roman and Chow Chi-yin. User-Defined Privacy Grid System for
Continuous Location-Based Services. IEEE Transactions on Mobile Comput-
ing, 14(10):2158–2172, 2015.
[18] Nivetha S, Elizabeth N Edna, Padmasha T Prasanya, and Gohulalakshmi I.
Secure Authentication Process In Smart Cards. 2016 10th International Con-
ference on Intelligent Systems and Control, 2016.
[19] Zhang Shaobo, Choo Kim kwang Raymond, Liu Qin, and Wang Guojun. En-
hancing privacy through uniform grid and caching in location-based services.
Future Generation Computer Systems, 2017.
[20] Sarkar Soumabha, Carpenter Bryan, Bader el-den Mohamed, and Knight Ar-
ron. Mining temporal mobile sequential patterns in location-based service
environments. In Mining temporal mobile sequential patterns in location-based
service environments, volume 9, pages 45–51, 2016.
[21] Peng Tao, Liu Qin, Meng Dacheng, and Wang Guojun. Collaborative traject-
ory privacy preserving scheme in location-based services. Information Sciences,
387:165–179, 2017.
[22] Eric Hsueh-Chan Lu Vincent S. Tseng and null Cheng-Hsien Huang. Mining
temporal mobile sequential patterns in location-based service environments. In
Mining temporal mobile sequential patterns in location-based service environ-
ments, volume 1, pages 1–8, 2007.
[23] Papers W. Cisco visual networking index: Forecast and methodology. https:
//www.cisco.com/c/en/us/solutions/collateral/service-provider/
visualnetworking-index-vni/complete-white-paper-c11-481360.html,
2016. [Online; accessed 06-Decemeber-2017].
[24] Chen Xihui and Pang Jun. Protecting query privacy in location-based services.
GeoInformatica,, 18(1):95–133, 2014.
[25] Song Z and Kusiak A. Optimising product configurations with a data-mining
approach. IJGUC, 47(7):1733–1751, 2009.[26] Sanaa Taha Zaher Jabr Haddad and Imane Aly Saroit. Anonymous authentic-
ation and location privacy preserving schemes for LTE-A networks. Egyptian
Informatics Journal, 18(3):193–203, 2017.
[27] Fan Zide, Pei Tao, Ma Ting, Du Yunyan, Song Ci, Liu Zhang, and Zhou
Chenghu. Computers Environment and Urban Systems Estimation of urban
crowd fl ux based on mobile phone location data : A case study of Beijing
China. Computers Environment and Urban Systems, 69(January):114–123,
2018.You can also read


