Greenhouse Gas Emissions
from Biodiesel Production
in Indonesia Based on
Life Cycle Analysis
←
→
Page content transcription
If your browser does not render page correctly, please read the page content below
Greenhouse Gas Emissions from Biodiesel Production in Indonesia Based on Life Cycle Analysis
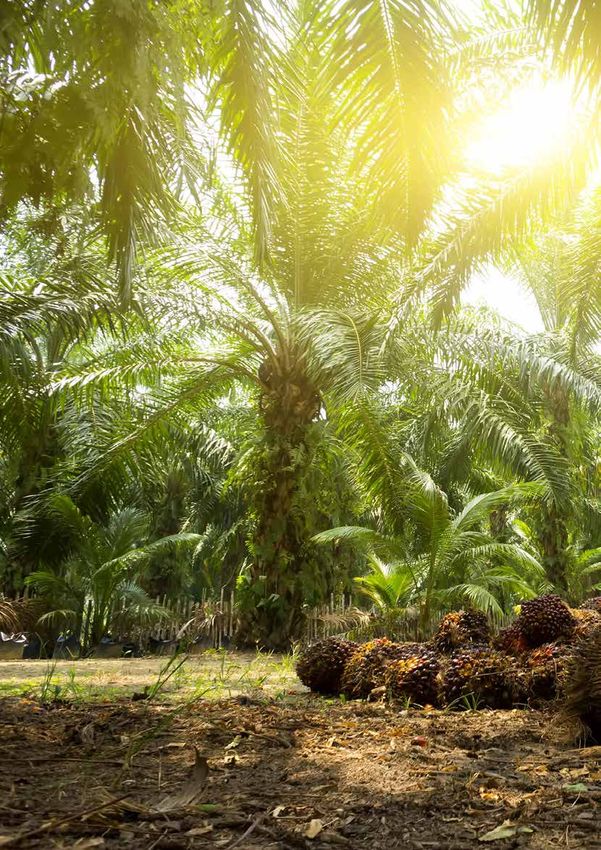
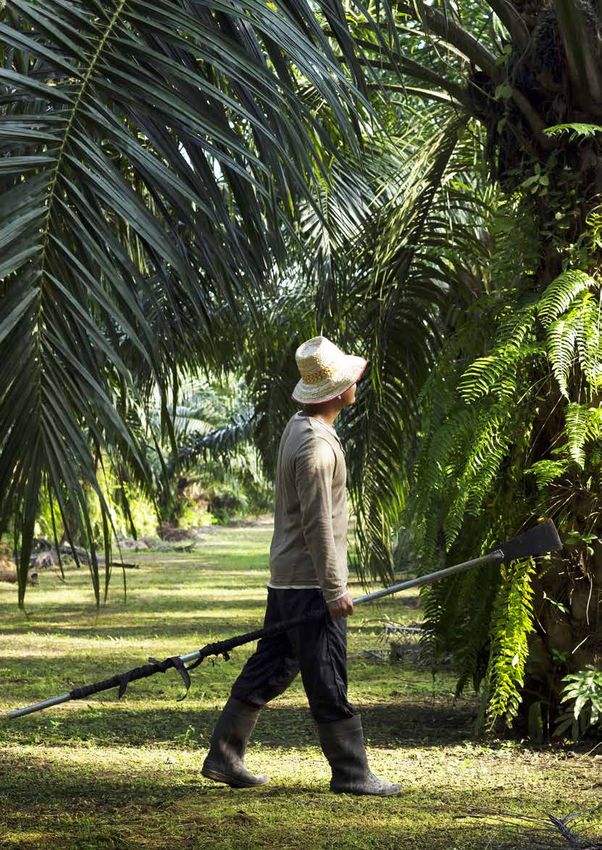
Copyright © 2019 Traction Energy Asia

All rights reserved. This report or any portion thereof may not be reproduced or used
in any manner whatsoever without the express written permission of the publisher
except for the use of brief quotations.

Traction Energy Asia
Plaza Marein Lt.23,
Jl. Jend. Sudirman Kav 76-78,
Kuningan, Kecamatam Setiabudi,
Jakarta, 12910, INDONESIA

https://www.tractionenergy.asia
email: info@tractionenergy.asia

Cover Photo:
Transporting Oil Palm Fruit Bunches in Riau © Kemal Jufri/Greenpeace
Greenhouse Gas Emissions
from Biodiesel Production
  in Indonesia Based on
    Life Cycle Analysis
ii |

Acknowledgements

The authors would like to extend their appreciation
and gratitude to the following people who have
contributed to the writing and finalization of this
research:

Bapak Rida Mulyana from the Ministry of Energy
and Mineral Resources (ESDM); Bapak Wendy
Aritenang from the Ministry of Transportation;
Bapak Rudy Gobel from the Oil Palm Plantation
Fund Management Agency (BPDPKS); Bapak
Paulus Tjakrawan from the Association of
Indonesian Biofuel Producers (APROBI); Ibu
Foo Siew Theng from Wilmar Group; Bapak
Agus Purnomo and Bapak Rifki Tantowi Noor
from Golden Agri Resources; Bapak Bandung
Sahari and Bapak Yudha Asmara from PT Astra
Agro Lestari Tbk; Bapak Hariyadi Santoso from
Sinarmas Agri; Bapak Mansuetus Alsy Hanu
and Bapak Ibrahim Gulaknar from the Oil Palm
Farmers Union (SPKS); Bapak Bungaran Saragih;
Bapak Giogio Budi Indarto; Ibu Rebekka Angelyn;
Bapak Lucky Lontoh; Bapak Yuyun Indradi and
Nabiha Zain Muhamad for editing the report.

The authors would also like to thank all other
parties who have provided valuable support for
this study.
Greenhouse Gas Emissions from Biodiesel Production in Indonesia Based on Life Cycle Analysis   | iii

Table of Contents
List of Abbreviations.......................................................................................................................iv

Executive Summary.........................................................................................................................vi

Introduction......................................................................................................................................1

Methodology....................................................................................................................................5

Findings and Discussion..................................................................................................................11

Conclusions and Recommendations.............................................................................................45

References........................................................................................................................................48

Endnotes...........................................................................................................................................52
iv |

List of Abbreviations

AFOLU    Agriculture, Forestry and Other Land Use
APROBI   Asosiasi Produsen Biodiesel Indonesia (Indonesian Association of Biodiesel Producers)
BOE      Barrel of Oil Equivalent
CO2eq.   Carbon Dioxide Equivalent
CPO      Crude Palm Oil
EU       European Union
FAO      Food and Agriculture Organization
FFB      Fresh Fruit Bunches
GAP      Good Agriculture Practice
GJ       Giga Joule
GHG      Greenhouse Gases
GRK      Gas Rumah Kaca
Ha       Hectares
ILUC     Indirect Land Use Change
IPCC     Intergovernmental Panel on Climate Change
ISCC     International Standard for Carbon Certification
ISPO     Indonesia Sustainable Palm OIl (Standard)
Kg       Kilogram
Kl       Kiloliter
LCA      Life Cycle Analysis
LUC      Land Use Change
LUCF     Land Use Change and Forestry
MC       Methane Capture
MJ       Megajoule
MPOB     Malaysia Palm Oil Board
MT       Million Tons
MTOE     Millions Ton of Oil Equivalent
MWe      Megawatt Electricity
MWh      Megawatt Hour
N2O      Nitrogen Dioxide
OER      Oil Extraction Rate
PBB      Perserikatan Bangsa Bangsa (United Nations)
PFAD     Palm Fatty Acid Distillate
PKS      Pabrik Kelapa Sawit )Palm oil mill)
PLN      Perusahaan Listrik Negara (PT. PLN Persero) - state-owned electricity company
POME     Palm Oil Mill Effluent
PSO      Public Service Obligation
RBD      Refined Bleached and Deodorized
RED      Renewable Energy Directive
RSPO     Roundtable on Sustainable Palm Oil
RPO      Refined Palm Oil
SPKS     Serikat Farmer Kelapa Sawit (Association of Palm Oil Smallholder Farmers)
SPBU     Gas/Petrol Station
TBS      Tandan Buah Segar (Fresh Fruit Bunches)
TPH      Tons Per Hour
Greenhouse Gas Emissions from Biodiesel Production in Indonesia Based on Life Cycle Analysis   |v

© Tenvongten
vi |

Greenhouse Gas Emissions of Biodiesel from CPO

Good governance is an absolute prerequisite in order for biodiesel utilization
from CPO to achieve targets for energy conservation and greenhouse gas
emissions reduction, in accordance with the mitigation strategy of the
Government of Indonesia
~ Traction Energy Asia

Executive Summary
Key findings/Highlights

•      Indonesia has set a target for its renewable energy mix of 23% - 92.2 MTOE (Million Tonnes of
       Oil Equivalent) by 2030. One quarter of Indonesia’s renewable energy target is planned to come
       from biofuel.
•      It is estimated that 33.5% of Indonesia’s oil palm is cultivated on previously forested land,
       including peat forests, with 26.3% from scrubland including peat scrubland, and 34.1% is from
       agroforestry. The oil palm plantation and palm oil sectors account for approximately 15% of
       total national emissions, with the majority resulting from peat oxidation within plantations, land
       clearing, and palm oil mill effluent (POME).
•      This report aims to provide an analysis of GHG emissions of biodiesel production from palm oil
       in Indonesia, using a Life Cycle Analysis (LCA) to analyze GHG emissions across the entirety of a
       product’s supply chain, all the way to its consumer use (cradle to grave). This analysis delineates
       the limits of emissions calculations, from the plantation to the blending of B20, from a scenario
       analysis to the utilization stage.
•      GHG emissions from plantations are still the largest contributor to emissions from biodiesel in
       Indonesia, accounting for over 80% of GHG emissions across the biodiesel supply chain.
•      The differentiating factor for total GHG emissions produced through land use change (LUC) lies in
       the type of land, namely mineral or peat. Biodiesel from palm oil, the production of which entails
       land use change from peat, will produce a spike in GHG emissions of up to 6.08 kg CO2eq/L B20
       for West Kalimantan, and 7.09 kg CO2eq/L B20 for Riau.
•      In Riau and West Kalimantan there is a significant difference between GHG emissions produced
       through LUC for land that was previously grassland, and land that was previously forest. There
       is a possibility that LUC on mineral and peat lands will cause emissions from the production of
       B20 to be significantly higher than diesel fuel emissions.
•      The use of methane capture in palm oil mills can halve emissions from the milling stage of
       production.
•      Transportation (delivery of fresh fruit bunches (FFB)) is the largest source of emissions for palm
       oil smallholder farmers. Fuel use for palm oil smallhoder farmers’ transportation can contribute
       up to 39% of emissions in West Kalimantan and 49% in Riau.
•      Productivity of palm oil smallholder farmers is lower than plantation companies.
Greenhouse Gas Emissions from Biodiesel Production in Indonesia Based on Life Cycle Analysis   | vii

The Government of Indonesia has committed to reduce the nation’s GHG emissions by 29% by
2030 through mitigation in the energy sector as well as other sectors. The main mitigation strategy
in the energy sector is the development of renewable energy, including biodiesel production from
crude palm oil (CPO). In order to fulfill the target for the energy mix in 2025, biodiesel production
is targeted to increase from 6.01 million kiloliters in 2018 to 13.8 million kiloliters in 2025. Biodiesel
can support efforts to achieve national energy security and reduce national GHG emissions. On the
other hand, biodiesel production is inseparable from the energy and land use sectors. Biodiesel
production can have environmental impacts, and can actually increase GHG emissions related to
deforestation and land use change from peatlands to oil palm plantations.

Using Life Cycle Analysis (LCA) methodology, this report analyzes the GHG emissions of biodiesel
from CPO. LCA was selected in order to analyze GHG emissions as a result of biodiesel production
from CPO in Indonesia, with research limitations delineated to the plantation, refinery, and B20
blending station production stages. A scenario analysis up to the consumption stage was conducted
in order to observe biodiesel GHG emissions across the entirety of the supply chain. Sampling data
for the research was obtained through respondents in the corporate sector, as well as from palm oil
smallholder farmers. Data for palm oil smallholder farmers’ production was obtained through field
surveys in the provinces of Riau and West Kalimantan. A review of previous biodiesel LCA studies
was also conducted as a reference for the research.

Based on this research, in the absence of LUC, a LCA of B20 biodiesel production from palm oil
companies and palm oil smallholder farmers produces a result of 2.67-3.03 kgCO2eq per liter of B20.
These GHG emissions are lower compared to diesel emissions of 3.14 kgCO2eq/L. Based on the LCA,
GHG emissions from B20 can be between 3-14% lower than conventional diesel. With B20 biodiesel
production targeted at 13.8 million kiloliters in 2025, the change in the usage of diesel fuel to biodiesel
from CPO is projected to reduce GHG emissions by up to 9.27 million tCO2eq in 2025, or more than
90% of the target for emissions reduction through fuel switching. In order to support the achievement
of targets for national GHG emissions reduction, mitigation needs to be conducted through good
governance and the establishment of upper limits for GHG emissions from biodiesel production.
viii |
Greenhouse Gas Emissions from Biodiesel Production in Indonesia Based on Life Cycle Analysis   |1

1. INTRODUCTION

                                                                               © Nelzajamal
2|
As a non-Annex I member of the United Nations Convention on Climate Change1, Indonesia is
committed to reduce greenhouse gas (GHG) emissions by 29% by 2030.2 Mitigation in the land
use and energy sectors are projected to contribute a large portion of Indonesia’s GHG emissions
reduction effort.3 As a result of Indonesia’s GDP and population growth, energy demand is projected
to increase to more than 4,500 million Barrel Oil Equivalent (BOE).4 Indonesia’s National Energy
Policy5 targets the renewable energy mix at 23% or equivalent to 92.2 MTOE (Million Tonnes of OIl
Equivalent) in 2030. A quarter of the portion of renewable energy, or 23 MTOE, is projected to come
from biofuel (Misna, 2018).
Table 1. Indonesia’s Biofuel Target (in MTOE) (Kusdiana, 2014)
Fuel 2015 2016 2017 2018 2019 2020 2025 2050
Biofuel 6 7 7 8 8 9 19 63
In order to achieve these emission reduction targets, the Government of Indonesia has issued a
number of policies and regulations.6 A target for biodiesel blending for various sectors has also
been established, with a progressive target of up to 30% for all sectors in 2020. Indonesia’s biodiesel
production increased from 3.42 million kiloliters in 2017 to 6.01 million kiloliters in 2018 (Misna,
2018). Production is expected to increase fourfold by 2025 to 13.8 million kiloliters in order to fulfill
the targeted portion of biofuel within the national energy mix.
Biofuel refers to fuel produced from a vegetable feedstock. Common forms of biofuel include
biodiesel and bioethanol. Currently, biofuel production in Indonesia is still dominated by biodiesel
from Crude Palm Oil (CPO), which is categorized as a first generation biodiesel.7 Current national
biodiesel production capacity is around 12 million kiloliters per year, from the islands of Sumatra,
Java, Kalimantan, and Sulawesi. The development of biodiesel from CPO can support Indonesia’s
efforts to realize national energy security, reduce the consumption and import of fossil fuels, create
added value from the downstream palm oil industry, and contribute to reducing GHG emissions
in the energy sector. However, without improvements to forest governance and sustainable
production, biodiesel from palm oil can result in adverse environmental effects. For example, land
use change on land that has been newly converted to oil palm plantations, especially on peatland,
will drive GHG emissions as well as environmental degradation as a result of LUCF (land use change
and forestry). In addition, deforestation can drive the extinction of forest-based biodiversity as well
as disrupting the ecosystems. Indonesia’s production of biodiesel from palm oil is crucial because
of its potential impacts on the country’s two biggest sources of GHG emissions in Indonesia, namely
LUCF and energy.
The European Union has recently adopted a policy to regulate GHG emissions from biofuel, including
biodiesel. From 2021–2023, GHG emissions from biofuel must be 50% lower than emissions from
fossil fuels (European Union, 2018). This policy was implemented by the European Union to ensure
that biofuel production and usage produces lower GHG emissions than fossil fuels. The Government
of Indonesia has not yet issued regulations on sustainable and low-carbon biodiesel production. In
order to prevent GHG emissions across the entirety of the biodiesel supply chain from surpassing
fossil fuel emissions, it is imperative for producers to avoid CPO that is produced from cultivation
on land with high carbon stocks and biodiversity levels.Greenhouse Gas Emissions from Biodiesel Production in Indonesia Based on Life Cycle Analysis |3
By 2017 Indonesia had 12.3 million hectares of oil palm plantations (Directorate-General of
Plantations, 2018), with 60% - 7.5 million hectares - of the oil palm plantations managed by
state-owned and private oil palm companies, and the remaining 4.8 million hectares community
plantations, see Figure 1. Although community plantations account for 40% of the total area of
oil palm plantations they supply only 34% of total national oil palm production. In 2017 Indonesia
produced 38.17 million tons of palm oil - 31.05 million tons for export and 4.02 million tons allocated
for the national reserve (GAPKI, 2018).
Figure 1. Land Ownership in the Palm Oil Industry Sector
80
58.56
60 53.12
40.28
40 33.88
%
20
6.61 7.55
0
Smallholders BUMN Companies
(State owned enterprises)
Palm Oil Producers
% Land Ownership % of Total Production
Consumption of biodiesel from palm oil reached 2.57 million kiloliters in 2017, and was estimated
to contribute to 6.89 million tCO2eq in GHG emissions reduction (Santoso, 2018). Biofuel is expected
to positively contribute to the national energy balance and to reducing national GHG emissions.
However, the palm oil sector that produces the feedstock for biodiesel production is often linked
to issues of deforestation, land use change (LUC), and increased GHG emissions. Therefore,
identification, inventorization, and calculation of GHG emissions of biodiesel production from CPO
must be conducted to ensure that the negative effects of biodiesel production do not outweigh the
positive contributions it can make.
Indonesia faces a significant challenge to improve the sustainability of palm oil and to minimize
the sector’s GHG emissions, especially for biodiesel production from CPO. Any assessment of GHG
emissions from biodiesel produced from CPO must include the emissions caused by land use change.
An estimated 33.5% of Indonesia’s oil palm plantations are located in forests, including peat forests,
with 26.3% in scrubland, including peat scrubland, and 34.1% from agroforestry (Gunarso, Hartoyo,
Fahmuddin, & Killeen, 2013). Plantations and the oil palm sector account for approximately 15%
of total national emissions, the majority of which are derived from the oxidation of peatland, land
clearing, and palm oil mill effluent (POME) (Ministry of Environment and Forestry, 2018). Simulations
conducted by Purnomo et al. (2018) show that emissions from plantations and palm oil production
could reach 716 million tCO2eq by 2037. The baseline year for the simulation was 2015, which also
assumed that 21% of oil palm plantations are vulnerable to burning, and 5% are intentionally burned
during land clearing (Purnomo, Okarda, Dermawan, Ilham, & Bizarani, 2018).4| Calculating the upstream GHG emissions of biodiesel from CPO should begin with the cultivation process in plantations, and end at the biodiesel blending station stage. Using Life Cycle Analysis (LCA), calculations for upstream and downstream emissions can be applied all the way to the consumption of biodiesel. The calculation includes all stages that cumulatively contribute to GHG emissions - land clearing, fertilizer use, fossil fuel use, and POME (Bessou et al., 2014). The amount of emissions from the production chain depends specifically on the condition of the supply chain. For example, an LCA conducted by RSPO on 11 of its member companies produced an average emissions level of 1.67 tCO2eq/ton CPO, with figures ranging between -0.02–8.32 tCO2eq/ton CPO (Bessou et al., 2014). The large difference in the range of GHG emissions is primarily caused by differences in initial land use, the type and amount of fertilizer used in plantations, as well as POME management practices in palm oil mills. The objective of this report is to provide the results of the GHG emissions calculation from CPO biodiesel production in Indonesia, so that this can be taken into consideration in future policy planning. LCA is used to analyze GHG emissions across the entirety of a product’s supply chain up to its usage (cradle to grave). This analysis delineates the limits of emissions calculations from the plantation stage all the way to the blending of B20, and from a scenario analysis all the way to the usage stage. A scenario analysis of land use change was also conducted to observe the effects of different scenarios on total GHG emissions from CPO biodiesel. This report also provides a review of previous studies on LCA of biodiesel GHG emissions. The methodology and summary of data provide the technical basis for the GHG calculation and explain how this study was conducted. Based on the research results, this report recommends that the Government of Indonesia and relevant stakeholders quickly adopt an approach of managing GHG emissions from CPO-based biodiesel.
Greenhouse Gas Emissions from Biodiesel Production in Indonesia Based on Life Cycle Analysis   |5

                      2. METHODOLOGY

© Nirapai Boonpheng
6|
This research uses the LCA method to analyze biodiesel production from CPO in Indonesia. The
scope of this study’s LCA is delineated to the production stage of oil palm tree seedlings, land
clearing, up to the blending station of B20. Several different production scenarios are used to see
the effect on GHG emissions from biodiesel production. The Life Cycle Inventory Analysis method is
used to conduct a cradle-to-grave assessment, which includes LUC, the oil palm production process,
transportation, CPO production, biodiesel production, and biodiesel blending. Data analysis involves
material input, energy input, and output from each stage. The LCA was limited to the LUC stage up
to B20 blending, see Figure 2.
This LCA provides emission figures from current production practices of biodiesel. It does not
provide a future projection of emissions because changes in practices currently being implemented
across the supply chain will influence the final GHG emissions calculation. A scenario analysis is also
conducted for each type of land included in the GHG calculations that factor in land use change. The
period of analysis is set at one year for oil palm that is categorized as an annual crop. Emissions
Figure 2. The scope of (Life Cycle Analysis - LCA) for CPO biodiesel production
Scope of Study
Palm Oil Palm Oil Biodiesel
Refinery
Plantation Mill Plant/Blending
Input/Emissions Sources
- Seed Transport
production
and nursery
- LUC
- ILUC - FFB
- Fertilizer - Fuel
- Fuel - Electricity
(transport, - Chemicals - CPO - CPO
of heavy - Solid - Fuel - Fuel
equipment, etc.) waste - Chemicals - Catalyst
- Electricity - POME - Electricity - Electricity
FFB CPO CPO CPO
Output FlowGreenhouse Gas Emissions from Biodiesel Production in Indonesia Based on Life Cycle Analysis |7
from LUC and land clearing for oil palm plantations are converted to annual emissions using the
age of the palm tree. Material and energy inputs are calculated based on production of 1 ton of
biodiesel. The unit used is hectares for plantations.
Data used in this research is obtained from both secondary and primary sources. Secondary data is
obtained from various literature on the production and LCA of biodiesel in Indonesia and Malaysia,
as well as academic and scientific journals and publications. Primary data was sourced from
companies, including the Sustainability Reports of four palm oil companies operating in Indonesia.
Primary data from palm oil smallholder farmers was obtained through random sampling in two
provinces, namely Riau and West Kalimantan. Two regencies (kabupaten) from each province were
chosen as the sampling locus for the farmers. Obtained data was then interpolated to acquire a
depiction of GHG emissions in the production of oil palm from the supply of fresh fruit bunches by
palm oil smallholder farmers. Two methods of data collection were used - desk-based research and
field surveys.
Blending Distribution End
Station Units Customers
- Biodiesel - B2O
- Electricity - Electricity - B2O
B20 B208| a. Desk-based Research Desk-based research was carried out to obtain a literature review of the LCA of biodiesel, emission factors, and data collection related to research published by various institutions and/or research agencies focusing on the oil palm sector in Indonesia and Malaysia. Data from palm oil companies was obtained through sustainability reports in 2016 or 2017 from respondent companies, or the latest published reports. Company data was obtained based on the following criteria: 1. Availability of GHG emissions datas in the company’s annual sustainability report. 2. Reported GHG emissions have been verified or audited by a third party. 3. The company produces or supplies CPO for biodiesel production. 4. Calculation of GHG emissions using the RSPO PalmGHG Calculator or ISCC method. The literature review was carried out from October to November 2018, encompassing GHG emissions from CPO-based biodiesel. b. Field Surveys Field surveys were conducted to obtain samples and to verify data from palm oil smallholder farmers. Two of Indonesia’s five biggest oil palm producing provinces were selected for the field survey - Riau and West Kalimantan. Riau is the largest oil palm producing province in Indonesia, accounting for 21% of total national production, whereas West Kalimantan is the fourth largest producer, at 9% of total national production (Directorate-General of Plantations, 2018). In 2013, Riau had 140 palm oil mills and West Kalimantan had 65 (BUMN, 2014).8 The field surveys in the province of Riau were conducted in the Siak and Pelalawan regencies (kabupaten), the surveys in West Kalimantan were conducted in the Sintang and Sanggau regencies. Two villages were chosen from each regency, totalling eight villages. These eight locations were selected based on the significant areas of oil palm plantations within their borders in relation to the total portion of plantation area at the provincial level, as well as the number of palm oil smallholder farmers, the majority of whom were members of the Union of Oil Palm Farmers (Serikat Farmer Kelapa Sawit/SPKS). Surveys were conducted in December 2018. Interviews were conducted with re-verification of each data obtained. Responses from several respondents were not included due to lack of information, such as data on the amount of fertilizer used, or lack of information about the history of the land prior to its conversion for oil palm plantation. Sixteen palm oil smallholder farmer respondents, owning between 1-32 hectares of land, were selected from each province. Data obtained encompassed primary data: 1) characteristics of farmers, including name, level of education, area and period of landholding; 2) external characteristics of farmers, including involvement in farmer organizations, as well as workshops or coaching clinics attended; 3) the use of input and production factors such as land use change and use of organic and non-organic fertilizer. Respondents represent farmers who have implemented land use change before and after January 1, 2008.
Greenhouse Gas Emissions from Biodiesel Production in Indonesia Based on Life Cycle Analysis   |9

c. Calculation of GHG emissions

In general, GHG emissions calculations were conducted using the concept of mass balance. In order
to simplify the calculation, a multiplier factor was used, namely the emissions factor, which is a
representative value that connects the quantity of emissions released into the atmosphere with
activities related to those emissions. The formulation of GHG emissions using the emissions factor
(IPCC, 2006) is as follows:

                                          (equation 1)

    Notes:
    ∑Emissions      = Amount of emisions
    Activityy       = Data of activity throughout a single period (input amount of emitter)
    EF		            = Emissions factor

    Total emissions in a period of analysis is also the sum of emissions from each source of GHG
    within that period, formulated as follows.

                                                                                                          (equation 2)

    Notes:
    ∑LUC		          = Total emissions from land use change
    ∑Fertilizer     = Total emissions from fertilizer use
    ∑Fuel		         = Total emissions from fossil fuel use
    ∑POME           = Total emissions from palm oil mill effluent
    ∑Energi         = Total emissions from energy use (electricity and steam)

    The intensity of a product’s emissions was obtained by dividing total emissions in one
    period with the total unit of output produced. In this research, emissions intensity for CPO
    production and biodiesel is formulated as follows.

                                                                         (equation 3)

    Notes:
    Intensity of GHG Emissions     = Per unit of GHG output (tCO2eq/tPO, gCO2eq/l biodiesel,
                                     gCO2eq/MJ)
    ∑Emissions			                  = Total emissions in one period (tCO2eq/year)
    ∑Output                        = Total output in one period (tCPO/year, liter of biodiesel/year,
                                     MJ/year)

    Details of emissions factors are available in each sub-chapter in the Results and Discussion
    chapter. The tier of data used is tier 1, both for palm oil smallholder farmers and for
    companies, and the emissions factor is obtained from RSPO and ISCC.
10 | d. Data Analysis Data obtained from surveys on palm oil smallholder farmers were analyzed descriptively through a tabulation of respondents’ distribution of each variable studied. Data related to production input from palm oil smallholder farmers and palm oil companies were tabulated quantitatively for further use in the LCA. Analysis was conducted using an inventorization of GHGs. Data is provided in units of input and output of 1 ton of biodiesel. In a number of stages, input and output are also provided in units of hectares/year. Data analysis was conducted in January 2019. Scenario analysis on land use change (LUC) was conducted based on the type of land in order to identify the effects of LUC on total GHG emissions in B20 production.
Greenhouse Gas Emissions from Biodiesel Production in Indonesia Based on Life Cycle Analysis   | 11

 3. RESULTS AND DISCUSSION

PT Agriprima Cipta Persada (PT ACP) Palm Oil Concession in Papua
© Ulet Ifansasti/Greenpeace
12 |

The results of data analysis of the field research that was conducted in December 2018, with
data obtained from the Sustainability Reports of companies and respondent data from palm oil
smallholder farmers, is presented as follows:

3.1 Companies

Company data was obtained from four private palm oil companies. These companies publish
annual sustainability reports that of provide a record GHG emissions throughout the report period,
sources of GHG emissions, and emissions intensity per output of product. The four companies
are Asian Agri, Golden Agri Resources, Musim Mas, and Wilmar International. These companies
operate and own plantations and palm oil factories in Indonesia, as well as own biodiesel plants
or supply CPO for biodiesel feedstock. These companies reported two different GHG emissions
figures - those that factor in LUC, and those that do not.

A. Asian Agri

Fresh fruit bunches processed in palm oil factories are sourced from their own plantations
(38%), plasma plantations (19%), and external suppliers (43%). External suppliers include palm
oil smallholder farmers that possess RSPO and ISCC certifications. The majority (90%) of palm oil
smallholder farmers supplying Asian Agri have RSPO certification, and 100% of them have ISCC
certification. The total number of plantations owned by Asian Agri comprise 93,574 ha, whereas
plasma plantations comprise 52,917 ha. Fresh fruit bunches that are the raw material for the
production of CPO are produced from mineral and peatland plantations.

Asian Agri’s 2016 sustainability report states that the primary sources of GHG emissions are land
conversion, oxidation of peat, and methane emissions from POME. GHG emissions are calculated
using RSPO PalmGHG Calculation version 3.0. LUC was factored in due to the presence of land
clearing after RSPO’s cut off date of 2005. Asian Agri’s report of GHG emissions in 2016 can be seen
in Table 2.

                     Table 2. GHG Emissions from CPO Production - Asian Agri

                                                     GHG Emissions (tCO2eq./tCPO)
          Location
                                                Mineral land                  Peatland
          North Sumatera                            0.23                        16.04
          Riau                                      0.7                          9.38
          Jambi                                     0.56                         n/a

GHG emissions data in three different locations show the range of GHG emissions to be between
0.23 tCO2eq/tCPO for CPO produced from mineral land, whereas GHG emissions from CPO produced
from peatland in two locations range from 9.38 tCO2eq/tCPO to 16.04 tCO2eq/tCPO.
Greenhouse Gas Emissions from Biodiesel Production in Indonesia Based on Life Cycle Analysis | 13
B. Golden Agri Resources (GAR)
GAR reported GHG emissions without factoring in LUC. GAR’s plantations have been opened before
2005, so that their GHG emissions report does not need to factor in LUC. In their 2017 Sustainability
Report, GAR reported GHG emissions from CPO production at 795.25 kgCO2eq/tCPO, 799.25 kgCO2eq/
tCPO for two locations in Kalimantan, 848.53 kgCO2eq/tCPO for a location in North Sumatra, and
907.68 kgCO2eq/tCPO for a location in Riau. The following is a summary of GHG emissions intensity
from CPO produced by GAR.
Table 3. GHG Emissions from the Production of CPO - Golden Agri Resources
GHG Emissions (kg CO2eq/tCPO)
Location
Verified emissions POME emissions (ISCC method) Total emissions
Sungai Rungau 359 436.25 795.25
Hanau 363 436.25 799.25
North Sumatera 416 436.25 848.53
Riau 475 436.25 907.68
All calculations conducted in Kalimantan, North Sumatra, and Riau show GHG emissions ranging
from 795–907 kgCO2eq/tCPO. POME emissions from palm oil factories contribute more than 50%
of total GHG emissions, except emissions in Riau. Average GHG emissions are 837.7 kgCO2eq/tCPO.
Installation of methane capture in GAR’s palm oil factories reduce GHG emissions by approximately
40–55% (GAR, 2018). Average GHG emissions from all of GAR’s companies, irrespective of these
4 locations, experienced a decline from 765.7 kgCO2eq/tCPO to 391.8 kgCO2eq/tCPO as shown in
Figure 3. Thus, emissions from palm oil factories (POME) is 373.9 kgCO2eq/tCPO.
Figure 3. Comparison of GHG emissions from Methane Capture in GAR Palm Oil Mills (GAR, 2018).
800
GHC Emission
600 reduction is
about 48.8%
400 765.66
kgCO2e/dry
ton CPO
391.77
200 kgCO2e/dry
ton CPO
0
Average GHG Average GHG
without methane Capture with methane Capture
Attempts to reduce GHG emissions through methane capture and usage of biogas have been
implemented in six palm oil mills (biogas plants) owned by GAR, with emissions reduction starting
from 23,733 tCO2eq/year to 101,001 tCO2eq/year for each location, as shown in Table 4. In 2017,
GHG emissions were successfully reduced by 431,160.6 MTCO2eq.14 |
Table 4. GHG emissions reduction from GAR’s Methane Capture in 2017 (GAR, 2018).
No Biogas Plant ER (tCO2eq.)
1 SRUF Biogas Plant 89,737.0
2 SMLF Plant 96,792.6
3 RRMF Biogas Plant 70,985.7
4 PRDF Biogas Plant 101,001.2
5 PLKF Biogas Plant 23,733.8
6 LIBF Biogas Plant 48,910.3
Total 431,160.6
GAR owns a biodiesel plant in Kalimantan with a total capacity of 300,000 tons per year. However,
no GHG emissions report from biodiesel production from this plant is available in GAR’s 2017
Sustainability Report.
C. Musim Mas
In their 2017 Sustainability Report, Musim Mas provided GHG emissions that were calculated using
the RSPO PalmGHG Calculator. Fresh fruit bunches processed by Musim Mas were obtained from
their own plantations (68%), plasma plantations (3%), and palm oil smallholder farmers’ plantations
(29%) with a total in 2017 of 3.3 million tons of processed fresh fruit bunches. Musim Mas’ OER
was 22.60% in 2017. Musim Mas reported GHG emissions intensity as group emissions. Their
Sustainability Report does not record emissions per palm oil factory or location. Group emissions
shifted from 3,330 kgCO2eq/tCPO in 2016 to 3,390 kg/CO2eq/tCPO in 2017.
GHG emissions reported by Musim Mas factor in emissions from land conversion after 2005, as
well as emissions from peat oxidation. At 92%, the largest source of emissions originated from peat
oxidation, land clearing, and N2O. The proportion of emissions based on source is shown in Figure 4.Greenhouse Gas Emissions from Biodiesel Production in Indonesia Based on Life Cycle Analysis | 15
Figure 4. Percentage of Emissions from CPO Production - Musim Mas
1% 4%
2%
1%
27%
55%
10%
Field fuel use fertilizer POME 3rd party emission
land clearing N2O discharge Peat oxidation
Musim Mas has installed methane capture technology and reduced GHG emissions from
POME, so that the percentage of emissions from POME fell to 2% of total emissions, lower than
fertilizer emissions. Biogas produced from methane capture facilities has been utilized for their
own electricity production (captive power), as well as the selling of excess power to the National
Electricity Company’s grid (PLN). This is seen from emission credits from electricity as well as shell
sales, as seen in Table 8. Musim Mas owns 18 biofuel plants including biodiesel plants. However, the
company’s Sustainability Report does not report GHG emissions from biodiesel production activities
and biodiesel emissions intensity.
Figure 5. Sources of GHG Emissions - Musim Mas
1,954,140
2,000,000
1,500,000
983,039
1,000,000
500,000 346,927
154,247 89,204
19,882 27,153 879 (946,286)
-
(500,000)
(269,833)
(1,000,000)
(980,713)
e
r
E
on
g
e
n
n
e
it
t
or
ze
rin
M
us
g
us
ed
tio
io
ar
si
xp
ili
PO
at
cr
ea
da
el
el
is
ch
rt
tr
le
em
fu
fu
ity
cl
fe
xi
es
s
el
di
O
nd
d
ill
ic
qu
sh
y
el
M
tr
O
at
rt
la
Fi
se
ec
pa
Pe
el
2
N
rn
el
op
3 rd
ke
E
Cr
M
lm
PO
Pa16 |
D. Wilmar International
In their 2017 Sustainability Report, Wilmar states their GHG emissions from CPO production as 2.88
tons CO2eq/tCPO, factoring in LUC (Wilmar International, 2018). Meanwhile, their 2016 Sustainability
Report states GHG emissions of 2.23 t CO2eq/tCPO. From total GHG emissions of 4.14 million tCO2eq
in 2017, as seen in Figure 6, the LUC sector contributed 1.73 million CO2eq, and the peat sector
contributed 1.26 million tCO2eq. This number is offset by the carbon sequestration sector in oil palm
and in conservation plants, numbering 1.87 million MTCO2eq and 58,718 MTCO2eq, respectively.
With fresh fruit bunch production at 3,922,904 MT and CPO production at 1,742,618 MT in 2017,
Wilmar’s average fresh fruit bunch productivity is 19.7 tons/ha, as seen in Table 5, with a 20%
extraction rate of CPO to FFB.
Figure 6. Sources of GHG Emissions - Wilmar International 2017 (Wilmar International, 2018)
Emission Sources and Sinks 2017
MT CO2e
5,000,000
4,033,437
4,000,000
3,000,000
2,000,000 1,733,027
1,261,404
1,000,000 546,262
183,310 349,525 60,882
18,866 125
-
(58,718) (109,959)
(1,000,000)
(2,000,000) (1,867,780)
(3,000,000)
n
n
r
s
d
n
s
E)
)
n
ity
s)
ill
ze
on
ea
tio
tio
el
tio
io
on
M
(m
ic
Fi
ili
at
Ar
si
O
ca
ra
da
tr
si
rt
is
is
on
(P
n
ec
is
st
lo
n
Fe
xi
til
Em
io
em
io
ue
El
nt
al
O
n
U
pt
om
at
io
ue
&
ge
q
at
O
ity
um
er
v
Se
pt
B
Pe
er
fr
Effl
an
N
2
ic
w
EF
um
ns
ns
op
tr
s
ro
ch
n
ec
ill
Co
l,
Co
ns
io
tg
Cr
el
M
e
El
s
ou
us
sh
Co
el
is
in
il
rid
Fu
Em
O
d-
el
es
n
el
G
an
lm
io
rn
Fu
ud
at
CO
2
L
ke
Pa
cl
tr
al
(in
lm
es
ic
or
qu
pa
s
on
t
is
Se
of
si
H
is
e
al
Em
(s
et
its
N
ed
cr
ill
MGreenhouse Gas Emissions from Biodiesel Production in Indonesia Based on Life Cycle Analysis | 17
Figure 7. Sources of Plantation Emissions - Wilmar International
1%
0%
13%
Historical land use change allocation
N2O
42% Peat Oxidation
Fuel Consumption (mill)
Fertilizer
30% Fuel Consumption (field)
POME
Grid Electricity
2% 4%
8%
Looking at the production value of Wilmar’s FFB and CPO, it can be concluded that external supplies
of FFB greatly surpass FFB from their own plantations. Re-verification is required to obtain the
number of FFB bought from external sources, due to different levels of extraction for each FFB
supplier, depending on the type of seedling and practice of agronomy implemented. Nonetheless,
reported GHG emissions are a result of self-produced FFB and CPO production, as well as FFB and
CPO supplied from a third party, namely palm oil smallholder farmers.
Table 5. Production Data of Wilmar International in 2017 (Wilmar International, 2018)
Notes Value
OER 20%
FFB yield (t FFB/ha) 19,7
Area (ha) 229.456
Differences in GHG emissions in 2016 and 2017 are caused by an addition of peatland in Wilmar
International’s plantation area. In 2017, the plantation area from peatland comprised 22,492 ha
compared to 22,187 ha in 2016. Using the RSPO PalmGHG Calculator, Wilmar International reported
that GHG emissions based on the location of Wilmar International’s plantations ranged from 750
kgCO2eq/tCPO to 16,040 kgCO2eq/tCPO, with average emissions in 2017 at 2,880 kgCO2eq/tCPO.
An addition of 305 ha of peatland in 2017 contributed to a rise in total GHG emissions, from 2,230
kgCO2eq/tCPO in 2016 to 2,880 kgCO2eq/tCPO in 2017.18 | © Mohd Erwin
Greenhouse Gas Emissions from Biodiesel Production in Indonesia Based on Life Cycle Analysis | 19
20 |

These four companies reported different levels of GHG emissions based on location and company
group. The range of GHG emissions per ton of CPO from these four companies is displayed in
Table 6. Referring to Table 6, GHG emissions per ton of CPO range from 0.56 tCO2eq/tCPO to 16.04
tCO2eq/tCPO. Significant differences occur in companies that have converted land after 2005 as well
as set up plantations in peatland.

                  Table 6. Summary of GHG Emissions from Palm Oil Companies

                                                     GHG Emissions (tCO2eq./tCPO)
              Company
                                          Range of emissions            Company average
 GAR                                                  0.80 – 0.91                            0.84
 Wilmar International                                0.75 – 16.04                            2.88
 Asian Agri                                          0.56 – 16.04                             n/a
 Musim Mas                                                   n/a                             3.39

Although not all companies provided details of GHG emissions sources, a common pattern can be
inferred from these four companies. For companies that cleared land after 2005 and converted
plantations from peatland, the largest source of emissions were land clearing and peat oxidation.
The next largest sources of emissions were N2O, POME, and fertilizer use.

3.2 Palm Oil Smallholder Farmers

Based on field data obtained in the provinces of Riau and West Kalimantan in December 2018,
several interesting facts were found related to GHG emissions from the LUC sector, fertilizer and
pesticide use in plantations, and transportation.

3.2.1 GHG Emissions from Land Use Change (LUC)

Palm oil smallholder farmer respondents in Riau are located in two regencies, namely Pelalawan
and Siak, and two villages from each regency were chosen as survey locations. There are 16
respondents from four villages, with land ownership ranging between 1 ha to 20 ha, and with
more than half of the respondents owning land between 2 and 4 ha.

Respondents in West Kalimantan were chosen from the Sintang and Sanggau regencies. Two
villages were chosen from each regency and four palm oil smallholder farmer respondents were
chosen from each village, with a total of 16 respondents from the province of West Kalimantan.
Greenhouse Gas Emissions from Biodiesel Production in Indonesia Based on Life Cycle Analysis | 21
Table 7. Land Use Change Data from Palm Oil Smallholder Farmer Respondents in Riau
Planting Year Prior
Land area Period of Land
No Respondent Not Yet History of
(hectare) Ownership Productive
Productive Land
Provinsi Riau
1 Farmer R.1 18 Between 10–20 years 1997: 4 hectares Scrub
2000: 7 hectares
2002: 7 hectares
Rubber
2 Farmer R.2 2 Over 20 years 2005: 1 hectares
Plantation
2007: 1 hectares
(gambut)
Rubber
3 Farmer R.3 4 Historically inherited 1998: 4 hectares
Plantation
4 Farmer R.4 2 Over 20 years 2007: 2 hectares Forest
5 Farmer R.5 4 10–20 years 2004: 4 hectares Scrub
6 Farmer R.6 6 Over 20 years 1994: 2 hectares Forest
2005: 2 hectares
2010: 2 hectares
7 Farmer R.7 20 10–20 years 1996: 4 hectares Scrub
1998: 4 hectares
2000: 6 hectares
2002: 6 hectares
8 Farmer R.8 6 10–20 years 2005: 6 hectares Scrub
9 Farmer R.9 4 Historically inherited 1998: 4 hectares Farmland
10 Farmer R.10 4 Historically inherited 2014: 1,3 hectares 2015: 2,7 hectares Farmland
11 Farmer R.11 2 10–20 years 2004: 2 hectares Scrub
12 Farmer R.12 1 Between 10–20 years 2004: 1 hectares Farmland
13 Farmer R.13 2 Over 20 years 1999: 2 hectares Scrub
14 Farmer R.14 3 Over 20 years 1999: 3 hectares Scrub
15 Farmer R.15 10 Between 10–20 years 2005: 10 hectares Scrub
16 Farmer R.16 4 Over 20 years 2015: 4 hectares Scrub
Total 92
LUC data in Table 7 and Table 9 show that two farmers in Riau and one farmer in West
Kalimantan own oil palm plantations that were previously forest. The majority of plantations
owned by palm oil smallholder farmers were formerly rubber plantations, scrub, and farmland.
The period of land ownership for previously forested land in Riau is more than 20 years, and
for the farmer in West Kalimantan is historically inherited. Therefore, calculations of GHG
emissions no longer need to factor in LUC. In accordance with ISCC terms, LUC is not factored
in for oil palm plantations that existed before 1 January 2008. Whereas the RSPO calculates
LUC if land clearing for oil palm plantations was conducted after 2005. For a better comparison
between palm oil smallholder farmers and companies, LUC is calculated from after 2005.22 |
Table 8. Carbon Stocks of Biomass from Palm GHG Calculator
(RSPO, RSPO GHG assessment procedure for new developments, 2016)
Land cover classes Carbon stocks in tonne C/ha
Primary forest 268
Logged forest 128
Tree Crop 75
Oil palm 57.5
Shrubland 46
Food crops 9
Grassland 5
From a total of 92 hectares of land owned by palm oil smallholder farmers in Riau, 32 hectares
of oil palm was planted after 2005. For West Kalimantan, 42 hectares of oil palm was cleared
before 2005, whereas the remaining 97.9 hectares was planted in or after 2005, thus necessitating
GHG emissions from LUC to be factored in. In the LUC analysis, there is LUC from palm oil
smallholder farmers before oil palm plantations, namely from primary forests, secondary forests,
plants, scrub, as well as secondary cropland and grassland, as seen in the value of carbon stocks
in Table 8. Peatland calculations are not factored in because there are no land use changes
from peatland in the plantations of palm oil smallholder farmers in Riau and West Kalimantan.
© Phadungsak SawasdeeGreenhouse Gas Emissions from Biodiesel Production in Indonesia Based on Life Cycle Analysis | 23
Table 9. Land Use Change Data for Palm Oil Smallholder Farmers in West Kalimantan
Planting Year
Land area Period of Land Prior History
No Name Not Yet
(hectare) Ownership Productive of Land
Productive
Province of West Kalimantan
Rubber
1 Farmer K.1 12 Over 20 years 2006: 8 hectares 2017: 4 hectares
plantation
Rubber
2 Farmer K.2 11 Historically inherited 2005: 4 hectares
plantation
2007: 7 hectares
3 Farmer K.3 7 Less than 10 years 2008: 3 hectares Scrub
4 Farmer K.4 2 Less than 10 years 1997: 1 hectares 2015: 1 hectares Scrub
Farmer K.5 Farmland and
5 2 Between 10-20 years 2007: 2 hectares
Scrub
6 Farmer K.6 10 Between 10-20 years 2012: 6 hectares 2016: 4 hectares Scrub
Less than 10 years Farmland and
7 Farmer K.7 18 1997: 14 hectares 2015: 4 hectares
dan antara 10-20 Scrub
Farmer K.8 Farmland and
8 4 Over 20 years 1997: 4 hectares
Scrub
9 Farmer K.9 6 Historically inherited 2007: 6 hectares Forest
10 Farmer K.10 2,3 Between 10-20 years 2008: 2,3 hectares Scrub
Farmer K.11 Rubber
11 1,7 Between 10-20 years 1999: 1,7 hectares
plantation
Farmer K.12 2007: 1,6
12 3,6 Between 10-20 years 1999: 2 hectares Scrub
hectares
Farmer K.13 Farmland and
13 2,3 Historically inherited 2000: 2,3 hectares
Scrub
Farmer K.14 Farmland and
14 2 Between 10-20 years 2008: 2 hectares
Scrub
Between 10-20 years 1999: 4 hectares;
15 Farmer K.15 32 2011: 6 hectares Scrub
and Less than 10 years 2008: 4 hectares
2012: 6 hectares
2013: 6 hectares
2014: 4 hectares
2017: 2 hectares
1992: 5 hectares;
2015: 15 Farmland and
16 Farmer K.16 24 Historically inherited 1995: 2 hectares;
hectares Scrub
2002: 2 hectares
Scrub
Rubber
plantation
total 139.9
Data obtained from respondents in two provinces show a total land area of 231.9 ha. From this
figure 42% - 92 ha - was cleared before 2005 28% - 62.9 ha - was cleared between 2005 and 2008 6%
- 14 ha - was opened between 2009–2012, and 24% - 54 ha - was cleared after 2012. The distribution
of annual land clearing in Riau and West Kalimantan can be seen in Figure 8.24 |
Figure 8. Distribution of annual land clearing by Palm Oil Smallholder Farmers
in Riau and West Kalimantan
(Ha)
100
Total Plantation Area (Ha)
54 41 41.9 46
50
21
12
2 8
0
Pre 2005 2005-2008 2009-2012 Post 2012
Period
Riau West Kalimantan
3.2.2 GHG emissions from plantations
GHG emissions from plantations are calculated as the amount of GHG emissions produced through
plantation activity in a year, divided by plantation productivity, namely the amount of FFB produced.
FFB productivity greatly depends on the type of seedling used, as well as the usage of fertilizer and
pesticide. Table 10 portrays FFB productivity of palm oil smallholder farmers in Riau. The lowest
amount of productivity is 6 tons of FFB/ha/year, the highest is 18 tons of FFB/ha/year. Three farmers
have a productivity of 6 tons of FFB/ha/year, and only four farmers have a productivity above 10 tons
of FFB/ha/year. One farmer does not have information related to productivity because the plants
have not yet produced fruit. Total production is 960.6 tons of FFB for an area of 92 hectares, with an
average of 10.4 tons of FFB/ha/year. Productivity levels of palm oil smallholder farmers in Riau are
only half of the average productivity of plantations belonging to Wilmar, namely 19.7 tons of FFB/ha
(Wilmar International 2018), and 20.5 tons of FFB/ha for plantations belonging to GAR (GAR, 2018).Greenhouse Gas Emissions from Biodiesel Production in Indonesia Based on Life Cycle Analysis | 25
Table 10. Productivity of Palm Oil Smallholder Farmers in Riau
Land Harvest Productivity/ Yield ( ton
Source of Type of Production
No Name Area Cycle/ month (ton FFB/ ha/
Seedling Seedling (FFB ton)
(ha) Month FFB/ha) year)
Provinsi Riau
1 Farmer R.1 18 3 times 1.5 Seedling Non-hybrid 18 324
PT. Guna
2 Farmer R.2 2 2 times 1 Hybrid 12 24
Dodos
PT. Guna
per 20 Hybrid and
3 Farmer R.3 4 0.625 Dodos & 7,5 30
days non-hybrid
Seedling
per 20 PT. Guna
4 Farmer R.4 2 0.5 Hybrid 6 12
days Dodos
5 Farmer R.5 4 3 times 1.25 Seedling Non-hybrid 15 60
6 Farmer R.6 6 3 times 0.75 Seedling Non-hybrid 9 54
7 Farmer R.7 20 3 times 0.7 Seedling Non-hybrid 8.4 168
PT. Guna
8 Farmer R.8 6 2 times 1 Hybrid 12 72
Dodos
PT. Guna
9 Farmer R.9 4 2 times 1.25 Hybrid 15 60
Dodos
KKPA (Coop
10 Farmer R.10 4 2 times 0.5 Hybrid 6 24
Credit)
Dinas
11 Farmer R.11 2 2 times 0.75 Hybrid 9 18
Perkebunan
12 Farmer R.12 1 2 times 0.7 Donated Hybrid 8.4 8.4
13 Farmer R.13 2 2 times 0.8 Seedling Non-hybrid 9.6 19.2
14 Farmer R.14 3 2 times 0.75 Seedling Non-hybrid 9 27
15 Farmer R.15 10 2 times 0.5 Seedling Non-hybrid 6 60
16 Farmer R.16 4 n/a n/a Agent Non-hybrid n/a n/a
total 92 960.6
Notes: Farmer R.16’s plantation has not yet produced fruit
Productivity of oil palm plantations owned by palm oil smallholder farmers in West Kalimantan
range from 6 to 19.6 tons of FFB/ha/year, with an average of 13.5 tons of FFB/ha/year. This average
is relatively higher than the average productivity of palm oil smallholder farmers in Riau. This is due
to several factors, such as the age of the oil palm plant for the productive period in West Kalimantan,
at a relatively recent planting year (7–15 years), compared to Riau, with a relatively aged planting
year (15–27 years), which thus requires rejuvenation as shown in Table 10 and Table 11. In addition,
factors that impact the productivity of oil palm is the consumption of fertilizer, which is relatively
better in West Kalimantan compared to Riau.
Although the productivity of palm oil smallholder farmers in West Kalimantan is higher than that of
farmers in Riau, the general average of farmers’ productivity in these two provinces is 20% to 50%
lower than the productivity of palm oil companies. A palm oil smallholde farmer in West Kalimantan
has a land productivity nearing that of a palm oil company, namely 19.6 tons/ha/year. Aside from
the quality of seedling, low levels of productivity can also be caused by fertilizer use in palm oil26 |
smallholder farmers’ plantations. Fertilizer use in palm oil smallholder farmers is highly influenced by
knowledge of good agricultural practice (GAP) and the individual financial capabilities of each farmer.
Table 11. Productivity of Palm Oil Smallholder Farmers in West Kalimantan
Land Harvest Productivity/ Yield
Source of Type of Production
No Name Area Cycle/ month (ton (ton FFB/
Seedling Seedling (FFB ton)
(ha) Month FFB/ha) ha/ year)
Province of West Kalimantan
Non-
1 Farmer K.1 12 2 times 1 Seedling 12 144
hybrid
PPKS
2 Farmer K.2 11 2 times 1.1 Hybrid 13.2 145.2
Perindo
PPKS
3 Farmer K.3 7 2 times 1 Hybrid 12 84
Perindo
4 Farmer K.4 2 2 times 1.25 Lyman Agro Hybrid 15 30
Gov’t
5 Farmer K.5 2 2 times 1.25 Office of Hybrid 15 30
Plantations
PPKS
6 Farmer K.6 10 2 times 1 Hybrid 12 120
Perindo
7 Farmer K.7 18 2 times 1 Company Hybrid 12 216
8 Farmer K.8 4 2 times 0.5 Lyman Agro Hybrid 6 24
PPKS
9 Farmer K.9 6 2 times 0.5 Hybrid 6 36
Perindo
10 Farmer K.10 2.3 2 times 0.7 Company n/a 8.4 19.32
PPKS
11 Farmer K.11 1.7 2 times 1.25 Hybrid 8.8 14.96
Parindu
PPKSP
12 Farmer K.12 3.6 2 times 0.75 Hybrid 9 32.4
parindu
13 Farmer K.13 2.3 1 times 1 PTPN 13 Hybrid 12 27.6
Gov’t
14 Farmer K.14 2 2 times 0.75 Office of Hybrid 9 18
Plantations
PPKS
15 Farmer K.15 32 2 times 1.4 Hybrid 14.8 473.6
Parindu
PPKS
16 Farmer K.16 24 2 times 1.6 Hybrid 19.6 470.4
Parindu
total 139.9 1.885.48
Emissions from fertilizer refers to Table 12 based on data from ISCC (ISCC, 2016). Consumption of
fertilizer and pesticide is shown in Table 13 and Table 14 for each palm oil smallholder farmer in
Riau and West Kalimantan. Pesticide consumption refers to amount in kilogram of active material
contained in the pesticide, with pesticide density assumed to be equivalent to water, namely 1
kilogram equivalent to 1 liter.Greenhouse Gas Emissions from Biodiesel Production in Indonesia Based on Life Cycle Analysis | 27
Table 12. GHG Emission Factors from Fertilizer and Pesticide (ISCC, 2016).
Materials Value Unit Source
N-fertilizer 5.881 kgCO2eq/kg European Commision
P2O5-fertilizer (Diammonium Phosphate) 1.011 kgCO2eq/kg European Commision / ISCC
K2O-fertilizer (Pupuk MOP) 0.576 kgCO2eq/kg Ecoinvent 2010 / ISCC
Urea 1.92 kgCO2eq/kg Biograce 2011 / ISCC
TSP 0.54 kgCO2eq/kg Biograce 2014 / ISCC
Rock Phosphate 0.09 kgCO2eq/kg Biograce 2015 / ISCC
Pesticide 10.97 kgCO2eq/kg air European Commision / ISCC
Use of fertilizer by palm oil smallholder farmers varies in type and quantity. The type of fertilizer
used includes organic and inorganic fertilizer obtained from fertilizer shops and cooperatives.
Organic fertilizer used by farmers is comprised of empty bunch (janjang kosong) and compost from
livestock faeces, such as cow manure. Palm oil smallholder farmers in West Kalimantan and Riau
use between 4 to 180 liters of pesticide per year, however, some farmers do not use any pesticide
at all.
© Mohd Razz Rozzfaisal28 |
Table 13. Use of Fertilizer and Pesticide by Palm Oil Smallholder Farmers in Riau
Fertilizer type (kg)/ha/year
Fertilizer
No Name Pesticide
supplier NPK N P2O5 K2O Urea Pesticide (L) Other
a.i. (L)
Riau Province
Empty
Farmer bunch
1 Shop 0 0 0 600
R.1 200 kg/4
months
Farmer
2 Shop 675 101.25 101.25 101.25 Round up 4 1.44
R.2
Livestock
Farmer manure
3 Shop 0 0 0 Round up 4 1.44
R.3 300 kg/
year
Farmer Gramoxone
4 Shop 0 0 0 50 1.4
R.4 7
Farmer Round Up
5 Shop 1000 150 150 150 500 21.6
R.5 60
Empty
Farmer
6 Shop 0 0 0 1200 bunch
R.6
2 ton/year
Farmer
7 Shop 150 22.5 22.5 22.5 150
R.7
Kieserite
Farmer Gramoxone
8 Shop 300 45 45 45 8 150 kg/6
R.8 40
months
Farmer Gramoxone Empty
9 Shop 0 0 0 600 5
R.9 25 bunch
TSP 150
Farmer Gramoxone
10 Shop 0 0 0 600 3 kg/6
R.10 15
months
RP 200
Farmer
11 Shop 0 0 0 400 Round up 1 0.36 kg/6
R.11
months
Farmer
12 Shop 0 0 0 800
R.12
Compost
Farmer
13 Shop 0 0 0 Round up 20 7.2 130 kg/3
R.13
months
Farmer
14 Shop 1200 180 180 180 Round Up 5 1.8
R.14
Empty
Farmer
15 Shop 0 0 0 bunch
R.15
300kg
Farmer
16 Shop 0.0 0.0 0.0
R.16
TSP 300
Total (kg) 3,325.0 498.8 498.8 498.8 4,900.0 51.2 kg and
RP 400 kg
GHG (kgCO2eq) 2,933.1 504.2 287.3 9,408.0 562.1 198.0Greenhouse Gas Emissions from Biodiesel Production in Indonesia Based on Life Cycle Analysis | 29
GHG emissions from fertilizer use by palm oil smallholder farmers in Riau in Table 13 show that organic
fertilizers such as empty fruit bunches and livestock manure, are used to (complement) complementing
inorganic fertilizer such as NPK, urea, dolomite, etc. Some farmers only use livestock manure for their
plantations. With total GHG emissions at 13.69 tons of CO2eq, and total FFB produced at 960.9 tons,
the total GHG emissions for palm oil smallholder farmers in Riau is 14.26 kg CO2eq/ton FFB. As farmers
use different quantities of NPK fertilizer, these calculations assume that the NPK fertilizer used contains
15% of N mass, 15% of P2O5 mass, and 15% of K2O mass. Other NPK fertilizer components include
sulphur and zinc, but these are ignored because of their relatively low mass percentage, namely 9%
and 0.002%, respectively; furthermore, they are not included in the ISCC emission factors.
GHG emissions from fertilizer use in palm oil smallholder farmers in West Kalimantan are shown
in Table 14. palm oil smallholder farmers in West Kalimantan use inorganic fertilizer, with or
without organic fertilizer added in. Based on data in Table 18, GHG emissions are at 28.03 tons
CO2eq. With a total production of 1,885.48 tons FFB, GHG emissions of fertilizer use by palm oil
smallholder farmers in West Kalimantan amount to 14.87 kgCO2eq/ton FFB. This figure is slightly
higher than GHG emissions from fertilizer use by farmers in Riau.
Table 14. Use of Fertilizer and Pesticide by Palm Oil Smallholder Farmers in West Kalimantan
Type of fertilizer (kg)/ha/year
Source of
No Name Pesticide active
Fertilizer NPK N P2O5 K2O Urea Pesticide (L) Others
ingredients (L)
West Kalimantan Province
Round up 180.
1 Farmer K.1 Shop 600 90 90 90 600 94.8
Gramoxone 150
2 Farmer K.2 Shop 600 90 90 90 600
3 Farmer K.3 Shop 600 90 90 90 2400
4 Farmer K.4 Shop 1000 150 150 150 Round up 20 7.2
5 Farmer K.5 Shop 0 0 0
Roundup 30.
6 Farmer K.6 Shop 900 135 135 135 900 16.8
Gramoxone 30
7 Farmer K.7 Shop 600 90 90 90 Gramoxone 10 2
8 Farmer K.8 Shop 300 45 45 45 300 Gramoxone 20 4
9 Farmer K.9 Shop 800 120 120 120 Gramoxone 12 2.4
Gramoxone 12.
10 Farmer K.10 Shop 300 45 45 45 350 6.72
Roundup 12
11 Farmer K.11 Cooperative 1500 225 225 225 500
Gramoxone 10.
12 Farmer K.12 Cooperative 1000 150 150 150 500 3.8
Roundup 5
13 Farmer K.13 Cooperative 1000 150 150 150 Gramoxone 48 9.6
Gramoxone 15.
14 Farmer K.14 Cooperative 350 52.5 52.5 52.5 400 8.4
Roundup 15
TSP
Round up 48 .
15 Farmer K.15 Shop 798 119.7 119.7 119.7 708 26.88 133kg/4
Supretox 48
months
16 Farmer K.16 Shop 133.00 19.95 19.95 19.95 133.00 Round up 24 8.64
Total (kg) 10,481.0 1,572.2 1,572.2 1,572.2 7,391.0 191.2 TSP 399 kg
GHG (kgCO2eq.) 9,244.2 1,587.9 911.8 14,190.7 2,097.9 215.5You can also read