PHYSICAL REVIEW X 11, 011036 (2021) - Pulsed Ion Microscope to Probe Quantum Gases - Physical ...
←
→
Page content transcription
If your browser does not render page correctly, please read the page content below
PHYSICAL REVIEW X 11, 011036 (2021)
   Featured in Physics

                                  Pulsed Ion Microscope to Probe Quantum Gases
C. Veit,1 N. Zuber,1 O. A. Herrera-Sancho ,1,2,3,4 V. S. V. Anasuri,1 T. Schmid,1 F. Meinert ,1 R. Löw,1 and T. Pfau              1,*
                         1
                         5. Physikalisches Institut and Center for Integrated Quantum Science and Technology,
                                  Universität Stuttgart, Pfaffenwaldring 57, 70569 Stuttgart, Germany
                        2
                          Escuela de Física, Universidad de Costa Rica, 2060 San Pedro, San José, Costa Rica
                     3
                       Centro de Investigación en Ciencia e Ingeniería de Materiales, Universidad de Costa Rica,
                                                  2060 San Pedro, San José, Costa Rica
                4
                  Centro de Investigación en Ciencias Atómicas, Nucleares y Moleculares, Universidad de Costa Rica,
                                                        2060 San José, Costa Rica

            (Received 1 September 2020; revised 9 November 2020; accepted 22 December 2020; published 22 February 2021)

                   The advent of the quantum gas microscope allowed for the in situ probing of ultracold gaseous matter on
                an unprecedented level of spatial resolution. However, the study of phenomena on ever smaller length
                scales, as well as the probing of three-dimensional systems, is fundamentally limited by the wavelength of
                the imaging light for all techniques based on linear optics. Here, we report on a high-resolution ion
                microscope as a versatile and powerful experimental tool to investigate quantum gases. The instrument
                clearly resolves atoms in an optical lattice with a spacing of 532 nm over a field of view of 50 sites and
                offers an extremely large depth of field on the order of at least 70 μm. With a simple model, we extract an
                upper limit for the achievable resolution of approximately 200 nm from our data. We demonstrate a pulsed
                operation mode enabling 3D imaging and allowing for the study of ionic impurities and Rydberg physics.
                DOI: 10.1103/PhysRevX.11.011036                         Subject Areas: Atomic and Molecular Physics

                      I. INTRODUCTION                                  superresolution has been demonstrated [19,20]. All
                                                                       microscopes based on linear optics, however, are funda-
   The ability to observe natural phenomena on the single-             mentally limited in their resolution and depth of field by the
particle level has led to major breakthroughs in modern                wavelength of the imaging light. A high-resolution imaging
physics. Prominent milestones in this context were the                 method capable of extracting three-dimensional informa-
pioneering experiments in cloud chambers [1], the discov-              tion from large-volume bulk gases is therefore highly
ery of Rutherford scattering [2,3], the first imaging of a             desirable and would allow for the study of quantum
solid surface with atomic resolution [4], and the observa-             correlations, impurity physics, and transport phenomena
tion of quantum jumps for single trapped ions [5,6]. In the            in unprecedented ways.
realm of quantum gases, time- and position-sensitive                      Here, we present a high-resolution imaging system based
single-atom detection enabled Hanbury Brown-Twiss-type                 on ion optics, offering a multitude of intriguing features.
experiments for both bosons and fermions [7,8], and a                  Charged-particle optics is commonly employed in cold-
scanning electron microscope was used for the first high-              atom experiments in the form of momentum-space spec-
resolution in situ detection of individual atoms [9,10].               trometers [21,22], but it has also been used to image neutral
Nowadays, optical quantum gas microscopes offer the                    ground-state atoms [9,23,24] and Rydberg atoms [24–28].
possibility to image strongly interacting atoms loaded into            Our instrument is especially inspired by the ion microscope
optical lattices with single-site resolution [11,12] and have          presented in Ref. [23], for which a spatial resolution of
been used to investigate Bose- and Fermi-Hubbard physics               smaller than 2.7 μm was demonstrated, and it is based on the
[13–16]. Image-stacking techniques have been employed                  following simple concept (Fig. 1). Neutral atoms are
for the reconstruction of three-dimensional atomic struc-              converted into ions and are subsequently imaged by means
tures [17,18], and ensemble-averaged imaging with                      of a magnification system onto a spatially and temporally
                                                                       resolving detector. This scheme allows for the investigation
                                                                       of ground-state ensembles, Rydberg excitations, and ionic
  *
      t.pfau@physik.uni-stuttgart.de                                   impurities with the very same apparatus. Owing to the
                                                                       excellent time resolution of the instrument on the order
Published by the American Physical Society under the terms of          of a few nanoseconds (see Appendix D), both time-depen-
the Creative Commons Attribution 4.0 International license.
Further distribution of this work must maintain attribution to         dent measurements and 3D imaging via the time-of-flight
the author(s) and the published article’s title, journal citation,     information can be realized [29]. The choice of the ioniza-
and DOI.                                                               tion process constitutes a powerful experimental tool,

2160-3308=21=11(1)=011036(11)                                   011036-1              Published by the American Physical Society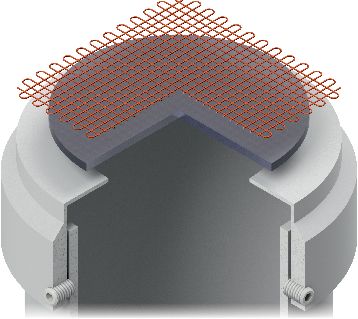
C. VEIT et al. PHYS. REV. X 11, 011036 (2021)
MCP (d) M = ×100 to ×1500
(c) VD2
+ V3
t3 VD1
135 cm
V2
Lens 3
VD1
Lens 2
V1
Lens 1 (a)
2 cm
- VE
t1
- + VR
+ t2
(b)
2 cm
+
FIG. 1. Concept of the pulsed ion microscope. Neutral atoms in
a quantum gas (shown in a 1D periodic potential) are converted
into ions at time t ¼ t1 via a suitable ionization process (e.g.,
near-threshold photoionization). After a variable wait time, an z
y
extraction field is pulsed on (t ¼ t2 ), and the ions are imaged onto x
a spatially resolving detector by means of an ion microscope
consisting of three electrostatic lenses (t ¼ t3 ). The high time
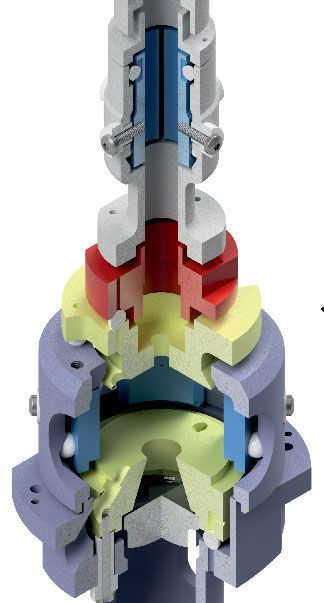
resolution of the multichannel plate detector (MCP) allows for the FIG. 2. Ion microscope. The microscope column consists of
study of dynamical processes (e.g., in strongly interacting many- three electrostatic lenses (main electrodes marked in red, drift
body systems) and 3D imaging via the time-of-flight information. sections in gray). Each lens is followed by an electrostatic
The versatile nature of the concept enables the study of ground- quadrupole deflector (blue). (a) The object plane lies above a
state ensembles, Rydberg systems, and ionic impurities. repeller electrode and below an extractor electrode (pale yellow),
which, at the same time, are part of a six-plate electric field
control (radial field plates marked in blue). The repeller hosts an
enabling the combination of the high spatial resolution with indium-tin-oxide-coated aspheric optical lens. The extractor also
spectroscopic techniques and permitting weak measurement acts as the lower lens electrode of the first lens. (b) Detailed view of
schemes. Furthermore, near-threshold photoionization the second lens and the following deflection stage. (c) Spatially
offers the possibility to produce ultracold ions [30] and resolved ion detection is achieved via a delay-line anode on top of
an MCP stack. (d) Schematic representation of the electrode
opens the door to the spatially resolved study of ionic
configuration. Imaging properties and magnification are deter-
impurities and ion-atom scattering in the quantum regime mined by the extraction voltages (V E and V R ), the lens voltages
[31–35]. In this context, an exciting prospect is the obser- (V 1 to V 3 ), and the drift-tube voltages (V D1 and V D2 ). The latter are
vation of polaron formation and transport dynamics from the referred to as V D for all measurements for which V D1 ¼ V D2 .
two-body collisional timescale to the few- and many-body
timescales. We foresee further applications of our approach
in the imaging of spatial ordering in three-dimensional consists of three electrostatic three-cylinder lenses [38]
Rydberg-blockaded ensembles [36], the detection of fine connected via field-free drift sections. In order to compen-
spatial structures in bulk Fermi gases (e.g., Friedel oscil- sate for mechanical tolerances, each lens is followed by a
lations [37] and spatial correlations), and the probing of quadrupole deflector. The object plane lies between a
dynamic many-body processes with a high time resolution, repeller and an extractor electrode, the latter of which also
just to name a few examples. In the following, we briefly acts as the lower lens electrode of the first lens. To allow for
describe our ion microscope and then focus on its perfor- the study of Rydberg atoms [39] and ions in a field-free
mance and imaging characteristics. We begin by discussing environment, the extraction field can be pulsed on a
a continuous operation mode, in which the object plane is timescale of 30 ns. The observation of free ions serves
permanently immersed in an extraction field, before dem- as an excellent probe for stray electric fields, which we
onstrating a pulsed extraction scheme especially suited for cancel by applying small compensation voltages to the
the study of ions and Rydberg atoms. extractor and repeller as well as to four radially arranged
field plates (see Appendix I). A schematic of the electrode
configuration is shown in Fig. 2(d). The ions are detected
II. ION MICROSCOPE
with an MCP in combination with a delay-line detector [40]
The design of our ion microscope is depicted in Fig. 2. offering a high spatial and temporal resolution on the order
The whole microscope column has a length of 135 cm and of 100 μm and 200 ps, respectively [41]. We expect the
011036-2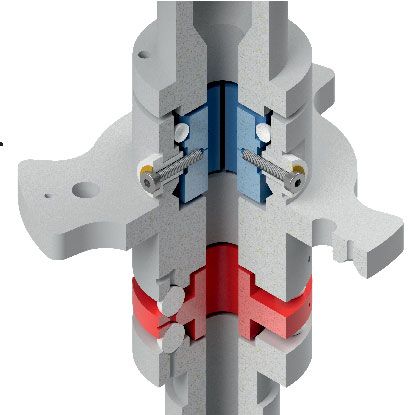
PULSED ION MICROSCOPE TO PROBE QUANTUM GASES                                            PHYS. REV. X 11, 011036 (2021)

detection efficiency of our MCP to be limited to a value        structure of the 780-nm light field by projecting the
close to the open-area ratio of about 70% [42] and plan to      diffraction pattern of a double slit onto the atoms. The
improve this efficiency in the future by employing a funnel-    period of the resulting ionization pattern was measured to
type MCP offering an open-area ratio of 90% [43]. As            be 6.9 μm by employing a large magnification and using
detailed in Appendix D, we aim for a further enhancement        the optical lattice as a ruler. A similar approach was utilized
of the detection efficiency by exploiting facilitated Rydberg   in the proof-of-principle experiment demonstrating 3D
excitation around ionic seeds (see Ref. [44] and references     imaging, and it is detailed in the corresponding section.
within). More information on our instrument can be found           For all characterization methods, the imaged ion dis-
in Ref. [29].                                                   tribution was determined by the atomic density distribution
   In contrast to most conventional optical systems, electro-   and the intensity profiles of the ionization beams. The
static lens systems offer easy tunability of imaging proper-    presented measurements are integrated over several exper-
ties via the electrode voltages. We explore the parameter       imental cycles and, as detailed later, compensated for phase
space of our ion microscope by means of numerical               drifts of the optical lattice as well as for minor distortions of
trajectory simulations performed with a commercially            the detected images. Additional information on the experi-
available program [45] and find that our system allows          ment and the data evaluation is given in the appendix.
for both 2D and 3D imaging. In a first step, we focus here
on the performance of our microscope regarding 2D                                     A. Magnification
imaging. Nevertheless, a first proof-of-principle experi-          To explore the exceptional tunability of the magnifica-
ment demonstrating the 3D imaging capabilities of the           tion M of our instrument, we fix all electrode voltages
optics is presented at the end of this paper. In the 2D mode,   but V 2 and V 3 (see caption of Fig. 3) and use the latter two
we keep all drift tubes at the potential of the MCP front       to tune the focal lengths of the second and third lens.
plate (−2.4 kV) and employ typical extraction voltages of       Figure 3(a) shows a corresponding simulation of the total
V E ¼ −V R ¼ −500V, corresponding to an electric field of       magnification revealing that high-quality imaging results
approximately 420 V=cm in the object plane. An example          can be obtained for magnifications ranging from below
of the axial electrostatic potential is shown in Appendix A.    ×200 to above ×1500. Both higher and lower magnifica-
Owing to their small initial velocity, the cold ions are        tions can be achieved if additional electrode voltages are
extracted on trajectories almost parallel to the extraction     adjusted. We compare the behavior of our microscope
field. Consequently, a sharp projection of the object plane     with the simulation for scans of either V 2 [Fig. 3(c)] or V 3
can be observed in the detector plane even for voltage          [Fig. 3(b)] for which the respective other voltage was fixed
configurations for which no actual image formation occurs.      [see red lines in Fig. 3(a)]. As delineated above, the
                                                                magnification was extracted by imaging either atoms in
          III. CHARACTERISTICS OF THE                           an optical lattice or a diffraction pattern of known period
                 IMAGING SYSTEM                                 (see insets). Evidently, the simulations describe our imag-
   In the following, we present experimental results on the     ing system accurately, with the largest deviation from the
characteristics of the previously described imaging system.     experiment being smaller than 10%. For our detector
For most of the measurements, 87Rb atoms were loaded            diameter (40 mm), the demonstrated magnification range
into a one-dimensional optical lattice with a spacing of        maps to a FOV between approximately 30 μm and 300 μm,
532 nm and photoionized in the crossing volume of two           which permits both high-resolution studies and the obser-
laser beams with wavelengths of 780 nm and 479 nm. The          vation of large atomic ensembles.
780-nm beam was blue-detuned by 78 MHz from the
j5P3=2 ; F ¼ 3i intermediate state and aligned parallel to                            B. Field of view
the optical axis of the microscope (z direction, see Fig. 2).      In order to confirm that the large magnifications suitable
The 479-nm beam was aligned perpendicular to the optical        for high-resolution imaging can be used without any
axis (y direction) and tuned such as to realize a near-         sacrifices concerning the FOV, we utilized our optical
threshold ionization with typical excess energies on the        lattice as a test pattern. To this end, we employed a large
order of h × 100 GHz or below, where h corresponds to the       780-nm beam (w780 ≈ 36 μm) and shaped the 479-nm
Planck constant. The setup described above was used to          beam to a horizontal light sheet with a waist of
characterize the magnification, field of view (FOV), depth      wx;479 ≈ 40 μm. The measurement shown in Fig. 4(a)
of field (DOF), and resolution of our microscope. The           illustrates that the lattice can be clearly resolved over the
waists of the ionization beams were shaped to suit the          whole detector area, corresponding to a FOV of 50 lattice
specific measurement.                                           sites. The data shown are postprocessed in two ways (see
   The study of the magnification behavior of the ion optics    also Appendix F). First, we make use of the regular
included magnifications too small to resolve the optical        structure of the lattice to compensate for a local phase
lattice. For the corresponding set of measurements, we held     Φl caused by small distortions common to all measure-
the atoms in an optical dipole trap and induced a spatial       ments [Fig. 4(d)]. Second, we compensate for a time-

                                                          011036-3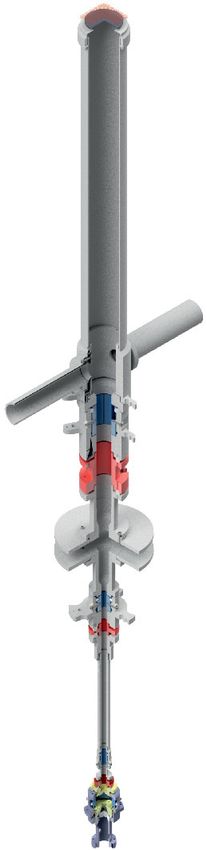
C. VEIT et al.                                                                                     PHYS. REV. X 11, 011036 (2021)

 (a)                                         (b)                                             (c)

                                                         780 nm      532 nm                                                  6.9 μm
                                                                                                                 780 nm

                    L                          479 nm                                                   479 nm
                                                                             1064 nm

FIG. 3. Tuning of the magnification. A large range of M is achievable by tuning V 2 and V 3 (V E ¼ −V R ¼ −500 V, V 1 ¼ −3.2 kV,
V D ¼ −2.4 kV). (a) Result of numerical trajectory simulations for a test pattern with a line spacing of L ¼ 100 nm (see inset) and
parameters resembling the experimental situation. For the displayed data points, the line spacing is clearly resolved and low image
distortion is present (see Appendix A for details). Most values of M are accessible by tuning only V 2. (b) Comparison between experiment
and simulation along the dashed red line (V 2 ¼ −250 V) shown in panel (a). The atoms were loaded into a retroreflected 1064-nm lattice
and photoionized in a crossed-beam configuration (w780 ≈ 26 μm, w479 ≈ 5 μm). (c) Comparison between experiment and simulation
along the solid red line (V 3 ¼ −110 V) shown in panel (a). The 780-nm photoionization laser was spatially structured by projecting the
diffraction pattern of a double slit onto the atoms (see Appendix E). As an example, the insets in panels (b) and (c) show a cutout of the
postprocessed detector image along with the normalized magnitude of the fast Fourier transform (FFT) for one of the voltage
configurations. The FFT corresponds to the integrated profile of the whole image in object coordinates. The values of M are inferred from
the period of the detected patterns. All experimental error bars (see Appendix E) are significantly smaller than the marker size.

(a)                                                                    dependent global phase Φg caused by a thermal drift of the
                                       (b)
                                                                       lattice over the measurement time of almost six hours
                                                                       [Fig. 4(c)]. We find that the local phase Φl stays below 2π
                                                   (c)                 over the whole detector, and we use the data shown in
                                                                       Fig. 4(d) to compensate for the observed distortion in all
                                                                       our measurements. A comparison between the raw data and
                                                                       the postprocessed data is shown in Figs. 4(b) and 4(e) for
                                                                       the marked region in Fig. 4(a). Even the raw data show a
                                                                       good contrast.
                                                   (d)
                                                                                              C. Depth of field
                                                                          The FOV and DOF of an imaging system determine the
                                                                       maximum dimensions of the objects that can be imaged. In
                                                                       the case of high-resolution optical microscopes, the imag-
                                       (e)
                                                                       ing volume is typically restricted by a small DOF origi-
                                                                       nating from the large numerical aperture of the systems. In
                                                                       contrast, the DOF of our ion microscope is remarkably
                                                                       large, as demonstrated in the following. The DOF was
FIG. 4. Field of view. The FOV was investigated for the voltage        probed for the same voltage configuration as used for the
configuration corresponding to the largest magnification shown         FOV measurement by employing a large 780-nm beam
in Fig. 3(b) (M ¼ 1441). (a) Measured data (sum over 1200
                                                                       (w780 ≈ 36 μm) and by shaping the 479-nm beam to a
experimental cycles, object coordinates), corrected for a global
phase Φg (drift of the lattice) and a local phase Φl (distortion).     vertical light sheet (wx;479 ≈ 2 μm, wz;479 ≈ 100 μm).
The marked region is enlarged in panels (b) (raw data) and             Because of the large extent of the light sheet in the z
(e) (phase-corrected data). Panel (c) shows Φg over time, and          direction, the height of the ionization region was primarily
panel (d) shows Φl as a function of the spatial coordinates. The       limited by the diameter of the atomic cloud (1=e diameter
local phase Φl is extracted from the local deviation of the            of approximately 70 μm). Careful alignment of the lattice
experimental data from the expected regular lattice structure.         planes was required in order to attain a good imaging

                                                                  011036-4
PULSED ION MICROSCOPE TO PROBE QUANTUM GASES PHYS. REV. X 11, 011036 (2021)
(a) (b)
amplitude of this second-order peak as a qualitative
measure of the resolution R of our microscope, and we
use a simple model to give a quantitative upper limit of R.
Because of the finite detector resolution, we expect our
imaging system to perform best at large magnifications.
Consequently, the voltage configuration corresponding to
(c)
the data shown in Fig. 3(b) was chosen for our resolution
studies. In order to minimize the effects of residual dis-
tortions, a tightly confined photoionization volume was
1st
used for the measurement (w780 ≈ 2 μm, w479 ≈ 5 μm).
Figure 5(c) shows the magnitude of the first- and second-
2nd
order FFT peaks corresponding to the measured data as a
function of V 3 . The significant amplitude of the second-
order peak indicates an excellent resolution over almost the
whole measurement range. The drop of contrast at small
magnitudes of V 3 is in accordance with our simulations and
results from both imaging aberrations and a decrease of
magnification.
FIG. 5. Depth of field and resolution. (a) Imaging result for an
To extract an upper limit of the resolution, we assume
increased depth of field limited only by the cloud size (1=e
diameter of 70 μm). (b) Absolute value of the FFT corresponding
that all atoms occupy the lowest band of the optical lattice
to the integrated lattice profile shown in panel (a). (c) Magnitudes and employ a Gaussian approximation for the single-site
of the first- and second-order FFT peaks (here, as a function of V 3 wave function (see Appendix H for details). We then
and for a tightly confined ionization region) serving as a convolve the density profile with a Gaussian point spread
qualitative measure of the resolution. All experimental error bars function (PSF), scale it according to the magnification of
(see Appendix F) are smaller than the marker size. The insets the microscope, and bin the profile with the bin size used
show the experimental data for V 3 ¼ −150 V. The solid line for the experimental data (100 μm). Expectedly, the FFT of
and the shaded area show the theoretical prediction for the upper the model profile shows a second-order peak at twice the
bound of the second-order peak amplitude for a resolution of lattice frequency, enabling comparison with the experi-
200 20 nm. Experimental circumstances are detailed in the ment. We identify the full width at half maximum of the
main text.
PSF as the resolution R and find that, for the highest
magnifications, we get good agreement with our exper-
contrast. A resulting measurement is shown in Fig. 5(a), imental data for R ≈ 200 nm [see solid line in Fig. 5(c)]. In
along with the normalized magnitude of the FFT corre- consideration of the nonoptimized loading procedure of the
sponding to the integrated lattice profile [Fig. 5(b)]. As optical lattice, the atoms most certainly occupy several
expected from simulations, we find that the imaging result bands instead of only the lowest band. Since this leads to a
does not suffer from the increased DOF and that it is very less-confined wave function (and therefore to a smaller
similar to the results obtained from the magnification amplitude of the second-order FFT peak), the actual
measurements [see inset of Fig. 3(b) for comparison]. resolution of our microscope is probably significantly
Given the diameter of the atomic cloud, we can quantify smaller than 200 nm. Indeed, numerical simulations
the DOF to be on the order of at least 70 μm. In comparison accounting for realistic mechanical tolerances and voltage
with quantum gas microscopes, typically featuring a DOF noise suggest that a resolution on the order of 100 nm is
smaller than a few micrometers, the DOF of our ion optics achievable [29], which permits the in situ observation of
is exceptionally large and allows for the study of three- phenomena taking place at the length scale of the healing
dimensional bulk gases. length of Bose-Einstein condensates [46] or the Fermi
wavelength of ultracold Fermi gases [37].
D. Resolution
From the measurements presented above, it is evident E. Pulsed operation
that, for large magnifications, the resolution of the micro- A powerful feature of our ion microscope is the ability to
scope is significantly smaller than the period of our test directly image ions and field-ionized Rydberg atoms. Both
target given by the optical lattice. In order to still character- the study of Rydberg and ion physics, however, would be
ize the resolution, we take advantage of the localization of hindered by a constant extraction field. Therefore, our
the atoms caused by the tight confinement in the optical instrument is designed such as to allow for a pulsed
lattice. The signature of this localization is found in the FFT extraction. In the measurements presented in the following,
of our measured data, in which a signal at twice the lattice a fast high-voltage switch was employed to toggle between
frequency is apparent [see, e.g., Fig. 5(b)]. We use the small compensation voltages and large extraction voltages
011036-5C. VEIT et al. PHYS. REV. X 11, 011036 (2021)
(a) (b)
between two electrodes essentially resembling a plate
capacitor [Fig. 2(a)]. Owing to the linear variation of the
extraction potential along the z direction, the ions pass the
extractor electrode with a kinetic energy depending on
1st
the initial position along the optical axis. As a consequence,
the axial position directly maps to a small variation of the
2nd
overall time of flight of the ions. Our simulations show that,
for a broad range of operating conditions, the mapping
between the object coordinate z and the time of flight ttof is
accurately described by the relationship
FIG. 6. Pulsed operation mode. (a) Imaging result for twait ¼
0 μs and magnitude of the FFT corresponding to the integrated ttof ðz; rÞ ¼ αz þ tr ðrÞ þ t0 : ð1Þ
lattice profile. The clear signature of a second-order Fourier peak
indicates a resolution on the order of half the lattice spacing Here, α is a distance-to-time conversion factor, r is the
(266 nm). (b) Decay of the first-order FFT peak, which serves as initial radial distance from the optical axis, tr ðrÞ describes a
an indicator for the blurring of the lattice structure as a function of
radially symmetric curvature of the time of flight, and t0 is a
twait . The timescale of the decay reveals the low temperature of
the produced ions in the few tens of microkelvin range. Error bars position-independent offset. It should be emphasized that,
correspond to a conservative estimate of the statistical error (see for typical operating conditions, t0 is on the order of tens of
Appendix F). microseconds, whereas the contribution of the other two
terms is in the nanosecond range. While tr constitutes an
unwanted distortion, the associated curvature only needs to
being applied to the extractor and repeller [Fig. 2(a)]. be measured once and is then easily compensated for
By the additional use of four radial field plates, this during postprocessing.
procedure enables us to precisely cancel stray electric For a given time resolution (see Appendix D), the
fields while the extraction field is switched off. The pulsed achievable axial resolution depends on α and increases
operation mode was tested for the same optical con- with the overall time of flight of the ions. Consequently, it is
figuration as was used for the measurements discussed beneficial to employ drift-tube voltages of small magni-
in the previous paragraph and slightly different voltage tude. While all drift tubes were kept at the potential of the
settings resulting in a magnification of M ¼ 1467 (see MCP front plate (−2.4 kV) for the measurements presented
Appendix G). In every experiment, 6000 ionization cycles in the preceding part of this paper, our microscope is
were realized, each consisting of a 1-μs-long photoioniza- specifically designed such as to allow for a tuning of V D1
tion pulse followed by a variable wait time twait , after which [see Fig. 2(d)]. Figure 7(a) shows a simulation of the
the extraction field was switched on. A measurement result transverse magnification M of the microscope, demonstrat-
for twait ¼ 0 μs is shown in the inset of Fig. 6(a), together ing that a large range of M is also accessible for
with the corresponding FFT. As for the data measured in V D1 ¼ −550 V. Details on the performed simulations
the continuous operation mode, second-order Fourier peaks can be found in Appendix A.
are clearly observable and indicate a resolution on the order As a first test of the 3D imaging capabilities of the
of half the lattice spacing. For increasing wait time twait , the microscope, we performed a proof-of-principle experiment
visibility of the lattice structure decreases, and a decay of in which we resolved the diffraction pattern of two crossed
the first-order Fourier peak can be observed [Fig. 6(b)]. double slits. For the chosen electrode voltage configuration
This approximately Gaussian-shaped decay with a 1=e [marked with a red dot in Fig. 7(a)], the transverse
timescale of 2.4 μs is consistent with an ion temperature of
magnification was experimentally determined from an
a few tens of microkelvin. We attribute the associated
optical lattice measurement to be M ¼ 1026, which is in
kinetic energy mostly to the excess ionization energy
good agreement with the simulated value of M sim ¼ 1080.
(∼kB × 13 μK, with kB being the Boltzmann constant)
The atomic cloud was prepared similarly to the procedure
and the occupancy of several excited bands in the optical
detailed in Appendix B, but it was transported and held in a
lattice. A reduction of the ionization energy in combination
single-beam 1064-nm optical dipole trap oriented along the
with an ultracold atomic sample will, in the future, allow for
x direction (w1064 ≈ 38 μm). As for the pulsed measure-
the creation of much colder ions and enable the inves-
ments shown in Fig. 6, every ionization cycle consisted of
tigation of ion-atom hybrid systems in the quantum regime.
an approximately 1-μs-long photoionization pulse, after
which the extraction field was switched on. The complete
F. 3D imaging ionization sequence lasted 1.3 s and comprised approx-
The 3D imaging capability of our instrument is based on imately 4300 ionization cycles. During the photoionization
the time-of-flight information of the ions. For the following pulse, the central part of the atomic cloud was illuminated
discussion, it is worth recalling that the ions are created homogeneously by a large 780-nm beam. The 479-nm light
011036-6PULSED ION MICROSCOPE TO PROBE QUANTUM GASES PHYS. REV. X 11, 011036 (2021)
M Ion count good agreement with our simulations. The postprocessed
(a) (b) 6.9 μm (c)
data are shown in Fig. 7(d) as a function of the object
coordinates. The diffraction pattern is clearly resolved in
VD1 = -550V 479 nm
4 the z direction, corresponding to the optical axis of the
VD2 = -2400V z
V1 = -1400V 7780 nm microscope.
x
VE = -VR= -400V Because of detrimental effects broadening the arrival
479 Lens 780
z nm nm time distribution of the ions (see Appendix D), we do not
y Atoms expect the axial resolution to match the transverse reso-
x
lution in the presented operation mode. As our simulations
Ion count Ion count Ion count suggest, axial resolutions significantly better than 1 μm can
(d) be achieved, however, for drift-tube voltages V D1 even
smaller in magnitude. The corresponding operation modes
will be investigated in future studies.
IV. CONCLUSION AND OUTLOOK
We have presented a high-resolution ion microscope
allowing for the time-resolved probing of quantum gases on
FIG. 7. Three-dimensional imaging. (a) Transverse magnifica- a single-atom level. The magnification of the imaging
tion for a reduced magnitude of V D1 , boosting the axial system was shown to be highly tunable, enabling the
resolution. All electrode voltages are given in the plot. investigation of both isolated microscopic few-body proc-
(b) Proof-of-principle experiment to test the 3D imaging. The esses and extended many-body systems. With a resolution
light field of the 479-nm photoionization laser is spatially better than 200 nm and an exceptionally large DOF of more
structured by projecting the diffraction pattern of two crossed than 70 μm, our microscope is excellently suited for the
double slits onto the atoms. (c) Imaging result in detector study of bosonic and fermionic bulk quantum gases on the
coordinates (xt plane) for an electrode voltage configuration length scale of the healing length and the Fermi wave-
corresponding to the red mark (V 2 ¼ −50 V, V 3 ¼ −110 V) length, respectively. A pulsed operation mode enables the
shown in panel (a). The arrival time of the ions is corrected for an
spatially resolved investigation of ion-atom hybrid systems
offset. As predicted from simulations, a curvature of the time of
flight is observed. (d) Imaging result in object coordinates (all and Rydberg ensembles and permits the ultraprecise
planes) after compensating for the curvature of the time of flight. measurement and subsequent compensation of stray elec-
In both panels (c) and (d), an integration of all ion counts is tric fields.
performed along the dimension not shown. We believe that charged-particle optics holds great
promise for the field of ultracold quantum gases and will
allow for a whole range of new experimental techniques as
well as an unprecedented level of precision. Key aspects in
field was spatially structured in both the x and z directions this respect are the exceptional spatial and temporal
by projecting the diffraction pattern of two crossed double resolution, the possibility of 3D imaging, and the freedom
slits (slit separation and width of 6.5 mm and 1 mm, to combine the spatial resolution with spectroscopic tech-
respectively) onto the atoms [see Fig. 7(b)]. The x period of niques. For example, the latter possibility enables spin-
the cross-shaped diffraction pattern was measured to be resolved detection by employing a Zeeman-sensitive and
6.9 μm. In order to resolve several diffraction orders in the narrow-line optical transition to a Rydberg state, which is
z direction, the atomic cloud with a 1=e-diameter of subsequently field ionized.
approximately 20 μm was repositioned several times dur- As a next step, we plan to use the 3D imaging
ing the measurement. capabilities of our apparatus in combination with near-
Figure 7(c) shows the experimental result as a function of threshold photoionization to create and study ultracold
the detector coordinates x and t, where, except for an offset, ionic impurities in a degenerate quantum gas [31,33].
t corresponds to the time of flight of the ions. As expected Using the same experimental tools, we also aim for the
from Eq. (1), the data exhibit a curvature, the asymmetry of observation of individual ion-atom collisions in the quan-
which we attribute to a displacement of the ionization tum regime [35].
region from the optical axis and to small mechanical
asymmetries within the ion optics. In a postprocessing
ACKNOWLEDGMENTS
step, we compensate for the temporal distortion by the
subtraction of a fitted fourth-order polynomial pðx; yÞ. We thank H. Rose for a valuable discussion and T.
By assuming equal x and z periods of the diffraction Dieterle, C. Tomschitz, and P. Kongkhambut for important
pattern, the distance-to-time conversion factor α can be contributions in the earlier stages of this work. We are further
estimated to be α ≈ 1.12 ns=μm, which is in indebted to our workshops for the manufacturing of the ion
011036-7C. VEIT et al. PHYS. REV. X 11, 011036 (2021)
microscope and the HV power supplies. We acknowledge APPENDIX B: PREPARATION OF THE
support from the Deutsche Forschungsgemeinschaft ATOMIC CLOUD
[Projects No. PF 381/13-1 and No. PF 381/17-1, the latter
Except for the 3D measurement, for which further
being part of the SPP 1929 (GiRyd)] and have received
information can be found in the main text, the following
funding from the QuantERA ERANET programme under
experimental details apply. Each experimental cycle started
the project “Theory-Blind Quantum Control—TheBlinQC.”
with the loading of approximately 4 × 10⁸ 87Rb atoms from
C. V. gratefully acknowledges support from the Carl Zeiss
an effusive oven into a magneto-optical trap (MOT). For
Foundation. F. M. is indebted to the Baden-Württemberg- this, a double-element Zeeman slower was employed,
Stiftung for financial support by the Eliteprogramm for which in the future will allow us to perform experiments
Postdocs, and O. A. H. S. and F. M. are indebted to the Carl with lithium [47]. The atoms were then optically trans-
Zeiss Foundation via IQST for support. ported along the x axis (Fig. 2) from the MOT chamber into
a separate science chamber, above which the ion micro-
scope is located. The transport was accomplished by the
APPENDIX A: TRAJECTORY SIMULATIONS use of a transport trap consisting of two 1064-nm laser
The imaging properties of the ion optics were simulated beams passing through a lens mounted on an air-bearing
by propagating test patterns through the electrostatic translation stage [48]. The beams crossed under a small
potential corresponding to a given electrode voltage angle of 2.3°, producing a transverse intensity profile with a
configuration. An example of the axial potential is shown 1=e2 waist of approximately 70 μm at the crossing point.
in Fig. 8. As the ions remain well separated under typical For the measurements performed at low magnifications
experimental conditions, no Coulomb repulsion was [Fig. 3(c)], we typically held 2 × 10⁶ to 3 × 10⁶ atoms at a
considered. For the simulations shown in Figs. 3(a) temperature on the order of 10 μK in the transport trap. For
and 7(a), two test patterns with a lateral line spacing of the experiments performed in an optical lattice, we ramped
L ¼ 100 nm and an extent of 10 μm along the optical axis down the power of the transport trap on a timescale of 1.5 s
were employed [see inset of Fig. 3(a) for the shape of the and ramped up the lattice within 100 ms. The latter was
patterns]. Each pattern consisted of 800 ions, given produced by a retroreflected 1064-nm laser beam oriented
an isotropic velocity distribution corresponding to an along the y axis (Fig. 2) and possessing a 1=e2 waist of
initial kinetic energy of kB × 10 μK. One of the patterns w1064 ≈ 110 μm. After the ramping process, the atoms were
was centered on the optical axis, whereas the other one solely held by the optical lattice potential with a depth of
was offset by a distance corresponding to 42.5% of the about 1100Er , where the recoil energy is defined as
FOV. Here, the FOV is defined as the detector diameter Er ¼ ℏ2 k2 =2m. Here, m corresponds to the atomic
divided by the magnification. For the displayed data mass, ℏ is the reduced Planck constant, and k is the wave
points, the line spacing is clearly resolved and the local vector of the lattice light. All experiments were performed
magnification extracted from the off-axis pattern differs in unpolarized samples with the atoms being pumped to the
by less than 5% from the on-axis case. The latter condition F ¼ 2 hyperfine state. Depending on the specific meas-
aims to ensure a low distortion of the imaging result. Since urement, a complete experimental cycle lasted between 10
the effects of mechanical asymmetries and voltage noise and 13 s.
are not captured by the simulations presented, no quanti-
tative prediction can be made for the resolution. APPENDIX C: PHOTOIONIZATION SEQUENCE
After the preparation of the atomic cloud, a
photoionization phase followed. For the measurements
performed in the continuous operation mode of the
microscope, the ionization sequence lasted 200 ms, during
which time the 780-nm laser was switched on continu-
ously. Because of technical reasons, the 479-nm laser was
pulsed with a duty cycle of 95% and a frequency of
50 kHz. For the pulsed measurements shown in Fig. 6, the
ionization sequence lasted 1.8 s and consisted of 6000
ionization cycles. In each cycle, a 1-μs-long photoioni-
zation pulse was followed by a variable wait time twait (see
FIG. 8. Example of the axial electrostatic potential. The curve
shown corresponds to an electrode voltage configuration main text) before the extraction field was pulsed on. In
of ½V R ; V E ; V 1 ; V 2 ; V 3 ; V D ¼ ½500; −500; −3200; −250; −110; order to minimize the effect of dark counts that occur at a
−2400 V. The shaded regions mark the position of the main typical rate of a few Hz, the detector was gated such as to
electrodes of the three lenses. The potential stays flat for the register only signals compatible with the employed
remaining distance to the detector, which is located at 1350 mm. ionization sequence. The number of detected ions per
011036-8PULSED ION MICROSCOPE TO PROBE QUANTUM GASES PHYS. REV. X 11, 011036 (2021)
experimental cycle (i.e., for one atomic cloud) depends APPENDIX E: DETERMINATION OF THE
on the specific measurement and typically ranges MAGNIFICATION
between a few tens and a few hundreds of ions. As an
For the measurements performed in an optical lattice [see
example, the measurement shown in Fig. 5(a) consists of
Fig. 3(b)], the FFT corresponding to the integrated lattice
18 400 ion counts, which were acquired over the course of
profile was fitted assuming a Gaussian shape of the first-
one hour.
and second-order peaks evoked by the periodicity of the
lattice. The magnification was then determined from
APPENDIX D: ION DETECTION the fitted peak positions and the known wavelength of the
lattice laser λlat ¼ ð1063.93 0.01Þ nm. Error bars were
The employed delay-line detector offers a spatial and determined by considering the conservative estimate of the
temporal resolution on the order of 100 μm and 200 ps, systematic error of λlat and the standard error of the fitted
respectively, and features a maximum continuous detection peak positions. For the characterization of small magnifi-
rate of 1 MHz with a multihit dead time on the order of 10 cations for which the lattice could not be resolved [see
to 20 ns [41]. For the pulsed operation mode, the time Fig. 3(c)], a spatial structure was induced into the 780-nm
resolution of the ion detection is not limited by the detector photoionization beam by passing the beam through a
but by the temporal jitter of the pulsed extraction and the double slit (slit separation and width of 3 mm and
voltage noise of the lens electrodes, which directly trans- 1 mm, respectively) before focusing the beam onto the
lates into a broadening of the time-of-flight distribution of atoms. To this end, an in-vacuum aspheric lens with an
the ions. From our experimental data, we determine a effective focal length of 26 mm was used. The described
typical time resolution on the order of a few nanoseconds setup resulted in an image of the far-field diffraction pattern
for drift-tube voltages of V D1 ¼ V D2 ¼ −2.4 kV. The time- of the double slit in the focal plane of the lens. The period
of-flight distribution of the measurement shown in of the diffraction pattern λdiff was measured at a known
Fig. 6(a), for example, possesses a full width at half magnification previously calibrated with the optical lattice.
maximum of approximately 4.5 ns. It is worth noting that In comparison with the measurements performed in an
the given time resolution applies to the detection of ionic optical lattice, the 479-nm beam was enlarged in the x
systems and, therefore, does not account for the ionization direction to w479x ≈ 100 μm and the 780-nm beam mea-
process itself. sured approximately w780x ≈ 2 μm at the position of the
The delay line is combined with two stacked MCPs with atoms. The magnification was extracted by fitting the
an active diameter slightly larger than 40 mm and an open- imaged diffraction pattern. Error bars were determined
area ratio (OAR) of 70% (F1217-01 MOD7, Hamamatsu). by considering the error of λdiff and the standard error of the
Since the detection efficiency η of MCPs is typically fitted pattern period. All error bars in Fig. 3 are significantly
limited to values close to the OAR [42], we plan to smaller than the marker size.
exchange the front MCP with a funnel-type model offering
an OAR of 90% [43]. In addition, we envision enhancing
the overall quantum efficiency to detect a single ion to APPENDIX F: DATA PROCESSING
higher than 99% using a Rydberg antiblockade effect (see The employed detector delivers a time stamp and a
Ref. [44] and references therein), which allows for the position for each detected ion. We compensated for minor
resonant laser excitation of Rydberg atoms on a shell distortions of the detector image in the y direction (Fig. 2)
around the ion. Because of the Stark effect of Rydberg by applying a spatially dependent shift to the detected y
atoms [39], this shell can have a radius on the order of position of all ions. The spatial distribution of this shift was
1 μm. As the extraction field of the ion microscope is found by using the regular density modulation of the atomic
pulsed on, the Rydberg atoms are field ionized, and the cloud in the optical lattice as a test pattern (Fig. 4). The
initially single ion is converted into n ions (typically local distortion could be interpolated from the discrepancy
n ¼ 2–6), such that the infidelity of the detection is between the observed lattice phase and the phase expected
reduced to ð1 − ηÞn . Since the timescale for the Rydberg for an ideal lattice structure [Fig. 4(d)]. We checked that the
excitation can be very fast (around 10 to 100 ns), the influence of wave-front aberrations of the lattice beams is
proposed scheme can be repeated several times in a single small by shifting the image along the x direction of the
atomic cloud. The secondary ions responsible for the detector using the electrostatic deflector after the third lens
described preamplification process share, on average, a (Fig. 2). At least partly, we attribute the observed dis-
common center of gravity with the initial ion. However, tortions to nonlinearities of the detector.
depending on the amplification protocol, a small position The global phase Φg of the detected lattice pattern [see
noise, as well as a loss of temporal resolution, is introduced. Fig. 4(c) for a specific measurement] is determined by the
For the specific application, a trade-off between spatial phase of the retroreflected optical lattice and thus depends
resolution, time resolution, and quantum efficiency needs on the relative phase between the two counter-propagating
to be found. lattice beams. Therefore, Φg is susceptible to a thermally
011036-9C. VEIT et al. PHYS. REV. X 11, 011036 (2021)
caused position drift of the retroreflecting mirror. To 70 μs. The compensation voltages were adjusted such as to
compensate for this effect, we sorted the detection events minimize the displacement of the detected ion distribution
into groups of 100 consecutively detected ions and calcu- as the observation time was increased. For the field
lated the FFT corresponding to the integrated lattice profile component along the optical axis, the time-of-flight infor-
for each of the groups. We then extracted the global mation from the ion detection was employed. From the
phase of the lattice from the complex amplitude of the observed spread of the ion cloud, the typical magnitude of
first-order FFT peak and corrected for the drift accordingly. residual fields in the transverse direction can be quantified
Subsequently, the data were binned with a bin size of to be on the order of 100 μV=cm over a spherical volume
100 μm. with a diameter of 10 μm.
For measurements for which the magnitudes of the FFT
peaks were extracted, we determined a statistical error of
these by considering again groups of 100 consecutively
detected ions. For each of the groups, the complex
amplitudes of the first- and second-order FFT peaks were [1] N. N. Das Gupta and S. K. Ghosh, A Report on the Wilson
determined. An estimate for the error of the peak magni- Cloud Chamber and Its Applications in Physics, Rev. Mod.
tudes was then found by dividing the standard deviation of Phys. 18, 225 (1946).
pffiffiffiffiffi [2] H. Geiger and E. Marsden, The Laws of Deflexion of α
the amplitudes by ng, where ng is the number of groups.
Particles through Large Angles, Philos. Mag. 25, 604
(1913).
APPENDIX G: PULSED OPERATION MODE [3] E. Rutherford, The Scattering of α and β Particles by Matter
The measurements shown in Fig. 6 were acquired using and the Structure of the Atom, Philos. Mag. 21, 669 (1911).
the following electrode voltages: ½V R ; V E ;V 1 ;V 2 ;V 3 ;V D ¼ [4] E. W. Müller and K. Bahadur, Field Ionization of Gases at a
½400; −400; −2800; −200; −110; −2400 V. For the pulsed Metal Surface and the Resolution of the Field Ion Micro-
measurements shown in Fig. 6(b), the magnitude of the scope, Phys. Rev. 102, 624 (1956).
[5] J. C. Bergquist, R. G. Hulet, W. M. Itano, and D. J.
first-order FFT peak decreased with increasing twait . In
Wineland, Observation of Quantum Jumps in a Single
order to still accurately compensate for the thermal drift of Atom, Phys. Rev. Lett. 57, 1699 (1986).
the lattice, a measurement for twait ¼ 0 μs was performed in [6] T. Sauter, W. Neuhauser, R. Blatt, and P. E. Toschek,
every second experiment cycle. The thermal drift of the Observation of Quantum Jumps, Phys. Rev. Lett. 57,
lattice was then deduced only from these additional 1696 (1986).
measurements and corrected for according to the procedure [7] M. Schellekens, R. Hoppeler, A. Perrin, J. V. Gomes, D.
detailed in the previous paragraph. Boiron, A. Aspect, and C. I. Westbrook, Hanbury Brown
Twiss Effect for Ultracold Quantum Gases, Science 310,
APPENDIX H: APPROXIMATION OF THE 648 (2005).
SINGLE-SITE WAVE FUNCTION [8] T. Jeltes, J. M. McNamara, W. Hogervorst, W. Vassen, V.
Krachmalnicoff, M. Schellekens, A. Perrin, H. Chang, D.
For atoms occupying the lowest energy band of our deep Boiron, A. Aspect, and C. I. Westbrook, Comparison of the
optical lattice, we approximate the single-site wave func- Hanbury Brown-Twiss Effect for Bosons and Fermions,
tion by a ground-state harmonic oscillator wave function. Nature (London) 445, 402 (2007).
To this end, we consider the Taylor expansion of the lattice [9] T. Gericke, P. Würtz, D. Reitz, T. Langen, and H. Ott, High-
potential around an energy minimum VðxÞ ≈ V 0 k2 x2 and Resolution Scanning Electron Microscopy of an Ultracold
find the probability density of the lowest harmonic oscil- Quantum Gas, Nat. Phys. 4, 949 (2008).
lator state to be [10] H. Ott, Single Atom Detection in Ultracold Quantum Gases:
A Review of Current Progress, Rep. Prog. Phys. 79, 054401
pffiffiffiffiffiffiffiffiffiffiffiffi (2016).
ð2mV 0 k2 Þ1=4 2mV 0 k 2
jψðxÞj2 ¼ exp − x : ðH1Þ [11] W. S. Bakr, J. I. Gillen, A. Peng, S. Fölling, and M. Greiner,
ðπℏÞ1=2 ℏ A Quantum Gas Microscope for Detecting Single Atoms in a
Hubbard-Regime Optical Lattice, Nature (London) 462, 74
Here, V 0 is the depth of the lattice potential, m is the atomic (2009).
mass, and k is the wave vector of the 1064-nm lattice light. [12] C. Gross and I. Bloch, Quantum Simulations with Ultracold
Atoms in Optical Lattices, Science 357, 995 (2017).
APPENDIX I: COMPENSATION OF STRAY [13] W. S. Bakr, A. Peng, M. E. Tai, R. Ma, J. Simon, J. I. Gillen,
ELECTRIC FIELDS S. Fölling, L. Pollet, and M. Greiner, Probing the Super-
fluid–to–Mott Insulator Transition at the Single-Atom Level,
For the pulsed measurements presented in Fig. 6, stray Science 329, 547 (2010).
electric fields within the ionization volume were compen- [14] J. F. Sherson, C. Weitenberg, M. Endres, M. Cheneau, I.
sated by applying suitable voltages to the six compensation Bloch, and S. Kuhr, Single-Atom-Resolved Fluorescence
electrodes. In order to calibrate these voltages on the order Imaging of an Atomic Mott Insulator, Nature (London) 467,
of a few tens of millivolts, free ions were observed for up to 68 (2010).
011036-10PULSED ION MICROSCOPE TO PROBE QUANTUM GASES PHYS. REV. X 11, 011036 (2021)
[15] A. Mazurenko, C. S. Chiu, G. Ji, M. F. Parsons, M. Kanász- Immersed in a Bose-Einstein Condensate, Phys. Rev. Lett.
Nagy, R. Schmidt, F. Grusdt, E. Demler, D. Greif, and M. 126, 033401 (2021).
Greiner, A Cold-Atom Fermi–Hubbard Antiferromagnet, [33] G. E. Astrakharchik, L. A. Peña Ardila, R. Schmidt, K.
Nature (London) 545, 462 (2017). Jachymski, and A. Negretti, Ionic Polaron in a Bose-
[16] M. A. Nichols, L. W. Cheuk, M. Okan, T. R. Hartke, E. Einstein Condensate, arXiv:2005.12033.
Mendez, T. Senthil, E. Khatami, H. Zhang, and M. W. [34] T. Feldker, H. Fürst, H. Hirzler, N. V. Ewald, M. Mazzanti,
Zwierlein, Spin Transport in a Mott Insulator of Ultracold D. Wiater, M. Tomza, and R. Gerritsma, Buffer Gas Cooling
Fermions, Science 363, 383 (2019). of a Trapped Ion to the Quantum Regime, Nat. Phys. 16,
[17] K. D. Nelson, X. Li, and D. S. Weiss, Imaging Single Atoms 413 (2020).
in a Three-Dimensional Array, Nat. Phys. 3, 556 (2007). [35] T. Schmid, C. Veit, N. Zuber, R. Löw, T. Pfau, M. Tarana,
[18] D. Barredo, V. Lienhard, S. de Léséleuc, T. Lahaye, and A. and M. Tomza, Rydberg Molecules for Ion-Atom Scattering
Browaeys, Synthetic Three-Dimensional Atomic Structures in the Ultracold Regime, Phys. Rev. Lett. 120, 153401
Assembled Atom by Atom, Nature (London) 561, 79 (2018). (2018).
[19] M. McDonald, J. Trisnadi, K.-X. Yao, and C. Chin, Super- [36] P. Schauß, M. Cheneau, M. Endres, T. Fukuhara, S. Hild,
resolution Microscopy of Cold Atoms in an Optical Lattice, A. Omran, T. Pohl, C. Gross, S. Kuhr, and I. Bloch,
Phys. Rev. X 9, 021001 (2019). Observation of Spatially Ordered Structures in a Two-
[20] S. Subhankar, Y. Wang, T.-C. Tsui, S. L. Rolston, and J. V. Dimensional Rydberg Gas, Nature (London) 491, 87 (2012).
Porto, Nanoscale Atomic Density Microscopy, Phys. Rev. X [37] K. Riechers, K. Hueck, N. Luick, T. Lompe, and H. Moritz,
9, 021002 (2019). Detecting Friedel Oscillations in Ultracold Fermi Gases,
[21] H. Nguyen, X. Fléchard, R. Brédy, H. A. Camp, and B. D. Eur. Phys. J. D 71, 232 (2017).
DePaola, Recoil Ion Momentum Spectroscopy Using [38] M. Szilagyi, Electron and Ion Optics (Plenum Press,
Magneto-Optically Trapped Atoms, Rev. Sci. Instrum. 75, New York, 1988).
2638 (2004). [39] R. Löw, H. Weimer, J. Nipper, J. B. Balewski, B. Butscher,
[22] B. D. DePaola, R. Morgenstern, and N. Andersen, H. P. Büchler, and T. Pfau, An Experimental and Theoretical
MOTRIMS: Magneto–Optical Trap Recoil Ion Momentum Guide to Strongly Interacting Rydberg Gases, J. Phys. B 45,
Spectroscopy, Adv. At. Mol. Opt. Phys. 55, 139 (2008). 113001 (2012).
[23] M. Stecker, H. Schefzyk, J. Fortágh, and A. Günther, A High [40] O. Jagutzki, V. Mergel, K. Ullmann-Pfleger, L. Spielberger,
U. Spillmann, R. Dörner, and H. Schmidt-Böcking, A
Resolution Ion Microscope for Cold Atoms, New J. Phys.
Broad-Application Microchannel-Plate Detector System
19, 043020 (2017).
for Advanced Particle or Photon Detection Tasks: Large
[24] R. M. W. van Bijnen, C. Ravensbergen, D. J. Bakker, G. J.
Area Imaging, Precise Multi-hit Timing Information and
Dijk, S. J. J. M. F. Kokkelmans, and E. J. D. Vredenbregt,
High Detection Rate, Nucl. Instrum. Methods Phys. Res.
Patterned Rydberg Excitation and Ionization with a Spatial
477, 244 (2002).
Light Modulator, New J. Phys. 17, 023045 (2015).
[41] DLD40EP, RoentDek.
[25] A. Schwarzkopf, R. E. Sapiro, and G. Raithel, Imaging
[42] J. Oberheide, P. Wilhelms, and M. Zimmer, New Results on
Spatial Correlations of Rydberg Excitations in Cold Atom
the Absolute Ion Detection Efficiencies of a Microchannel
Clouds, Phys. Rev. Lett. 107, 103001 (2011).
Plate, Meas. Sci. Technol. 8, 351 (1997).
[26] A. Schwarzkopf, D. A. Anderson, N. Thaicharoen, and G.
[43] K. Fehre, D. Trojanowskaja, J. Gatzke, M. Kunitski,
Raithel, Spatial Correlations between Rydberg Atoms in an F. Trinter, S. Zeller, L. P. H. Schmidt, J. Stohner, R. Berger,
Optical Dipole Trap, Phys. Rev. A 88, 061406(R) (2013). A. Czasch, O. Jagutzki, T. Jahnke, R. Dörner, and M. S.
[27] D. P. Fahey, T. J. Carroll, and M. W. Noel, Imaging the Schöffler, Absolute Ion Detection Efficiencies of Micro-
Dipole-Dipole Energy Exchange between Ultracold channel Plates and Funnel Microchannel Plates for Multi-
Rubidium Rydberg Atoms, Phys. Rev. A 91, 062702 (2015). coincidence Detection, Rev. Sci. Instrum. 89, 045112
[28] M. Stecker, R. Nold, L.-M. Steinert, J. Grimmel, D. (2018).
Petrosyan, J. Fortágh, and A. Günther, Controlling the [44] A. Urvoy, F. Ripka, I. Lesanovsky, D. Booth, J. P. Shaffer, T.
Dipole Blockade and Ionization Rate of Rydberg Atoms Pfau, and R. Löw, Strongly Correlated Growth of Rydberg
in Strong Electric Fields, Phys. Rev. Lett. 125, 103602 Aggregates in a Vapor Cell, Phys. Rev. Lett. 114, 203002
(2020). (2015).
[29] T. Schmid, Rydberg Molecules for Ultracold Ion-Atom [45] SIMION 8.1.1.32, Scientific Instrument Services.
Scattering, Ph.D. thesis, Universität Stuttgart, 2019. [46] J. R. Abo-Shaeer, C. Raman, J. M. Vogels, and W. Ketterle,
[30] F. Engel, T. Dieterle, T. Schmid, C. Tomschitz, C. Veit, Observation of Vortex Lattices in Bose-Einstein Conden-
N. Zuber, R. Löw, T. Pfau, and F. Meinert, Observation of sates, Science 292, 476 (2001).
Rydberg Blockade Induced by a Single Ion, Phys. Rev. Lett. [47] G. E. Marti, R. Olf, E. Vogt, A. Öttl, and D. M. Stamper-
121, 193401 (2018). Kurn, Two-Element Zeeman Slower for Rubidium and
[31] M. Tomza, K. Jachymski, R. Gerritsma, A. Negretti, T. Lithium, Phys. Rev. A 81, 043424 (2010).
Calarco, Z. Idziaszek, and P. S. Julienne, Cold Hybrid Ion- [48] C. Gross, H. C. J. Gan, and K. Dieckmann, All-Optical
Atom Systems, Rev. Mod. Phys. 91, 035001 (2019). Production and Transport of a Large 6Li Quantum Gas in a
[32] T. Dieterle, M. Berngruber, C. Hölzl, R. Löw, K. Jachymski, Crossed Optical Dipole Trap, Phys. Rev. A 93, 053424
T. Pfau, and F. Meinert, Transport of a Single Cold Ion (2016).
011036-11You can also read