Review on Recent Progress in Nitrogen-Doped Graphene: Synthesis, Characterization, and Its Potential Applications
←
→
Page content transcription
If your browser does not render page correctly, please read the page content below
Review

                                                                                                                              pubs.acs.org/acscatalysis

Review on Recent Progress in Nitrogen-Doped Graphene: Synthesis,
Characterization, and Its Potential Applications
Haibo Wang, Thandavarayan Maiyalagan, and Xin Wang*
School of Chemical and Biomedical Engineering, Nanyang Technological University, 62 Nanyang Drive, Singapore, 637459

  ABSTRACT: Nitrogen doping has been an effective way to
  tailor the properties of graphene and render its potential use
  for various applications. Three common bonding config-
  urations are normally obtained when doping nitrogen into the
  graphene: pyridinic N, pyrrolic N, and graphitic N. This paper
  reviews nitrogen-doped graphene, including various synthesis
  methods to introduce N doping and various characterization
  techniques for the examination of various N bonding
  configurations. Potential applications of N-graphene are also
  reviewed on the basis of experimental and theoretical studies.
  KEYWORDS: graphene, nitrogen doping, electrocatalysis, field-effect transistor, energy storage

1. INTRODUCTION                                                           lattice, including quaternary N (or graphitic N), pyridinic N,
Graphene is a novel nanomaterial with a single sheet of carbon            and pyrrolic N (Figure 1). Specifically, pyridinic N bonds with
atoms packed in a hexagonal lattice. Since the first report of its
synthesis via a “Scotch tape” method in 2004,1 graphene has
emerged as one of the most active research fields. The
fascinating properties of graphene, such as high surface area
(2630 m2/g),2 high thermal conductivity (∼5000 W/mK),3 fast
charged carrier mobility (∼200 000 cm2 V−1 s−1)3 and strong
Young’s modulus (∼1 TPa),4 have been well documented.
Various morphologies have also been obtained, including two-              Figure 1. Bonding configurations for nitrogen atoms in N-graphene.24
dimensional graphene nanosheets (GNSs), one-dimensional
graphene nanoribbons (GNRs),5−7 and zero-dimensional                      two C atoms at the edges or defects of graphene and
graphene quantum dots (GQDs).8,9 The properties of GNRs                   contributes one p electron to the π system. Pyrrolic N refers to
and GQDs can be tuned by their size and edges. For instance,              N atoms that contribute two p electrons to the π system,
GNRs with width narrower than 10 nm showed obvious                        although unnecessarily bond into the five-membered ring, as in
semiconducting characteristics, but GNRs with width larger                pyrrole.19,20 Quaternary N refers to N atoms that substitute for
than 10 nm exhibited very weak gate dependence.10 The                     C atoms in the hexagonal ring. Among these nitrogen types,
increased concentration of a zigzag edge tended to decrease its           pyridinic N and quaternary N are sp2 hybridized and pyrrolic N
band gap.9 All these aspects make graphene material promising             is sp3 hybridized. Apart from these three common nitrogen
for various applications, including energy conversion and                 types, N oxides of pyridinic N have been observed in both the
storage, electrocatalysis, sensors and electronics.                       N-graphene and N-CNT studies.21−23 In this configuration, the
   Other than morphology control, chemical doping is another              nitrogen atom bonds with two carbon atoms and one oxygen
important approach to tailor the property of graphene, which              atom.
has been proved effective in the doping of carbon nanotubes                   The N-graphene shows different properties compared with
(CNTs) and greatly broadened their applications.11−15 Usually,            the pristine graphene. For instance, the spin density and charge
there are two means to chemically dope graphene: (1) the                  distribution of carbon atoms will be influenced by the neighbor
adsorption of gas,16 metal,17 or organic molecules18 to the               nitrogen dopants,25,26 which induces the “activation region” on
graphene surface and (2) substitutional doping, which                     the graphene surface. This kind of activated region can
introduces heteroatoms, such as nitrogen atoms and boron                  participate in catalytic reactions directly, such as the oxygen
atoms, into the carbon lattice of graphene. Both of these
methods can modulate the electronic properties of graphene. In
                                                                          Special Issue: Electrocatalysis
this paper, our focus will be constrained to the topic of
nitrogen-doped graphene (N-graphene).                                     Received: December 12, 2011
   When a nitrogen atom is doped into graphene, it usually has            Revised: February 23, 2012
three common bonding configurations within the carbon                      Published: March 16, 2012

                             © 2012 American Chemical Society       781                             dx.doi.org/10.1021/cs200652y | ACS Catal. 2012, 2, 781−794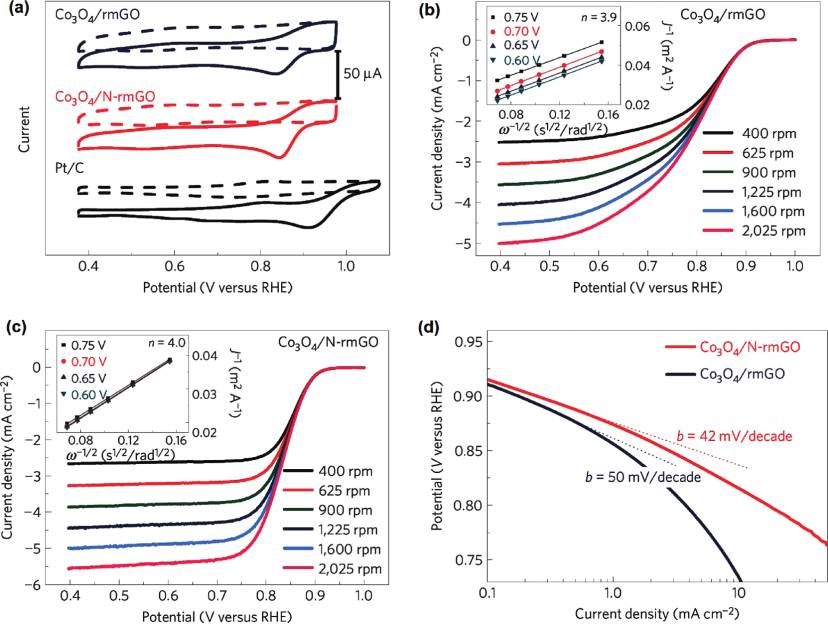
ACS Catalysis Review
Table 1. Nitrogen-Doping Methods and Nitrogen Concentration on Graphene
synthesis application/
no. method precursors N content, at. % reference
1 CVD Cu film on Si substrate as catalyst, CH4/NH3 1.2−8.9 FET30
2 CVD Cu foil as catalyst, NH3/He 1.6−16 ORR40
3 CVD Ni film on SiO2/Si substrate as catalyst, NH3/CH4/H2/Ar (10:50:65:200) 4 ORR41
4 CVD Cu foil as catalyst, acetonitrile ∼9 lithium battery43
5 CVD Cu foil as catalyst, pyridine ∼2.4 FET44
6 segregation carbon-contained Ni layer on nitrogen-contained boron layer 0.3−2.9 FET50
growth
7 solvothermal Li3N/CCl4 (NG1) or N3C3Cl3/Li3N/CCl4 (NG2) 4.5 (NG1) or 16.4 (NG2) ORR52
8 arc discharge graphite/H2/He/pyridine (NG1) graphite/H2/He/NH3 (NG2) transformation of 0.6 (NG1), 1 (NG2), 1.4 56, 57
nanodiamond/He/pyridine (NG3) (NG3)
9 thermal N+ ion-irradiated graphene, NH3 1.1 FET59
treatment
10 thermal graphite oxide after thermal expansion, NH3/Ar 2.0−2.8 ORR60
treatment
11 thermal GNR, NH3 FET31
treatment
12 thermal GO, NH3/Ar (10% NH3) ∼3−5 FET63
treatment
13 thermal GO, NH3 6.7−10.78 methanol
treatment oxidation73
14 thermal GO, melamine 7.1−10.1 ORR62
treatment
15 plasma graphite oxide after thermal expansion, N2 plasma 8.5 ORR23
treatment
16 plasma graphite oxide after thermal expansion, N2 plasma 3 ORR67
treatment
17 plasma chemically synthesized graphene, N2 plasma ∼1.3 biosensors68
treatment
18 plasma GO, treat with H2 plasma first, then treat with N2 plasma 1.68−2.51 ultracapacitor69
treatment
19 plasma mechanically exfoliated graphene or bilayer graphene grown by CVD, NH3 plasma FET70
treatment
20 N2H4 GO, N2H4, NH3 4.01−5.21 71
treatment
21 N2H4 graphite oxide after thermal expansion, N2H4 1.04 electrochemical
treatment sensor72
reduction reaction (ORR), or anchor the metal nanoparticles have the potential to create a homogeneous doping throughout
used in the catalytic reaction. Moreover, after nitrogen doping the bulk material, the results reported so far fail to indicate so.
in the monolayer graphene, the Fermi level shifts above the Specifically, direct synthesis includes chemical vapor deposition
Dirac point,27,28 and the density of state near the Fermi level is (CVD), segregation growth, solvothermal, and arc-discharge
suppressed;29,30 thus, the band gap between the conduction approaches. Post treatment includes thermal treatment, plasma
band and the valence band will be opened. For GNRs, the band treatment, and N2H4 treatment. Table 1 gives a summary of
gap is still kept after doping.31 The band gap in N-graphene various methods used for the synthesis of N-graphene. Detailed
makes it a candidate to be used in semiconductor devices. Apart discussion on these methods is elaborated below.
from these, N-graphene can also be used in batteries, sensors, 2.1. Direct Synthesis. 2.1.1. CVD Approach. CVD is a
and ultracapacitors. The nitrogen doping of graphene greatly widely used method to synthesize various carbon nanomateri-
broadens its applications. als, such as graphene,36 CNTs,37 carbon nanofibers,38 and N-
Previously, several reviews on graphene have mentioned N- doped CNTs.39 Recently, it was successfully applied to prepare
graphene,32−35 especially the review of Liu et al.,35 which N-graphene. Typically,30,40,41 a metal catalyst (Cu or Ni) is
focused on two chemical doping approaches and band gap used as the substrate, then at high temperature, a carbon source
tuning; however, there is still no systematical study of N- gas mixed with a nitrogen-containing gas is introduced. These
graphene synthesized by substitutional doping. Therefore, in precursors dissociate and recombine into N-graphene by means
this review, we summarize different synthesis and character- of precipitation on the surface of the catalyst.30,42
ization methods of nitrogen-substituted graphene; the Apart from the gas mixture, liquid organic precursors
application of N-graphene is also reviewed on the basis of (acetonitrile, pyridine) have also been used to form N-
experimental and theoretical studies. graphene.43,44 Theoretical study about different precursors45
shows that proper skeletal bonds of liquid precursors are crucial
for the formation of N-graphene. Acrylonitrile containing the
2. SYNTHESIS OF N-GRAPHENE C−C single bond, CC double bond, and CN triple bond
Similar to the synthesis of N-CNT, N-graphene can be cannot form N-graphene, but pyridine with only the double
obtained through two different ways: direct synthesis and bond forms N-graphene. The proposed reason is that the single
post treatment. Most postsynthesis treatments may lead to bond is easy to break, even at low temperature, leaving CC
surface doping only. Although in principle, direct synthesis may and CN bonds at the catalyst surface. Then CN bond is
782 dx.doi.org/10.1021/cs200652y | ACS Catal. 2012, 2, 781−794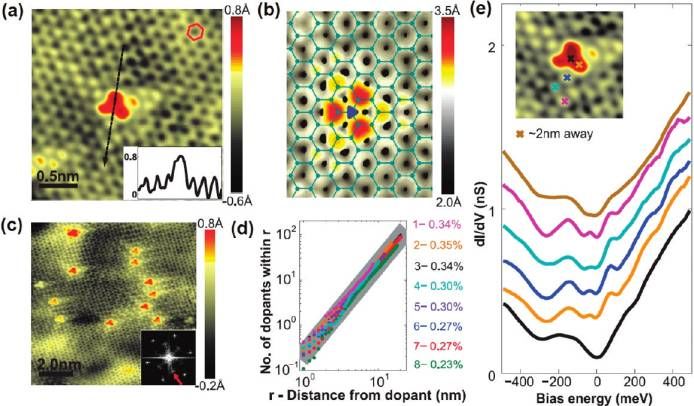
ACS Catalysis Review
Figure 2. Schematic illustration of the segregation technique for growing N-doped graphene.50
preferentially removed from the surface by forming volatile 2.1.3. Solvothermal Approach. The solvothermal approach
molecules when the temperature is higher than 400 °C; thus, was first employed for gram-scale production of graphene.51
only CC will be left to form nondoped graphene above 500 Recently, gram-scale production of N-graphene has been
°C. In contrast, the skeletal bonds in pyridine have similar bond achieved by applying this approach at ∼300 °C. By mixing
energies, which induces the formation of N-graphene. lithium nitride (Li3N) with tetrachloromethane (CCl4) (Figure
The layer distribution of N-graphene is varied in different 3) or cyanuric chloride (N3C3Cl3) with Li3N and CCl4, N-
studies. Although the N-graphene synthesized from the gas
mixture C2H4/NH3 is claimed to be monolayer through the
analysis of Raman spectroscopy,40 N-graphene synthesized
from a gas mixture, CH4/NH3,30,41 shows that the few-layer
graphene is predominant after high-resolution transmission
electron microscope (HRTEM) characterization. In other
studies, monolayer N-graphene is also obtained when
acetonitrile43 or pyridine44 is used as precursors. Furthermore, Figure 3. Schematic illustration for N-graphene synthesized from the
the layer of N-graphene can be adjusted by the flowing time if reaction of CCl4 and Li3N.52
acetonitrile is used as the precursor.43
In the CVD approach, the nitrogen content can be controlled graphene with different nitrogen contents was obtained
by changing the flow rate40 and the ratio between carbon (denoted as NG1 and NG2, respectively).52 The HRTEM
source and nitrogen source.30 It has been reported30 that the images of N-graphene show that it mainly consists of 1−6 layer
doping level decreased from 8.9 to 3.2 or 1.2 at. % if the NH3/ graphene. Because of the introduction of N3C3Cl3, NG2 has a
CH4 ratio was lowered from 1:1 to 1:2 or 1:4, respectively. higher nitrogen content (16.4 at. %) compared with NG1(4.5
Moreover, although high nitrogen content (∼16 at. %) has at. %). The proportion of doped nitrogen species also changes
been reported,40 the nitrogen content in this method is with different reactant mixtures. The quaternary N dominates
normally around 4−9 at. %. in NG1, and pyridinic and pyrrolic N dominates in NG2.
The bonding configuration of nitrogen within N-graphene 2.1.4. Arc-Discharge Approach. An arc-discharge approach
varies with different studies. By using Cu as the catalyst and has been applied to obtain CNTs and doped CNTs by
CH4/NH3 (1:1) as the precursor, the nitrogen type in N- evaporating the carbon source, normally graphite,53−55 at high
graphene is mainly quaternary N;30 however, when Ni is used temperature. Rao et al.56,57 successfully obtained N-graphene
as the catalyst and CH4/NH3 (5:1) is used as the precursor, the by applying this method in the presence of pyridine vapor or
obtained N-graphene consists of mainly pyridinic N and NH3. The N-graphene synthesized from transformation of
pyrrolic N.41 If C2H4/NH3 is used as the precursor while nanodiamond shows higher nitrogen content than that
synthesized from graphite. The nitrogen content of the as-
keeping Cu as the catalyst, the pyridinic N becomes the
synthesized N-graphene is around 0.5−1.5 at. %. Moreover,
predominant type.40 Notably, the syntheses of other nitrogen-
although single layer N-graphene is occasionally observed, most
doped carbon materials have revealed that the doping
of the N-graphene possesses two or three layers. The scale of
environment is also influenced by the flow rate, catalyst, and
graphene and N-graphene produced by this method normally is
growth temperature,46−49 so further research is required to below 1 μm.56,58
clarify the relationship between the bonding configuration of 2.2. Postsynthesis Treatment. 2.2.1. Thermal Treat-
nitrogen and the parameters of CVD. ment. Thermal treatment refers to the method using high
2.1.2. Segregation Growth Approach. In this approach, a temperature to produce N-graphene. It has been shown that
nitrogen-containing boron layers and carbon-containing nickel heating graphene in NH3 at high temperature (≥800 °C) can
layers are sequentially deposited on the SiO2/Si substrate by produce N-graphene.59,60 Electrical annealing, which produces
electron beam evaporation, then during the vacuum annealing high temperature, has also been applied to obtain N-GNRs.31
process, the boron atoms are trapped by nickel, and the carbon The nitrogen content in the N-graphene synthesized by this
atoms will segregate out onto the nickel surface and combine to method is relatively low. Guo et al.59 obtained N-graphene with
form N-graphene (Figure 2).50 Although sporadic multilayer 1.1 at. % doping level at 1100 °C; Geng et al.60 reported that
areas are observed, the N-graphene generally shows a large- the highest nitrogen content was 2.8 at. % at 800 and 900 °C.
scale, uniform, and few-layer structure. The nitrogen content The low doping level may be attributed to two reasons: one is
(0.3−2.9 at. %) can be controlled by adjusting the thickness of the insufficient defect number in the high quality graphene, and
the boron and nickel films. The pyridinic and pyrrolic N are the other is the high annealing temperature, which will break
dominant in N-graphene. Interestingly, the graphene can be the C−N bonds in N-graphene.61 Moreover, the nitrogen
doped in a specific area by embedding nitrogen species into the doping is more likely to occur at the defects and edge of
selective area of the substrate. graphene in the thermal treatment method. Geng et al.60 found
783 dx.doi.org/10.1021/cs200652y | ACS Catal. 2012, 2, 781−794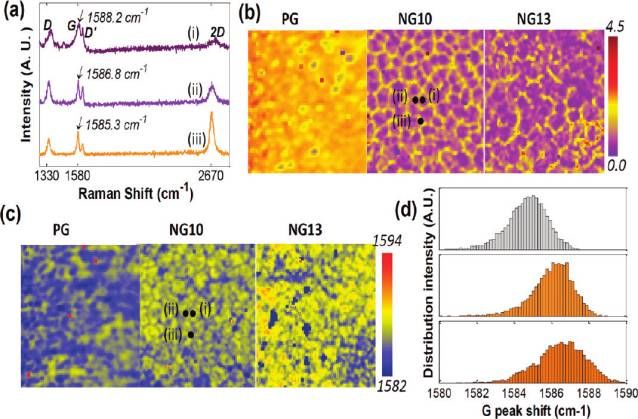
ACS Catalysis Review
pyridinic and pyrrolic N dominated in the N-graphene. Wang temperature is 80 °C; however, the absorbed N2H4 takes a non-
et al.31 claimed that nitrogen atoms preferred functionalizing negligible proportion in the total nitrogen content. If the
the edge of GNRs. Interestingly, unlike NH3, annealing N+ ion reaction temperature rises to 160 °C or higher, the N2H4 will
irradiated graphene in N2 at high temperature cannot introduce be desorbed and the nitrogen content decreases to ∼4 at. %.
nitrogen into the graphene,59 which suggests that the inertness Interestingly, the morphology of N-graphene also changes with
of N2 makes it difficult to react with the reactive carbon atoms the temperature. The relative flat N-graphene is generated if
on the defect sites in graphene. GO is reduced at low temperature (≤120 °C), whereas the
Apart from graphene, graphene oxide can also be used to obvious agglomeration in N-graphene will occur if the
synthesize N-graphene by thermal treatment in the presence of temperature is higher.
various nitrogen precursors. Sheng et al.62 reported that By using ultrasonication,72 N-graphene can be synthesized
annealing GO in the presence of melamine at high temperature from graphene in the presence of N2H4. The agglomerated
(700−1000 °C) could produce N-graphene. The layer regions are also observed after doping. The nitrogen content is
distribution of N-graphene depends on the synthesis procedure. around 1 at. %. In addition to these, the nitrogen species in the
Few-layer N-graphene is obtained if annealing the mixture of N-graphene contains only pyridinic and pyrrolic nitrogen. The
GO and melamine at high temperature, and single layer N- content and bonding configuration of nitrogen indicates the
graphene can be produced if heating single-layer GO covered nitrogen atoms can be introduced only to the graphene edges
with melamine. The nitrogen content is affected by both the and defects in this method.
temperature and the mass ratio between GO and melamine.
The largest nitrogen content (10.1 at. %) is obtained under 700 3. CHARACTERIZATION TECHNIQUES FOR STUDYING
°C when the mass ratio of GO to melamine is 0.2. Li et al.63 NITROGEN-DOPED GRAPHENE
showed that placing GO in an NH3 atmosphere through 3.1. X-ray Photoelectron Spectroscopy (XPS) Techni-
thermal annealing (500 °C) could reduce GO and get N- que. XPS is the standard technique to study the nitrogen-
graphene with a 5 at. % nitrogen doping level. Notably, both of doping effect in graphene. In the XPS spectrum of N-graphene,
these works report that the temperature has the major influence the peaks appearing at about 400 and 284 eV correspond to the
on the nitrogen content of N-graphene. Li et al.63 ascribed the N1s and C1s, respectively. The ratio of peak intensity between
reason to the decreased content of oxygen functional groups at N1s and C1s is used to determine the nitrogen content in N-
higher temperature. Because these oxygen functional groups are graphene. Moreover, the N1s spectrum is used to determine
responsible for the formation of a C−N bond, the reactivity the nitrogen configurations. In the research about N-graphene,
between GO and nitrogen atoms will decrease after these the N1s spectrum usually can be deconvoluted to several
groups decompose at higher temperature, resulting in the lower individual peaks that are assigned to pyridinic N (398.1−399.3
nitrogen content. Moreover, it has been claimed that lowering eV), pyrrolic N (399.8−401.2 eV), and quaternary N (401.1−
the mass ratio between GO and melamine at 800 °C induced 402.7 eV) (Figure 4). The peak position of these nitrogen types
higher nitrogen doping level, which may suggest the
competitive doping between oxygen and melamine.62
2.2.2. Plasma Treatment. When carbon material is placed in
the nitrogen plasma atmosphere, carbon atoms will be partly
replaced by nitrogen atoms; therefore, this method was applied
to synthesize N-CNTs.64−66 Recently, it has been reported that
N-graphene could be prepared from graphene23,67,68 or GO69
by exposing it to the nitrogen plasma. NH3 plasma has also
been used to obtain N-graphene from mechanically exfoliated
graphene .70 The nitrogen content, which can be controlled by
the plasma strength and exposure time, varies from 3 to 8.5 at.
% in different works. During the plasma exposure process, Figure 4. High-resolution N1s XPS spectra of graphene and N-
defects and oxygen-containing groups are created.23,68 Shao et graphene. N1 represents pyridinic N, N2 represents pyrrolic N, N3
al.23 showed that graphene contains 3.5 at. % oxygen species represents quaternary N, and N4 represents the N oxides of pyridinic
while the N-graphene contains 8.6 at. % oxygen species, Wang N.23
et al.68 reported that the content of oxygen species increased
from about 15 to 26−28 at. % after doping. These results varies in a relatively wide range in different studies. Reddy et
indicate the plasma treatment introduces a significant amount al.43 reported the pyrrolic N appeared at 401.2 eV, whereas Li
of oxygen species into graphene. The reason may be ascribed to et al.63 showed the quaternary N appeared at about 401.1 eV.
the reactive carbon atoms at the edge of defects that are created The large difference of the peak positions of nitrogen
by the plasma treatment.23 Notably, in the N2 plasma configurations may be due to the different environments of
treatment, overexposure may decrease the electrocatalytic nitrogen.19 The charge of nitrogen and its neighbor atoms and
activity of N-graphene.68 It has been reported that if graphene the electron redistribution after ionization will all influence the
was exposed to the N2 plasma over 40 min, the reduction precise position of different nitrogen types. Apart from these
current of H2O2 would decrease because of the destruction and three nitrogen types, peak corresponding to N-oxides of
split of the graphene plane. pyridinic N is observed at ∼402.8 eV in several studies.23,62
2.2.3. Hydrazine Hydrate (N2H4) Treatment. Using When nitrogen atoms are doped into graphene, peaks at the
hydrazine hydrate to prepare graphene from GO is a widely C1s spectrum will change accordingly.50,62,63,70,71 In the C1s
used method. Recently, N-graphene has been obtained by spectrum of GO (Figure 5a), the sharp peak at around 284.5 eV
reducing GO in the NH3 and N2H4 mixed solution.71 The corresponds to the sp2 carbon with CC bonds. Another
nitrogen content reaches up to 5 at. % when the reduction strong peak at higher energy corresponds to the sp3 carbon
784 dx.doi.org/10.1021/cs200652y | ACS Catal. 2012, 2, 781−794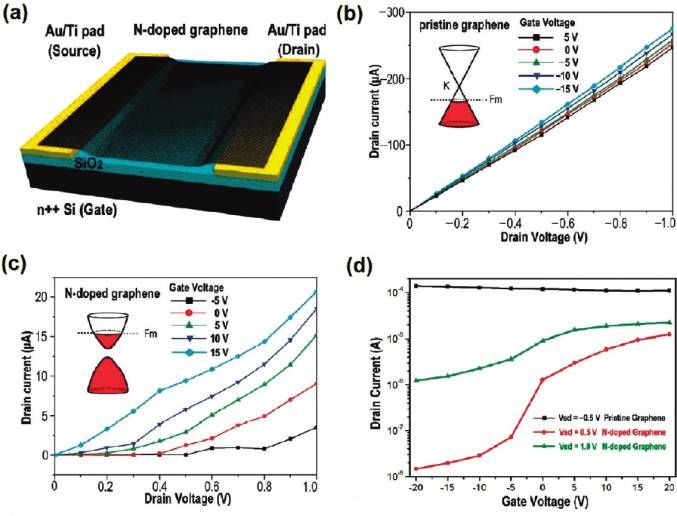
ACS Catalysis Review
Figure 5. High-resolution C1 spectra of the (a) GO, (b) graphene prepared by annealing GO in Ar at 800 °C, and (c) N-graphene prepared by
annealing GO/melamine (1:5) at 800 °C for 30 min.62
with several different C−O bonding configurations. These and one defect for the D mode. Different from the D band
configurations include the C−O bonds, carbonyls (CO), and which requires defects to activate it, the 2D band does not
carboxylates (OC−O) at about 286.2, 287.8, and 289.2 eV, require the activation of defects. Thus, the 2D band is always
respectively. After GO is annealed in Ar, the intensity of the seen in the Raman spectra of graphene and N-graphene, even
peak ascribed to the C−O bonding configurations decreases to when the D band cannot be observed. For the D′ band, it arises
a much lower value (Figure 5b).62 This indicates that most of from the intravalley, defect-induced, double-resonance process.
the oxygen groups in GO are removed after annealing. If GO is Previous studies77,79 have revealed that the intensity ratio of
doped with nitrogen atoms (Figure 5c), peaks ascribed to C−O the D and G bands (ID/IG) was inversely proportional to the in-
bonding configurations disappear, and new small peaks appear plane crystallite sizes La. The crystallite size can be determined
after peak fitting.50,62,70,71 In the work of Sheng et al.,62 new according to the Tuinstra−Koenig (TK) relation, La(nm) =
peaks appearing at 285.8 and 287.5 eV were assigned to the sp2 (2.4 × 10⁻¹⁰) λ4(ID/IG)−1 (λ is the Raman excitation
and sp3 carbon atoms, respectively. In other works,50,70 a new wavelength). For nitrogen doping, the substitution of nitrogen
small peak at ∼289 eV was observed. This peak is ascribed to atoms usually is accompanied by the introduction of defects
the physisorbed oxygen on the graphene. Generally speaking, into the graphene surface. Considering La as the average
the peak change at higher energy in the C1s spectrum suggests interdefect distance, more defects undoubtedly means a smaller
the nitrogen doping occurs in the graphene. La; thus, La can be used to study defects introduced by nitrogen
3.2. Raman Spectroscopy. Raman spectroscopy is another doping. Comparing the crystallite size of pristine graphene with
very useful method to characterize N-graphene. The D, G, and N-graphene, Zhang et al.50 reported that the ID/IG of graphene
2D bands are the predominant features in the spectrum of N- and N-graphene with lower (NG1) and higher (NG2) nitrogen
graphene. They are represented by peaks at around 1320− doping level are 0.26, 0.8 and 2.1, which corresponds to
1350, 1570−1585, and 2640−2680 cm−1, respectively (Figure crystallite sizes of 65, 21, and 8 nm, respectively (Figure 7).
6.) In some studies,40,52 the peak called D′ will appear at
Figure 7. Raman spectra of pristine graphene and N-graphene with 0.6
(NG1) and 2.9 (NG2) at. % doping level. The insert shows the
enlarged 2D band of NG2. The laser excitation wavelength is 514.5
nm.50
This suggests the crystallite size decreases remarkably with an
Figure 6. Typical Raman spectrum of N-graphene transferred onto a
increase in the nitrogen doping level because of the defects.
SiO2/Si substrate. The laser excitation wavelength is 514.5 nm.44
Apart from ID/IG, the intensity ratio of the 2D and G bands
(I2D/IG) has been used to characterize N-graphene. It has been
∼1602−1625 cm−1. These bands already have been studied reported that I2D/IG depends on the electron concentration
intensively in former studies.74−78 Specifically, the G band (Figure 8).80 The G band always stiffens, and the 2D band
corresponds to the doubly degenerate E2g phonons at the responds differently to hole and electron doping; thus, I2D/IG
Brillouin zone. It originates from the first-order Raman has been used to estimate the nitrogen doping level.50,70
scattering process. The 2D and D bands are all induced by Through calculating the I2D/IG, which was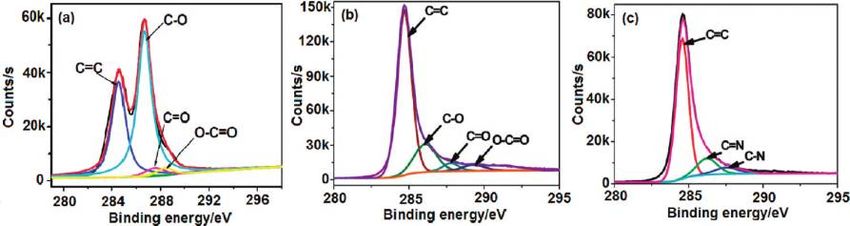
ACS Catalysis                                                                                                                                    Review

                                                                            indicates the purple paths are related to the local dopant
                                                                            concentration.
                                                                               Some studies reported a shift of the G band after nitrogen
                                                                            doping. Because the variation of charge density in pristine
                                                                            graphene will cause the different G band positions and I2D/IG in
                                                                            the different spots of graphene,85 Li et al. made a gold marker
                                                                            in the vicinity of graphene to accurately monitor the evolution
                                                                            of the nitrogen doping.70 An upshift of the G band in the
                                                                            Raman spectra of the monolayer graphene was observed. In the
                                                                            work of Zhao et al.,84 a similar trend of the G band was also
                                                                            observed by using the frequency histogram collected from
                                                                            Raman spectral mapping (Figure 9d). However, the observed
                                                                            position of the G band can also be affected by the
                                                                            inhomogeneous layer distribution82,86 and defects due to
                                                                            nitrogen doping,87 which may induce the downshift of G
Figure 8. The influence of hole and electron doping on the I2D/IG.80         band in N-graphene in some studies.52,63 Thus, comprehensive
                                                                            consideration should be taken if discussing this phenomenon.
graphene layers,81 and IG/I2D was related to the thickness of the              3.3. Scanning Tunneling Microscopy (STM). STM is a
graphene.82,83 Thus, for N-graphene with inhomogeneous                      very powerful technique to investigate the electronic properties
layers, the I2D/IG cannot reflect the nitrogen doping level.                 of a sample. It can probe the charge density at the Fermi level.
I2D/IG can be used only when N-graphene has homogeneous                     When the bias voltage (Vbias) applied between the tip and
layers.                                                                     sample is positive, electrons tunnel from the tip into the
   Before using ID/IG and I2D/IG to characterize N-graphene,                specimen, then the lowest unoccupied states of the specimen
inhomogeneous nitrogen doping should be considered. It has                  are probed. When a negative Vbias is applied, electrons tunnel
been reported that some spots showed high ID/IG and some                    from the specimen into the tip, and the highest occupied states
showed very low ID/IG within the N-graphene,40 which suggests               of specimen are probed.88 Due to the sharp tip, the STM
the nonuniform defect distribution induced by inhomogeneous                 images can show atomic resolution. Recently, both theoretical
nitrogen incorporation. Thus, the ID/IG and I2D/IG derived                  and experimental studies on the electronic properties of N-
from the Raman spectra at discrete spots cannot fully reflect the            graphene have been carried out.52,84,89
doping situation. In practice, Raman spectral mapping can be                   Compared with the pristine graphene, N-graphene shows
used to avoid this problem. This technique records the Raman                some brighter sections that are distinct from the main graphene
spectra on a large scale; thus, the comparison of different N-               network in the STM image (Figure 10c).52,84 Different bright
graphenes is more convincing for inhomogeneous doping. In                   features correspond to different nitrogen doping types. Because
the maps of I2D/IG over a 80 × 80 μm2 area (Figure 9b),84 the               these bright sections are only a few atoms across (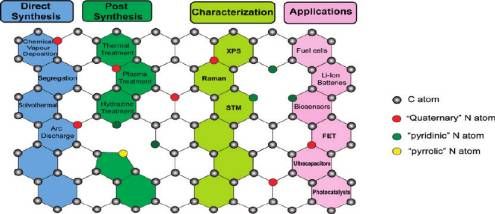
ACS Catalysis                                                                                                                                      Review

Figure 10. (a) STM image of the most common doping form in N-graphene. The inset is the line profile across the dopant (Vbias = 0.8 V, Iset = 0.8
nA). (b) Simulated STM image of quaternary N dopant based on density functional theory calculations (Vbias = 0.5 V). (c) STM image of N-
graphene showing ∼14 quaternary N dopants. The inset is the FFT of topography (Vbias = 0.8 V, Iset = 0.8 nA). (d) Spatial distribution of N−N
distances from eight samples with different nitrogen concentrations. (e) dI/dV curves taken from an N atom and other nearby bright topographic
features (Vbias = 0.8 V, Iset = 1.0 nA).84

N atoms exhibit the brightest feature because of the increased              4. APPLICATIONS
charge density of state induced by the neighbor N atoms                        4.1. Electrocatalyst for Fuel Cell Application. A fuel cell
(Figure 10b).52,84                                                          is an electrochemical energy conversion device that oxidizes
   Apart from the local structure around dopants, some long                 fuel at the anode and reduces oxygen from air at the cathode to
“tails” arising from the intervalley electron scattering are                produce electricity.90 Commonly, Pt is used as the catalyst for
observed in the STM image (Figure 10c). This kind of                        the oxidation reaction on the anode and reduction reaction on
scattering is verified by the inner hexagon in the fast Fourier              cathode. However, the commercial application of Pt catalysts is
transform (FFT). STM is also used to study the possibility of               limited by its scarcity, time-dependent drift, and CO poison-
dopant clustering. The dopant distribution in the N−N                       ing.90 Thus, Pt-based catalysts91,92 and other metal catalysts,
distance is quadratic even when the distance is down to few                 such as Au and Pd,93,94 have been developed. Recently, N-
lattice constants (Figure 10d); it indicates that the dopants               graphene has been used in fuel cells as either the catalysts
distribute randomly. Furthermore, the study reveals that nearby             directly or carbon support to anchor metal catalysts.
dopants prefer to substitute into the same sublattice of                       4.1.1. Theoretical Part. The oxygen reduction reaction of N-
                                                                            graphene on the cathode of a fuel cell has been discussed in
graphene. The charge-carrier density of N-graphene can be
                                                                            many studies. Through studying the ORR behavior of model
measured from a STM study. From the curves of dI/dV
                                                                            graphenes C45NH20 and C45NH18 in acidic environment, Zhang
(derivative of current with respect to the voltage), the Dirac              et al.25 showed that the spin density and charge density of
point of N-graphene is calculated (Figure 10e). Then the                    atoms were the major factors that determined the catalytic
charge-carrier density can be calculated from the relation n =              active sites in ORR. The substitution of N atoms, which
ED2/π(h̅vF)2 (n is the charge-carrier density, h̅ is the Plank’s            introduces the unpaired electron, will change the atomic charge
constant over 2π, νF is the Fermi velocity).                                distribution. The active sites in N-graphene usually are carbon
   3.4. Other Characterization Techniques. In addition to                   atoms that possess high spin density. If the spin density is
the above techniques, scanning electron microscope (SEM),                   negative and small, the atom with a higher charge density will
HRTEM, atomic force microscope (AFM), selected area                         be the active sites. Although in a previous study,95 it was shown
electron diffraction (SAED) and thermogravimetric analysis                   that the energy gap between highest occupied molecular orbital
(TGA) have also been used to study N-graphene. Specifically,                 (HOMO) and lowest unoccupied molecular orbital (LUMO)
SEM is commonly employed to study the morphology of N-                      could be used as an index of kinetic stability, it is unnecessarily
graphene. HRTEM is the most commonly used technique to                      related to the catalytic capacity of graphene and N-graphene.
determine the number of graphene layers on the basis of the                    The ORR mechanism on N-graphene also has been studied.
                                                                            Earlier studies have shown that O2 could be reduced following
cross section or edge images of N-graphene. AFM can also be
                                                                            two pathways. One is a direct four-electron pathway in which
used to estimate the number of graphene layers on the basis of              O2 is reduced to water in an acidic environment or OH− in an
the interlayer distance. SAED can provide information about                 alkaline environment. Another is a two-electron pathway in
the crystalline structure of N-graphene on the basis of                     which O2 is partly reduced to H2O2 in an acidic environment or
diffraction pattern. The hexagonal diffraction spots indicate                 OOH− in an alkaline environment. Both mechanisms have
that the N-graphene still keeps a well-ordered crystalline                  been proposed by theoretical studies based on different N-
structure,44,62 and the ringlike diffraction pattern of spots                graphene models. Kurak et al.96 showed a two-electron ORR
means structure distortion occurs after doping.41                           pathway based on the graphene model possessing two neighbor
                                                                      787                            dx.doi.org/10.1021/cs200652y | ACS Catal. 2012, 2, 781−794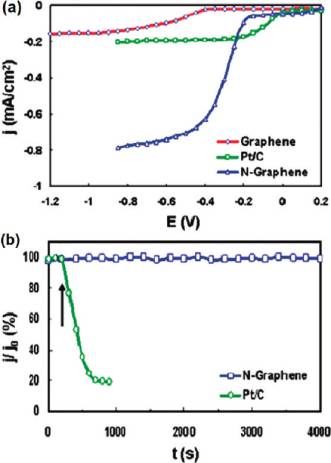
ACS Catalysis                                                                                                                                      Review

N atoms in the zigzag edge. However, it was found that two
nitrogen atoms were very unlikely to be doped at two
neighboring zigzag sites by checking the interaction energy
between two nitrogen atoms.97
   Zhang et al.25 proposed a four-electron ORR pathway on N-
graphene in an acidic environment. Furthermore, after taking
the solvent, surface coverage, and adsorbates into consideration,
Yu et al.98 obtained the overall energy profile of the ORR
pathway on N-graphene in an alkaline environment. The study
shows that water molecules are essential for the reaction. The
O2 adsorption is greatly enhanced due to the O2 polarization
induced by the hydrogen bonding with water. Through
investigating two ORR mechanisms, dissociative and associative
(Figure 11), study shows that the associative mechanism is

Figure 11. Scheme of the ORR reaction on N-graphene in an alkaline         Figure 12. (a) RRDE voltammograms for ORR in air-saturated 0.1 M
environment where 1 is the associative mechanism and 2 is the              KOH on the electrodes graphene (red), Pt/C (green), and N-
dissociative mechanism.98                                                  graphene (blue) with a scan rate of 0.01 V s−1. Electrode rotating rate:
                                                                           1000 rpm. (b) Current−time chronoamperometric response of Pt/C
                                                                           and NG to CO. The arrow indicates the addition of 10% (v/v) CO at
                                                                           −0.4 V.41
more energetically favored in ORR because of the lower O2
dissociation barrier. In the associative mechanism, the
desorption barrier of OOH(ads) into OOH− is high, so the                      Furthermore, the ORR activity of N-graphene is also studied
energetically favored reaction OOH(ads) → O(ads) + OH− is                  through diffusion limited current and kinetic current. Some
more likely to happen, which suggests the four-electron ORR                studies showed the diffusion-limited current density of N-
pathway of N-graphene. The reaction rate is determined by the              graphene was higher than commercial 20% or 40% Pt/C (E-
removal of O(ads) on the surface of N-graphene.                            TEK) catalyst,41,52 but another study showed that N-graphene
   Apart from N-graphene, the interaction between Pt atom and              had a similar diffusion-limited current density.60 Although the
N-graphene has been investigated.26 In N-graphene, the                     reported activity of N-graphene varies from different studies,
nitrogen atoms do not bond with Pt atom directly; instead,                 there is consensus that N-graphene has excellent stability
they direct a Pt atom to bond with the carbon atom, which is               compared with the Pt catalyst. Shao et al.23 reported that the
more energetically favored. This is helpful to prevent Pt                  20% Pt/C (E-TEK) showed higher electrocatalytic activity than
nanoclusters from migrating and forming larger particles.                  N-graphene before an accelerated degradation test (ADT), but
Because the introduction of nitrogen atoms disrupts the                    after the ADT, the N-graphene exhibited higher kinetic current
delocalized double bond in the graphene system, the Pt/C                   compared with the Pt/C catalyst because of the degradation of
bond will focus on the 6s/2s orbitals rather than 5d/2p orbitals.          Pt/C. In addition, studies also showed the activity of N-
This doubles the binding energy between Pt and carbon atoms.               graphene would not be influenced by the addition of methanol
In general, the binding of Pt to N-graphene improves the                   or CO (Figure 12b).23,41 These two advantages make N-
catalytic durability of Pt.                                                graphene a promising material toward ORR in fuel cells.
   4.1.2. Experimental Part. Several groups have recently                     Notably, in the above studies in which the four-electron ORR
reported studies on metal-free N-graphene with enhanced                    pathway was observed, these N-graphene catalysts consist of
catalytic activity toward ORR.23,40,41,52,60,62 The efficiency of            two or three nitrogen types.23,41,52,60,62 For N-graphene
ORR can be evaluated through two ways.99 One way is to                     possessing only the pyridinic N, a two-electron reduction
calculate the transfer number of electrons through the                     process was observed in the ORR process.40 This may indicate
Koutecky−Levich (K−L) equation by using a rotating disk                    a less efficient ORR performance of pyridinic N. In another
electrode (RDE). Another way is to measure the proportion of               study, the N-graphene with higher pyridinic and quaternary N
H2O2 formed during the ORR process by using a rotating ring-               content exhibited a higher onset potential than N-graphene that
disk electrode. Qu et al.41 reported that N-graphene exhibited a           possessed the same nitrogen content. This suggests the
typical one-step, four-electron ORR pathway, which is similar              pyridinic and quaternary N may play a more important role
to the ORR pathway of a Pt catalyst (Figure 12a). In contrast,             for ORR activity.60 However, because of the scarcity of study in
pristine graphene showed a two-step, two-electron ORR                      this field and variation in experimental conditions, the
pathway with a lower onset potential. In another work,60 the               relationship between the catalytic activity and the nitrogen
H2O2 formed in the ORR process was about 10% at −0.5 V in                  species is still unclear. In the former study of N-CNTs, both
the diffusion-controlled region. The low proportion of H2O2                 quaternary100,101 and pyridinic21,24 nitrogen have been
indicated the four electron reduction process dominated in                 observed to have the dominant effect for the ORR activity.
ORR. All these studies show that N-graphene can be a very                  Thus, further research work on the nitrogen catalytic site is still
effective catalyst for ORR.                                                 required.
                                                                     788                             dx.doi.org/10.1021/cs200652y | ACS Catal. 2012, 2, 781−794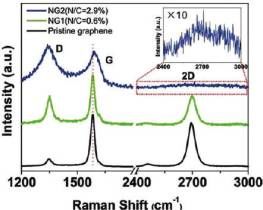
ACS Catalysis                                                                                                                                    Review

Figure 13. (a) Cyclic voltammetry (CV) of Co3O4/rmGO, Co3O4/N-rmGO and Pt/C in O2- (solid line) or Ar-saturated (dashed line) 0.1 M KOH
solution. RDE voltammograms of Co3O4/rmGO (b) and Co3O4/N-rmGO (c) for ORR in O2-saturated 0.1 M KOH at different rotation rates with a
scan rate of 5 mV s−1. The inset figure is the corresponding Koutecky−Levich plots at different potentials. (d) Tafel plots of Co3O4/rmGO and
Co3O4/N-rmGO derived by the mass-transport correction.104

   Apart from the nitrogen types, the nitrogen content is also            impregnating N-graphene into a mixture of iron acetate and
related to the ORR activity of N-graphene. However, because               1,10-phenanthroline, then the FexC species formed in the
N-graphene usually consists of two or three nitrogen types and            sintering process would anchor the FeCN nanoparticles on N-
the content of different nitrogen types usually varies with                graphene surface. The as-synthesized FeCN/N-graphene shows
different nitrogen doping levels, different studies have produced           an enhanced ORR activity compared with the N-graphene
contradictory results in previous studies.52,62 In a more direct          because of the additional ORR activity of FeCN nanoparticles.
study in which N-graphene contains only pyridinic N,40 the N-             In another notable study,104 Liang et al. grew Co3O4 on mildly
graphene possessing the higher nitrogen content (16 at. %)                oxidized graphene oxide (rmGO) with or without the presence
exhibited poorer ORR activity than that possessing the lower              of NH4OH, then catalyst Co3O4/rmGO and Co3O4/N-rmGO
nitrogen content (2.2 at. %). In a theoretical study, it has been         were obtained. The latter catalyst has ∼4 at. % nitrogen
reported that model graphene with a higher nitrogen content               content. Through the ORR study of the Co3O4/rmGO and
was more easily poisoned by O(ads) because of the stronger                Co3O4/N-rmGO, it has been revealed that these two catalysts
affinity.102 These results mean an optimal nitrogen content                 exhibit high ORR activity that is different from the Co3O4
might be critical to achieving a high ORR activity.                       nanocrystals (Figure 13a). Also different from the two-electron
   Several studies also have studied the performance of Pt/N-             ORR pathway of N-rmGO obtained in the study, these two
graphene in both oxidation and reduction reactions.67,73 For              catalysts show the obvious four-electron ORR pathway (Figure
Pt/N-graphene used for an oxidation reaction,73 it has been               13b, c). Comparing the kinetic current of Co3O4/N-rmGO
reported that Pt nanoparticles could disperse better on the               with Co3O4/rmGO, the former exhibits the apparent higher
surface of N-graphene with the existence of N atoms in a                  current density than the latter (Figure 13d). The higher ORR
carbon lattice. Moreover, the conductivity of N-graphene was              activity of Co3O4/N-rmGO is ascribed to the synergistic
improved at high temperature (800 °C). These two factors                  coupling between Co3O4 and N-graphene. Because Co3O4/N-
made Pt/N-graphene exhibit a 3 times higher oxidation current             rmGO shows both the high ORR activity similar to Pt catalyst
than 20% Pt/carbon black catalyst. For Pt/N-graphene used for             and excellent stability, this kind of hybrid catalyst is also
the oxygen reduction reaction,67 it also showed an improved               promising for ORR catalysis.
performance compared with Pt/graphene because of the better                  4.2. Field-Effect Transistor (FET). For semiconductors,
dispersion of Pt nanoparticles and stronger interaction between           the flow of electricity needs some kind of activation (for
Pt and C atoms stated in the theoretical part.26                          example, heat or light absorption) to get over the gap between
   Apart from the Pt catalyst, other nonprecious metal catalysts          the valence band and conduction band.105 If the semiconductor
supported on N-graphene toward ORR have been stud-                        is activated by the external electric field to switch “on” and “off”,
ied.103,104 Tsai et al.103 synthesized FeCN/N-graphene by                 then it is called FET. Generally speaking, the large-scale and
                                                                    789                            dx.doi.org/10.1021/cs200652y | ACS Catal. 2012, 2, 781−794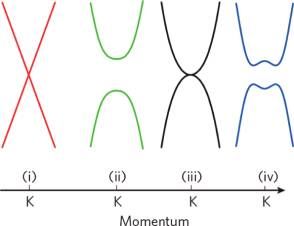
ACS Catalysis                                                                                                                                        Review

bilayer graphene do not possess a band gap; however,                          Kubo-Greenwood approach.27 When the nitrogen concen-
constraining large-scale graphene in one dimension (GNRs)                     tration (Cd) is over or equal to 2% (2% ≤ Cd ≤ 4%), the decay
or applying an electric field perpendicularly on the bilayer                   of the diffusion coefficient D is clearly observed. This indicates
graphene can induce the band gap (Figure 14).106 Recently,                    the onset of quantum interference effects. However, this effect
both theoretical and experimental works have studied the                      is still weak and can only marginally affect the conduction when
semiconductor properties of N-graphene.                                       the nitrogen content is low. This study suggests that the
                                                                              nitrogen doping may modulate the graphene property while
                                                                              maintaining good mobility and conductivity. However, the
                                                                              conduction is also influenced by many other factors. In
                                                                              experimental study, it has been shown that both defects and
                                                                              nitrogen atoms will be introduced into graphene. Defects can
                                                                              serve as the scattering center, which will affect the mobility of
                                                                              N-graphene. Moreover, when the nitrogen concentration rises
                                                                              over 5%, a stronger localization effect might occur, which will
                                                                              largely decrease the mobility in N-graphene.27
                                                                                 GNR can be obtained by constraining large-scale graphene to
                                                                              one dimension. Former studies have revealed that H-
                                                                              terminated GNRs with either armchair or zigzag-shaped
Figure 14. Band structure around the k point of (i) large-area                edges have nonzero band gaps.7,9,108 Through theoretical
graphene, (ii) graphene nanoribbons, (iii) unbiased bilayer graphene,         studies of zigzag GNR (ZGNR),109,110 it was revealed that the
and (iv) bilayer graphene with an applied perpendicular field.106              nitrogen atom and defects energetically preferred to dope at the
                                                                              edge of GNR. Depending on doping sites and various GNRs,
   4.2.1. Theoretical Part. Nitrogen doping can effectively                    the introduction of nitrogen atoms will induce very different
modulate the electrical properties of graphene. On the basis of               electronic properties. For example, Yu et al.109 showed different
the investigation of C3N4 and C6N9H3 graphene,29 it has been                  nitrogen doping sites would make the impurity state lie below
revealed that the band gap of N-graphene with a high N/C                      or above the Fermi level. Li et al.110 found one edge-doped
ratio reached ∼5 eV. The band gap can be tuned by the                         nitrogen made ZGNR spin a gapless semiconductor while two
presence of external stress or adatoms. In another theoretical                opposite edge-doped nitrogens made ZGNR nonmagnetic
work based on the study of delta-doping graphene,107 it has                   metals. Biel et al.111 reported that the full suppression of
been reported that the band gap could be opened only when                     impurity backscattering would occur if the doped GNR was
the nitrogen content was over ∼25%. However, delta-doping                     armchair and mirror-symmetrical.
may be unlikely to occur in practice. In the experimental study,                  4.2.2. Experimental Part. After the preparation of bottom-
an obvious band gap has been observed on N-graphene with a                    gated N-graphene FET by using a Si substrate with a 500 nm
lower nitrogen content.70 Apart from the band gap, the                        thick SiO2 layer (Figure 15a), pristine graphene exhibits p-type
mobility and conductivity of N-graphene has also been                         behavior because of the adsorption of oxygen or water in air
discussed theoretically by using the quantum-mechanical                       (Figure 15b). In contrast, N-graphene with a 8.9 at. % nitrogen

Figure 15. (a) Schematic illustration of the N-graphene FET device. (b, c) Ids/Vds characteristics at various Vg's for the pristine graphene and NG
FET device. (d) Transfer characteristics of the pristine graphene and the NG.30

                                                                        790                            dx.doi.org/10.1021/cs200652y | ACS Catal. 2012, 2, 781−794
ACS Catalysis Review
Figure 16. Galvanostatic charge−discharge profile of N-graphene at a low current rate of 50 mA/g (a) and a higher current rate from 0.5 to 25 A/g
(c), (b) cycle performance and Coulombic efficiency of N-graphene at low current rate of 50 mA/g, (d) cycle performance and rate capabilities of N-
graphene at higher current rate from 0.5 to 25 A/g.115
doping level exhibits typical n-type semiconductor behavior graphene have reported a band gap in their works. Zhang et al.
(Figure 15c, d).30 Compared with the mobility of pristine showed the band gap in N-graphene with 2.9 at. % nitrogen
graphene (300−1200 cm2 V−1 s−1), the mobility of N-graphene content was about 0.16 eV,50 which is still too low. Considering
reduces to 200−450 cm2 V−1 s−1. Using different precursors in the mobility and band gap of N-graphene obtained up to the
the CVD method, Jin et al.44 reported the mobility of N- present, synthesization of N-graphene for practical applications
graphene with 2.4 at. % nitrogen content reduced by 2 orders of is still far off.
magnitude compared with that of pristine graphene. In other 4.3. Lithium Ion Batteries. In recently years, graphene has
methods,50,59,63 such as N-graphene obtained through NH3 attracted great attention as a potential anode material in lithium
annealing after N+ ion irradiation,59 a much lower hole and ion batteries (LIBs) because of its fascinating properties, such
electron conductivity was observed compared with the pristine as high electrical electronic properties, high surface area, and
graphene. excellent mechanical flexibility. Although graphene-based
In the study of nitrogen-doped GNR (N-GNR), it has been materials can reach a high reversible capacity (1013−1054
reported the N-GNR fabricated by high power electrical mA h/g) at a low charge rate,114 it is still rate-limited at a high
annealing in NH3 showed typical n-type semiconductor charge/discharge rate (≥500 mA/g).115 Thus, a N-graphene-
behavior, and the mobility was similar with the GNR annealed based device is proposed with the intent to achieve a high
in vacuum.31 The reason is that nitrogen atoms incorporate reversible capacity at the high charge/discharge rate.
mainly into the edge of GNR, and few charged impurities are In earlier work, Reddy et al.43 obtained N-doped graphene
introduced, which will not degrade the mobility of GNR. under the control of a CVD method. The reversible discharge
As discussed above, the electron mobility of graphene capacity of N-graphene was almost double compared with
decreases with the increment of band gap in most cases, which pristine graphene because of the enhanced Li ion intercalation
is similar to the trend in studies of CNTs.106,112,113 Although with the introduction of nitrogen atoms. In another more
several theoretical studies27,111 and the recent work about N- recent work,116 N-GNS with 2 at. % nitrogen content (57.4%
GNR31 have shown the mobility of N-graphene might be pyridinic, 35.0% pyrrolic, and 7.6% quaternary N) was
maintained by controlling the nitrogen at a low doping level synthesized by heat treatment of GO in an NH3 atmosphere.
and specific doping site, the scattering center induced by the The N-graphene possessed a reversible capacity of around 900
defects will drastically decrease the mobility of N-graphene in mA h/g at a current density of 42 mA/g and a capacity of ∼250
practice. In addition, it is claimed that the grain boundaries in mA h g−1 at a high current density of 2.1 A/g. In another work
N-graphene may also contribute to a decrement of mobility.36 in which N-graphene was synthesized by a similar heat
Other than the mobility, a sizable band gap, preferably 0.4 eV treatment method,115 N-graphene with 3.13 at. % nitrogen
or higher, is also required in conventional FET (the band gap of content exhibited reversible capacities of 1043 mAh/g and 872
silicon is 1.1 eV).106 Until now, only a few studies of N- mAh/g in the first and 31st cycles at a low current rate of 50
791 dx.doi.org/10.1021/cs200652y | ACS Catal. 2012, 2, 781−794ACS Catalysis Review
mA/g, respectively (Figure 16 a, b). At a higher current rate of and pure CdS, which can be attributed to the hampering of the
25 A/g, the reversible capacities of N-graphene still reached 199 radiative recombination of the electron−hole pairs induced by
mAh/g (Figure 16 c, d). enhanced electron transportation from CdS to N-graphene.
The excellent performance of N-graphene can be ascribed to Moreover, CdS anchored on N-graphene with 2 wt % nitrogen
many factors, such as the introduction of nitrogen atoms, the content showed the best catalytic activity. It reveals that a
defects and disordered surface morphology induced by doping, proper junction structure is required for the highest photo-
increased electrode/electrolyte wettability, and improved catalytic activity.
electrochemical performance. Notably, in the above studies,
the types of pyridinic and pyrrolic N are predominant in the N- 5. CONCLUSION
graphene. Through the study of nitrogen-doped graphite, it has In summary, many research works on N-graphene have
been revealed that both the pyridinic and quaternary N played emerged in recent years. Various synthesis approaches and
an effective role in lithium intercalation and extraction.117 Thus, characterization techniques have been explored to obtain and
graphene with a large quaternary N content might also be used characterize N-graphene. The N doping offers an effective way
in LIBs. to tailor the properties of graphene, thus making N-graphene a
4.4. Devices in Other Fields. N-Graphene has been promising material for use in many fields. However, the method
applied in the field of ultracapacitors.69 The ultracapacitor for the production of large-scale N-graphene is still lacking;
based on N-graphene has shown a long cycle life (Figure 17a). thus, new methods are required. Moreover, synthesizing N-
graphene meets problems similar to those encountered during
fabricating N-CNT. First, controlling the nitrogen type and
distribution is unresolved. Second, to achieve nitrogen doping
at specific positions and with precise control of doping content
is still a challenge. For FET application, the doping location and
doping content is critical not to decrease the electron mobility
drastically while opening a suitable band gap. For electro-
catalysis, the correlation between the activity and nitrogen type
needs to be identified, and controlling the specific nitrogen type
in N-graphene is required for high performance catalysts. For
Figure 17. (a) The cycling tests for the ultracapacitors based on Ni other applications, such as LIBs and ultracapacitors, a specific
and paper substrates up to 10 000 cycles. (b) The specific capacitances nitrogen type may also be required. Another issue to be
measured in 6 M KOH and organic electrolytes.69 considered is defects and distortion. Defects are inevitable
during the synthesis process of N-graphene. They will decrease
the mobility of N-graphene; however, their presence will
Moreover, a N-graphene-based device showed a much higher benefit the catalytic reaction for ORR and LIBs. Depending on
capacitance than a device based on pristine graphene in both the application, choosing or finding an appropriate approach is
KOH and organic electrolyte (Figure 17b). By calculating the required.
binding energy between the potassium ion and nitrogen
configurations at different positions of N-graphene, it has been
revealed that the basal-plane pyridinic N exhibited the largest
■ AUTHOR INFORMATION
Corresponding Author
binding energy. Thus, basal-plane pyridinic N was claimed to *Phone: (65) 6316 8866. Fax: (65) 6794 7553. E-mail:
have a dominant role in the capacitance enhancement. Pyrrolic WangXin@ntu.edu.sg.
N also showed a large binding energy with ion, but the negative
charge of pyrrolic N would cause too strong binding for the Notes
The authors declare no competing financial interest.
■
reversible charging/discharging process, which was reflected by
the lower Coulombic efficiencies of N-graphene with a large
proportion of pyrrolic N. Therefore, controlling the appropriate ACKNOWLEDGMENTS
nitrogen configuration can greatly promote the capacitance of This work is supported by the academic research fund AcRF
N-graphene. tier 2 (MOE2009-T2-2-024), Ministry of Education, Singapore,
Study has shown that N-graphene has a better electron and competitive research program (2009 NRF-CRP 001-032),
transfer efficiency than pristine graphene,68,72 rendering its National Research Foundation, Singapore.
potential use for electrochemical sensing. Because glucose
oxidase (GOx) could oxidize glucose with oxygen and produce
gluconic acid and H2O2, Wang et al.68 fabricated the glucose
■ REFERENCES
(1) Novoselov, K. S.; Geim, A. K.; Morozov, S. V.; Jiang, D.; Zhang,
sensor by immobilizing GOx on the biocompatible N-graphene Y.; Dubonos, S. V.; Grigorieva, I. V.; Firsov, A. A. Science 2004, 306,
surface. It was observed that the GOx redox peak current on N- 666.
doped graphene was greatly improved over that on graphene, (2) Stoller, M. D.; Park, S.; Zhu, Y.; An, J.; Ruoff, R. S. Nano Lett.
which demonstrated the enhanced electron transfer efficiency 2008, 8, 3498.
of N-graphene. This kind of biosensor shows a good response (3) Balandin, A. A.; Ghosh, S.; Bao, W.; Calizo, I.; Teweldebrhan, D.;
Miao, F.; Lau, C. N. Nano Lett. 2008, 8, 902.
for glucose concentrations ranging from 0.01 to 0.5 mM in the (4) Lee, C.; Wei, X.; Kysar, J. W.; Hone, J. Science 2008, 321, 385.
presence of other molecules. (5) Barone, V.; Hod, O.; Scuseria, G. E. Nano Lett. 2006, 6, 2748.
Apart from the above applications, N-graphene also has been (6) Kosynkin, D. V.; Higginbotham, A. L.; Sinitskii, A.; Lomeda, J. R.;
used as a support to anchor quantum dots toward high- Dimiev, A.; Price, B. K.; Tour, J. M. Nature 2009, 458, 872.
performance photocatalysts.118 N-Graphene/CdS nanocompo- (7) Li, X.; Wang, X.; Zhang, L.; Lee, S.; Dai, H. Science 2008, 319,
sites have a higher photocatalytic activity than graphene/CdS 1229.
792 dx.doi.org/10.1021/cs200652y | ACS Catal. 2012, 2, 781−794ACS Catalysis Review
(8) Ponomarenko, L. A.; Schedin, F.; Katsnelson, M. I.; Yang, R.; (47) Kudashov, A. G.; Okotrub, A. V.; Bulusheva, L. G.; Asanov, I. P.;
Hill, E. W.; Novoselov, K. S.; Geim, A. K. Science 2008, 320, 356. Shubin, Y. V.; Yudanov, N. F.; Yudanova, L. I.; Danilovich, V. S.;
(9) Ritter, K. A.; Lyding, J. W. Nat. Mater. 2009, 8, 235. Abrosimov, O. G. J. Phys. Chem. B 2004, 108, 9048.
(10) Jiao, L.; Zhang, L.; Wang, X.; Diankov, G.; Dai, H. Nature 2009, (48) Liu, J.; Webster, S.; Carroll, D. L. J. Phys. Chem. B 2005, 109,
458, 877. 15769.
(11) Derycke, V.; Martel, R.; Appenzeller, J.; Avouris, P. Appl. Phys. (49) Lv, W. X.; Zhang, R.; Xia, T. L.; Bi, H. M.; Shi, K. Y. J. Nanopart.
Lett. 2002, 80, 2773. Res. 2011, 13, 2351.
(12) Gong, K.; Du, F.; Xia, Z.; Durstock, M.; Dai, L. Science 2009, (50) Zhang, C.; Fu, L.; Liu, N.; Liu, M.; Wang, Y.; Liu, Z. Adv. Mater.
323, 760. 2011, 23, 1020.
(13) Wang, S. Y.; Wang, X.; Jiang, S. P. Langmuir 2008, 24, 10505. (51) Choucair, M.; Thordarson, P.; Stride, J. A. Nat. Nanotechnol.
(14) Wang, S. Y.; Yang, F.; Chen, S. L.; Jiang, S. P.; Wang, X. 2009, 4, 30.
Electrochem. Commun. 2010, 12, 1646. (52) Deng, D.; Pan, X.; Yu, L.; Cui, Y.; Jiang, Y.; Qi, J.; Li, W. X.; Fu,
(15) Zhou, C.; Kong, J.; Yenilmez, E.; Dai, H. Science 2000, 290, Q.; Ma, X.; Xue, Q.; Sun, G.; Bao, X. Chem. Mater. 2011, 23, 1188.
1552. (53) Droppa, R.; Hammer, P.; Carvalho, A. C. M.; dos Santos, M. C.;
(16) Schedin, F.; Geim, A. K.; Morozov, S. V.; Hill, E. W.; Blake, P.; Alvarez, F. J. Non-Cryst. Solids 2002, 299−302, 874.
Katsnelson, M. I.; Novoselov, K. S. Nat. Mater. 2007, 6, 652. (54) Journet, C.; Maser, W. K.; Bernier, P.; Loiseau, A.; Lamy de la
(17) Giovannetti, G.; Khomyakov, P. A.; Brocks, G.; Karpan, V. M.; Chapelle, M.; Lefrant, S.; Deniard, P.; Lee, R.; Fischer, J. E. Nature
van den Brink, J.; Kelly, P. J. Phys. Rev. Lett. 2008, 101, 026803. 1997, 388, 756.
(18) Chen, W.; Chen, S.; Qi, D. C.; Gao, X. Y.; Wee, A. T. S. J. Am. (55) Suenaga, K.; Colliex, C.; Demoncy, N.; Loiseau, A.; Pascard, H.;
Chem. Soc. 2007, 129, 10418. Willaime, F. Science 1997, 278, 653.
(19) Ewels, C. P.; Glerup, M. J. Nanosci. Nanotechnol. 2005, 5, 1345. (56) Panchakarla, L. S.; Subrahmanyam, K. S.; Saha, S. K.;
(20) Casanovas, J.; Ricart, J. M.; Rubio, J.; Illas, F.; Jiménez-Mateos, J. Govindaraj, A.; Krishnamurthy, H. R.; Waghmare, U. V.; Rao, C. N.
M. J. Am. Chem. Soc. 1996, 118, 8071. R. Adv. Mater. 2009, 21, 4726.
(21) Kundu, S.; Nagaiah, T. C.; Xia, W.; Wang, Y.; Dommele, S. V.; (57) Ghosh, A.; Late, D. J.; Panchakarla, L. S.; Govindaraj, A.; Rao, C.
Bitter, J. H.; Santa, M.; Grundmeier, G.; Bron, M.; Schuhmann, W.; N. R. J. Exp. Nanosci. 2009, 4, 313.
Muhler, M. J. Phys. Chem. C 2009, 113, 14302. (58) Subrahmanyam, K. S.; Panchakarla, L. S.; Govindaraj, A.; Rao,
(22) Matter, P. H.; Zhang, L.; Ozkan, U. S. J. Catal. 2006, 239, 83. C. N. R. J. Phys. Chem. C 2009, 113, 4257.
(23) Shao, Y.; Zhang, S.; Engelhard, M. H.; Li, G.; Shao, G.; Wang, (59) Guo, B.; Liu, Q.; Chen, E.; Zhu, H.; Fang, L.; Gong, J. R. Nano
Y.; Liu, J.; Aksay, I. A.; Lin, Y. J. Mater. Chem. 2010, 20, 7491. Lett. 2010, 10, 4975.
(24) Biddinger, E. J.; Deak, D. V.; Ozkan, U. S. Top. Catal. 2009, 52, (60) Geng, D.; Chen, Y.; Chen, Y.; Li, Y.; Li, R.; Sun, X.; Ye, S.;
1566. Knights, S. Energy Environ. Sci. 2011, 4, 760.
(25) Zhang, L. P.; Xia, Z. H. J. Phys. Chem. C 2011, 115, 11170. (61) Kinoshita, K. Carbon: Electrochemical and Physicochemical
(26) Groves, M. N.; Chan, A. S. W.; Malardier-Jugroot, C.; Jugroot, Properties; Wiley: New York, 1988.
M. Chem. Phys. Lett. 2009, 481, 214. (62) Sheng, Z. H.; Shao, L.; Chen, J. J.; Bao, W. J.; Wang, F. B.; Xia,
(27) Lherbier, A.; Blase, X.; Niquet, Y. M.; Triozon, F.; Roche, S. X. H. ACS Nano 2011, 5, 4350.
Phys. Rev. Lett. 2008, 101, 036808. (63) Li, X.; Wang, H.; Robinson, J. T.; Sanchez, H.; Diankov, G.; Dai,
(28) Wu, M.; Cao, C.; Jiang, J. Z. Nanotechnology 2010, 21, 505202. H. J. Am. Chem. Soc. 2009, 131, 15939.
(29) Deifallah, M.; McMillan, P. F.; Corà, F. J. Phys. Chem. C 2008, (64) Golberg, D.; Bando, Y.; Bourgeois, L.; Kurashima, K.; Sato, T.
112, 5447. Carbon 2000, 38, 2017.
(30) Wei, D.; Liu, Y.; Wang, Y.; Zhang, H.; Huang, L.; Yu, G. Nano (65) Morant, C.; Andrey, J.; Prieto, P.; Mendiola, D.; Sanz, J. M.;
Lett. 2009, 9, 1752. Elizalde, E. Phys. Status Solidi A 2006, 203, 1069.
(31) Wang, X.; Li, X.; Zhang, L.; Yoon, Y.; Weber, P. K.; Wang, H.; (66) Suenaga, K.; Johansson, M. P.; Hellgren, N.; Broitman, E.;
Guo, J.; Dai, H. Science 2009, 324, 768. Wallenberg, L. R.; Colliex, C.; Sundgren, J. E.; Hultman, L. Chem. Phys.
(32) Huang, X.; Yin, Z.; Wu, S.; Qi, X.; He, Q.; Zhang, Q.; Yan, Q; Lett. 1999, 300, 695.
Boey, F.; Zhang, H. Small 2011, 7, 1876. (67) Imran Jafri, R.; Rajalakshmi, N.; Ramaprabhu, S. J. Mater. Chem.
(33) Guo, S.; Dong, S. Chem. Soc. Rev. 2011, 40, 2644. 2010, 20, 7114.
(34) Wei, D.; Liu, Y. Adv. Mater. 2010, 22, 3225. (68) Wang, Y.; Shao, Y.; Matson, D. W.; Li, J.; Lin, Y. ACS Nano
(35) Liu, H.; Liu, Y.; Zhu, D. J. Mater. Chem. 2011, 21, 3335. 2010, 4, 1790.
(36) Reina, A.; Jia, X. T.; Ho, J.; Nezich, D.; Son, H.; Bulovic, V.; (69) Jeong, H. M.; Lee, J. W.; Shin, W. H.; Choi, Y. J.; Shin, H. J.;
Dresselhaus, M. S.; Kong, J. Nano Lett. 2009, 9, 30. Kang, J. K.; Choi, J. W. Nano Lett. 2011, 11, 2472.
(37) Zhang, J.; Zou, H.; Qing, Q.; Yang, Y.; Li, Q.; Liu, Z.; Guo, X.; (70) Lin, Y. C.; Lin, C. Y.; Chiu, P. W. Appl. Phys. Lett. 2010, 96,
Du, Z. J. Phys. Chem. B 2003, 107, 3712. 133110.
(38) Che, G.; Lakshmi, B. B.; Martin, C. R.; Fisher, E. R.; Ruoff, R. S. (71) Long, D.; Li, W.; Ling, L.; Miyawaki, J.; Mochida, I.; Yoon, S. H.
Chem. Mater. 1998, 10, 260. Langmuir 2010, 26, 16096.
(39) Maldonado, S.; Morin, S.; Stevenson, K. J. Carbon 2006, 44, (72) Wang, D. W.; Gentle, I. R.; Lu, G. Q. Electrochem. Commun.
1429. 2010, 12, 1423.
(40) Luo, Z.; Lim, S.; Tian, Z.; Shang, J.; Lai, L.; MacDonald, B.; Fu, (73) Zhang, L. S.; Liang, X. Q.; Song, W. G.; Wu, Z. Y. Phys. Chem.
C.; Shen, Z.; Yu, T.; Lin, J. J. Mater. Chem. 2011, 21, 8038. Chem. Phys. 2010, 12, 12055.
(41) Qu, L.; Liu, Y.; Baek, J. B.; Dai, L. ACS Nano 2010, 4, 1321. (74) Cançado, L. G.; Pimenta, M. A.; Neves, B. R. A.; Dantas, M. S.
(42) Di, C. A.; Wei, D.; Yu, G.; Liu, Y.; Guo, Y.; Zhu, D. Adv. Mater. S.; Jorio, A. Phys. Rev. Lett. 2004, 93, 247401.
2008, 20, 3289. (75) Dresselhaus, M. S.; Dresselhaus, G.; Saito, R.; Jorio, A. Phys. Rep.
(43) Reddy, A. L. M.; Srivastava, A.; Gowda, S. R.; Gullapalli, H.; 2005, 409, 47.
Dubey, M.; Ajayan, P. M. ACS Nano 2010, 4, 6337. (76) Ferrari, A. C.; Meyer, J. C.; Scardaci, V.; Casiraghi, C.; Lazzeri,
(44) Jin, Z.; Yao, J.; Kittrell, C.; Tour, J. M. ACS Nano 2011, 5, 4112. M.; Mauri, F.; Piscanec, S.; Jiang, D.; Novoselov, K. S.; Roth, S.; Geim,
(45) Imamura, G.; Saiki, K. J. Phys. Chem. C 2011, 115, 10000. A. K. Phys. Rev. Lett. 2006, 97, 187401.
(46) Cho, Y. J.; Kim, H. S.; Baik, S. Y.; Myung, Y.; Jung, C. S.; Kim, (77) Tuinstra, F.; Koenig, J. L. J. Chem. Phys. 1970, 53, 1126.
C. H.; Park, J.; Kang, H. S. J. Phys. Chem. C 2011, 115, 3737. (78) Nemanich, R. J.; Solin, S. A. Phys. Rev. B 1979, 20, 392.
793 dx.doi.org/10.1021/cs200652y | ACS Catal. 2012, 2, 781−794You can also read