Big Bounce: Russian gas amid market tightness - Key Takeaways for 2021 and Beyond - Oxford ...
←
→
Page content transcription
If your browser does not render page correctly, please read the page content below
September 2021

                                Big Bounce:
            Russian gas amid market tightness
                        Key Takeaways for 2021 and Beyond

Oxford Energy Comment           Vitaly Yermakov, Senior Research Fellow OIES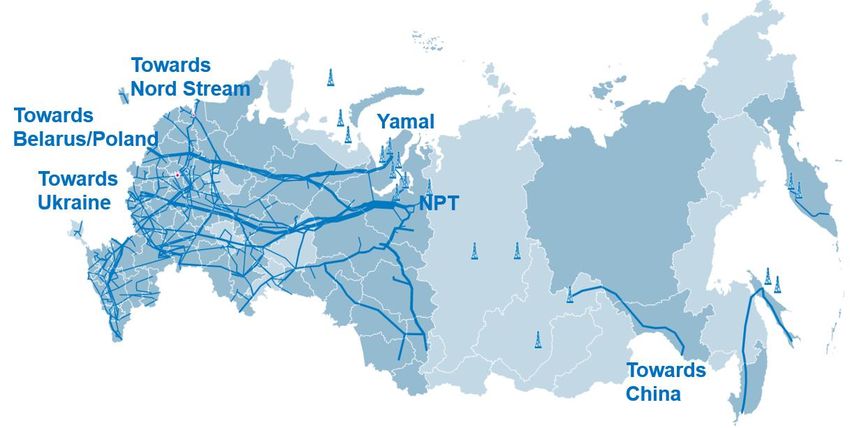
Introduction
For Russian gas, 2021 has developed into a pivotal year, as the gas market pendulum has swung back
from relative gas abundance and extremely low prices in 2020, to market tightness and very high gas
prices so far in 2021.1 The past two years, therefore, have represented two slopes in a ‘V-shape’ trend
for the gas market at large and for Russian gas in particular.
As the world’s largest pipeline gas exporter and an emerging significant LNG exporter, Russia seems
to be a winning beneficiary of the market tightening. At the same time, gas buyers have been struggling
to secure supplies even at premium prices and have been concerned about the availability of gas and
possible energy insecurity over the coming winter.
With declining indigenous production in Europe and limited availability of LNG owing to the strong pull
from premium markets in Asia, the European gas market is a case in point. Europe now demands
greater flexibility from suppliers, in both price and the ability to swing gas deliveries. Many European
analysts and market watchers expected that Russia as the largest swing producer and exporter would
value an opportunity to expand its market share, at least in the short term, and quickly respond to a
higher call on gas in Europe in 2021. Most recent reports show Russia’s gas exports to Europe
(including Turkey) up almost 20 per cent year-on-year, but this has proven to be insufficient to address
a sudden void in Europe’s gas balance.2 Gas storage levels in Europe are at historical lows at the start
of the heating season and gas prices have been testing record levels.3
Amid concerns about the sudden and sharp gas price escalation, numerous European media
publications have suggested that Gazprom has been holding back supply intentionally to inflate prices
and advance its geo-political goals (in particular pushing the case for Nord Stream 2 acceptance in
Europe as the only way out of gas deficit). These assertions implicitly assume firstly, that Gazprom has
spare productive capacity; secondly, that the evolution of the geographical distribution of spare
productive capacity in Russia has not resulted in infrastructural constraints, and thirdly, that Gazprom
can easily re-arrange the flows of its gas to deliver it to whichever trans-border point is required by
European buyers. The aim of this comment is not to argue that all these assumptions are wrong, but to
demonstrate the complexity of the issues surrounding them. In our previous publications we have
provided a detailed analysis of the evolution of Russia’s spare productive gas capacity 4 and the growing
flexibility requirements for Russian gas.5
This comment reviews the impact of the tight market on exports of Russian gas to Europe in 2021 and
explores the situation regarding the latest changes in Russia’s gas supply and spare productive
capacity. This allows us to assess how - if at all - Gazprom has changed its gas export strategy and
what lies ahead for the winter of 2021/22.

1
  See Yermakov V. Russian Gas: The Year of Living Dangerously – OIES Energy Comment published in September 2020 for
the discussion about the effects of the loose market of 2020 on Russian gas.
 https://www.oxfordenergy.org/publications/russian-gas-the-year-of-living-dangerously/
2
  Gazprom’s press-release of September 1, 2021, states that during January-August of 2021, Russia’s exports of pipeline gas
“beyond FSU” (this category until recently included Europe and Turkey but in 2021 it will also include about 10 Bcm of expected
gas deliveries to China via Power of Siberia) have amounted to 131.3 Bcm, up 21.4 Bcm or 19.4 per cent year-on-year.
https://www.gazprom.com/press/news/2021/september/article536637/
3
  By 16 September, European storage was 71 per cent full (73.9 bcm), the lowest on that date as percentage of storage
capacity since 2011 when the statistics became widely available. At the same time, in mid-September the TTF front month gas
futures for October 2021 exceeded $26/MMBtu, setting an all-time record.
4
  See Yermakov V. Shrinking Surplus: The Outlook for Russia’s Spare Gas Productive Capacity – OIES Energy Comment,
2018.
https://www.oxfordenergy.org/publications/shrinking-surplus-outlook-russias-spare-gas-productive-capacity/
5
  See Yermakov V. It Don’t Mean a Thing if It Ain’t Got That Swing: Why Gas Flexibility Is High on the Agenda for Russia and
Europe – OIES Energy Comment, 2019.
https://www.oxfordenergy.org/publications/dont-mean-thing-aint-got-swing-gas-flexibility-high-agenda-russia-europe/

The contents of this paper are the author’s sole responsibility. They do not necessarily represent the views of              2
the Oxford Institute for Energy Studies or any of its Members.
Under pressure: Russia’s gas balance and position in Europe in 2020
Before analyzing the market situation in 2021, it is worth reviewing the overall trends in Russia’s gas
balance and gas exports over the past few years. This will help to explain the rationale behind the
decisions being made by Russia’s gas strategists.
Facing falling demand and hence a weak market in 2020, Russia dramatically reduced its gas output.
Russia’s overall gas production in 2020 declined to 693 Bcm, down 46 Bcm or 6.2 per cent year-on-
year. Gazprom ended up having to assume the role of balancing the market, holding back its own gas
production to 455 Bcm, 47 Bcm lower year-on-year (a 9.3 per cent decline). It absorbed most of the
decline in Russian gas production, while independents 6 and oil companies managed to maintain and
even grow output.
Gazprom has traditionally undertaken this balancing role as part of dealing with seasonal swings in
demand, using its very flexible, super-giant Cenomanian gas fields. However, the situation in 2020 was
quite extreme, requiring immediate ‘on the fly’ adjustments to the production side of the balance on a
scale that could only be managed by Gazprom due to the characteristics of its assets and customer
base. Facing low and even negative export margins (during the lowest point of the price cycle in the
summer of 2020), Russia also drastically reduced its purchases of Central Asian gas. (See Figure 1)
Figure 1: Russia’s gas balance: supply sources

                          900                                                                      812
                                                                                      811
                                                                         770                                    755
                          800      714         694          718                       59           43
                                                                         50           23           27
                          700                                            25                                     40
                                                                                                                10
                                    37         30           51
                                    29         26           23
                          600
                                                                                472          499          501
                    Bcm

                          500            445                       420
                                                      420
                                                                                                                      455
                          400
                                                                         691          725          738          693
                          300      642         635          640

                          200
                          100
                            0
                                  2014         2015         2016         2017         2018         2019         2020

                                  Decrease in the amount of gas within the gas transportation system
                                  Gas withdrawn from underground storage in RF, Latvia and Europe
                                  Other sources (Central Asian and Azeri gas)
                                  Domestic gas production
                                  Natural gas resources
                                  Domestic gas production - Group Gazprom
Source: OIES, data collected by the author from various Gazprom’s public disclosures

On the distribution side, gross domestic gas consumption and gas deliveries to final consumers in 2020
via the unified Gas Transportation System (GTS) declined in 2020 year-on-year by 3.3 and 4.0 per cent
respectively but remained at relatively high levels of 428 Bcm and 340 Bcm. Technical gas used by the
GTS compressor stations to move volumes through the extended pipeline and gas storage network
dropped by 15 per cent to 33 Bcm. Gazprom, facing falling and uncertain demand during 2020,

6
    The term “independents” refers to private Russian gas companies that are neither state-owned nor are Gazprom subsidiaries.

The contents of this paper are the author’s sole responsibility. They do not necessarily represent the views of the
                                                                                                                            3
Oxford Institute for Energy Studies or any of its Members.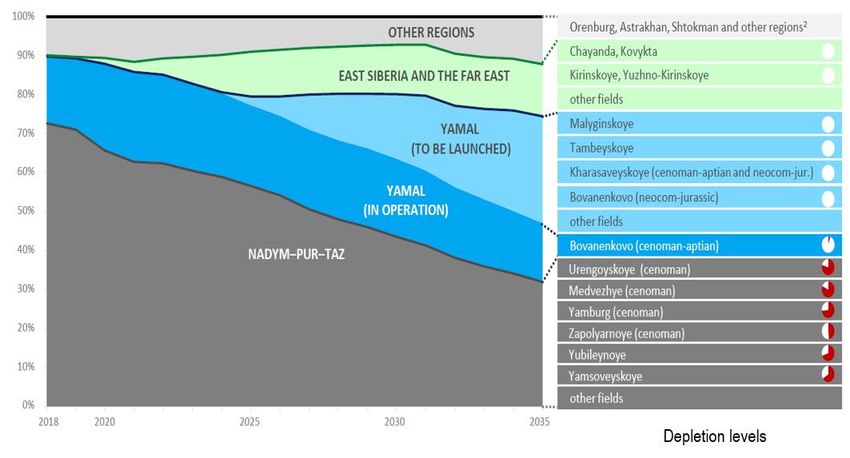
drastically reduced the pumping of gas into its underground gas storage facilities by 20 Bcm, down 38
per cent year-on-year, to 33 Bcm.
Gas volumes delivered to liquefaction plants increased by 2.8 Bcm to 46 Bcm (up 6.5 per cent year-on-
year) with Russian LNG plants on Yamal and Sakhalin working at full capacity and even exceeding it.
The available statistics on Russia’s gas balance do not contain a separate line for exports of LNG, but
most of the gas sent to liquefaction facilities was exported, a total of 39.8 Bcm (29.6 million tons), slightly
up year-on-year.7
Exports of Russian pipeline gas to the so-called ‘Far Abroad’8 in 2020 declined by 11.7 Bcm (or 6 per
cent) and amounted to 181.4 Bcm. This number, however, included 4.1 Bcm of Russian gas deliveries
to China via the Power of Siberia pipeline that started to ramp up last year. Thus, effectively, Gazprom
exports to Europe declined more than to ‘Far Abroad’, by approximately 8 per cent year-on-year.
However, gas exports to CIS countries declined most significantly, by 7 Bcm to 30.7 Bcm (18.6 per cent
year-on-year), on account of lower demand in Belarus and Kazakhstan and also because Gazprom
stopped accounting for gas deliveries to the separatist eastern regions of Ukraine within the category
of ‘exports to CIS countries’ (In 2019 Gazprom reported gas exports to Ukraine at 2.8 Bcm but Ukraine
refused to recognize them as such, reporting zero gas imports from Russia). (See Figure 2)
Figure 2: Russia’s gas balance: distribution

                        900
                                                                                 811         812
                                                                      770                               755
                        800       714                                            37          38
                                              694        718          33                                 31
                        700        42                     32
                                              38                                 200         193
                                                                     197                                 181
                        600       152                     182
                                              163                                 21          43
                        500        14                                 15          56          53         46
                                   42         15          15          53                                 33
                  Bcm

                                              32          29          38          41          38         33
                                   33         32          32
                        400
                                                                                                               340
                        300
                        200       425         411         424        430         453         443         428
                        100
                          0
                                 2014        2015        2016        2017       2018        2019        2020

                                               Gas in GTS - Increase
                                               Pipeline exports to Near Abroad (CIS)
                                               Pipeline exports to Far Abroad
                                               Gas for LNG production
                                               Gas pumped into underground storage
                                               Needs of the GTS and underground storage
                                               Domestic gas consumption
                                               Natural gas distribution
                                               Domestic gas deliveries via GTS

Source: OIES, data collected by the author from various Gazprom’s public disclosures

7
  The difference between reported amounts of gas sent for liquefaction and reported LNG exports is apparently due to
technological losses and own use.
88
   Gazprom uses the conventional category “Far Abroad” for its exports to the countries outside of the Former Soviet Union.
Thus, exports to the Baltic states are excluded from “Far Abroad”. The category CIS refers to Commonwealth of Independent
States, that is the countries formerly part of the Soviet Union with exception of Ukraine, Georgia, and Turkmenistan.

The contents of this paper are the author’s sole responsibility. They do not necessarily represent the views of the
                                                                                                                              4
Oxford Institute for Energy Studies or any of its Members.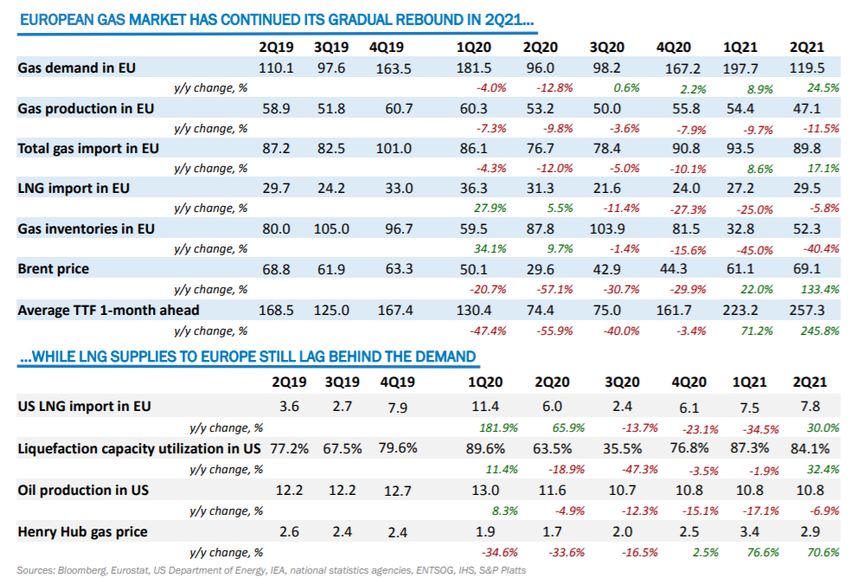
In addition to being the world’s largest pipeline exporter of gas, Russia is now a significant exporter of
LNG. In 2020, Russia became one of the ‘Big Four’ global LNG producers and exporters alongside
Australia, Qatar, and the US.9 Two of Russia’s largest operating LNG projects at present are Sakhalin
LNG in Russia’s Far East in which Gazprom has a majority interest and Novatek’s Yamal LNG on the
Yamal peninsula in the western part of Russia’s Arctic. According to GIIGNL, the distribution of Russian
LNG exports in 2020 was skewed in favour of Europe (18.35 million tons) at the expense of Asia (11.25
million tons), due to the disappearance of the usual Asian premium. Sakhalin LNG stayed in Asia but
deliveries from Yamal LNG mostly ended up in Europe. (See Figure 3)
Figure 3: Global LNG imports and exports in 2020 (flows of LNG in million ton)

Source: GIIGNL Annual Report, 2021

9
 See the following OIES papers for more information on Russian LNG:
Henderson J. and Yermakov V. Russian LNG: Becoming a Global Force, OIES Paper, 2019
https://www.oxfordenergy.org/publications/russian-lng-becoming-a-global-force/
Yermakov V. and Sharples J. A Phantom Menace: Is Russian LNG a Threat to Russia’s Pipeline Gas in Europe? OIES Paper,
2021
https://www.oxfordenergy.org/publications/a-phantom-menace-is-russian-lng-a-threat-to-russias-pipeline-gas-in-europe/

The contents of this paper are the author’s sole responsibility. They do not necessarily represent the views of the
                                                                                                                      5
Oxford Institute for Energy Studies or any of its Members.
Gazprom’s pipeline gas exports have traditionally accounted for about one-third of European gas
consumption.10 Gazprom regularly reports the amounts of gas supplied by major sellers to Europe as
part of its competition analysis and estimates the corresponding market shares. It is worth noting that
for the purposes of this calculation, Gazprom defines gas consumption in the European gas market as
comprising EU-27 without the three Baltic states (historically, Lithuania, Latvia, and Estonia are included
in the so-called ‘Near-Abroad’ category in Gazprom’s reports) but including the UK, Norway,
Switzerland, Serbia, Bosnia and Herzegovina, Macedonia, Albania, and Turkey. Volumes are reported
in Russian calorific standard (8850 kilocalories per cubic meter of gas at 20 degrees Centigrade).
According to Gazprom’s methodology, European gas consumption amounted to 548.6 Bcm in 2018,
560.6 Bcm in 2019, and 539.8 Bcm in 2020, with Gazprom reporting its gas sales to Europe as 200.8
Bcm, 199 Bcm, and 174.9 Bcm respectively (in Russian standard).
Russia’s overall competitive position in the European gas market strengthened during 2015-2019 on
the back of rising demand and falling indigenous production. (See Figure 4)
Figure 4: Market shares of main suppliers of natural gas to Europe

                             45

                             40                                                                 Russia (Gazprom)

                             35                                                                 Norway
     Market share, percent

                             30                                                                 UK

                                                                                                Netherlands
                             25
                                                                                                Algeria (Sonatrach)
                             20
                                                                                                Qatar LNG (Qatargas)
                             15
                                                                                                US LNG
                             10                                                                 Russian LNG

                              5                                                                 Other

                              0                                                                 Russia (pipeline + LNG)
                                  2015   2016   2017   2018   2019      2020

Source: OIES research, data from the market intelligence sections of various Gazprom reports

Russia has also diversified its mode of gas delivery and has become one of the main LNG importers to
Europe in the past three years. As shown in Figure 4, Gazprom’s share of European gas consumption
peaked at 36.6 per cent in 2018, and Russia’s overall share (for both pipeline and LNG) reached 39 per
cent that year. Russian pipeline gas market share returned to its more ‘normal’ 32.4 per cent in 2020
as Gazprom had to accommodate the inflow of global LNG during the first half of 2020. At the same
time, the shares of other pipeline gas suppliers to Europe have been declining since 2015. Conversely,
LNG imports to Europe have been on the rise as the loose global gas market made Europe the
destination of last resort for flexible LNG volumes, especially during 2020. It is worth noting that Russian

10
  According to Gazprom’s Investor Day 2021 presentation, Gazprom accounted for 32.2 per cent of consumption and 56 per
cent of imports in Europe in 2020 (see page 31)
https://www.gazprom.com/f/posts/23/378358/invest-day-2021-presentation.pdf
Gazprom’s share in 2016-19 is given in the 2020 Investor Day presentation (page 21)
https://www.gazprom.com/f/posts/64/716836/investor-day-2020-presentation.pdf

The contents of this paper are the author’s sole responsibility. They do not necessarily represent the views of the
                                                                                                                          6
Oxford Institute for Energy Studies or any of its Members.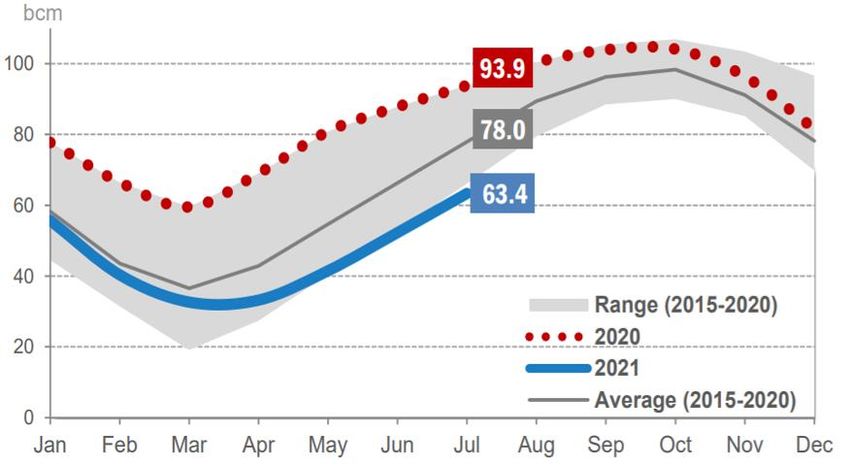
LNG from Yamal was part of this ‘rising tide’ of LNG deliveries, which helped keep the overall share of
Russian gas in Europe (pipeline and LNG combined) at 35.3 per cent in 2020.11

Lessons from the loose gas market of 2020: Gazprom accommodates supply
glut in Europe
During 2020 Russia demonstrated that it could assume the role of a short-term market balancer and
substantially swing its gas production in response to shifts in demand. But it is important to note that
the stress-test was one-sided, as Russia had to deal with a sudden decline in export demand for its
gas, not with a sudden demand spike.
The winter of 2019/2020 was one of the warmest on record, reducing the need for gas used for heating
in buildings as well as heating-related electricity consumption. The impact of the pandemic and the
triple whammy of a warm and windy winter, record European storage levels, and readily available LNG
at exceptionally low prices dramatically reduced Europe’s call on Russian pipeline gas in 2020. As a
result, Gazprom had to accommodate almost all the decline in European gas consumption. (See Figure
5)
Figure 5: Incremental y-o-y changes in European imports by supplier, 2018-2020

           20

           15
                                                      2018     2019     2020
           10

            5

            0
     Bcm

            -5

           -10

           -15

           -20

           -25

           -30
                   Russia     Norway          UK       Netherlands      Algeria   Qatar LNG        US LNG     Russian LNG
                 (Gazprom)                                            (Sonatrach) (Qatargas)

Source: OIES, data from Gazprom and GIIGNL

It is noteworthy that for the bulk of its European gas exports, Gazprom must meet nominations from its
European buyers and is effectively demand-constrained. This stems from one of the key characteristics
of Gazprom’s long-term contracts: the embedded flexibility in take-or-pay clauses provided by the wide
delta between minimum contracted volumes that buyers may nominate and maximum contracted
volumes that Gazprom has to supply should buyers make the nominations. Furthermore, if buyers do

11
  The data presented in Figure 4 was reported by Gazprom in its Annual Reports for 2019 and 2020. Its sources include
national statistics offices of various countries, Eurostat, and industry consultants. Gazprom converted the data to Russian
standards (calorific value of 8,850 kcal/cu m at 20°C). The data on Russian LNG exports was reported by GIIGNL in its Annual
Reports.

The contents of this paper are the author’s sole responsibility. They do not necessarily represent the views of the
                                                                                                                            7
Oxford Institute for Energy Studies or any of its Members.
not take the minimum contracted volumes in any given year, they can pay and take the volumes over
the next several years (the so-called ‘make-up’ gas).12
In 2020 the gas glut in Europe emerged even before the full extent of the COVID-19 threat became
obvious. The global gas market had been oversupplied for some time due to the emergence of new
LNG supply during 2018-2019 from projects which took investment decisions in the mid-2010s. These
supply additions entered the market at a time when global demand failed to meet growth expectations.13
As the COVID-19 lockdowns unfolded during March-April 2020, the existing over-abundance of gas
was exacerbated. This resulted in record levels of European gas storage by the beginning of spring
2020 and downward pressure on European hub prices. It is noteworthy that gas in storage by the start
of the heating season of 2019/20 was already at high levels. At the end of December 2019, an end-of-
year record of 91.5 Bcm – 20 Bcm higher than at the end of 2018 – was registered.14 This can be
partially explained by the fact that fears of ‘no deal’ over transit with Ukraine at the end of 2019 had
incentivized Europeans to purchase Russian gas over and above ’normal’ levels and put it in storage;
the flip side of this was reduced deliveries at the beginning of 2020 when the transit deal with Ukraine
removed the supply risks.15 This may have impacted the relative balance between Gazprom’s sales in
2019 and sales in 2020: higher volumes were ‘sold and delivered’ in 2019 but not consumed until 2020
than is usually the case, thus making Gazprom’s sales in 2019 appear slightly higher and Gazprom’s
sales in 2020 slightly lower.
Meanwhile, gas prices at the European gas hubs crashed through the $3/MMBtu level in April 2020 and
went below $2/MMBtu in May. Similarly, spot gas prices in Asia went into a deep dive in the spring and
by June prices at all key benchmarks – Henry Hub, TTF, and Asia spot – had converged at sub-
$2/MMBtu levels. The differential between TTF and Henry Hub became negative in summer, closing
the transatlantic arbitrage for US LNG. Overall, the gas glut was pressuring suppliers who had been
struggling to cover their short-run marginal costs (SRMC) and taking heavy losses with regards to total
costs.
In these circumstances, Russian pipeline gas exports to Europe emerged as a key balancing factor,
especially during the first half of 2020, when they declined by 18.4 Bcm year-on-year, becoming the
main source of accommodation for the growing supplies of LNG that were entering Europe as a market
of last resort.
The evidence from 2020 clearly demonstrates that Gazprom refrained from engaging in a price war in
a situation of falling demand which it apparently considered painful but transitory. Russia is one of the
lowest cost gas suppliers, but even for Gazprom the sub-$2 gas price in Europe did not cover short-run
marginal supply costs (including export tax). Expecting a recovery in demand, Gazprom was patiently
acting as a price taker and was optimizing its sales strategy to minimize losses. The dynamics of
Gazprom’s sales at its Electronic Sales Platform (ESP) provides an instructive example of such
adjustment, especially for the period covering the ‘worst’ of the glut combined with the greatest impact
of the pandemic. In Q2-3 2019, Gazprom sold 9.5 bcm on the ESP. In Q2-3 2020, this figure rose to
15.25 bcm. However, in Q2-3 2019, no volumes were sold for delivery in 2020 or further ahead. In Q2-
3 2020, 4.7 bcm was sold for delivery in 2021 or 2022. So, in mid-2020, ESP sales for near-term delivery
were relatively flat year-on-year, and the only increase was in sales for delivery further into the future.
12
In previous years, the take-or-pay level was widely reported as 85 per cent of the ACQ, but there have been reports more
recently that for some contracts, the ToP level was reduced further.
13
OIES Quarterly Gas Review, May 2020
https://www.oxfordenergy.org/wpcms/wp-content/uploads/2020/05/Quarterly-Gas-Review-Issue-9.pdf
14
OIES Quarterly Gas Review, May 2020
https://www.oxfordenergy.org/wpcms/wp-content/uploads/2020/05/Quarterly-Gas-Review-Issue-9.pdf, p.16
15
See Pirani S., Sharples J., Yafimava K., Yermakov V. Implications of the Russia-Ukraine gas transit deal for alternative
pipeline routes and the Ukrainian and European markets. OIES Insight, March 2020
https://www.oxfordenergy.org/publications/implications-of-the-russia-ukraine-gas-transit-deal-for-alternative-pipeline-routes-
and-the-ukrainian-and-european-markets/
The contents of this paper are the author’s sole responsibility. They do not necessarily represent the views of the
8
Oxford Institute for Energy Studies or any of its Members.It is also noteworthy that the developments in the European gas market have forced Gazprom to accept
gas-on-gas pricing which has taken over from oil indexation in the majority of Gazprom’s contracts.
Currently, Gazprom sells most of its gas in Europe under long-term contracts with mixed pricing
mechanisms,16 and as a result, Gazprom now has to accept not only the volume risk, but the price risk
as well. (See Figure 6)
Figure 6: Types of pricing mechanism in Gazprom contracts in 2019
Oil indexation,
16.5%
Hub indexation, Quasi-oil
56.7% indexation,
15.5%
Trading and
ESP, 11.3%
Source: Gazprom
European hubs have been an important clearing mechanism for the LNG market and have been
influencing LNG spot prices. Exporters of LNG from Qatar and the US gained market share in Europe
in the first half of the year, with US LNG seeing the biggest advances with an incremental increase in
deliveries amounting to 9.8 Bcm.
Big bounce for Gazprom exports in 2021
The gas market pendulum started to swing from abundance to tightness during the spring of 2021 and
by the end of the summer had gained such momentum that gas prices started to set new records in
Europe almost daily from the beginning of September. After a relatively warm winter of 2020, this year’s
winter in Europe was colder. Asian markets offered a considerable price premium for LNG, and most
of the flexible LNG volumes headed for China and other Asian countries. In Europe, a long cold spring
extended the heating season, while the re-opening of business activity increased economic growth. As
a result, European gas demand rose robustly, by almost 25 per cent year-on-year in Q2 2021.
Meanwhile, indigenous European gas production declined more than 10 per cent year-on-year in the
first six months of the year, with Norway, UK, and the Netherlands all producing less gas than in the
previous year. This combination of factors resulted in a much higher call on imports and has turned the
spotlight onto Gazprom as the largest gas exporter to Europe.17 (See Figure 7)
16
https://www.gazprom.ru/f/posts/64/716836/investor-day-2020-presentation.pdf
17
The information presented in Figure 5 has been compiled by Gazprom from various sources, including national statistical
agencies and industry consultants and disclosed in Gazprom’s presentation to investors on August 31, 2021.
https://www.gazprom.ru/f/posts/57/982072/gazprom-ifrs-6mnth2021-presentation.pdf
The contents of this paper are the author’s sole responsibility. They do not necessarily represent the views of the
9
Oxford Institute for Energy Studies or any of its Members.Figure 7: Key market indicators
Source: Gazprom
Gazprom indeed responded to the call and increased its exports to Europe (including Turkey), almost
up to the pre-crisis levels of 2019. Algeria was another supplier which boosted its exports to Europe in
1H 2021. (See Figure 8)
Figure 8: Main gas suppliers to Europe in 1H of 2019, 2020, and 2021
120
100 96 95
78
80
66
62 60
bcm
60
40
29
22 23 20
20
17 17 15 16 18 17 16
12 11 12
8
0
Russia Norway UK Netherlands Algeria Qatar LNG US LNG
(Gazprom) (Sonatrach) (Qatargas)
1H 2019 1H 2020 1H 2021
Source: OIES research, data from the market intelligence sections of various Gazprom reports
The contents of this paper are the author’s sole responsibility. They do not necessarily represent the views of the
10
Oxford Institute for Energy Studies or any of its Members.Russia’s national customs statistics, one of the few remaining sources of publicly available information
about Russian aggregated natural gas exports, are presently available through June 2021. They contain
the aggregate numbers for volumes and value (and, therefore, the effective average sales price) of total
Russian gas exports to ‘Far Abroad’ (primarily Europe, since Russian pipeline gas deliveries to China
only started in 2020 and are expected to account for about 5 per cent of the total in 2021) and to CIS
countries.18 (See Figure 9)
Figure 9: Russian exports of pipeline natural gas: volume and price dynamics, 2019-2020
25 250
20 200
15 150
$/Mcm
10 100
Bcm
5 50
0 0
Jan Feb Mar Apr May Jun Jul Aug Sep Oct Nov Dec
Export volumes 2019 Export volumes 2020 Export volumes 2021
Price 2019 Price 2020 Price 2021
Source: OIES, data from Russia’s Customs Service
As can be seen in Figure 9, both the volume and price of Russian gas bounced back strongly in the first
half of 2021, and we are now seeing gas prices reaching record highs in Europe in Q3 2021.
The reported statistics on Gazprom exports to Europe by country in the first half of the year in 2019-21
are presented in Table 1.
18
As stated earlier, Russia’s customs statistics provide the average price for total Russian pipeline gas exports, to both ‘Far
Abroad’, and the CIS countries. Among the latter category, Belarus has been the largest importer of Russian gas by far,
accounting for about 10 per cent of total pipeline exports. The price of Russian gas for Belarus has been fixed at $127/Mcm in
2020 and the same price was agreed for 2021.
The contents of this paper are the author’s sole responsibility. They do not necessarily represent the views of the
11
Oxford Institute for Energy Studies or any of its Members.Table 1. Russian pipeline gas exports by country, 1H 2019-21 (Bcm)
Incremental
Change, Percentage
2021/2020 Change,
1H 2019 1H 2020 1H 2021 Bcm 2021/2020
Western Europe and Turkey 75.3 60.1 77.2 17.1 29%
Germany 27.0 20.1 28.9 8.7 43%
Italy 11.7 10.0 11.4 1.4 14%
Turkey 8.1 4.7 14.6 9.9 209%
France 6.5 5.7 6.6 0.9 15%
Finland 1.4 0.8 1.0 0.3 36%
Austria 7.4 6.6 5.4 -1.2 -18%
Greece 1.5 1.3 1.6 0.3 24%
Netherlands 3.7 5.6 4.2 -1.4 -25%
Switzerland 0.1 0.1 0.2 0.1 62%
Denmark 0.7 0.8 1.0 0.1 18%
UK 6.1 3.0 1.7 -1.3 -42%
Belgium 1.1 1.3 0.6 -0.7 -51%
Central Europe 20.9 17.7 17.8 0.1 0%
Hungary 5.3 3.7 3.9 0.2 5%
Poland 4.3 4.4 5.2 0.8 19%
Slovakia 2.4 3.8 2.5 -1.3 -35%
Czechia 4.2 2.6 0.9 -1.7 -64%
Romania 0.5 0.3 1.2 0.9 264%
Bulgaria 1.4 1.0 1.5 0.4 43%
Serbia 1.0 0.5 1.2 0.7 134%
Slovenia 0.1 0.1 0.3 0.2 110%
Bosnia & Herzegovina 0.1 0.1 0.1 0.0 12%
Macedonia 0.1 0.1 0.0 -0.1 -62%
Croatia 1.4 1.0 0.8 -0.1 -13%
Near Abroad 17.5 14.7 16.1 1.4 9%
Ukraine 1.5 0.0 0.0 0.0 n/a
Belarus 10.1 9.1 10.1 1.0 11%
Moldova 1.5 1.5 1.7 0.2 13%
Lithuania 0.7 0.3 0.3 0.0 12%
Latvia 0.6 0.7 1.0 0.3 50%
Estonia 0.2 0.2 0.0 -0.1 -76%
Kazakhstan 1.6 1.7 1.5 -0.2 -10%
South Ossetia 0.0 0.0 0.0 0.0 0%
Armenia 1.0 1.1 1.2 0.1 10%
Georgia 0.1 0.1 0.0 -0.1 -95%
Kirgyzstan 0.1 0.2 0.2 0.0 20%
Pipe to China 0.0 1.6 4.6 3.0 194%
Total 113.7 94.1 115.7 21.6 23%
Source: OIES, data from Gazprom
The contents of this paper are the author’s sole responsibility. They do not necessarily represent the views of the
12
Oxford Institute for Energy Studies or any of its Members.Exports to the three largest purchasers of Gazprom gas in Western Europe were up in the first six
months of 2021 compared with the same period of 2020: an increase of 8.7 Bcm in Germany (up 43
per cent), up 1.4 Bcm in Italy (up 14 per cent), and an increase of 9.9 Bcm in Turkey (up 209 per cent).
Total exports to Western Europe and Turkey grew to 77.2 Bcm, up 17.1 Bcm or 29 per cent year-on-
year. This was, in fact, higher than in the pre-crisis first half of 2019.
Gazprom’s exports to Central Europe did not change fundamentally year-on-year. This reflected the
reduction of ship-or-pay transit volumes via Ukraine from 65 Bcm per annum in 2020 to 40 Bcm per
annum since 2021 in accordance with the transit deal. Lower volume commitments via Ukraine in 2021-
2024 are due to the fact that the start of Turk Stream allowed Gazprom to replace deliveries to western
Turkey via the Trans Balkans pipeline (transiting Ukraine) with direct deliveries. Gazprom also started
to supply Bulgaria via Turk Stream instead of via Ukraine. In the future it intends to switch more
countries in Central Europe (Serbia and Hungary in particular) to deliveries via Turk Stream.
In the near abroad, Belarus increased its gas purchases by 1.0 Bcm in the first six months of 2021 (up
11 per cent year-on-year). Gazprom continues to report zero exports to the Donetsk and Lugansk
regions in Ukraine this year compared with 1.5 Bcm reported in the first six months of 2019.
Russian pipeline gas exports to China continued to ramp up according to plan and are set to amount to
10 Bcm for the full year of 2021.
But the ‘Big Bounce’ in Gazprom’s exports to Europe in 2021 has been due to the dynamics in two
markets: Germany and Turkey. How to explain this? One part of the explanation for the strong bounce
back has a lot to do with scale and the price optimization strategies of the buyers. Gazprom’s supplies
to Germany fell by 25 per cent year-on-year in H1 2020, representing the largest incremental decline
in Gazprom’s export deliveries portfolio. This swing down of demand was very much the result of warm
weather and over-abundance of LNG at rapidly declining prices that gave the holders of Gazprom
contracts in Germany an opportunity to optimize their portfolios by reducing the share of more expensive
Gazprom gas to the minimum contract volumes (sales to Germany are based on gas-indexed formulae
that contain a time lag to spot prices) and replacing it with cheaper spot LNG.
In Turkey this effect was greatly exaggerated by oil-indexation and a six-month time lag between oil-
indexed prices in the formula and the spot gas price. Gas buyers in Turkey knew well in advance the
price trajectory of the gas that they might acquire from Gazprom: in the beginning of 2020 it was still
based on relatively high pre-pandemic oil prices in the middle of 2019, but the price was set to decline
dramatically by the end of 2020/beginning of 2021 to reflect the extremely low oil prices in
spring/summer of 2020.
As a result, the rational behavior of buyers in Germany and Turkey was to lower their nominations under
contracts with Gazprom in the first half of 2020 to the bare minimum and to shift their take-or-pay
obligations forward in time into the second half of 2020 and 2021.
New configuration of Gazprom export flows
Yet another explanation for the ‘Big Bounce’ has to do with the changing configuration of Russia’s gas
export pipelines and gas flows. The data in the previous section shows that Gazprom responded to
higher contractual nominations by its counterparties during H1 2021 with an almost 30 per cent increase
in its overall exports to Western Europe and Turkey, with the bulk of the increase occurring in just two
markets: Turkey and Germany. It is no coincidence that both these countries are connected with
Russian gas supplies by direct undersea pipelines: Blue Stream and Turk Stream in the case of Turkey,
and Nord Stream 1 in the case of Germany.
According to the transit deal between Gazprom and Naftogaz of Ukraine signed at the end of 2019,
Gazprom agreed that it would pay Naftogaz for transit of 65 Bcm in 2020 and for 40 Bcm each year
during 2021-2024. These payments do not depend on the actual gas flows via Ukraine, as the deal is
essentially ship-or-pay. At the same time, Gazprom launched its new 31.5 Bcm Turk Stream pipeline in
January 2020. The physical construction of Nord Stream 2 was completed in September 2021, and
The contents of this paper are the author’s sole responsibility. They do not necessarily represent the views of the
13
Oxford Institute for Energy Studies or any of its Members.Gazprom is awaiting a decision from the German regulator, BNetzA, on the terms of its use. Without
the continuation of robust gas demand growth in Europe in the next few years, Gazprom will have to
make two important choices regarding its emerging export pipeline capacity surplus: first, which export
routes to load up to their maximum capacity and which to leave underutilized, and second, which routes
to use for covering seasonal flexibility needs and during the maintenance of the undersea pipelines.
It would be logical to expect that Gazprom’s top priorities for maximum load are going to be new direct
pipelines from Russia to its target markets: Nord Stream, leading to Northwest Europe, and Turk
Stream, leading to Western Turkey and on to Southeast Europe. The reasons are as follows: primarily,
Gazprom prioritizes shipments via the routes that avoid third-country transit risk. But another major
consideration is economics: the payments for the cost of transportation via Nord Stream and Turk
Stream to the Gazprom subsidiaries that run these pipelines are mere transfers within the overall
Gazprom corporate structure, and preferable to the transit fees that Gazprom has to pay to transit
countries.
Besides, the reduction in the overall transportation distance from the designated source of supply in
Russia to the target market in Europe compared with the alternatives results in reduced transportation
costs and improves Gazprom’s export margin. Additionally, new, state-of-the-art pipelines allow higher
operating pressures and require less maintenance and repair, which also improves the economics of
the direct routes.
Indeed, Nord Stream 1 utilization amounted to 58.7 Bcm, 58.5 Bcm, and 59.3 Bcm in 2018, 2019, and
2020 respectively (exceeding the nameplate capacity of the pipeline by 6-8 per cent). This was helped
by the start of the EUGAL pipeline that allowed Gazprom to overcome the regulatory restrictions
imposed on the full use of the OPAL pipeline. The start of flows via Nord Stream 2 is going to bring the
issues of regulatory restrictions on the use of the full capacity of the Russian gas pipeline back to centre
stage.
Russian gas exports via Turk Stream amounted to 13.5 Bcm in 2020 (43 per cent utilization of 31.5
Bcm combined capacity of the two strings). It is expected to ramp up utilization with the redirection of
deliveries to Serbia and Hungary away from the Ukrainian route when the pipeline connections to these
countries become fully operational.
For volumes going into Nord Stream, the argument about a shorter travel route and lower delivery costs
for gas from Yamal is quite obvious. This argument is less apparent for Russian gas that is delivered to
Central Europe transiting Turkey via Turk Stream and to Turkey for its own consumption via Turk
Stream and Blue Stream. But it is important to realize that Gazprom uses the principle of substitution,
optimizing transportation distances geographically with regards to the source of supply and temporally
with regards to demand seasonality: a significant share of gas that flows to Turkey originates not in
Western Siberia but from the gas fields located in Russia’s lower Volga and Southern regions. To add
to this pool of available gas resources, Russian oil companies produce associated gas in Russia’s south
from their oil fields. Besides, Russia imports gas from Central Asia and re-exports it. The transportation
distances for these sources of gas to the target markets are significantly lower than for gas from
Western Siberia.
It is worth noting that gas deliveries to domestic users in Russia’s southern regions exceed the volumes
from the supply sources listed above (especially after the significant reduction of imports from Central
Asia in 2020) on an annual basis. But demand in Russia’s southern regions is very seasonal, reflecting
the larger proportion of residential users and a lower share of industrial users. As a result, Gazprom is
actively using withdrawals from gas storage (Russia’s largest gas storage facility, Severo-
Stavropolskoye is in the south) to meet peak export and domestic demand requirements in winter and
refills the storage by delivering gas from Western Siberia during the summer trough when domestic
demand is lowest.
With regards to the third-country transit routes (via Ukraine and Poland), prior to 2020 it was Ukraine
that had underutilized capacity and was the prime provider of flexibility for Gazprom’s flows to Europe.
The contents of this paper are the author’s sole responsibility. They do not necessarily represent the views of the
14
Oxford Institute for Energy Studies or any of its Members.In 2018 Gazprom transited 86.8 Bcm via Ukraine, an amount estimated to be equal to about 65 per
cent of Ukraine’s available transit capacity to Europe that year. In 2019 Russian gas transit through
Ukraine rose by 3 per cent, to 89.2 Bcm. It is noteworthy that Gazprom only had to pay for the actual
transited volumes under the terms of its previous contract with Naftogaz.
The new deal with Ukraine, however, is different. According to the agreement, the ship-or-pay terms
are not flexible, with the annual booked capacity of 65 Bcm in 2020 and 40 Bcm in 2021-2024 being
spread by way of equal daily bookings – 178.1 mmcm/d in 2020 and 109.6 mmcm/d in 2021-2024.
Ukraine, thus, has managed to secure transit revenue irrespective of actual flows of Russian gas via its
system through the end of 2024. The transit fee via Ukraine is significantly higher than for Nord Stream
and Yamal-Europe on a unit per km basis, making any additional bookings of transit capacity via
Ukraine (over and above the pre-paid ship-or-pay volumes) the least attractive option economically for
Gazprom. As a result, transit flows via Ukraine declined sharply, to 55.8 Bcm in 2020. They are
expected to decline further this year to just around the pre-paid 40 Bcm.
The dynamics during 2021 have been as follows: daily average transit flows via Ukraine (excluding
deliveries to Moldova) have been 107.3 mmcm/d from 1 January to 31 August, equating to an annual
equivalent of 39.2 bcm. Aside from January 2021 (when Gazprom booked around 41.6 mmcm/d of
extra capacity), Gazprom booked 15 mmcm/d of firm monthly capacity via Ukraine – the exact amount
offered by GTSOU, the Ukrainian gas pipeline operator. This was also the maximum amount covered
by the Russia-Ukraine interconnection agreement on the Russia-Ukraine border.19
The switch to the ship-or-pay arrangement with Ukraine has made the Yamal-Europe pipeline the
balancing transit route for Gazprom for the near term, and a potential source of additional flexibility for
Europe. At the same time, this route via Poland remains very exposed to the risk of lower utilization on
an annual basis if European demand for Russian gas declines, and also at risk of uneven utilization
throughout the year due to demand seasonality. Additionally, after the expiration of the Ukraine transit
deal at the end of 2024, Poland and Ukraine might end up competing against each other to secure the
incremental Russian transit volumes. This also explains the opposition of both countries to Nord Stream
2 and their attempt to limit its utilization.
To summarize, the impact of the new configuration of Gazprom’s export flows to Europe has been as
follows: direct flows to the EU have been growing (save for short maintenance periods in summer), the
Ukraine transit profile in 2021 was essentially flat, and transit via Yamal-Europe (Belarus and Poland)
has become a balancing route. The data provided by Gazprom for its exports to the EU does not include
gas flows to Turkey via Blue Stream and Turk Stream and this helps explain the seeming contradiction
between the lower total flows to the EU in the chart and rising levels of Gazprom exports to Europe
(including Turkey) reported by Gazpromexport. Most of the decline in Ukrainian transit which related to
deliveries to South Europe and the Balkans has been compensated by Russian gas transit to these
countries via Turkey by way of direct pipelines under the Black Sea. (See Figure 10)
Figure 10: Gazprom pipeline gas deliveries to the EU via main routes
19
The results of the capacity auctions relating to Ukrainian transit are available here:
https://ipnew.rbp.eu/rbp.eu/#capacityauctions
The contents of this paper are the author’s sole responsibility. They do not necessarily represent the views of the
15
Oxford Institute for Energy Studies or any of its Members.350
300
Million cubic meters per day
250
200
150
100
50
0
01-May-20
01-Jul-18
01-May-18
01-May-19
01-May-21
01-Jan-18
01-Jan-19
01-Jul-19
01-Jan-20
01-Jul-20
01-Jan-21
01-Jul-21
01-Sep-18
01-Nov-18
01-Sep-19
01-Nov-19
01-Sep-20
01-Nov-20
01-Sep-21
01-Mar-18
01-Mar-19
01-Mar-20
01-Mar-21
Via Belarus Via Ukraine Directly to EU
Source: OIES, data from Gazprom
The analysis conducted by my OIES colleague Jack Sharples on Russian gas flows via Turkey based
on reported statistics by the Turkish Energy Market Regulatory Authority (EMRA) demonstrates a robust
ramp-up of Russian gas flows to Turkey since summer 2020. This is partly the result of a higher call on
Russian gas by Gazprom’s Turkish buyers due to the favourable oil-indexed pricing in 2021 and partly
the consequence of Turkish demand recovery. However, it is also due to the redirection of the gas flows
that were arriving to Turkey and Southern Europe via the Trans Balkans pipeline in favour of the newly
constructed Turk Stream. (See Figure 11)
Figure 11: Russian gas flows to/via Turkey
Source: OIES research
The contents of this paper are the author’s sole responsibility. They do not necessarily represent the views of the
16
Oxford Institute for Energy Studies or any of its Members.Higher call on Gazprom gas in Europe tests Russia’s spare productive capacity
An obvious, but often forgotten, characteristic of a swing supplier is that the ability to constrain and then
quickly revive production to the levels of pre-crisis demand is different from the ability to increase it
beyond a previously achieved record level.
Russian gas output in 2021 not only returned to its previous highs but has exceeded them, especially
in Q2 2021. (See Figure 12)
Figure 12: Russia’s gas output by quarter, 2015-2021 (Bcm)
250
200
150
100
50
0
2015 2016 2017 2018 2019 2020 2021
Q1 Q2 Q3 Q4
Source: OIES research
Specifically, Russian gas production totaled 377 bcm in 1H 2019, fell to 351 bcm in 1H 2020, and
rebounded to 394 bcm in 1H 2021. In 1H 2021, Russian gas output was 17 bcm (4.5 per cent) higher
than in the pre-crisis (1H 2019). This is substantial, but the real manifestation of the ‘bounce’ has been
its ability to drop production down by 26 Bcm y-o-y in 1H 2020 compared with 1H 2019 and then ramp
it back up by 43 bcm in 1H 2021 compared with 1H 2020.
With faster-than-expected European gas market rebalancing and tightening in 2021, the question is:
has the call on Russian gas exceeded available productive capacity in the near term?
We discussed the issues of spare Russian gas productive capacity in our earlier research.20 The data
on Gazprom production by its main fields suggests that Gazprom raised its output to record daily levels
at fields that had spare productive capacity in the past and has not had near-term spare capacity left
during 2021. (See Figure 13)
20
See Yermakov V. Shrinking Surplus: The Outlook for Russia’s Spare Gas Productive Capacity – OIES Energy Comment,
2018.
https://www.oxfordenergy.org/publications/shrinking-surplus-outlook-russias-spare-gas-productive-capacity/
The contents of this paper are the author’s sole responsibility. They do not necessarily represent the views of the
17
Oxford Institute for Energy Studies or any of its Members.Figure 13: Gazprom daily gas production by main fields in 1H 2021/2020 (million m3 per day)
322
297 301
282
269
252 252 252
174
164
69 65
29 33 27
9
1H-2020 1H-2021
Source: OIES research, data from Gazprom
Furthermore, in Q2 2021 the usual seasonal decline in output was not seen (compared to a very
pronounced fall during 2020 which mostly accounted for the lower annual production that year). During
Q2 2021 Gazprom was continuing to ‘fire on all cylinders’ in an attempt to satisfy the growing demand
at home and abroad. (See Figure 14)
Figure 14: Seasonal swing in Gazprom’s natural gas production from main fields in 2020-21
160.0
140.0
120.0
100.0
Bcm
80.0
60.0
40.0
20.0
0.0
Q1-2020 Q2-2020 Q3-2020 Q4-2020 Q1-2021 Q2-2021
Gazprom - other fields Urengoyskoye Zapolyarnoye Yamburgskoye
Chayandinskoye Yuzhno-Russkoye Astrakhanskoye Bovanenkovskoye
Source: OIES research, data from Gazprom
The contents of this paper are the author’s sole responsibility. They do not necessarily represent the views of the
18
Oxford Institute for Energy Studies or any of its Members.While Russia (and Gazprom) is not running out of natural gas - in fact, Gazprom’s CEO Alexey Miller
stated on September 17 that its reserves are estimated to cover about 100 years of demand at current
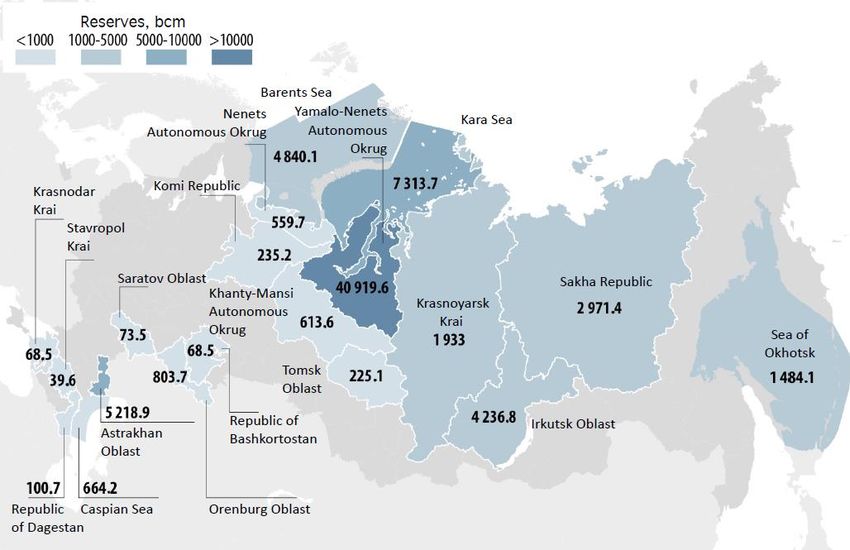
levels21 - the geography of supplies is changing. (See Figure 15)
Figure 15: Proved natural gas reserves by subject of Russian Federation as of 31 Dec 2019, Bcm
Source: OIES, data from Russia’s Ministry of Natural Resources
For almost forty years, Russia’s gas output has been supported by the Soviet legacy of super-giant
Cenomanian gas fields in the Nadym-Pur-Taz (NPT) region in Western Siberia, but these fields are now
in irreversible decline. Gazprom has been trying to manage the output decline by developing wet gas
from deeper layers of the NPT super-giants, initially from Valanginian, and recently from Achimov
deposits, but this can only slow the natural decline of the NPT production, not reverse it.
In order to meet demand, Gazprom has been developing a new gas province on the Yamal peninsula
in the Russian Arctic since the early 2010s, where the Bovanenkovskoye field, the first in a series of
the new super-giants, produced 99 Bcm of gas in 2020. According to Gazprom’s strategy, new gas from
Yamal will eventually replace the declining volumes from NPT in the balance. These investments into
bringing additional productive capacities on Yamal onstream in addition to Bovanenkovskoye area,
however, predicated on Gazprom’s ability to send this gas to the European market via the shortest route
through the so-called northern corridor of Russia’s transportation system and on to the Nord Stream
pipelines. Another part of Gazprom’s production strategy has been the development of gas fields in
Eastern Siberia to supply gas to China via the Power of Siberia pipeline with the possibility of increasing
contract deliveries on this route but also from Sakhalin by a spur to China from the Sakhalin-
Khabarovsk-Vladivostok line. But a real game changer may be a new planned pipeline to China from
Western Siberia via Mongolia that could for the first time create an alternative to supplies to Europe for
Russian gas in Western Siberia. (See Figure 16)
21
https://www.gazprom.ru/press/news/2021/september/article537844/
The contents of this paper are the author’s sole responsibility. They do not necessarily represent the views of the
19
Oxford Institute for Energy Studies or any of its Members.Figure 16: Gazprom production strategy to 2035
Source: Gazprom
The ‘tectonic’ shift in Gazprom’s output - from NPT to Yamal - has important implications for the future
of the gas pipeline infrastructure that delivers Russian gas to Europe. Gazprom is the owner and
operator of the Unified Gas System (UGS), an extensive network of high-pressure, large-diameter trunk
gas pipelines connecting the main production areas in northern West Siberia with domestic consuming
regions in the European part of Russia and extending west to export markets in Europe and the CIS
countries.
UGS comprises three main transportation corridors: the Central, the Northern, and the Southern. The
Central and Southern corridors carry natural gas from the legacy gas fields in the NPT region that have
been producing since Soviet times (some started their production in the early 1970s).
The Northern corridor currently sources most of its supply from a new gas province on the Yamal
peninsula. The new Bovanenkovo-Ukhta and Ukhta-Torzhok pipelines, completed in 2018 with a
capacity of 115 Bcm per annum, were built to evacuate new gas from the super-giant Bovanenkovskoye
field and to bring it to Russia’s northwest and on to Germany via Nord Stream 1 and (in the future) via
Nord Stream 2. This route is a new shortcut from Yamal to Europe, providing Gazprom with significant
cost savings owing to the reduced transportation distance to the target market.
Gazprom’s ability to change the flows and redirect gas from the Northern corridor to the Central corridor
in order to increase gas exports via Ukraine is non-existent during the winter peak (when all available
pipeline capacity is fully utilized) and limited and unfeasible during the summer (due to much higher
transportation costs in Russia and abroad for this route). Gazprom has already announced that it will
be decommissioning the older pipelines in the Central corridor in line with the reduction of flows from
NPT caused by production declines there. Some of these pipelines have been in operation for over forty
years and have passed the limits of their economic life, imposing high repair and maintenance costs on
Gazprom.
This means that the capacity of Russian pipelines leading towards the Ukrainian transit corridor is going
to decline substantially in the future, limiting the volumes of gas available for the Ukrainian route. (See
Figure 17)
The contents of this paper are the author’s sole responsibility. They do not necessarily represent the views of the
20
Oxford Institute for Energy Studies or any of its Members.Figure 17: Russian gas pipeline infrastructure
Source: OIES
The sanctions against Nord Stream 2 have delayed the finalization of the project by eighteen months
and have postponed Gazprom’s investments into ramping up production on Yamal and expanding the
pipeline transportation capacity from the region.
At the main Bovanenkovo field, the near-term nameplate production capacity of 115 Bcm per annum
was reached in 2018, but actual production has ramped up more slowly, reaching 99 Bcm in 2020. In
1H 2021, Bovanenkovo produced 58 Bcm, testing the upper limit of full capacity. The capacity of the
two pipelines built to transport production from the field (see above) matches the 115 Bcm per annum
production capacity of the Bovanenkovo field but some compressors are yet to be added to ensure
these levels of throughput. In the future, Gazprom is planning to bring the overall productive capacity
at Bovanenkovo to 140 Bcm through the development of wet gas from the deeper Neocomian layers of
the field in addition to the gas currently produced from the Cenomanian layers. The technical
implementation of this program has been handed to Gazpromneft because of the necessity to deal with
liquids.
Meanwhile, Gazprom has been aiming at launching production at the Kharasavey field (also on the
Yamal Peninsula) in 2023. Kharasavey is located about 100 kilometers north of Bovanenkovo and
connecting the two fields will enable the injection of Kharasavey gas into the Russian GTS. To
accommodate the additional output from Kharasavey, Gazprom has been planning a third line on the
Bovanenkovo-Ukhta / Ukhta-Torzhok route, also with a launch of 2023. The uncertainty over the
utilization levels of Nord Stream 2 may however lead to a delay in the implementation of these plans
and may restrict the availability of Russian gas for Europe during times of peak demand, such as during
2021. Had Nord Stream 2 been operational in 2020, as originally planned, Europe would most likely not
be facing such a gas deficit and extremely high gas prices this year.
Rising flexibility requirements and gas storage
The question of flexibility is always important for the gas industry because of the seasonal nature of gas
demand. Flexibility is a major concern in Europe because of declining indigenous production which has
provided a significant amount of seasonal swing in the past. Historically, the production swing from the
Dutch Groningen field was key to flexibility in Northwest Europe. With gas output at the field down more
than 40 Bcm in the past five years, a lot of this flexibility has been lost. European gas imports have
The contents of this paper are the author’s sole responsibility. They do not necessarily represent the views of the
21
Oxford Institute for Energy Studies or any of its Members.grown, but they have a flatter seasonal profile than consumption. Moreover, and not only in the past
few years, Europe’s growing call on gas has been met with rising imports from Russia, and the seasonal
demand swing has been also secured by flexible Russian gas deliveries. As we have demonstrated
above, in 2021 the increase in Russian exports proved to be insufficient to meet the rising call on gas
from European buyers and this led to the depletion of European gas storage, which has in turn put
upward pressure on spot gas prices. By the summer, when it became clear that Europe’s storage
injection program was lagging behind, gas price escalation became unstoppable.
Without a doubt, the extremely low levels of gas in European storage this autumn have contributed to
a price spike. Indeed, the combination of weather factors, growing demand and limited supply have
coincided to keep gas storage levels in Europe in 2021 well below usual levels. (See Figure 18)
Figure 18: Gas storage levels in Europe
Source: Gazprom: 2Q IFRS Results, 31 August 2021 – presentation for investors
In our previous research we have argued that “gas flexibility will remain a key concern for Europe,
because of declining indigenous production. At the same time, increasing the call on Russian pipeline
gas exports to Europe, above and beyond the current levels of about 200 Bcm per annum, would require
finding a new, long-term balance of interests between buyers and sellers that would probably require
monetization of the flexibility embedded in Gazprom contracts but not reflected in current pricing
arrangements”.22
Russia’s seasonal flexibility requirements have been relatively stable over the past ten years, growing
slightly in line with the growth in domestic demand. This is linked to the composition of Russia’s gas
demand that also has not changed much, and Russia has been using the combination of production
swing and storage use to meet the seasonal profile of demand. Winter supply is usually organized by
the principle of substitution: demand in the regions located far away from the main centres of supply
necessarily comes from storage which is later replenished.
The seasonal demand in those regions in closer proximity to the supply centres is covered by production
swings. Since the average transportation distances for domestic gas supplies in Russia exceed 2300
kilometers, and average distances to export markets exceed 3000 kilometers with many foreign
destinations being over 4000 kilometers away, it normally takes several days to ship gas over these
long distances.
The statistics on Gazprom’s withdrawals from storage and injection into storage during 2020/21 season
show that the balance was heavily skewed in favour of withdrawals. (See Figure 19)
22
Yermakov V. V. It Don’t Mean a Thing if It Ain’t Got That Swing: Why Gas Flexibility Is High on the Agenda for Russia and
Europe – OIES Energy Comment, 2019, p.26
The contents of this paper are the author’s sole responsibility. They do not necessarily represent the views of the
22
Oxford Institute for Energy Studies or any of its Members.You can also read