Soft, Skin-Interfaced Microfluidic Systems with Passive Galvanic Stopwatches for Precise Chronometric Sampling of Sweat
←
→
Page content transcription
If your browser does not render page correctly, please read the page content below
Communication
Sweat Microfluidics                                                                                                                  www.advmat.de

Soft, Skin-Interfaced Microfluidic Systems with Passive
Galvanic Stopwatches for Precise Chronometric Sampling
of Sweat
Amay J. Bandodkar, Jungil Choi, Stephen P. Lee, William J. Jeang, Prophecy Agyare,
Philipp Gutruf, Siqing Wang, Rebecca A. Sponenburg, Jonathan T. Reeder, Stephanie Schon,
Tyler R. Ray, Shulin Chen, Sunita Mehta, Savanna Ruiz, and John A. Rogers*

                                                                                                      Human eccrine sweat contains a rich
Comprehensive analysis of sweat chemistry provides noninvasive health                                 composition of nearly 60 known physi-
monitoring capabilities that complement established biophysical measure-                              ologically relevant biochemicals including
ments such as heart rate, blood oxygenation, and body temperature. Recent                             metabolites,      electrolytes,   vitamins,
developments in skin-integrated soft microfluidic systems address many chal-                          amino acids, exogeneous drugs, and
                                                                                                      small proteins.[1] Existing skin-interfaced
lenges associated with standard technologies in sweat collection and anal-
                                                                                                      sweat sensors can, however, only detect
ysis. However, recording of time-dependent variations in sweat composition                            a handful of these biochemicals.[2–4]
requires bulky electronic systems and power sources, thereby constraining                             Sophisticated laboratory-based analytical
form factor, cost, and modes of use. Here, presented are unconventional design                        instruments allow for ex situ detection
concepts, materials, and device operation principles that address this chal-                          of a broad scope of analytes beyond this
                                                                                                      limited set, with extreme precision and
lenge. Flexible galvanic cells embedded within skin-interfaced microfluidics
                                                                                                      accuracy.[5,6] Unfortunately, approaches
with passive valves serve as sweat-activated “stopwatches” that record tem-                           in sample collection that use absorbent
poral information associated with collection of discrete microliter volumes of                        pads or microtubes mix sweat obtained
sweat. The result allows for precise measurements of dynamic sweat com-                               throughout the course of a collection
position fluctuations using in situ or ex situ analytical techniques. Integrated                      period, limiting measurements to only
electronics based on near-field communication (NFC) protocols or docking                              time-averaged       compositions.     Such
                                                                                                      methods severely restrict opportuni-
stations equipped with standard electronic measurement tools provide means
                                                                                                      ties for comprehensive understanding
for extracting digital timing results from the stopwatches. Human subject                             of critical time-dependent variations in
studies of time-stamped sweat samples by in situ colorimetric methods and                             sweat composition and their relation to
ex situ techniques based on inductively coupled plasma mass spectroscopy                              human physiology. Recent developments
(ICP-MS) and chlorodimetry illustrate the ability to quantitatively capture                           in the field of soft microfluidics[7] and
                                                                                                      passive capillary burst valves (CBVs)[8,9]
time-dynamic sweat chemistry in scenarios compatible with field use.
                                                                                                      enable sequential collection of pristine

Dr. A. J. Bandodkar, W. J. Jeang, Dr. J. T. Reeder, Dr. S. Mehta, S. Ruiz,     S. P. Lee
Prof. J. A. Rogers                                                             Epicore Biosystems Inc.
Department of Materials Science and Engineering                                Cambridge, MA 02139, USA
Northwestern University                                                        P. Agyare
Evanston, IL 60208, USA                                                        Department of Neuroscience
E-mail: jrogers@northwestern.edu                                               Northwestern University
Dr. A. J. Bandodkar, S. P. Lee, W. J. Jeang, Dr. J. T. Reeder, Dr. S. Mehta,   Evanston, IL 60201, USA
S. Ruiz, Prof. J. A. Rogers                                                    Prof. P. Gutruf
Center for Bio-Integrated Electronics                                          Department of Biomedical Engineering
Simpson Querrey Institute for BioNanotechnology                                University of Arizona
Northwestern University                                                        Tucson, AZ 85721, USA
Evanston, IL 60208, USA
                                                                               S. Wang
Prof. J. Choi                                                                  School of Materials Science and Engineering
School of Mechanical Engineering                                               Tsinghua University
Kookmin University                                                             Beijing 100084, China
Seoul 02707, Republic of Korea
                                                                               R. A. Sponenburg
     The ORCID identification number(s) for the author(s) of this article      Quantitative Bio-Element Imaging Center
     can be found under https://doi.org/10.1002/adma.201902109.                Northwestern University
                                                                               Evanston, IL 60208, USA
DOI: 10.1002/adma.201902109

Adv. Mater. 2019, 31, 1902109                                         1902109 (1 of 9)             © 2019 WILEY-VCH Verlag GmbH & Co. KGaA, Weinheim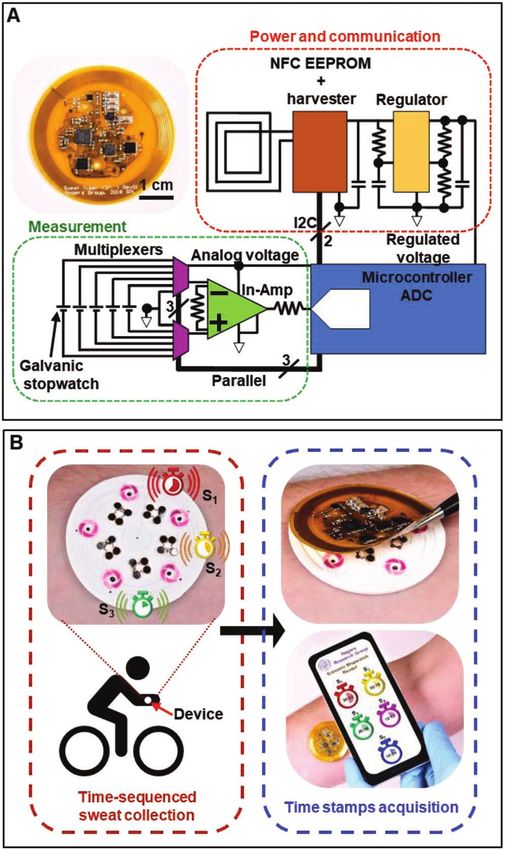
www.advancedsciencenews.com www.advmat.de
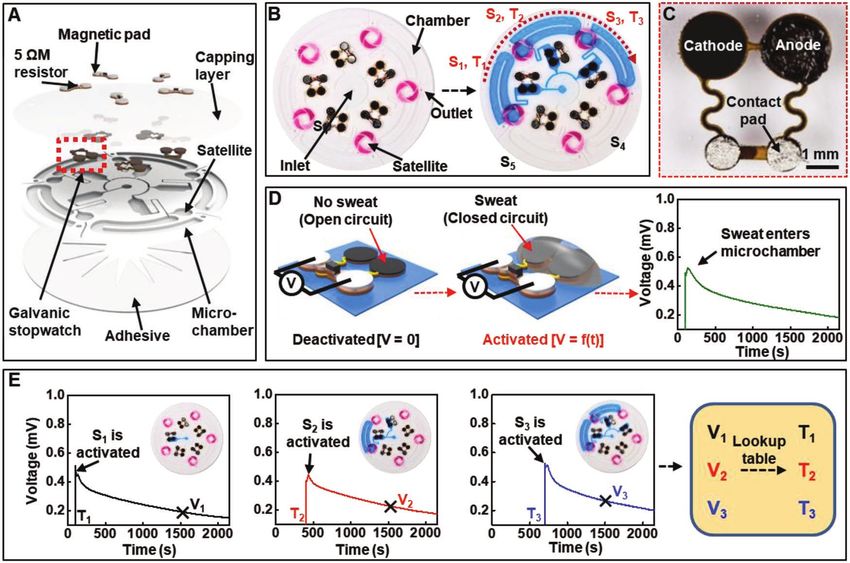
Figure 1. A) Schematic exploded view illustration of a chronosampling soft microfluidic sweat device with embedded galvanic stopwatches.
B) Photographs of the device before and during filling with a blue dye in water. The dotted arrow displays the direction of filling of microchambers.
C) Image of a galvanic stopwatch. D) Diagram illustrating the operation of the stopwatch and a typical voltage–time curve. E) Representative voltage–
time plots demonstrating activation of different stopwatches at different time points corresponding to filling of respective microchambers. A calibrated
lookup table defines the initial filling time of each microchamber based on a measurement of instantaneous stopwatch voltages at any time, as marked
on the characteristic voltage decay plots. Si, stopwatch number; Vi, instantaneous stopwatch voltage; Ti, time at which a stopwatch is activated.
microliter volumes of sweat in a series of chambers, with time-stamping cells as “galvanic stopwatches.” The present
negligible sample intermixing. The inability to determine the work demonstrates these stopwatches in soft microfluidic sys-
time at which each chamber fills prevents the determination tems with five chambers interconnected with passive valves that
of temporal variations in composition. Standard electronic enable chronometric collection of sweat samples with negligible
clocks inserted into the microfluidic system could, in principle, intermixing (Figure 1A). These single-use, low cost sweat col-
record this time information, but this type of approach adds lection systems avoid inadvertent sample contamination caused
cost, bulk, size, and weight to the overall platform, particularly by previous cycles of use. Galvanic cells offer a battery-free
for those that require batteries for power supply. The resulting approach to tracking the dynamics of the filling of sweat into
characteristics reduce the appeal of this design approach for the device. Each chamber captures ≈50 µL of sweat, as a suffi-
demanding use-case scenarios encountered in sports, military, cient sample size for detection of a wide range of analytes using
rehabilitation, and related applications. multiple instruments. Additionally, every chamber includes an
Here, we introduce a unique solution that leverages simple, associated satellite assay zone for in situ colorimetric detec-
inexpensive, spontaneous galvanic cells for in situ time tion of a desired analyte. Skin anatomy and collection area
recording of the sweat collection process. We refer to these dictate the total amount of sweat captured from an individual
for a given period of perspiration. The concepts can easily be
extended to larger, or smaller, numbers of chambers, to address
S. Schon requirements in time resolution and sample volumes. The soft
Department of Mechanical and Process Engineering
ETH Zurich construction of the microfluidic patch supports robust, water-
CH-8092 Zurich, Switzerland tight, irritation-free interfaces to the skin. Carefully designed
Prof. T. R. Ray CBVs direct sweat flow, resulting in sequential filling of the
Department of Mechanical Engineering chambers with negligible intermixing (Figure 1B). The opera-
University of Hawai’i at Mānoa tion of the galvanic stopwatch at the entrance of each chamber
Honolulu, HI 96822, USA
provides a mechanism to determine the collection time of each
S. Chen
sample aliquot.
Department of Biomedical Engineering
Northwestern University Each stopwatch consists of a solid-state anode and cathode
Evanston, IL 60208, USA with a fixed load connected across it (Figure 1C). A redox agent
Adv. Mater. 2019, 31, 1902109 1902109 (2 of 9) © 2019 WILEY-VCH Verlag GmbH & Co. KGaA, Weinheim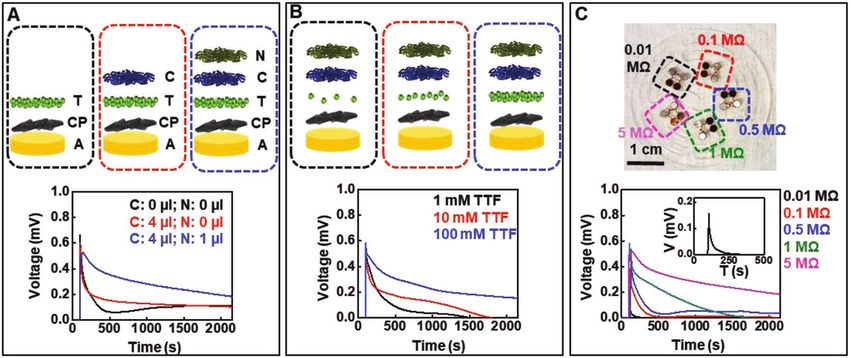
www.advancedsciencenews.com                                                                                                     www.advmat.de

(tertrathiafulvalene) functionalizes the anode while an oxygen
reducing electrode (platinized carbon) acts as the cathode
(Figure S1A, Supporting Information). Figure 1D illustrates the
working principle. In the absence of sweat these stopwatches
behave as open circuits. Exposure to sweat connects the two
electrodes, completing the electrical circuit to generate a voltage
that decays in a well-characterized time-dependent fashion.
As the microchambers fill sequentially, incoming sweat acti-
vates the corresponding stopwatches at different times. The
voltage readings provide a means for determining the time of
collection for each chamber (Figure 1E). These voltages can be
obtained with a battery-free NFC module for use in the field
or a portable data acquisition docking station for application in
controlled settings. These schemes for collection, extraction,
and time tracking provide versatile options for analysis of sweat
dynamics in a manner that is compatible with any in situ or
ex situ analysis technique (i.e., spectroscopy, calorimetry, or
electrochemistry).
   The primary design exploits a reusable NFC data acquisition
module (Figure 2A) that wirelessly transmits voltage values to
a smartphone or other NFC-enabled reader. Design and fabri-
cation details appear in the Experimental Section (Supporting
Information). This lightweight (≈2 g), compact (diameter:
40 mm) platform consists of a thin, laser-patterned flexible
copper–polyimide–copper printed circuit board (fPCB) popu-
lated with commercially available electronic components, each
of which is less than 1 mm in height. As shown in the simpli-
fied schematic illustration in Figure 2A, the system contains a
low-power microcontroller with an integrated analog to digital
converter, NFC electrically erasable programmable memory
(NFC EEPROM) with a power harvester, and an analog signal
conditioning circuit that differentially measures voltage across
each of the galvanic stopwatches. The signal conditioner takes
advantage of the high common-mode rejection of the instru-
mentation amplifier to accurately measure each electrochem-
ical cell and it rejects common-mode potentials that span across
the sweat channel that connects each of the cells. A low cross-
talk 8:1 analog switch multiplexes each of the electrochemical        Figure 2. A) Photograph and schematic illustration of a flexible, battery-
cells to the amplifier to provide the ability to measure several      free NFC electronic system for capturing and wirelessly transmitting
channels while reducing component count. Neodymium mag-               voltages on each stopwatch. B) Flowchart delineating standard device
nets (diameter: 1 mm; thickness: 1 mm) bonded to contacts on          usage consisting of on-body sequential sample collection during physical
the fPCB enable robust, reversible electromechanical attach-          activity (red box) and logging of time stamps using the NFC electronics
                                                                      module (blue box). The smartphone image illustrates a simulated graph-
ment to ferromagnetic pads connected to the contact pads of
                                                                      ical user interface, with a suggestive design.
the galvanic stopwatches embedded within the underlying
microfluidic system.[10] Figure S1B in the Supporting Informa-
tion shows a transverse section schematic illustration of a stop-     to corresponding magnetic contact pads of the stopwatches.
watch embedded in the microfluidic system and interfaced to           Additional features include a slidable housing for a mechanical
a resistive load via a pair of ferromagnetic contact pads and a       punch and micropipette tip slots located around the periphery.
flexible copper support.                                              The high input impedance (10 GΩ), low input bias current
   An alternative approach relies on a docking station that           (100 pA), low cross-talk (−75 dB), and high common-mode
utilizes conventional, battery-powered data acquisition elec-         rejection (100 dB) allow accurate recordings of voltage signals
tronics and additional sweat sample extraction capabilities           generated by the stopwatches.
(Experimental Section, Figure S2A, Supporting Informa-                   The combined system measures the electrochemical cells,
tion). Specifically, this docking station interfaces to a 16 bit,     logs data, and converts the cell voltages to time points based
8-channel data acquisition system capable of sampling at a            on a lookup table preloaded in the software. This table draws
maximum aggregate rate of 400 ksps (National Instruments              upon the average of voltage decay curves of five different stop-
USB-6212) and connects to a display unit (i.e., a laptop com-         watches produced in a single batch. Such curves correspond
puter). Magnetic contacts, similar to those described for the         to continuous measurements of the voltage values of each
NFC system, serve as reversible electromechanical attachments         stopwatch upon exposure to phosphate buffer solution using a

Adv. Mater. 2019, 31, 1902109                               1902109 (3 of 9)               © 2019 WILEY-VCH Verlag GmbH & Co. KGaA, Weinheim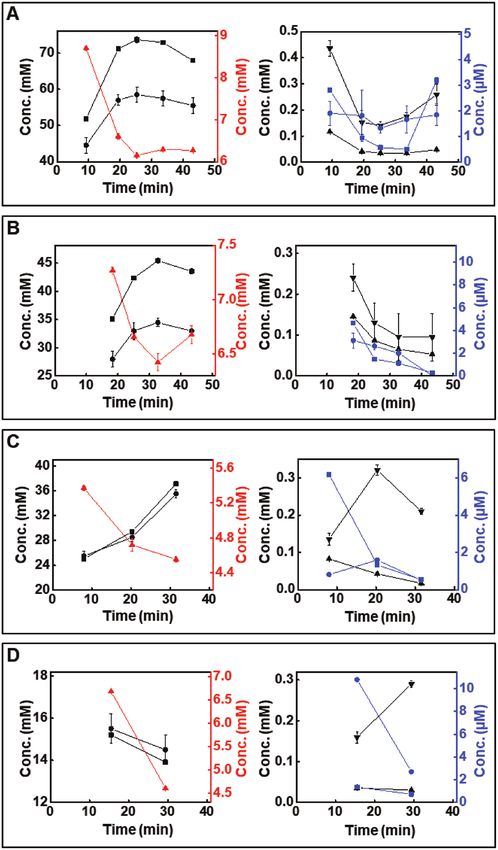
www.advancedsciencenews.com                                                                                                            www.advmat.de

Figure 3. A) Effect of polymeric barriers on stopwatch sensitivity (A: gold; CP: carbon nanotube paper; T: tetrathiafulvalene; C: Chitosan; N: Nafion).
B,C) Effect of tetrathiafulvalene concentration (B), and external load (C) on stopwatch sensitivity.

data acquisition hardware (AI Instruments, CO, USA). The                     (
www.advancedsciencenews.com                                                                                                          www.advmat.de

sensitivity and reproducibility as shown in Figure S3A in the               deviations are acceptable for most practical applications, where
Supporting Information.                                                     the filling of each microchamber at natural rates of sweating
   Tests of the microfluidic systems on human subjects reveal               (12–120 µL h−1 cm−2)[7] typically requires several minutes.
average sweat flow rates in the range ≈3–5 µL min−1 for designs             Automation of the stopwatch fabrication process will further
used here. Benchtop experiments establish that the stopwatches              improve the reproducibility and may obviate the need for sepa-
perform similarly across a range of flow rates between 1 and                rate lookup tables.
10 µL min−1 (Figure S3B, Supporting Information). For flow                     The soft microfluidic systems exploit concepts and designs
rates of less than 1 µL min−1, the responses exhibit enhanced               reported previously.[15] Here, molded silicone (elastic modulus:
effects related to the slow, gradual filling of the chamber. In             ≈1 MPa) membranes include an inlet hole, a series of five col-
general, judicious selection of stopwatch size, microfluidic                lection chambers each with an associated stopwatch, a satellite
chamber volume, electrode compositions, and external loads                  zone for in situ colorimetric chemical analysis and an outlet
offers robust operation across nearly any desired range of flow             for sweat extraction via a micropipette. The device bonds to
rates. As illustrated in Figure S3C in the Supporting Informa-              the skin via a laser-patterned adhesive layer. Each chamber
tion, the thin, flexible nature of the stopwatches and the use              holds ≈50 µL of sweat, thus providing sufficient volumes for
of serpentine interconnects leads to performance that is largely            most analytical tools. Microchannels that connect the cham-
independent of bending stresses commonly encountered in                     bers include passive CBVs that enable sequential collection of
practical applications. Studies of effects of temperature indi-             incoming sweat and maintain physical separation of the sweat
cate stable responses across a physiologically relevant range               aliquots collected in each chamber. Careful design of the crit-
(Figure S3D, Supporting Information).[13]                                   ical dimensions including those of the CBVs, chambers, inter-
   Human sweat contains various biochemicals.[1] Furthermore,               connecting microchannels, inlets, and outlets facilitates entry
the ionic conductivity of the sweat changes with physiological              of sweat into the device at pressures generated by the eccrine
state and can vary significantly across populations.[14] Since the          glands, with negligible back pressure that might otherwise
stopwatches rely on sweat as an electrolyte, these factors could            hinder flow (Figure S4A, Supporting Information).[7] These
be important. Figure S3E,F in the Supporting Information indi-              polydimethylsiloxane (PDMS)-based microfluidic devices are
cates minimal effects of such sweat composition variations. In              designed for a single workout session. PDMS offers favorable
the operation of a stopwatch, the sweat only serves the role of an          mechanical properties, biocompatibility, ease of processability,
electroinactive electrolyte to complete the electrical circuit. The         and widespread use within academia and industry. This elas-
composition of the stopwatch electrodes, rather than the sweat              tomer also allows storage of sweat samples without significant
chemistry, dictates the voltage decay profiles. Hence, person-to-           sample evaporation for applications explored in the present
person variations in sweat composition have negligible effect               work. Collection and storage of sweat samples over longer
on the operation. Figure S3G in the Supporting Information                  periods can be realized with low water permeability elastomers
shows that the performance is similar under under quiescent                 such as styrenic block copolymers[16] and polyisobutylene.[17]
and vigorous movement conditions.                                           Judicious choices for channel geometries, wall thicknesses,
   Figure S3H in the Supporting Information illustrates the                 outlet dimensions, and other features of the microfluidics can
responses of stopwatches from three different batches. The                  further limit evaporation and associated errors in concentration
data exhibit a maximum RSD of ≈25% in estimating time                       analysis.
stamps. In present work, a unique lookup table is generated                    Tests using aqueous solutions of colored food dyes reveal neg-
for each batch using five different stopwatches to achieve                  ligible intermixing after 1 h of sample introduction (Figure 4A;
timekeeping with high accuracy. Table S1 in the Supporting                  Figure S4B, Supporting Information). Color analysis relies on
Information compares the actual time elapsed after stopwatch                the region marked in Figure S4B in the Supporting Information.
activation during a benchtop experiment and time estimated                  As mentioned in the manuscript, extraction of individual sweat
from a lookup table. The data reveal that the estimated time                samples involves excision of the inlet and the interconnecting
varies by a couple of minutes compared to the actual time. The              microchannel (Figure S2E, Supporting Information). The
most significant errors arise at times shortly after stopwatch              region of image analysis lies adjacent to the excision boundary.
activation. Here, variations in the rate of sweat filling the gap           Thus, colorimetric analysis of this region simulates evalua-
between the anode and cathode lead to uncertainties. These                  tion of chemical contamination between samples (Figure S4B,

Figure 4. A–C) Comparison of RGB values extracted from images of the device at the interface of the stopwatch chamber and corresponding collec-
tion chamber at an incubation time t = 0 and 1 h under quiescent conditions (A), after mechanical vibration (B), and after bending to different radii
of curvature (C).

Adv. Mater. 2019, 31, 1902109                                    1902109 (5 of 9)                © 2019 WILEY-VCH Verlag GmbH & Co. KGaA, Weinheim
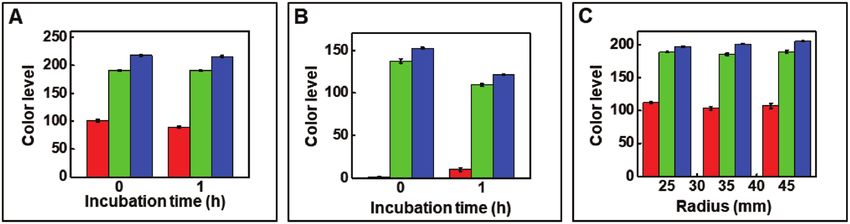
www.advancedsciencenews.com                                                                                               www.advmat.de

Supporting Information). Similar experiments performed on          Recent studies on otherwise similar colorimetric platforms
the device when subjected to inertial forces (Figure 4B) and       provide extensive details on the effects of storage, ambient
mechanical deformations (Figure 4C) further support the            light, and chemical interference on sensor performance,
ability to capture discrete sweat samples during vigorous exer-    including operational stability.[9,10] The results highlighted in
cise when applied to body parts having different curvatures, with  Figure S5C,D in the Supporting Information emulate prac-
minimal contamination between adjacent chambers. Studies of        tical situations where a sample solution of known chloride
effects of mechanical deformation involved wrapping the device     concentration (40 × 10−3 m) is continuously passed into the
over curved surfaces of varying radii (R = 25, 35, and 45 mm).     device at physiologically relevant flow rates (3 µL min−1) for
Tests of inertial forces involved placing the device on an orbital 1 h. The color signal generated by the chloride assay remains
shaker (≈150 rpm) for 1 h.                                         consistent (
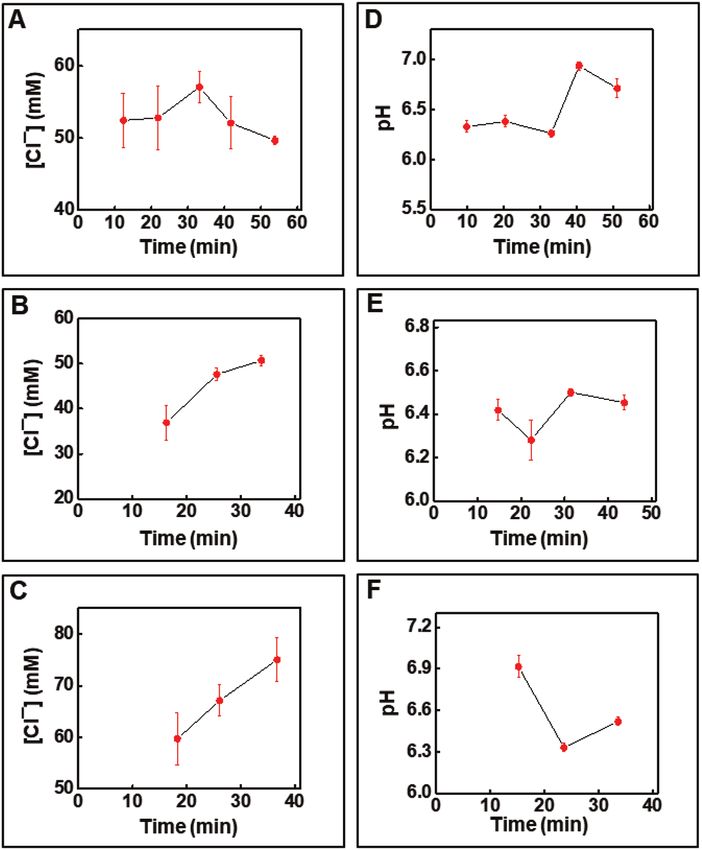
www.advancedsciencenews.com                                                                                                www.advmat.de

                                                                                         show the data from these experiments. The
                                                                                         tests reveal interesting trends in concentra-
                                                                                         tions and their relation to time and sweat
                                                                                         rate. Sweat sodium and chloride levels ini-
                                                                                         tially increase with time and then gradually
                                                                                         decrease. Furthermore, in all studies the con-
                                                                                         centration of sodium is consistently higher
                                                                                         than that of chloride. These observations
                                                                                         are similar to previous studies and the data
                                                                                         from the in situ colorimetric chloride sensor
                                                                                         shown in Figure 5 and Figure S6 (Supporting
                                                                                         Information).[23,24] The plots indicate lower
                                                                                         sweat rates as the subject becomes fatigued,
                                                                                         which aligns with previously reported trends
                                                                                         of these electrolytes with sweat rates.[23–26]
                                                                                         In contrast to the case of sodium and chlo-
                                                                                         ride, sweat potassium concentrations for
                                                                                         high sweat rates begin at higher values
                                                                                         before stabilizing to lower levels. The range
                                                                                         of these stable concentration levels are sim-
                                                                                         ilar to those recorded for low and medium
                                                                                         sweat rate workouts. The decrease in potas-
                                                                                         sium concentration to a stable value as a
                                                                                         sweating session progresses is consistent
                                                                                         with previous reports.[24,27] The intensity of
                                                                                         the cycling bout, and thus sweat rate, appears
                                                                                         to have minimal impact on magnesium con-
                                                                                         centration. However, during a given workout
                                                                                         bout the concentration gradually decreases
                                                                                         with time, as observed in previous report.[27]
                                                                                         Calcium, on the other hand, demonstrates a
                                                                                         temporal concentration profile that depends
                                                                                         on sweat rate. At high sweat rates, the cal-
                                                                                         cium concentration initially decreases and
                                                                                         then gradually increases. At medium to low
                                                                                         sweat rates, the concentration first increases
                                                                                         and then decreases. The copper concentra-
                                                                                         tion shows an inverse relation with time,
                                                                                         with slightly higher initial values for bouts
                                                                                         involving higher sweat rates followed by
                                                                                         rapid decrease and stabilization. Such a
                                                                                         decrease in copper concentration with con-
                                                                                         tinued sweating is consistent with previous
                                                                                         observations.[27] The concentration of iron
                                                                                         shows no clear trends. This set of experi-
                                                                                         ments represents, to our knowledge, one of
                                                                                         the broadest studies of temporal variations
                                                                                         of sweat electrolytes and minerals during
                                                                                         intraworkout bouts, but significant additional
Figure 6. Time-dependent concentrations of sodium (▪), chloride (⦁), potassium (▴),      work is needed to establish significance in
magnesium (▴), calcium (▾), copper (▪), and iron (⦁) in sweat as measured by ICP-MS for the observed trends.
devices filled to five (A), four (B), three (C), and two (D) chambers.                      Previous reports describe general trends
                                                                                         in concentrations by measuring and com-
   A second set of studies utilizes an ICP-MS system to                paring sweat samples collected during different workout ses-
measure temporal variations in the sodium, potassium, mag-             sions.[24–27] Conventional sweat collection patches do not,
nesium, calcium, iron, and copper and a chlorodimeter to               however, allow intraworkout sweat analysis. Although recent
quantify chloride in sweat as a function of cycling intensity.         examples of wearable sweat sensors are capable of real-time
Details appear in the Experimental Section (Supporting Infor-          sweat biochemical analysis, present limitations in sensor tech-
mation). Figure 6 and Figure S7 (Supporting Information)               nology address only a handful of analytes.[2–4,28–30] The platform

Adv. Mater. 2019, 31, 1902109                              1902109 (7 of 9)              © 2019 WILEY-VCH Verlag GmbH & Co. KGaA, Weinheim
www.advancedsciencenews.com www.advmat.de
described here permits temporal sweat analysis with any avail- Conflict of Interest
able analytical tool. These capabilities may allow for enhanced
J.A.R. and S.P.L. are cofounders of Epicore Biosystems, Inc., a company
understanding of trends in minerals and electrolytes excreted which pursues commercialization of microfluidic devices for wearable
in perspiration and their relation to workout duration and applications.
intensity. Sound understanding of these correlations will pro-
vide valuable information to nutritionists for personalizing
dietary plans, to athletes for developing workout schedules, and
to military personnel and workers who undergo high physical Keywords
exertion during their daily routine. Similar studies utilizing colorimetry, galvanic cells, microfluidics, sweat sensing, wireless
this platform for analyzing other sweat biochemicals will fur- electronics
ther extend our understanding of the relation between physical
Received: April 2, 2019
activity and perspiration.
Revised: May 5, 2019
The results reported here demonstrate a unique approach to
Published online: June 17, 2019
achieving comprehensive time-dynamic analysis of sweat bio-
chemistry. The collection of materials, device architectures, and
integration schemes involve an unusual combination of soft
microfluidics, galvanic cell stopwatches, in situ colorimetrics, [1] C. J. Harvey, R. F. LeBouf, A. B. Stefaniak, Toxicol. In Vitro 2010, 24,
and ex situ analytical tools. Engineered soft microfluidic sys- 1790.
[2] T. R. Ray, J. Choi, A. J. Bandodkar, S. Krishnan, P. Gutruf, L. Tian,
tems comprising of a series of chambers interconnected with
R. Ghaffari, J. A. Rogers, Chem. Rev. 2019, 119, 5461.
passive valves enable chronometric collection of sweat samples
[3] J. Kim, A. S. Campbell, B. E.-F. de Ávila, J. Wang, Nat. Biotechnol.
with negligible intermixing, while galvanic cells offer a unique, 2019, 37, 389.
battery-free approach to tracking the dynamics of sweat filling [4] M. Bariya, H. Y. Y. Nyein, A. Javey, Nat. Electron. 2018, 1, 160.
into the device. Detailed in vitro characterization of reproduc- [5] M. Delgado-Povedano, M. Calderón-Santiago, M. L. de Castro,
ibility, as well as the effects of mechanical stresses, ambient F. Priego-Capote, Talanta 2018, 177, 47.
temperature variations, changes in flow rates, sweat compo- [6] P. Kintz, A. Tracqui, P. Mangin, Y. Edel, J. Anal. Toxicol. 1996, 20,
sition, ionic strength, and inertial forces, serve as key studies 393.
in corroborating the robustness of the system. Human trials [7] A. Koh, D. Kang, Y. Xue, S. Lee, R. M. Pielak, J. Kim, T. Hwang,
simulate real-life applications in which time-stamped sweat S. Min, A. Banks, P. Bastien, M. C. Manco, L. Wang, K. R. Ammann,
K.-I. Jang, P. Won, S. Han, R. Ghaffari, U. Paik, M. J. Slepian,
samples and ex situ chemical analysis determine temporal
G. Balooch, Y. Huang, J. A. Rogers, Sci. Transl. Med. 2016, 8,
fluctuations in concentrations of sweat sodium, chloride, potas-
366ra165.
sium, calcium, magnesium, copper, and iron throughout the [8] J. Choi, D. Kang, S. Han, S. B. Kim, J. A. Rogers, Adv. Healthcare
course of an exercise routine. Compatibility with nearly any Mater. 2017, 6, 1601355.
state-of-the-art analytical instrument, for a wide range of chem- [9] J. Choi, A. J. Bandodkar, J. T. Reeder, T. R. Ray, A. Turnquist,
ical assays, provides interesting capabilities in time-dependent S. B. Kim, N. Nyberg, A. l. Hourlier-Fargette, J. B. Model,
sweat sampling. The results may create new opportunities for A. J. Aranyosi, A. J. Aranyosi, S. Xu, R. Ghaffari, J. A. Rogers, ACS
the study of correlations among sweat dynamics, chemistry, Sens. 2019, 4, 379.
and physiology. [10] A. J. Bandodkar, P. Gutruf, J. Choi, K. Lee, Y. Sekine, J. T. Reeder,
W. J. Jeang, A. J. Aranyosi, S. P. Lee, J. B. Model, R. Ghaffari, C.-J. Su,
J. P. Leshock, T. Ray, A. Verrillo, K. Thomas, V. Krishnamurthi,
S. Han, J. Kim, S. Krishnan, T. Hang, J. A. Rogers, Sci. Adv. 2019, 5,
eaav3294.
Supporting Information [11] A. J. Bandodkar, J. Electrochem. Soc. 2017, 164, H3007.
Supporting Information is available from the Wiley Online Library or [12] W. Jia, G. Valdés-Ramírez, A. J. Bandodkar, J. R. Windmiller, J. Wang,
from the author. Angew. Chem., Int. Ed. 2013, 52, 7233.
[13] J. Choi, R. Ghaffari, L. B. Baker, J. A. Rogers, Sci. Adv. 2018, 4,
eaar3921.
[14] S. B. Kim, K. Lee, M. S. Raj, B. Lee, J. T. Reeder, J. Koo,
Acknowledgements A. Hourlier-Fargette, A. J. Bandodkar, S. M. Won, Y. Sekine,
J. Choi, Y. Zhang, J. Yoon, B. H. Kim, Y. Yun, S. Lee, J. Shin, J. Kim,
A.J.B., J.C., and S.P.L. contributed equally to this work. This research was R. Ghaffari, J. A. Rogers, Small 2018, 14, 1802876.
funded by the Air Force Research Laboratory (AFRL) Human Signatures [15] J. Choi, Y. Xue, W. Xia, T. R. Ray, J. T. Reeder, A. J. Bandodkar,
Branch through Core funds provided to Northwestern University under
D. Kang, S. Xu, Y. Huang, J. A. Rogers, Lab Chip 2017, 17,
contract FA8650-14-D-6516. This work utilized Northwestern University
2572.
Micro/Nano Fabrication Facility (NUFAB), which is partially supported
[16] J. T. Reeder, J. Choi, Y. Xue, P. Gutruf, J. Hanson, M. Liu, T. Ray,
by Soft and Hybrid Nanotechnology Experimental (SHyNE) Resource
(NSF ECCS-1542205), the Materials Research Science and Engineering A. J. Bandodkar, R. Avila, W. Xia, S. Krishnan, S. Xu, K. Barnes,
Center (DMR-1720139), the State of Illinois, and Northwestern M. Pahnke, R. Ghaffari, Y. Huang, J. A. Rogers, Sci. Adv. 2019, 5,
University. Metal analysis was performed at the Northwestern University eaau6356.
Quantitative Bio-element Imaging Center generously supported by NASA [17] V. K. Samineni, J. Yoon, K. E. Crawford, Y. R. Jeong, K. C. McKenzie,
Ames Research Center (Grant No.: NNA04CC36G). S.M. acknowledges G. Shin, Z. Xie, S. S. Sundaram, Y. Li, M. Y. Yang, J. Kim, D. Wu,
support from Indo-U.S. Science and Technology Forum (Grant No.: Y. Xue, X. Feng, Y. Huang, A. D. Mickle, A. Banks, J. S. Ha,
SERB-IUSSTF-2017/192). J. P. Golden, J. A. Rogers, R. W. Gereau, PAIN 2017, 158, 2108.
Adv. Mater. 2019, 31, 1902109 1902109 (8 of 9) © 2019 WILEY-VCH Verlag GmbH & Co. KGaA, Weinheimwww.advancedsciencenews.com www.advmat.de
[18] Y.-M. Tang, D.-G. Wang, J. Li, X.-H. Li, Q. Wang, N. Liu, W.-T. Liu, [25] G. W. Cage, R. L. Dobson, J. Clin. Invest. 1965, 44, 1270.
Y.-X. Li, Ind. Health 54, 2016, 215. [26] D. B. Dill, F. G. Hall, W. V. Beaumont, J. Appl. Physiol. 1966, 21, 99.
[19] C. F. Consolazio, L. O. Matoush, R. A. Nelson, R. S. Harding, [27] S. J. Montain, S. N. Cheuvront, H. C. Lukaski, Int. J. Sport Nutr.
J. E. Canham, J. Nutr. 1963, 79, 407. Exercise Metab. 2007, 17, 574.
[20] H. C. Lukaski, Int. J. Sport Nutr. 1995, 5, S74. [28] W. Gao, H. Y. Nyein, Z. Shahpar, H. M. Fahad, K. Chen,
[21] N. Kondo, S. Takano, K. Aoki, M. Shibasaki, H. Tominaga, Y. Inoue, S. Emaminejad, Y. Gao, L.-C. Tai, H. Ota, E. Wu, J. Bullock, Y. Zeng,
Acta Physiol. Scand. 1998, 164, 71. D.-H. Lien, A. Javey, ACS Sens. 2016, 1, 866.
[22] A. J. Bandodkar, W. J. Jeang, R. Ghaffari, J. A. Rogers, Annu. Rev. [29] J. Kim, W. R. de Araujo, I. A. Samek, A. J. Bandodkar, W. Jia,
Anal. Chem. 2019, 12, 061318. B. Brunetti, T. R. Paixão, J. Wang, Electrochem. Commun. 2015, 51,
[23] M. J. Buono, K. D. Ball, F. W. Kolkhorst, J. Appl. Physiol. 2007, 103, 41.
990. [30] Y. Sekine, S. B. Kim, Y. Zhang, A. J. Bandodkar, S. Xu, J. Choi,
[24] H. M. Emrich, E. Stoll, B. Friolet, J. P. Colombo, R. Richterich, M. Irie, T. R. Ray, P. Kohli, N. Kozai, T. Sugita, Y. Wu, K. Lee,
E. Rossi, Pediatr. Res. 1968, 2, 464. K.-T. Lee, R. Ghaffari, J. A. Rogers, Lab Chip 2018, 18, 2178.
Adv. Mater. 2019, 31, 1902109 1902109 (9 of 9) © 2019 WILEY-VCH Verlag GmbH & Co. KGaA, WeinheimYou can also read