Pressure Test: Good Stress for Company Success
←
→
Page content transcription
If your browser does not render page correctly, please read the page content below
Pressure Test: Good Stress for Company Success
                                         Sanja Šćepanović1,+ , Marios Constantinides1,+ , Daniele Quercia1,2,* , and Seunghyun
                                         Kim3
                                         1 Nokia Bell Labs, Cambridge, United Kingdom
                                         2 Kings College London, United Kingdom
                                         3 Georgia Tech, USA
                                         * quercia@cantab.net
                                         + these authors contributed equally to this work

                                         ABSTRACT
arXiv:2107.12362v2 [cs.SI] 27 Jul 2021

                                         Workplace stress is often considered to be negative, yet lab studies on individuals suggest that not all stress is bad. There are
                                         two types of stress: distress refers to harmful stimuli, while eustress refers to healthy, euphoric stimuli that create a sense
                                         of fulfillment and achievement. Telling the two types of stress apart is challenging, let alone quantifying their impact across
                                         corporations. We just did that for the S&P 500 companies in the U.S., and did so by leveraging a dataset of 440K company
                                         reviews published during twelve successive years, and developing a state-of-the-art deep-learning framework to accurately
                                         extract stress mentions from these reviews. We proposed a new methodology that places each company on a stress-by-rating
                                         quadrant (based on its overall stress score and overall rating on the site), and accordingly scores the company to be, on
                                         average, either a low stress, passive, negative stress, or positive stress company. We found that (former) employees of positive
                                         stress companies tended to describe high-growth and collaborative workplaces in their reviews, and that such companies’
                                         stock evaluations grew, on average, 5.1 times in 10 years (2009-2019) as opposed to the companies of the other three stress
                                         types that grew, on average, 3.7 times in the same time period. We also found that the four stress scores aggregated every
                                         year - from 2008 to 2020 - closely followed the unemployment rate in the U.S.: a year of positive stress (2008) was rapidly
                                         followed by several years of negative stress (2009-2015), which peaked during the Great Recession (2009-2011).

                                         Introduction
                                         According to the American Institute of Stress, 40% of workers consider their jobs to be stressful; a number that has significantly
                                         increased during the COVID-19 pandemic1 . The World Health Organization treats stress as the number one health threat
                                         in the U.S., with more than 60% of doctor visits being due to a stress-related issue2 . Workplace stress is often linked to
                                         lower motivation, poor performance, and decline in employees’ well-being3 , while it is estimated to amount to 190 billions in
                                         healthcare costs in the U.S. alone4 .
                                             Stress is defined as “a set of physical and psychological responses to external conditions or influences, known as stressors”5 .
                                         According to Lazarus6 , “any change, either good (eustress) or bad (distress), is stressful, and whether it is a positive or a negative
                                         change, the physiological response is the same.” To cope with workplace stress, an employee has to cognitively acknowledge
                                         that a situation causes stress before even attempting to manage it7 . Kobasa’s framework of psychological hardiness offers
                                         three main categories of coping strategies8 : commitment (having an active involvement in one’s own work with a sense of
                                         purpose), control (believing and acting instead of feeling helpless in front of adversity), and challenge (believing that change
                                         could be a source of improvement). Kobasa posited that these categories could help individuals face challenges and, as such,
                                         individuals could turn stressful events into opportunities for personal growth8 . However, despite researchers having explored
                                         the relation between stress and job performance for decades, it is still unclear whether stress and performance are in a negative
                                         linear relation, a positive linear relation, or an inverted-U relation9 .
                                             To currently track how its employees deal with stress, a large company would typically recruit consultants who would then
                                         administer surveys tailored to the company’s situation, which typically end up being costly10 , and restricted to a limited pool of
                                         self-selected participants11–13 .
                                             To partly tackle those challenges, researchers have increasingly explored the possibility of relying on social media data
                                         to measure stress in a variety of contexts at scale14 . One way of doing so is to automatically analyze the use of language
                                         from social media posts with Natural Language Processing techniques. A case in point is Saha and De Choudhury’s analysis
                                         of textual content posted on the social media of Reddit by university students who experienced gun violence events at their
                                         campuses. As expected, anomalous high levels of stress markers were present in the use of language, including linguistic
                                         changes reflecting “reduced cognition, higher self pre-occupation and death-related discussion.”. Similar automatic techniques
                                         have been recently brought to bear in the corporate context: reviews posted by former employees were automatically analyzed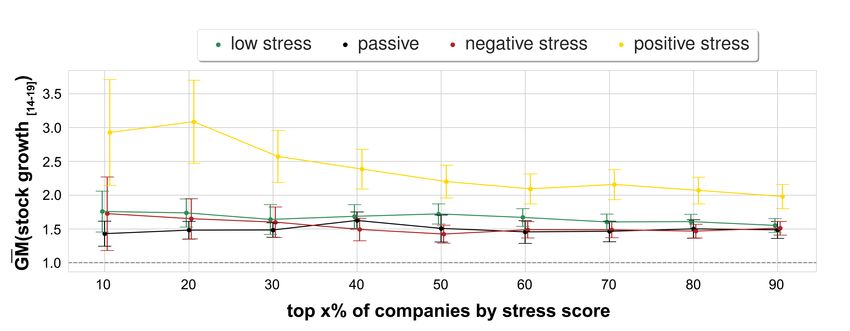
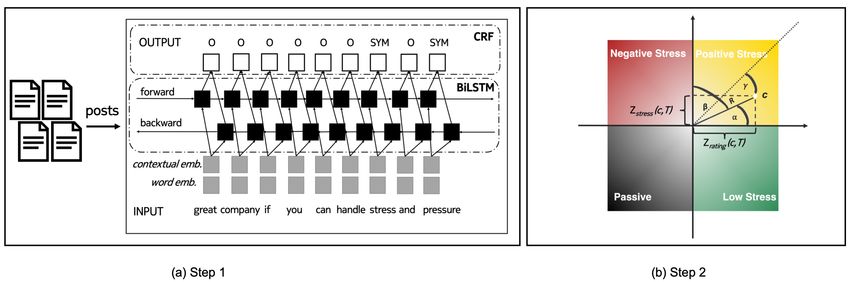
Figure 1. Placing companies on a stress-by-rating quadrant by detecting stress mentions in reviews about a company using a
state-of-the-art NLP deep-learning framework (Step 1), placing the company in the rating-by-stress quadrant, and computing its
association with its stress type (i.e., with its quadrant) (Step 2). To see how the association is computed, consider company c
shown in (b) to be of positive stress. c is placed according to its zrating (c, T ) along the x-axis, and to its zstress (c, T ) along the
y-axis. R is the radius from the center to c’s point; α is the angle between the radius line and the x-axis; β is the angle between
the radius line and the y-axis; and γ is the angle between the radius line and the diagonal shown as a dotted line. The function
 f (c, s, T ) combines R, α, β , and γ, and accordingly scores c to have a high association weight with positive stress s during
period T (darker shades of colors), as c is close to the quadrant’s diagonal, and distant from the intersection point.

to predict employee performance and ultimately quantify a company’s organizational culture15 . In a similar vein, for this work,
we hypothesized that concepts related to corporate culture such as attitudes towards workplace stress are reflected in company
reviews.

Data
After obtaining the U.S. unemployment rates between 2008 and 2020 from the U.S. Bureau of Labor Statistics16 and the S&P
500 stock market data (including the 500 large capital U.S. companies with a cumulative market capitalization to be around
70-80% of the total in the country) from the Yahoo Finance portal17 , we matched that data with our company reviews. More
specifically, we obtained 440K geo-referenced posts on a popular company reviewing site about the S&P 500 companies
published during twelve successive years, from 2008 to 2020. On this site, current and, more likely, former employees of
companies write reviews about their own corporate experience, ranging from job interviews to salaries to workplace culture.
The site provided an overall rating of each company based on employees’ reviews. As of 2021, there are 50M monthly visitors
on the platform, and 70M reviews about 1.3M companies. To ensure quality reviews, the site: performs both automatic and
manual content moderation; allows for full access to content only to users who registered on the site and wrote at least one
review each (encouraging neutral and unbiased reviews18 ); and allows for posting maximum one review per employee per year.
These reviews have been recently used in studies exploring corporate culture at scale15, 19–21 .

Methods
We extracted mentions related to stress using a state-of-the-art NLP deep-learning tool, which is trained to extract medical
conditions from free-form text (Figure 1(a)). We then designed a new methodology that placed the 500 S&P companies on a
stress-by-rating quadrant based on their overall ratings on the reviewing site on one axis, and the presence of mentions related
to stress in their reviews on the other axis (Figure 1(b)). In so doing, we classified each company to be, on average, either a low
stress, passive, negative stress, or positive stress company. We finally computed each company’s strength of membership to
its quadrant depending on whether the company is placed both close to the diagonal and far from the (0,0) intersection point.
The function f (c, s, T ), which is expressed in Equation (1) and graphically depicted in Figure 1(b), assigns a higher weight to
company c of stress type s, if c is both closer to the quadrant’s diagonal (i.e., it is farther from the remaining quadrants) and
more distant from the two axes’ intersection (i.e., it has higher absolute overall rating and stress score values). We call f (c, s, T )
to be company c’s association with stress type s during T since the higher its value, the more c is associated with stress type s
during T .

Extracting stress mentions from posts. We applied a state-of-the-art NLP deep-learning tool22 . The tool uses deep recurrent

                                                                                                                                     2/18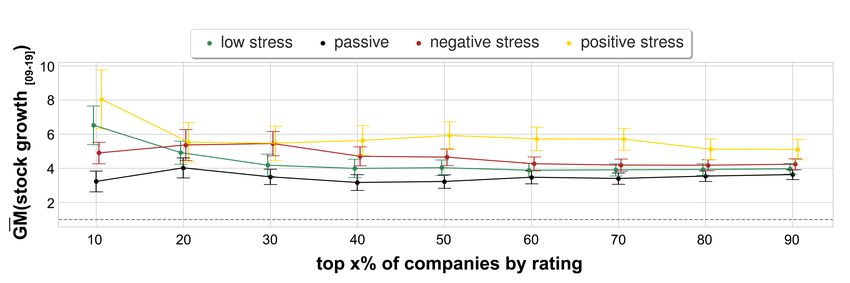
Table 1. Top15 most frequent stress-related mentions identified on a company review site, and their frequency counts.

 Condition related to stress     # mentions       Example mention
 stress                          3473             “Great company to work for, if you can handle stress.”
 high stress                     710              “High stress work environment, long work hours.”
 pressure                        447              “a lot of pressure to get things done.”
 burnout                         277              “[...], the ones who made the cut to stay are suffering from burnout.”
 understaffing                   99               “Somewhat job stability due to understaffing.”
 heavy workload                  58               “Lack of work/life balance, extremely heavy workload.”
 exhaustion                      58               “You will be pushed to the point of exhaustion [...].”
 stress levels                   57               “[...] stress levels peak insanely when the store manager [...].”
 overworked                      45               “At times, you can feel overworked and undervalued.”
 tension                         38               “There’s a lot of tension between coworkers because of commission.”
 high workload                   38               “[...] seeing many large set-backs which cause very high workload”
 extreme stress                  33               “Beware: extreme stress and pressure.”
 mental stress                   23               “[...] ends up giving you a lot of mental stress.”
 overload                        17               “No work life balance [...], overloaded and benefits are not good.”
 pressure to perform             9                “[...] a lot of pressure to perform, long working hours”

neural networks23 and contextual embeddings24 , and it was trained to extract any mention in the health context (e.g., medical
conditions) from free-form text. The pre-trained MedDL models22 are provided for three social media datasets: AskAPatient25 ,
Twitter, and Reddit. We used the model trained on Reddit as the reviews analyzed here have similar format; users write
sentences in free-form language without any length limitation (as opposed to Twitter), and without a specific focus on health
(as opposed to AskAPatient).
    We extracted stress mentions in three steps (further detailed in Supplementary Information). First, we detected over 21K
posts that mentioned over 5K unique medical conditions. Most frequent medical conditions identified include stress, pain,
headache, and depression. Second, we inspected the top200 most mentioned conditions and manually selected 31 of them
that specifically reflect workplace stress (top15 are shown in Table 1). Third, we extracted all reviews mentioning any of the
31 conditions. This resulted in 7338 posts related to stress, which accounted for 1% of all posts. Despite this seemingly low
number of posts, when aggregated, these posts returned statistically significant results for our metrics, which are described next.

Stress-by-rating quadrant. We placed each S&P 500 company on a stress-by-rating quadrant. More specifically, for each
company c, we computed its average review rating and its stress score:

        rating(c,T) = c’s average review rating during T,
                    # c’s posts related to stress during T
      stress(c,T) =                                        .
                          total # c’s posts during T

where T is set to initially include all the years under study (2009-2019). To then ease comparability, we z-scored these two
values:
                         rating(c, T ) − µrating (T )
      zrating (c, T ) =                                 ,
                                 σrating (T )
                         stress(c, T ) − µstress (T )
       zstress (c, T ) =                              .
                                σstress (T )

where µrating (T ) and σrating (T ) are the average and standard deviation of the review ratings for all companies (regardless of
their stress types) during the whole period T (readily available on the company review site), and µstress (T ) and σstress (T ) are
the average and standard deviation of the stress scores for all companies during the whole period T .

    Each S&P 500 company was assigned to one of the four quadrants based on the signs of their two z-scores (Figure 1(b)). For
example, a company c with a negative zrating (c, T ) and a positive zstress (c, T ) would be placed in the negative stress quadrant,
while a company with a positive zrating (c, T ) and a positive zstress (c, T ) would be placed in the positive stress quadrant. The
resulting quadrants are consequently four:

 Low Stress companies - These enjoy high overall ratings and low stress scores. Their employees tended to think very positively
 about their workplace experience with comparatively fewer posts mentioning stress conditions.

                                                                                                                               3/18
Passive companies – These are characterized by low overall ratings and a small proportion of posts mentioning stress. Their
 employees were mostly not satisfied with their jobs, but they also showed comparatively fewer signs of stress in their reviews.

 Negative stress companies – These are characterized by high stress scores and low overall ratings. Their employees mentioned
 stress conditions, while also scoring their workplace experience low.

 Positive stress companies – These enjoy high ratings despite high stress scores. Their employees mentioned stress yet did so
 in the context of high-pressure and highly rewarding work environments.

    Once a company c is placed in its quadrant (i.e., associated with its stress type s), we needed to estimate its association with
this quadrant, i.e., with s. For example, company c with (zrating (c, T ), zstress (c, T )) equal to (3,3) is more strongly associated
with positive stress, than what a company with (0.5, 0.5) would be. To estimate c’s association with s, we combined c’s two
z-scores concerning review rating and stress score as follows (and as depicted in Figure 1(b)):


                            l(zrating (c, T ), zstress (c, T )) = R/(γ + π), if c ∈ s during T ;
       f (c, s, T ) =                                                                                                             (1)
                            0,                                               if c ∈
                                                                                  / s, or c has no review during T ;
         where:
                        q
               R=            zrating (c, T )2 + zstress (c, T )2 ,
                γ = max((α − π/4), (β − π/4)),
               α = arccos(|zrating (c, T ))|/R),
               β = arccos(|zstress (c, T ))|/R).

where T is initially set to include all the years under study, from 2009 to 2019. To ease understanding of the above formula,
consider that function l, on input of the two z-scores (i.e., the company’s two coordinates in the quadrant), computes the
extent to which company c is on the diagonal and far from the (0,0) intersection point (Figure 1(b)). It gives higher weights
to companies that are both closer to the quadrant’s diagonal (i.e., which are farthest from the remaining quadrants) and more
distant from the axes’ intersection (i.e., which have higher absolute rating/stress score values).

Breaking stress scores down by year. For each year y, we quantified the amount of a given stress type s expressed in the posts
produced in that year. More specifically, we computed:

      m(s, y) = ∑ f (c, s, y) × w(c, y, s),                                                                                       (2)
                  c∈s

For all the companies of stress type s, we summed each company’s association f (c, s, y) with s during year y weighted by the
presence of posts about the company during y (giving higher weights to companies whose employees contributed more reviews
in that year):
                            # c’s posts in year y
                            total # posts in year y ,   if c ∈ s in year y;
      w(c, y, s) =                                                                                                                (3)
                            0,                          if c has no reviews in year y.

Results
After considering each company c’s association f (c, s, T ) with stress type s during T and initially setting T to be the whole
period of study, we run a preliminary validation step. To ascertain whether the content of the reviews captured aspects specific
to the four stress types, we identified the top relevant words for each type by running a topic modeling algorithm called
BERTopic26 , and did so on four distinct sets of reviews: each set contained reviews of all the companies of a given stress type.
This algorithm found the emergent topics in the four sets, and Table 2 lists the the top three words for each topic. As detailed
in Supplementary Information, by inspecting these groups of words and corresponding representative reviews, six annotators
identified the emergence of three workplace themes:

 Career drivers (first set of rows in Table 2). Negative stress companies were associated with words such as ‘overtime’,
     ‘mandatory, ‘shifts’, and the typical workplace described in the reviews, according to our annotators, was characterized
      by considerable emotional pressure. On the other hand, passive companies were associated with words such as ‘vacation’,
     ‘pto’, and ‘vacationsick’, and the corresponding reviews tended to deflect from the day-to-day work and focus on activities

                                                                                                                                 4/18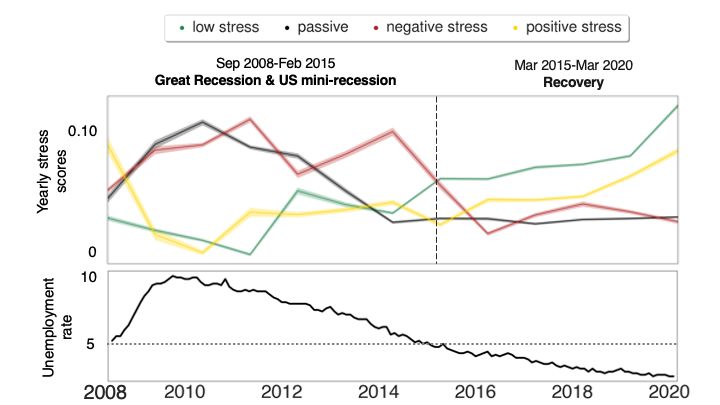
Negative stress           Passive                    Low stress                   Positive stress
                 overtime (0.049)          vacation (0.031)           scheduling (0.013)           teamwork (0.006)
    drivers
    Career

                 mandatory (0.006)         pto (0.003)                flexibility (0.002)          supportive (0.003)
                 shifts (0.002)            vacationsick (0.003)       autonomy (0.001)             collaborative (0.002)
   or benefits

                 discounts (0.009)         insurance (0.006)          401k (0.011)                 gain (0.001)
    Industry

                 sale (0.004)              espp (0.003)               bonus (0.004)                billions (0.001)
                 coupons (0.002)           hsa (0.003)                retirement (0.002)           software (0.001)
   Emotional

                 horrible (0.007)          repetitive (0.004)         fair (0.002)                 prestige (0.002)
    aspects

                 terrible (0.003)          turnover (0.002)           friendlygood (0.002)         boost (0.002)
                 awful (0.002)             workload (0.002)           pays (0.002)                 reputation (0.001)

Table 2. Three-word groups present in the reviews of companies of the four stress types. These groups were automatically
found by BERTopic and speak to three main workplace characteristics: career drivers, industry and benefits, and emotional
aspects. For each group, the top three words are shown together with their normalized word importance.

         outside work such as vacation and time off. Low stress companies were associated with words such as ‘scheduling’,
        ‘flexibility’, and ‘autonomy’, and the typical workplace described in the reviews was one in which employees cherished
         their sense of control over their work. Finally, positive stress companies were associated with words such as ‘teamwork’,
        ‘supportive’, and ‘collaborative’, and the typical workplace in the reviews was one with a collaborative and supportive
         culture.
 Industry or benefits (second set of rows in Table 2). Negative stress companies were associated with words such as ‘discounts’,
     ‘sale’, ‘coupons’, while positive stress companies were associated with words such as ‘gain’, ‘billions’, and ‘software’.
     Their reviews were effectively mentioning the industry sectors they referred to: Consumer Discretionary (e.g., retail
      shops) for the reviews of negative stress companies, and Information Technology for those of positive stress ones. On the
      other hand, passive companies were associated with words such as ‘insurance’, ‘espp’, and ‘hsa’, and, similarly, low
      stress ones with words such as ‘401k’, ‘bonus’, and ‘retirement’; the corresponding reviews indicated workplaces in
     which concerns about long-term financial benefits rather than the presence of implicit incentives in one’s own work were
      at the forefront.
 Emotional Aspects (third set of rows in Table 2). Negative stress companies were associated with words such as ‘horrible’,
    ‘terrible’, and ‘awful’, confirming, once again, the presence of emotional pressure. Passive companies were instead
    associated with words such as ‘repetitive’, ‘turnover’, and ‘workload’, confirming the tedious nature of those workplaces.
    Low stress companies were associated with words such as ‘fair’, ‘friendlygood’, and ‘pays’, and the corresponding
    reviews described a good work-life balance. Finally, positive stress companies were associated with words such as
    ‘prestige’, ‘boost’, and ‘reputation’, and their reviews described high performing, dynamic, and fast-paced workplaces.
    After this preliminary validation step in which we ascertained that stress was paraphrased in reviews differently according
to the stress type, we tested whether the evolution of each stress score over the years tallied with large-scale exogenous events
such as the Great Recession. We plotted the amount m(s, y) of each stress score s in each year y (as per Equation (2)), from
2008 to 2020 (top panel in Figure 2). The overall changes closely followed the unemployment rates from the U.S. Bureau
of Labor (bottom panel in Figure 2): a year of positive stress (2008) was rapidly followed by several years of negative stress
(2009-2015), which peaked during the Great Recession (2009-2011) during which the U.S. went through a loss of over 7.5
million jobs and high unemployment rates27 .
    Finally, we hypothesized that a company’s way of dealing with workplace stress was partly associated with performance.
Given our data, we cannot study whether stress causes (poor) performance but can only study how the two are associated. Also,
there is no company performance measure that is solely affected by a company’s stress culture. As such, our stress scores are
unlikely to be predictive of any company-wide performance measure. We opted for long-term stock growth as our performance
measure, not least because it is publicly available and standardized across companies. However, such a growth is partly affected
by a company’s culture, and conflates endogenous factors (e.g., productivity) with exogenous ones (e.g., financial cycles). Yet
we expected our stress measures to qualitatively describe different forms of financial success, at least in the long term. To that
end, we computed stock growth during the full period of study, that is, between 2009 to 2019:
                                     stock(c)2019
         stock growth[09−19] (c) =                                                                                            (4)
                                     stock(c)2009

                                                                                                                             5/18
Figure 2. The evolution of: (top) the four types of stress; and (bottom) the unemployment rate in the U.S., with the horizontal
dashed line reflecting pre-recession rate. The stress score per year is calculated using Equation (2), and its standard deviations
are shown with shaded lines.
where stocki is the average adjusted closing price of company c’s stock in year i. We chose long-term growth instead of
short-term one (e.g., that pertaining 2018-2019) to partly account for any potential influence of exogenous events (e.g., Great
Recession, market manipulation, incidental growth/decline28 ). In Supplementary Information, we show that the results do
not qualitatively change when considering the narrower 5-year period from 2014 to 2019 (Figure 8). Given a stress type
s, we computed company c’s association f (c, s, T ) with s during time period T (initially set to the whole period of study),
consequently grouping all the companies of a given stress type into their stress score percentiles (Figure 3, right). As the
distribution of stock growth values across companies is heavy-tailed (Figure 3, left), we used the geometric mean to average
these values across companies. That is, GM(stock growth[09−19] ) = Π(stock growth[09−19] (c))1/n , where c is a company in a
specific (stress type,percentile) bin, and n is the number of the companies in such a bin. Positive stress companies enjoyed the
¯
highest stock growth with an average value across all percentiles of GM(stock growth[09−19] ) = 5.07 (Figure 3 on the right),
¯
while the average stock growth across the other three types of companies was noticeably lower (GM(stock growth09−19 ) = 3.70),
¯
with passive stress companies exhibiting the lowest growth (GM(stock growth09−19 ) = 3.42). To ease the interpretation of such
values, consider the example of Equinix, a digital infrastructure company headquartered in California, which our approach
labeled to be a “positive stress” company. Its stock price traded at 61$ in 2009 and its stock price climbed over 695% (i.e., its
¯
GM(stock growth[09−19] ) was 7.95), trading at 485$ ten years later.
Discussion
To put these results into context, consider that previous literature has shown that, from different types of digital data such as web
search queries, one can infer a population’s interests, intentions, and future actions. For example, using Google search queries,
Choi and Varian29 determined trends in claims for unemployment benefits before the US government reported them in their
official press releases. This kind of research is often referred to as “nowcasting”, or as Castle et al.30 put it “contemporaneous
forecasting”. In a similar vein, here, we analyzed company reviews, identified stress markers in them, and collated these
markers to identify four types of companies depending on the different ways they described stress. We showed that company
reviews do contain markers of stress, and these markers do linguistically paraphrase stress in different ways. This could be of
any company’s immediate use. Traditionally, companies performance has been tracked through tailored surveys. While it has
been shown that subjective measurements collected through surveys were partly associated with objective measurements31 ,
automated analyses of the language used by employees on corporate social-networking tools might offer yet another way of
tracking workplace stress.
Our study comes with five main limitations that are mostly determined by our data. The first has to do with our inability
to study whether stress causes performance differences given the absence of cross-lag data that links stress culture to a
6/18(a) (b)
Figure 3. (a) Distribution across companies of the logarithm of stock growth values from the average stock price in 2009 and
that of 2019 (stock_growth[09−19] = stock2019 /stock2009 ) showing the stock growth is log-normally distributed. The average
stock price for year y (stocky ) is calculated as the average of the daily Adjusted Closing Prices for the year. (b) Geometric mean
¯
of the stock growth values GM(stock_growth [09−19] ) for increasing stress score percentiles for the companies of a given stress
¯
type. Error bars represent geometric standard error GSE(stock_growth[09−19] ) = GM(stock_growth [09−19] )/
√
N · σ (log(stock_growth[09−19] )).
stress-related company-wide performance measure. We were able to only study associations though, and found an association
between stress and long-term growth. Positive stress companies, on average, quintuple their growth in 10 years. On the other
hand, negative stress companies have suffered from financial stagnation. These results are not conclusive but call into question
whether stress and performance are best described as being in a simple negative or positive linear relationship. It might well
be a balancing act between a high-pressure culture that drives financial success32 and a cut-throat culture that results into
unnecessary stress and decreasing productivity33 .
The second limitation has to do with the fact that the observed decreasing growth in Figure 3(b) might be affected by two
main aspects that have little to do with the hypothesized relationship between stress and performance. First, our quantification
of stress types conflates stress mentions with company review ratings, so one might wonder whether the observed performance
differences might be due to decreasing review ratings rather than increasing stress scores. In Supplementary Information, we
showed that indeed stock growth increased with increasing review ratings, yet, also in this case, the growth of positive stress
companies was significantly higher than that of any of the other three types of company (Figure 9). Second, the observed
performance differences might be due to particular industry sectors. In Supplementary Information, we showed that tech
companies, for example, were over-represented among positive stress companies (Figure 10), and stock growth was partly
driven by them. Yet, by separating companies by industry sector (e.g., health care, consumer discretionary), positive stress
companies still grew faster within a given sector (Figure 11).
The third limitation concerns the temporal span and granularity of our data. The reviewing site was founded in 2008,
allowing to obtain data for twelve years, thus events prior to 2008 (e.g., the dot-com bubble in the late 1990s) cannot be studied.
Additionally, due to data sparsity, finer-grained temporal analyses such as those at the quarter level cannot be conducted.
The fourth limitation concerns companies’ representation biases, stemming from companies’ representation across the
US. Still, in Supplementary Information, we showed that the companies in our data are still geographic representative of the
distribution of headquarters across the states in the US (Figure 6).
The final limitation concerns the deep-learning model used to detect stress mentions in posts, which is not always accurate.
In Supplementary Information, we report analyses on three alternative datasets (Figure 7), illustrating the state-of-the-art
predictive power of this model in detecting stress mentions from free-form text, achieving an F1-score of .71 when extracting
medical conditions, and an F1-score of .77 when extracting prescription drugs.
References
1. Sugar, A. Stay cool under pressure — without appearing cold. Harv. Bus. Rev. (2020).
2. Nerurkar, A., Bitton, A., Davis, R. B., Phillips, R. S. & Yeh, G. When physicians counsel about stress: Results of a national
study. JAMA Intern. Medicine 173, 76–77 (2013).
3. Cartwright, S. & Cooper, C. L. Managing Workplace Stress, vol. 1 (Sage, 1997).
7/184. Pal, P. Battling the physical symptoms of stress. Harv. Bus. Rev. (2016).
5. Selye, H. The Stress of Life (McGraw-Hill, 1956).
6. Lazarus, R. S. Toward better research on stress and coping. Am. Psychol. Assoc. (2000).
7. Colligan, T. W. & Higgins, E. M. Workplace stress: Etiology and consequences. Work. Behav. Heal. 21, 89–97 (2006).
8. Kobasa, S. C. Stressful life events, personality, and health: An inquiry into hardiness. Pers. Soc. Psychol. 37, 1 (1979).
9. Muse, L., Harris, S. & Feild, H. Has the Inverted-U Theory of Stress and Job Performance Had a Fair Test? J. Hum.
Perform. 16, 349–364 (2003).
10. Vaske, J. J. Advantages and disadvantages of internet surveys: Introduction to the special issue. Hum. Dimensions Wildl.
16, 149–153 (2011).
11. Duda, M. D. & Nobile, J. L. The fallacy of online surveys: No data are better than bad data. Hum. Dimensions Wildl. 15,
55–64 (2010).
12. Gigliotti, L. M. Comparison of an internet versus mail survey: A case study. Hum. Dimensions Wildl. 16, 55–62 (2011).
13. Fricker, R. D. & Schonlau, M. Advantages and disadvantages of internet research surveys: Evidence from the literature.
Field methods 14, 347–367 (2002).
14. Saha, K. et al. Social media as a passive sensor in longitudinal studies of human behavior and wellbeing. In Extended
Abstracts of the ACM CHI Conference on Human Factors in Computing Systems (CHI), 1–8 (2019).
15. Das Swain, V. et al. Modeling organizational culture with workplace experiences shared on glassdoor. In Proceedings of
the ACM CHI Conference on Human Factors in Computing Systems (CHI), 1–15 (2020).
16. U.S. Bureau of Labor Statistics. https://www.bls.gov.
17. Yahoo Finance portal. https://finance.yahoo.com.
18. Chamberlain, A. & Smart, M. Give to get: A mechanism to reduce bias in online reviews. Tech. Rep., Technical Report.
Glassdoor Research Report (2017).
19. DeKay, S. H. Peering through glassdoor.com. what social media can tell us about employee satisfaction and engagement.
In Conference on Corporate Communication, vol. 45 (2013).
20. Luo, N., Zhou, Y. & Shon, J. Employee Satisfaction and Corporate Performance: Mining Employee Reviews On
Glassdoor.com. In Proceedings of the International Conference on Information Systems (ICIS) (2016).
21. Ji, Y., Rozenbaum, O. & Welch, K. Corporate culture and financial reporting risk: Looking through the glassdoor. SSRN
(2017).
22. Šćepanović, S., Martín-López, E., Quercia, D. & Baykaner, K. Extracting medical entities from social media. In
Proceedings of the ACM Conference on Health, Inference, and Learning (CHIL), 170–181 (2020).
23. Huang, Z., Xu, W. & Yu, K. Bidirectional lstm-crf models for sequence tagging. arXiv preprint arXiv:1508.01991 (2015).
24. Liu, Y. et al. Roberta: A robustly optimized BERT pretraining approach. CoRR abs/1907.11692 (2019).
25. AskAPatient. https://www.askapatient.com.
26. Grootendorst, M. Bertopic: leveraging bert and c-tf-idf to create easily interpretable topics (2020). URL https://doi.
org/10.5281/zenodo 4381785.
27. Grusky, D. B., Western, B. & Wimer, C. The consequences of the great recession. The Gt. Recess. 3–20 (2011).
28. Gamestop shares surge 100% in a day, reddit group rejoices (2021).
29. Choi, H. & Varian, H. Predicting the present with google trends. Econ. record 88, 2–9 (2012).
30. Castle, J. L., Fawcett, N. W. & Hendry, D. F. Nowcasting is not just contemporaneous forecasting. Natl. Inst. Econ. Rev.
210, 71–89 (2009).
31. Wall, T. D. et al. On the validity of subjective measures of company performance. Pers. psychology 57, 95–118 (2004).
32. Gmelch, W. H. Beyond stress to effective management (Wiley, 1982).
33. Nyberg, A. The impact of managerial leadership on stress and health among employees (Institutionen för folkhälsoveten-
skap/Department of Public Health Sciences, 2009).
34. Straková, J., Straka, M. & Hajic, J. Neural architectures for nested ner through linearization. In Proceedings of the
Conference of the Association for Computational Linguistics, 5326–5331 (2019).
8/1835. Akbik, A., Bergmann, T. & Vollgraf, R. Pooled contextualized embeddings for Named Entity Recognition. In Proceedings
of the Conference of the North American Chapter of the Association for Computational Linguistics: Human Language
Technologies, Volume 1, 724–728 (2019).
36. Pennington, J., Socher, R. & Manning, C. GloVe: Global vectors for word representation. In Proceedings of the conference
on empirical methods in natural language processing, 1532–1543 (Association for Computational Linguistics, 2014).
37. Mikolov, T., Sutskever, I., Chen, K., Corrado, G. S. & Dean, J. Distributed representations of words and phrases and their
compositionality. In In Proceedings of the Advances in neural information processing systems conference, 3111–3119
(2013).
38. Aronson, A. R. & Lang, F.-M. An overview of metamap: historical perspective and recent advances. J. Am. Med.
Informatics Assoc. 17, 229–236 (2010).
39. Tutubalina, E., Miftahutdinov, Z., Nikolenko, S. & Malykh, V. Medical concept normalization in social media posts with
recurrent neural networks. J. Biomed. Informatics (2018).
40. Leaman, R. & Lu, Z. Taggerone: joint named entity recognition and normalization with semi-markov models. Bioinfor-
matics 32, 2839–2846 (2016).
41. Devlin, J., Chang, M.-W., Lee, K. & Toutanova, K. Bert: Pre-training of deep bidirectional transformers for language
understanding. arXiv preprint arXiv:1810.04805 (2018).
42. McInnes, L., Healy, J. & Melville, J. Umap: Uniform manifold approximation and projection for dimension reduction.
arXiv preprint arXiv:1802.03426 (2018).
43. McInnes, L., Healy, J. & Astels, S. hdbscan: Hierarchical density based clustering. J. Open Source Softw. 2, 205 (2017).
44. Braun, V. & Clarke, V. Using thematic analysis in psychology. Qual. Res. Psychol. 3, 77–101 (2006).
9/18Supplementary Information
Figure 4. Number of posts (log) in our dataset between 2008 and 2020s. There is no trend difference between all posts and
those containing mentions related to stress.
Details of the dataset
We collected a total of 713,018 posts published for a company reviewing site from the start of 2008 up until the first quarter of
2020 for the S&P 500 companies. We filtered out posts belonging to non-US based companies, yielding a total of 439,163
posts across 399 unique S&P 500 companies. The average rating across companies ranged from a minimum value of 1.62 up to
a maximum value of 5 (µ = 3.37, σ = 0.40). While the overall fraction of stress posts per company was 1.11%, this value
ranged from 0% up to 9.52% across companies (µ = 1%, σ = 1%).
Data representatives
A total of 439,163 posts were analyzed. These posts are about companies distributed across all the 51 U.S. states (Table 3). The
highest number of posts were found in California (i.e., a total of 69,968 posts), while the lowest in Wyoming (i.e., a total of
222 posts). The posts span across 11 industries classified according to the Global Industry Classification Standard (GICS),
with the highest number of posts for companies in Information Technology, and the least number in Real Estate (Table 4). The
posts were written by managers, sales associates, software engineers, analysts, among others (Table 5). The maximum annual
number of posts between 2008 and 2020 was observed in 2016, while the lowest number of posts in 2009 (Figure 4).
10/18Figure 5. Number of posts (log) in our dataset versus state population (log). The states Washington DC and Rhode Island
have more posts that what the population size would suggest. The line of best linear fit is shown in gray. U.S. states are shown
with the two-code state abbreviation.
Figure 6. Correlation between the number of headquarters in each state in the Fortune 500 list and the number of headquarters
in each state in our dataset (Spearman r = .90). The states of Nebraska (NE) and Arizona (AR) have fewer headquarters than
what the Fortune list would suggests.
11/18Table 3. Number of posts and number of offices on the company reviewing site across U.S. States, ranked by the number of
posts published between 2008 and 2020 in descending order. The state of California had the most published posts, while the
state of Wyoming had the least published posts. The Pearson correlation between the log number of posts and the number of
companies per state in our data is .98, while the correlation between the log number of posts in our data and the log of
population size across states is .93.
U.S. State # posts # offices U.S. State # posts # offices
CA 69968 340 OK 3772 174
TX 43629 342 DC 3596 180
NY 37515 313 KS 3459 169
IL 25157 290 SC 3362 194
FL 24082 283 NV 2815 163
GA 17888 275 LA 2631 175
WA 15672 239 AL 2546 171
NC 14072 268 DE 2067 113
PA 14064 271 IA 1849 133
OH 12447 263 RI 1676 103
MA 12355 253 AR 1666 149
AZ 11834 228 NH 1627 127
NJ 11561 245 NE 1564 139
VA 11320 235 ID 1208 112
CO 9408 249 MS 1138 127
MN 8437 196 NM 1097 125
MI 7953 237 WV 803 114
MO 7657 230 ME 604 105
TN 7165 221 HI 600 85
OR 6704 206 ND 344 74
MD 6610 207 VT 324 54
IN 5727 222 MT 322 70
WI 5006 181 AK 300 57
CT 4567 186 SD 297 57
KY 4224 190 WY 222 72
UT 3925 187
Table 4. Number of posts across the Global Industry Classification Standard (GICS) sectors. More posts are generally found
in sectors having more companies, as one expects.
GICS Sector # posts # companies
Information Technology 63198 52
Consumer Discretionary 62395 40
Financials 49955 42
Health Care 36308 41
Consumer Staples 26471 28
Industrials 24074 43
Communication Services 13842 13
Energy 5510 20
Materials 5269 21
Utilities 3172 19
Real Estate 2228 16
12/18Table 5. Number of posts across roles and statuses.
Employee Title # posts
Sales Associate 8006
Manager 4536
Software Engineer 4191
Customer Service Representative 4058
Cashier 3726
Director 2819
Project Manager 2365
Senior Manager 2225
Senior Software Engineer 2019
Associate 1969
Store Manager 1963
Assistant Manager 1930
Pharmacy Technician 1747
Analyst 1660
Delivery Driver 1619
Employee Status # posts
Current Employee 181078
Current Intern 2789
Former Employee 137567
Former Contractor 3183
Former Intern 5020
Description and evaluation of the deep-learning framework
To extract stress mentions, we used the MedDL entity extraction module22 (the left rectangle in Figure 1(a)). MedDL uses
contextual embeddings and a BiLSTM-CRF sequence labeling architecture. The BiLSTM-CRF architecture23 is the state-of-
the-art deep-learning method for accurately extracting entities from text34, 35 , and consists of two layers. The first layer is a
BiLSMT network (the dashed rectangle in Figure 1(a)), which stands for Bi-directional Long Short-Term Memory (LSTM).
The outputs of the BiLSTM are then passed to the second layer: the CRF layer (enclosed in the other dashed rectangle). The
predictions of the second layer (the white squares in Figure 1(a)) represent the output of the entity extraction module. To extract
the medical entities of symptoms and drug names, BiLSTM-CRF takes as input representations of words (i.e., embeddings).
The most commonly used embeddings are Global Vectors for Word Representation (GloVe)36 and Distributed Representations
of Words (word2vec)37 . However, these do not take into account a word’s context. The word ‘pressure’, for example, could be
a stress symptom at the workplace (e.g., ‘I felt constant pressure to deliver results’) or could be used in the physics context
(e.g., ‘The solid material found in the centre of some planets at extremely high temperature and pressure’). To account for
context, contextual embeddings are generally used. MedDL used the RoBERTa embeddings as it had outperformed several
others contextual embeddings, including ELMo, BioBert and Clinical BERT22 .
MedDL was compared against two well-known entitiy extraction tools: MetaMap and TaggerOne. MetaMap is a well-
established tool for extracting medical concepts from text using symbolic NLP and computational-linguistic techniques38 ,
and has become a de-facto baseline method for NLP studies related to health39 . TaggerOne is a machine learning tool using
semi-Markov models to jointly perform two tasks: entity extraction and entity normalization. The tool does so using a medical
lexicon40 . The MedDL pre-trained model was evaluated on a labeled dataset of Reddit posts called MedRed. The MedRed
dataset was split into train (50%), dev (25%), and test (25%) sets. The MedDL method achieved an F1-score of .71 when
extracting symptoms, and an F1-score of .77 when extracting drugs (Figure 7), outperforming both MetaMap and TaggerOne
(with the F1 scores of .17/, 38 and .31/.18, respectively).
13/18Figure 7. MedDL results on the MedRed dataset compared to two competitive alternatives of MetaMap and TaggerOne when
extracting (left) medical conditions, and (right) prescription drugs.
(a) (b)
Figure 8. (a) Distribution across companies of the logarithm of stock growth values from the average stock price in 2014 and
that of 2019 (stock_growth[14−19] = stock2019 /stock2014 ) showing the stock growth is log-normally distributed. The average
stock price for year y (stocky ) is calculated as the average of the daily Adjusted Closing Prices for the year. (b) Geometric mean
¯
of the stock growth values GM(stock_growth [14−19] ) for increasing stress score percentiles for the companies of a given stress
¯
type. Error bars represent geometric standard error GSE(stock_growth[14−19] ) = GM(stock_growth [14−19] )/
√
N · σ (log(stock_growth[14−19] )).
14/18¯
Figure 9. Geometric mean of the stock growth values GM(stock growth[09,19] ) for different ratings percentiles for companies
of the four stress types. Error bars represent geometric standard error GSE(stock growth[09,19] ) =
√
¯
GM(stock growth[09,19] )/ N · σ (log(stock growth[09,19] )).
BERTopic topic modeling
To identify relevant words for each stress type, we run BERTopic26 , which is a state-of-the-art topic modeling algorithm. A
topic modeling algorithm is an unsupervised technique to extract topics that appear frequently in a piece of text (in our case, a
post). The algorithm works in four sequential steps:
1. converts each post into a 512-dimensional vector (called embedding) of numerical values using a pre-trained BERT-based
sentence transformer41 (in our case, we used the default model, that is, the “paraphrase-MiniLM-L6-v2”). BERT
(Bidirectional Encoder Representations from Transformers) is a state-of-the-art transformer-based machine learning
technique for natural language processing (NLP), which takes into account the context of each word.
2. reduces dimensionality using UMAP42 (or Unification Map) for every embedding, as many clustering algorithms handle
high dimensionality poorly. UMAP is arguably the best performing dimensionality reduction algorithm as it keeps
significant portion of the high-dimensional structure in lower dimensionality.
3. uses HDBSCAN43 for clustering with the “UMAP” embeddings, resulting similar posts being clustered together.
HDBSCAN is a density-based algorithm that works well with UMAP as the structure is preserved in a lower-dimensional
space. Additionally, HDBSCAN does not force data points to clusters as it considers them outliers.
4. identifies keywords using the c-TF-IDF26 score (Equation 5), and using that score, derives topics from the identified
keywords. To create a topic representation, we took the top 3 keywords per topic based on their c-TF-IDF scores. The
higher the score, the more representative is as the score is a proxy of information density.
kl p
c-TF-IDFl = × q (5)
ol ∑ j k j
where the frequency of each keyword k is extracted for each topic l and divided by the total number of keywords o. The
total, unjoined, number of posts p is divided by the total frequency of keyword k across all topics q.
Annotations of the words BERTopic found
For each topic, we identified the three most representative words and submitted the reviews mentioning them to six annotators.
For example, we picked three reviews containing the words ‘overtime’, ‘mandatory’, and ‘shift’ for negative stress companies,
and asked six annotators to read them and describe what type of workplaces these reviews would suggest. Upon collecting a
total of 72 free-form responses (i.e., each annotator described the reviews corresponding to the 12 topics), we conducted a
thematic analysis44 . To identify overarching themes, we used a combination of open coding and axial coding. We first applied
open coding to identify key concepts. Specifically, one of the authors read the responses and marked them with keywords. We
then used axial coding to identify relationships between the most frequent keywords to summarize them into semantically
cohesive themes.
We found three high-level themes: career drivers, industry or benefits, and emotional aspects. In the reviews, each theme
was paraphrased differently depending on the four types of company stress, allowing us to identify sub-themes. The career
drivers theme described what motivated employees to go to work. Its sub-themes concerned companies whose employees
experienced ‘considerable emotional pressure’ (negative stress), tended to ‘focus on activities outside the work’ (passive),
15/18(a) Low stress (b) Passive
(c) Negative stress (d) Positive stress
Figure 10. The number of companies per industry sector for the four stress types. IT is more prominent among positive stress
companies, while Health Care among negative stress companies.
cherished ‘their sense of control over their work’ (low stress), and enjoyed ‘a collaborative and supportive workplace culture’
(positive stress). In the industry or benefits theme, we identified sub-themes mentioning either the industry sectors of the
corresponding companies (e.g., Consumer Discretionary for negative stress, and Information Technology for positive stress)
or aspects concerning long-term financial benefits (e.g., passive and low stress). Finally, in the emotional aspects theme, we
identified sub-themes suggesting employees who experienced ‘emotional pressure’ (negative stress), ‘tedious work’ (passive),
‘good work-life balance’ (low stress), or a ‘fast-paced, high-performing, and dynamic workplace environment’ (positive stress).
Sensitivity of the results
Shorter-term growth. To test whether our results on stock growth are not affected by exogenous events such as the Great
Recession, we computed stock growth for the narrower 5-year period between 2014 to 2019:
stock2019
stock growth[14−19] = (6)
stock2014
where stocki is the average adjusted closing price of their stocks in year i. Figure 8 shows that the trend remains qualitatively
the same as that in Figure 2, even when removing the Great Recession period. Positive stress companies enjoyed the highest
¯
stock growth (with average value across all percentiles being GM(stock growth[14−19] ) = 1.97 as per Figure 8 on the right),
¯
low stress companies had the second highest (GM(stock growth[14−19] ) = 1.53), while passive and negative stress companies
¯
enjoyed the lowest growth (GM(stock growth[14−19] ) = 1.46, and 1.45, respectively).
Interaction effects between stress scores and review ratings. We tested whether our observed stock growth was genuinely
associated with positive stress companies rather than being simply associated with highly-rated companies. To this end, for
¯
each stress type, we plotted GM(stock_growth [09−19] ) against different rating percentiles (Figure 9). Highly rated companies
experienced stock growth, yet there are still significant differences across companies of different stress types: in particular,
positive stress companies of varying rating percentiles consistently enjoyed the highest growth (the yellow line in Figure 9 is
consistently above the other three lines).
Growth per industry sectors. To test whether a specific industry sector is predominant for a given stress type, we first plotted
the number of companies per industry sector according to the GICS classification (Figure 10). Information Technology was
more prominent among positive stress and low stress companies, Health Care and Financials among negative stress ones, and
Industrials and Consumer Discretionary among passive ones. To then check whether the distribution of industry sectors across
the four types of stress affected our findings for stock growth, we computed stock growth between 2009 and 2019, and did so
for the three most frequent industry sectors separately (i.e., Information Technology, Consumer Discretionary, and Health Care).
16/18(a)
(b)
(c)
¯
Figure 11. Geometric mean of the stock growth values GM(stock_growth [09−19] ) for increasing stress score percentiles for
the companies in each of the three most present industry sectors: (a) Information Technology, (b) Consumer Discretionary, and
(c) Health Care. The three sectors have sufficient data to ensure statistical significance for each percentile bin. Error bars
¯
represent geometric standard error GSE(stock_growth[09−19] ) = GM(stock_growth [09−19] )/
√
N · σ (log(stock_growth[09−19] )).
17/18We chose those three sectors because each individually contained a sufficient number of companies and, as such, allowed us to
obtain statistical significant results. Stock growth was computed as GM(stock growth[09−19] ) = Π(stock growth[09−19] (c))1/n ,
where c is each company from a given industry sector (e.g., Information Technology) in a specific (stress type,percentile) bin,
¯
and n is the number of the companies in such a bin. For the three industry sectors, we plotted GM(stock_growth) against
different stress score percentiles (Figure 11). In all three sectors, we observed that positive stress companies had consistently
higher stock growth compared to the other three stress types.
18/18You can also read