FireBuster-A Web Application for High-Resolution Fire Weather Modeling
←
→
Page content transcription
If your browser does not render page correctly, please read the page content below
United States Department of Agriculture

FireBuster—A Web Application
for High-Resolution Fire Weather
Modeling
Shyh-Chin Chen, John Benoit, Jack Ritchie, Yunfei Zhang, Hann-Ming Henry
Juang, Ying-Ju Chen, and Tom Rolinski

                               Forest             Pacific Southwest     General Technical Report   June
                               Service            Research Station      PSW-GTR-264                2019
                         RE
DE PA

                       TU

  RT
        MENT OF AGRI C U L
In accordance with Federal civil rights law and U.S. Department of Agriculture (USDA)
civil rights regulations and policies, the USDA, its Agencies, offices, and employees, and
institutions participating in or administering USDA programs are prohibited from discriminating
based on race, color, national origin, religion, sex, gender identity (including gender
expression), sexual orientation, disability, age, marital status, family/parental status, income
derived from a public assistance program, political beliefs, or reprisal or retaliation for prior
civil rights activity, in any program or activity conducted or funded by USDA (not all bases
apply to all programs). Remedies and complaint filing deadlines vary by program or incident.
Persons with disabilities who require alternative means of communication for program
information (e.g., Braille, large print, audiotape, American Sign Language, etc.) should
contact the responsible Agency or USDA’s TARGET Center at (202) 720-2600 (voice and
TTY) or contact USDA through the Federal Relay Service at (800) 877-8339. Additionally,
program information may be made available in languages other than English.
To file a program discrimination complaint, complete the USDA Program Discrimination
Complaint Form, AD-3027, found online at http://www.ascr.usda.gov/complaint_filing_cust.html
and at any USDA office or write a letter addressed to USDA and provide in the letter all of the
information requested in the form. To request a copy of the complaint form, call (866) 632-9992.
Submit your completed form or letter to USDA by: (1) mail: U.S. Department of Agriculture,
Office of the Assistant Secretary for Civil Rights, 1400 Independence Avenue, SW, Washington,
D.C. 20250-9410; (2) fax: (202) 690-7442; or (3) email: program.intake@usda.gov.
USDA is an equal opportunity provider, employer, and lender.

Authors
Shyh-Chin Chen is a research meteorologist and John Benoit is a computer
scientist, U.S. Department of Agriculture, Forest Service, Pacific Southwest
Research Station, 4955 Canyon Crest Drive, Riverside, CA 92507; Jack Ritchie is
an information systems analyst, Scripps Institution of Oceanography, University of
California–San Diego, 9500 Gilman Drive, San Diego, CA 92093; Yunfei Zhang is
a professor, National Marine Environment Forecasting Center, Ministry of Natural
Resources, 100081 Beijing China; Hann-Ming Henry Juang is a research meteo-
rologist, National Centers for Environmental Prediction, 5830 University Research
Court, College Park, MD 20740; Ying-Ju Chen is a project assistant, National
Central University, Taoyuan City, Taiwan 32001; Tom Rolinski is a meteorologist,
U.S. Department of Agriculture, Forest Service, Pacific Southwest Region, 2524
Mulberry Street, Riverside, CA 92501.

Cover: Huge smoke column on the Elk Complex in Idaho. Photo by Kari Greer.
FireBuster—A Web Application for
High-Resolution Fire Weather Modeling

Shyh-Chin Chen, John Benoit, Jack Ritchie, Yunfei Zhang,
Hann-Ming Henry Juang, Ying-Ju Chen, and Tom Rolinski

U.S. Department of Agriculture, Forest Service
Pacific Southwest Research Station
Albany, California
General Technical Report PSW-GTR-264

Published in cooperation with:
U.S. Department of the Interior
Bureau of Land Management
Abstract
Chen, Shyh-Chin; Benoit, John; Ritchie, Jack; Zhang, Yunfei; Juang, Hann-
  Ming Henry; Chen, Ying-Ju; Rolinski, Tom. 2019. FireBuster—a web applica-
  tion for high-resolution fire weather modeling. Gen. Tech. Rep. PSW-GTR-264.
  Albany, CA: U.S. Department of Agriculture, Forest Service, Pacific Southwest
  Research Station. 22 p.

Wind and weather in mountainous areas are complex because of the underlying
terrain. Typically, regional computer models are needed with sufficiently high reso-
lution to resolve such complex conditions. However, this high-resolution weather
information usually becomes available only when the critical time in fighting a
severe fire event is long past, thus the advantage of using high-resolution weather
models for fire management seems limited. To address this problem, we have
developed an experimental system called FireBuster that is designed to streamline
and automate many intermediate processes. We are routinely producing forecasts
at 5-km resolution over California and Nevada. A meteorologist can then select
any part in the domain to request a special 1-km resolution 72-hour forecast. The
resulting fire weather variables can be retrieved in a reasonable time through a web
interface as each 6-hour increment is completed. Observed fire perimeters and near-
surface weather from the MesoWest observational network are also available for
display and for future validation. In addition, 72-hour weather forecast time series
anywhere in the domain can be retrieved simply by clicking on a map. This feature
provides firefighters with detailed weather forecasts, including winds, at their loca-
tion, improving their potential to save lives and property during wildfires.
     Keywords: Fire weather, meso-scale modeling, web application.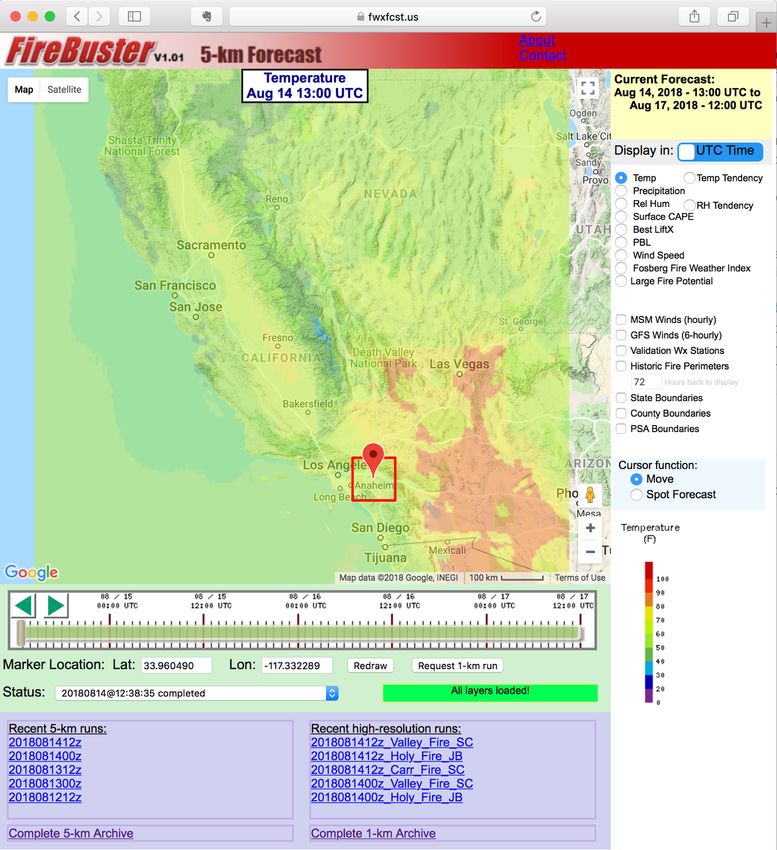
Contents
 1   1. Introduction
 3   2. Components
 3   2.1 GFS Input
 5   2.2 Regional Model
 5   2.3 Surface Station Observations
 6   2.4 Fire Perimeters
 7   2.5 FireBusterSim
 7   3. Web Display
 7   3.1 FireBuster Display
 9   3.2 Example: Bernardo Fire
12   3.3 Example: Thomas Fire
14   3.4 Example: Powerhouse Fire
14   3.5 Example: Portable Spot Forecast
18   4. Summary
19   Acknowledgments
19   U.S. Equivalents
19   References
FireBuster—A Web Application for High-Resolution Fire Weather Modeling

1. Introduction
Despite its ecological benefit, wildland fire continues to be a threat to natural
resources and societies in the United States and worldwide. The escalation of fire
management costs in recent decades to suppress the increasing extent of large wild-
land fires and fires in the wildland-urban interface has become a huge burden to
the responsible firefighting agencies. Between 2008 and 2017, the U.S. Department
of Agriculture Forest Service and agencies in the Department of the Interior spent
more than $17 billion for fire suppression (National Interagency Fire Center 2017),
prompted by the need to protect human lives as well as public and private property.
Improvements in fire weather information, and hence an improved fire management
system, would help reduce the loss of life and property.
     Although weather information has been recognized as a critical parameter in
developing and evaluating fire management strategies, its effectiveness in actual
firefighting is poorly understood and not well studied (Hesseln et al. 2010). One
constraint is a scarcity of available surface weather observations, while another is a
limitation in the spatial resolution of available numerical weather prediction models.
Both components have reduced the quality of weather information available to fire
managers (Headley 1927). The first limitation has been greatly mitigated recently
with the installation of many Remote Automated Weather Stations (RAWS) (https://
raws.nifc.gov), adding to the network of existing surface stations, throughout
the wildland areas of the United States. However, the spatial resolution problem
remains, partly because of the limited availability of official high-resolution
weather information in the vicinity of fire incidents. The current operational Global
Forecasting System (GFS) (National Modeling Center 2003) of the National Centers
of Environmental Prediction (NCEP) (e.g., Han and Pan 2011, Juang and Hong
2010, Kleist et al. 2008, Zheng et al. 2012) provides weather forecasts four times
a day at the meteorological Z times of 00z, 06z, 12z, and 18z, with a base resolu-
tion in the tens of kilometers over southern California. For the contiguous United
States (CONUS), NCEP also provides forecasts via the North American Mesoscale
(NAM) Forecast System, which uses the Weather Research and Forecasting (WRF)
regional model (https://www.mmm.ucar.edu/weather-research-and-forecasting-
model) at 12-km (7.5-mi) resolution (Rogers et al. 2009). Recently, the National
Oceanic and Atmospheric Administration (NOAA) began producing a cloud-
resolving and convection-allowing High-Resolution Rapid Refresh (HRRR) (https://
rapidrefresh.noaa.gov/hrrr/) 36-hour atmospheric model forecast system initialized
by 3-km grid with radar assimilation for the CONUS area. For additional high-
resolution forecasts, National Weather Service (NWS) forecasters can incorporate
all or part of these model outputs by using the Graphical Forecast Editor (GFE) of

                                                                                                                     1
GENERAL TECHNICAL REPORT PSW-GTR-264

                          the Interactive Forecast Preparation System (IFPS) to create and maintain a 2.5-
                          km gridded forecasts of surface-sensible elements out to 7 days. These forecasts
                          comprise the NWS National Digital Forecast Database (NDFD) (Glahn and Ruth
                          2003). Also available are some other higher resolution regional weather predictions
                          for a few selected experimental regions; however, the fire-prone mountainous areas
                          of California are not included.
                               Weather forecasts with spatial resolutions higher than the official predictions
                          described above have been available for many years (e.g., Liu et al. 2013, Mölders
                          2008, Mölders et al. 2014, Pennelly and Reuter 2017). However, these studies use
                          high-resolution models either to test downscaling suitability or to produce future
                          regional climate assessments. Applications of high-resolution weather models to
                          actual wildland firefighting on an operational basis are still scarce. Although these
                          modeling capabilities can be applied to support wildland fire events, delays in getting
                          model output to fire meteorologists and firefighters prevent such detailed fire weather
                          information from being used in actual firefighting decisionmaking. In the past, we
                          have been asked a few times to provide high-resolution fire weather information to
                          fire practitioners. However, when we finally completed the computation, the event
                          was long past, and our intelligence could, at best, be used only for postfire evaluation.
                               The California and Nevada Smoke and Air Committee (CANSAC) (https://
                          cansac.dri.edu) is one of the few organizations that provides operational-like
                          forecasts with three resolution settings more detailed than are available in current
                          official forecasts for the Western United States. CANSAC uses the WRF model for
                          these downscaled nesting forecasts, with the innermost domain covering California
                          and Nevada at 2-km resolution. To complete desired forecasts over such a big area
                          at such high resolution, the required computing resources are overwhelming. Still,
                          for firefighting and fire management support, the need remains for fire weather fore-
                          casts at spatial resolutions beyond what HRRR or CANSAC can currently provide.
                               To provide timely fire weather information at a spatial resolution relevant to
                          firefighting operations, we developed an experimental system called FireBuster,
                          bringing effective support to fire practitioners in California and Nevada. The idea is
                          to first provide twice-daily fire weather forecasts at 5-km resolution similar to those
                          in CANSAC. During an actual fire incident anywhere in California or Nevada, an
                          authorized user can submit an online request to initiate automated 1-km-resolution
                          weather model computations as well as to display weather information on a desig-
                          nated web page for the area of the targeted fire. Our current system takes less than
                          50 minutes to complete a 72-hour fire weather forecast at 1-km spatial resolution.
                               FireBuster components and weather model specifications are described in
                          section 2 of this report. Section 3 demonstrates how fire weather variables can be
                          displayed in a few sample fire events. Summary and future developments are then
                          given in section 4.
2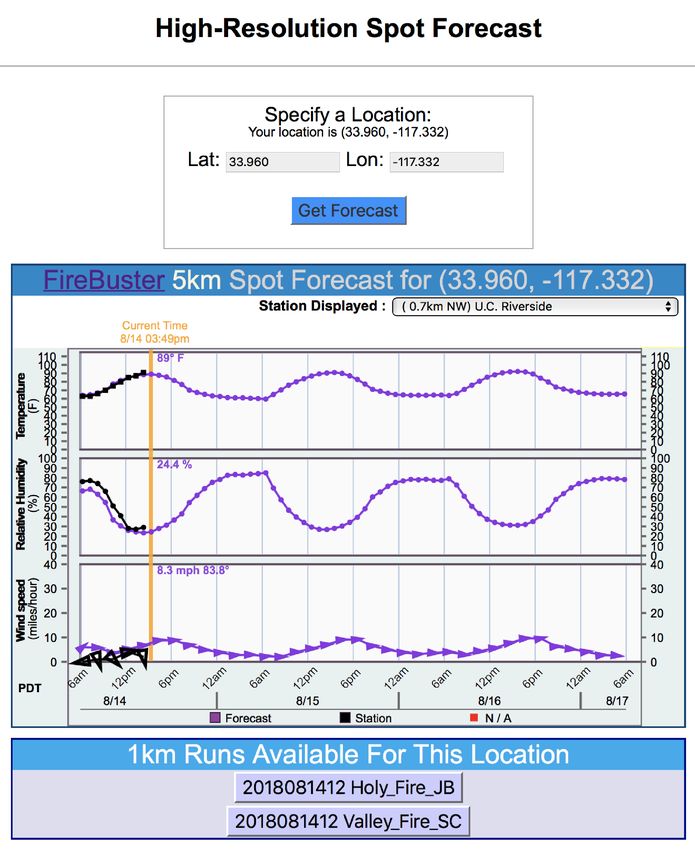
FireBuster—A Web Application for High-Resolution Fire Weather Modeling

2. Components
The FireBuster system integrates three components: NCEP’s global forecast or
analysis as input; the Regional Spectral Model (RSM) (Juang and Kanamitsu 1994)
for downscaling forecasts; and model outputs as well as data layers of surface sta-
tion observations and fire perimeters. Fire weather variables from these components
are displayed with a Google Map™ (https://developers.google.com/maps/documen-
tation/) interface that provides a fire weather intelligence system for firefighting
support and fire science research. When the global forecast input to the system
is replaced by global analysis, the forecast-oriented FireBusterProg transforms
to FireBusterSim. The difference in these two systems is simply one of forecasts
versus simulations.

2.1 GFS Input
The Global Forecasting System is the current operational global analysis and
forecast modeling system used by NCEP. The four-time-daily (00z, 06z, 12z, and
18z) forecasts are produced at model triangular truncation of 1534 (TL382), which
resolves to 13-km grid spacing at the equator. In addition to this control run fore-
cast, there are also 20 ensemble runs with slightly perturbed initial conditions with
a coarser horizontal resolution for each increment forecast. For our FireBusterProg
(https://fwxfcst.us/firebuster), we use only the control runs (72 hours forecast)
initialized at 00z and 12z, because there are relatively small ensemble spreads for
the initial 72 hours. The GFS analyses at 06z and 18z are also retrieved for Fire-
BusterSim integration.
     All GFS products can be accessed through the NCEP server NOMADS (NOAA
Operational Model Archive and Distribution System) (http://nomads.ncep.noaa.
gov/). Although the global GFS data are available at NOMADS, the lengthy data
transfer time prevented us from fetching this global dataset within the required
time period. Instead, we accessed a subsection of GRIB (GRIdded Binary) (https://
en.wikipedia.org/wiki/GRIB) data over the Western United States using a GRIB
filter available at NOMADS (http://nomads.ncep.noaa.gov/cgi-bin/filter_gfs_0p50.
pl). GFS model variables of temperature, u- and v-wind, temperature, and humid-
ity at 47 vertical standard pressure levels, and all model initialization required
surface variables, such as surface pressure, soil temperature, soil moisture, plants
resistance, skin temperature, etc. (at 0.5-degree grid spacing) are downloaded and
prepared to initialize and to force the regional model runs. We refer to this input as
the RSM0 dataset. It covers the mountainous West in a 65 × 65 grid at 40-km grid
spacing as shown in figure 1.

                                                                                                                     3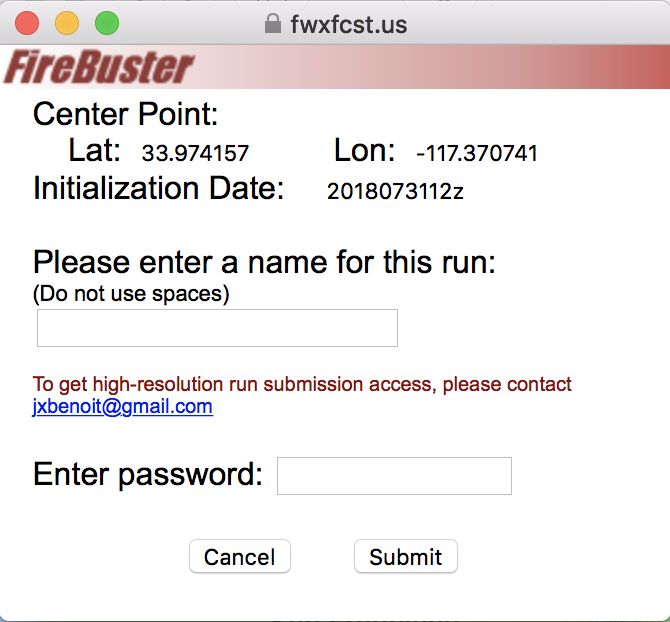
GENERAL TECHNICAL REPORT PSW-GTR-264

                                                   RSMO Data Domain

    48N

    46N

    44N

    42N

    40N

    38N

    36N

    34N

    32N

    30N

    28N

        129W        126W       123W        120W       117W        114W       111W        108W       105W        102W

Figure 1—RSM0 data domain over the Western United States. A sample of the grid is shown in the lower left corner. The entire domain
has 65 × 65 points with 40-km grid spacing.

4
FireBuster—A Web Application for High-Resolution Fire Weather Modeling
2.2 Regional Model
The GFS outputs from NCEP provided initial and lateral boundary conditions for
the 5-km resolution Mesoscale Spectral Model (MSM) (Juang 2000) runs. The
MSM is the non-hydrostatic version of the RSM, which has been used in much
of our previous regional modeling work (e.g., Chen 2001; Chen et al. 1999, 2008;
Roads et al. 2010). NCEP’s RSM/MSM was developed using similar physical
parameterizations to those of the global model in the GFS. Therefore, except for a
slight difference in the form of governing equations, RSM theoretically provides
a seamless transition of horizontal resolution from global to regional scales (Chen
et al. 1999). This RSM downscaling system thus avoids possible simulation drift
or bias resulting from a mismatch in model physics modules between the impos-
ing global and the forced regional models (Chen 2001). RSM has been tested in
many intercomparison regional climate model downscaling projects, and it showed
comparable, if not superior, climate downscaling skill (e.g., Roads et al. 2003,
Tackle 1999). The model also demonstrated mesoscale simulation ability that is
absent in the current global model. Anderson et al. (2000) showed that the model
quite realistically captured the low-level jet over the Gulf of California during the
Southwest United States monsoon season.
The regional model computations are done using in-house high-performance
computers (HPC) at the Pacific Southwest Research Station’s (PSW) Riverside
laboratory. The 5-km domain run requires slightly less than 2 hours wall-clock time
for a 72-hour forecast. Runs at this resolution are done twice daily, initialized at
00z and 12z. The former run completes around 0045 PST (Pacific Standard Time),
while the latter completes around 1145 PST. Basically our runs are 9 hours behind
the initialization Coordinated Universal Time (UTC) time. The 1-km run with a
much smaller domain needs about 50 minutes to complete a 72-hour downscaling
forecast. Running at this resolution is available upon request. The location and the
initialization time can be determined by the user, as will be shown later.
2.3 Surface Station Observations
A concern of the first-line fire managers and fire meteorologists is the accuracy of
these high-resolution models in predicting near-surface fire weather variables, the
wind field in particular; this is especially true over complex terrain such as that in Cal-
ifornia and Nevada. Although high-resolution mesoscale weather models have been
around for many decades, most of the model validation studies had been accomplished
with ground-based variables such as precipitation or surface temperature (e.g., Saito et
al. 2006) or for extreme weather events during special field experiments (e.g., Lopez et
al. 2003). A systemwide evaluation of the adequacy of using a high-resolution meso-
5GENERAL TECHNICAL REPORT PSW-GTR-264
scale model for wildland fire has yet to be conducted before land process management
tools can confidently incorporate information from such models.
In preparation for future validation of our fire weather forecast system, observed
hourly surface weather variables (wind and temperature) from the National Mesonet
Program (https://nationalmesonet.us) are also archived for comparison alongside
model simulations and forecasts. To cover the area in the current version of Fire-
Buster, we are archiving all available surface station data in California and Nevada.
These data were converted to JSON (JavaScript Object Notation) format so that they
can be readily used by the Google Maps API (Application Programming Interface)
for display. The availability of these data not only provides users a preliminary
evaluation during the first few hours of each forecast, but also provides ultimate
validation of the downscaled simulations or forecasts of the system.
Data from the National Mesonet have many sources. For example, the stations
(numbers in parentheses) in the domain include the NWS’s Weather Forecast Office
Network (90), NWS/Federal Aviation Agency Network (134), NOAA National
Water Level Observation Network (5), NOAA Coastal Stations (4), California Data
Exchange Center (7), California Hydroelectric Power Network (43), NOAA Cali-
fornia Nevada River Forecast Center (34), U.S. Climate Reference Network (10),
Desert Research Institute (47) and other universities (23), MTR Weather Forecast
Office (28), Orange County Public Network (59), Caltrans stations (78), California
Irrigation Management Information System (149), northern California NOAA
Automatic Weather Observation System (14), Remote Area Weather Stations (460),
NWS Hydrometeorological Automated Data System (460), AirNow Aire Quality
stations (27), California Air Resources Board (173), San Diego Gas & Electric Inc.
(174), Automated Position Reporting System (977), and other regional but fewer
numbered stations, for a total of 3,265 stations. These hourly data can be displayed
in their pre-assigned Google Maps zoom level, which is subjectively predetermined
by their level of reliability and significance. This procedure avoids overcrowding
the display and lessens the computing burden on the client browser.
2.4 Fire Perimeters
Available ground or aerial observed fire perimeter data are automatically down-
loaded from GeoMAC (https://www.geomac.gov/) on a daily basis. Perimeter files
are converted to GeoJSON format, which can be displayed over a Google Maps
background. A consecutive series of perimeters for a fire can be displayed simulta-
neously. Therefore, if a fire has been burning for a few days, the progression of the
fire can be displayed on the same map with fire weather information; this can be
very useful for fire meteorologists or fire managers in making timely decisions.
6FireBuster—A Web Application for High-Resolution Fire Weather Modeling
2.5 FireBusterSim
When the global forecast RSM0 input to the system is replaced by that of global analy-
sis, the forecast-oriented FireBusterProg turns into FireBusterSim (https://fwxfcst.us/
firebustersim). FireBusterSim provides an excellent way to contrast the downscaling
skill to forecast skill of FireBusterProg when the forecast uncertainty is removed.
3. Web Display
3.1 FireBuster Display
The portal for FireBusterProg is at https://fwxfcst.us/firebuster. Although all Forest
Service security requirements have been met, we are still in the process of obtaining
permission to be included within the agency’s domain (https://www.fs.fed.us). Figure
2 displays the main web page of FireBusterProg. The colored area shows the current
5-km resolution domain. We preserved the most basic features of Google Maps,
including its zooming capability. The variable data layer is also synchronized with
the zoom level of the map. A total of 11 near-surface scalar fire weather variables
can be chosen for display. These include the 2-m temperature (°F), precipitation (in
inches hr-1), relative humidity (percent), surface convective available potential energy
(CAPE) (J kg-1), best lifted-index (K), planetary boundary layer (PBL) depth (m),
windspeed (mph), Fosberg Fire Weather Index (FFWI), Large Fire Potential (LFP, F
mph2), temperature tendency (°F day-1), and relative humidity tendency (% day-1), as
well as vector winds for MSM and GFS forecasts. Temperature and humidity 24-hour
tendencies are helpful for determining magnitudes in trends, while FFWI (Fosberg
1978) and LFP (Rolinski et al. 2016) are used to reflect the level of fire danger.
Hourly surface observations, including those from RAWS, can be codisplayed
along with values forecasted by the models. For a typical forecast initialized at 00z
(completed around 0045 PST), the observations for the first 8 hours of forecast are
available. These observed surface variables can be used as a preliminary reference
to judge the quality of the downscaled forecast. Fire perimeters, when they are
available, are another useful observation dataset to be used with a forecast.
When the teardrop marker is dragged to a location on the map, or by manually
inputting longitude and latitude (which is how the center of the desired 1-km fore-
cast domain is defined), the request can be initiated. A request window will pop up
(fig. 3). The latitude and longitude of the 1-km model domain center, as well as the
initial date of the forecast, are also indicated. Naming of the incident and a password
are required before the request can be submitted. Model initialization, integration,
and display will be subsequently processed by PSW’s HPC system and a web server.
The forecast results can be accessed from the menu under “Recent 5-km runs” and
“Recent high-resolution runs” on each of the lower corners of the page.
7GENERAL TECHNICAL REPORT PSW-GTR-264
Figure 2—The landing page of FireBuster, showing the 5-km resolution domain over California. The forecast initialization and
the end of the forecast dates are shown in the upper right, followed by the displayable fire weather variables, cursor’s function,
and color scale of the displayed variable. A time slider is directly below the map. Users can input latitude and longitude for the
center of the desired 1-km run domain below the time slider, followed by two clickable buttons to redraw the map and to request
a 1-km run. Historical 5-km and 1-km runs can be accessed near the bottom of the page.
8FireBuster—A Web Application for High-Resolution Fire Weather Modeling
Figure 3—In this pop-up request 1-km run window, the center of the 1-km run domain is
placed at the shown latitude and longitude. The initial date of the run will be as shown. The
name of the run as well as an authenticated password are needed to submit the request.
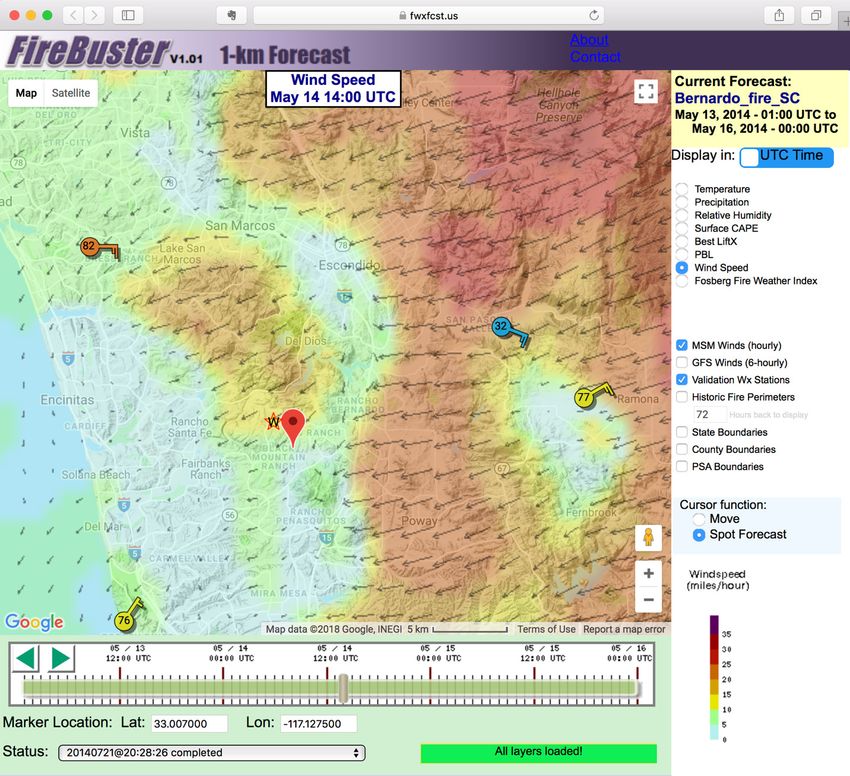
3.2 Example: Bernardo Fire
We used the Bernardo Fire, which ignited on 1100 PST, May 13, 2014, about 10 km
(6 mi) southwest of Escondido, California, to demonstrate the downscale ability of
FireBusterProg. The 5-km FireBusterProg product at the time of ignition is shown
in figure 4. A prevailing strong northeasterly wind, a signature of the extremely dry
downslope Santa Ana winds (Rolinski 2016), provided favorable conditions for fire
spread. Over the inland area, there was not much variation in windspeed and direc-
tion at such resolution. The coarse GFS wind provided even less spatial variation.
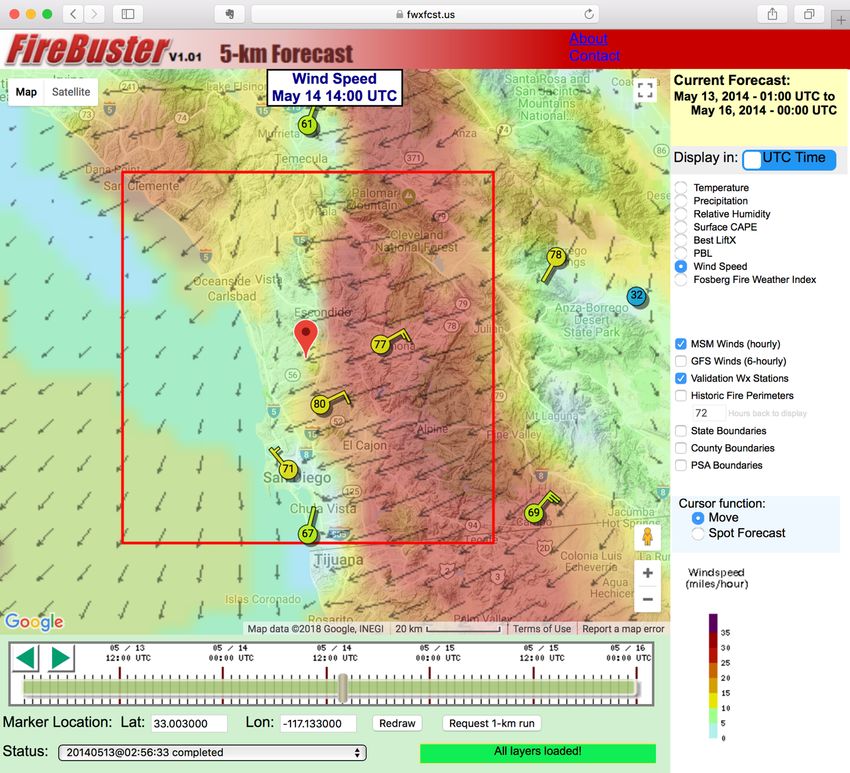
When the teardrop marker is moved to the nearby location of the fire event, the
red box indicates the domain of the 1-km run that will be executed. After the request
for the 1-km run is submitted, the results of the run will be available by selecting
the name of the fire appearing on the lower right corner of the page. Comparing the
windspeed and vector plot of the 1-km run in figure 5 to that of figure 4, strong north-
easterly to easterly winds can be seen occurring over the higher terrain in the 1-km
run, but they are not visible in the 5-km run. Cross sections of potential temperatures
9GENERAL TECHNICAL REPORT PSW-GTR-264
Figure 4—The 5-km resolution FireBusterProg display of the 1400z May 14, 2014, forecast initialized at 00z May 13, 2014,
with windspeed and vectors shown at 10-km intervals. The ignition point of the Bernardo Fire, which was about 10 km south of
Escondido, California, is marked by the teardrop-shaped marker.
in this vicinity show a significant gravity wave breaking over the higher terrain upstream
to the fire origin, with air parcels descending toward the coast (Fovell and Cao 2017).
Areas of lower wind velocities immediately to the east and northeast of the fire origin
appear to be indicative of a hydraulic jump, which is a feature of the downsloping nature
of Santa Ana wind events in this part of southern California (Cao and Fovell 2013). The
forecasted weather and wind validate well against those corresponding RAWS of Ramona
Airport (right most of the map), McClellan-Palomar Airport (upper left most), and Torrey
Pine (bottom), at this particular hour. However, the temperature observation from Escon-
dido SPV (top right) seems to be spurious. Accurate wind information around a fire event
is critical to fire managers in planning effective firefighting tactics.
10FireBuster—A Web Application for High-Resolution Fire Weather Modeling
Figure 5—A screen capture of FireBusterProg 1-km run results showing surface windspeed (in color) and wind vector forecast
for area around the Bernardo Fire of May 13, 2014, about 8.0 km (5 mi) south of Escondido, California (marked with an aster-
isk). The map shows 38th-hour forecasted weather validated on May 14 at 0700 PST.
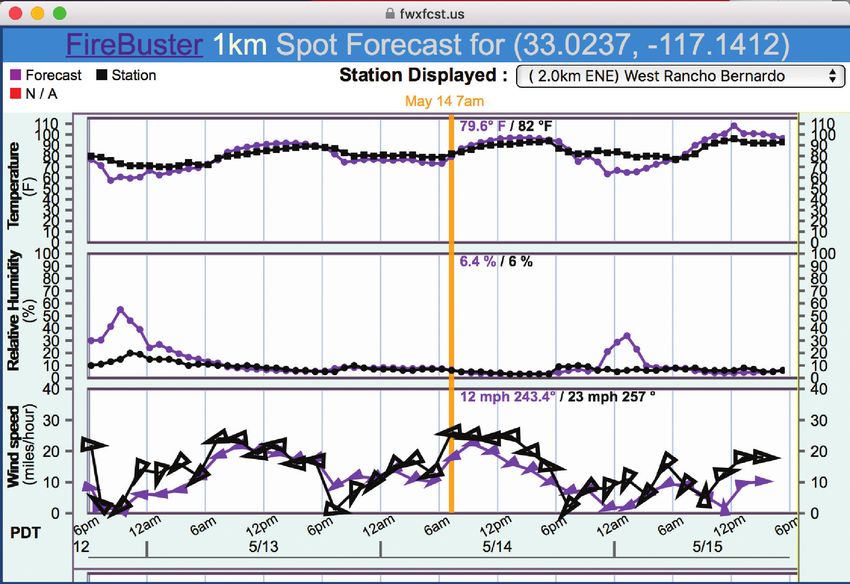
Even more useful intelligence can be extracted from 5-km or 1-km forecasts.
Figure 6 shows a feature called a fire weather “spot forecast.” By selecting “Spot
Forecast” from the variable menu, a pop-up window shows a 72-hour forecast time
series of fire weather variables of temperature, relative humidity, and wind at a
desired location. These time series of the variables give a brief evolution display
for the forecast period. The observations from a desired nearby surface station, as
shown with the relative direction and the distance to the selected location, can be
used as validation when they become available. For a real-time forecast, observa-
tions are available only for the first few hours in the forecast. Nevertheless, these
observations can serve as a preliminary accuracy verification of the forecast.
11GENERAL TECHNICAL REPORT PSW-GTR-264
Figure 6—Fire weather spot forecast at the fire incident site. Time series of temperature (F), relative humidity (percent), and wind (miles
per hour and direction) are shown for a 72-hour forecast. The nearby surface station observations can be displayed when they become
available. The yellow vertical line indicates current time when requested.
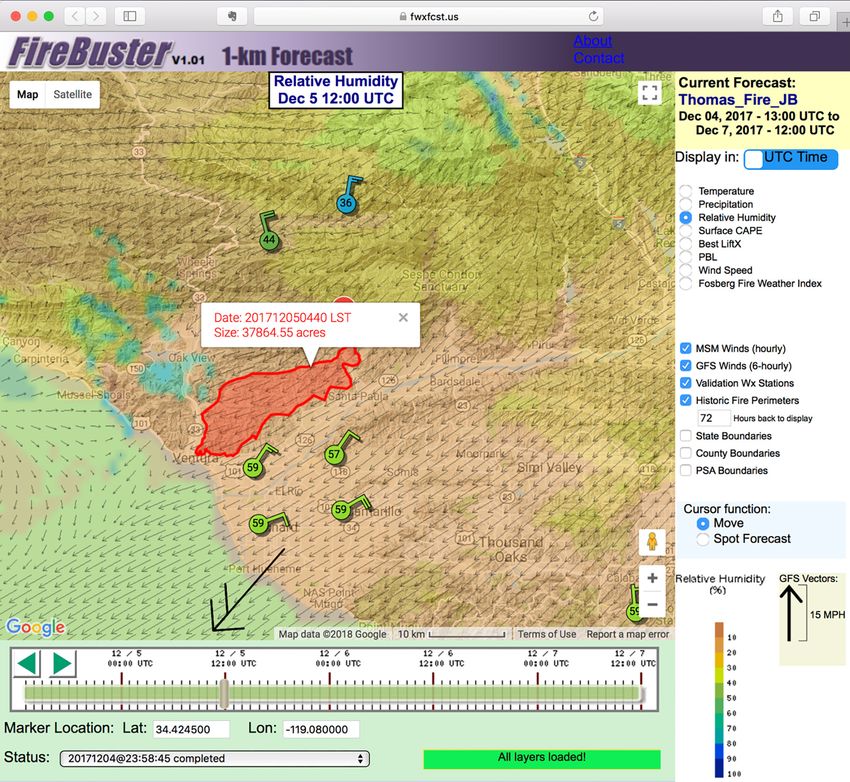
3.3 Example: Thomas Fire
The Thomas Fire (https://en.wikipedia.org/wiki/Thomas_Fire) started December 4,
2017, in Ventura County, California, just south of Thomas Aquinas College. There
had been no measurable precipitation since September 2017, causing fuel conditions
to be abnormally dry. The fire exploded quickly owing to the combination of strong
northeasterly winds and single-digit relative humidity. The Thomas Fire consumed
a total of 281,893 ac (114 078 ha); at the time it was contained, it became Califor-
nia’s largest wildfire on record.
Figure 7 shows a 1-km FireBusterProg forecast snapshot for the Thomas Fire.
Relative humidity, which was in the range of 10 to 20 percent, and forecasted north-
easterly winds, correlated well with those surface RAWS observations. FireBuster
is also capable of superimposing a fire perimeter data layer on top of fire weather
variables. Figure 7 overlays the fire agency’s observed fire perimeter for 0440 PST
December 5 on the map. It demonstrates well how the fire spread from the ignition
point southwest toward Ventura. In practice, when a fire manager is examining the
12FireBuster—A Web Application for High-Resolution Fire Weather Modeling
Figure 7—A screen capture of FireBusterProg 1-km run results showing surface relative humidity (in color) and wind vector
(miles per hour) forecast over Ventura County area around the Thomas Fire, which ignited on December 4, 2017, at 1826 PST.
The map shows 24th-hour forecasted weather validated on December 5 at 0400 PST. Available RAWS observation and the GFS
forecasted wind are also shown in miles per hour.
latest fire weather forecast such as that in figure 7, the fire perimeter data may not
be ready for viewing yet because of its delayed availability on GeoMAC. Still, this
functionality is useful for postfire evaluation.
An interesting feature can be seen when comparing the fire perimeter with
these downscaled fire weather forecasts. To the west of the western edge of the fire
perimeter over Oak View, California, a relatively calm and moist area was encircled
by surrounding taller hills. The final fire perimeter (not shown) shows split fire
fronts to the north and the south of this area. This calm and wet pocket is not pres-
ent in the 5-km forecast, let alone in the GFS forecast.
13GENERAL TECHNICAL REPORT PSW-GTR-264
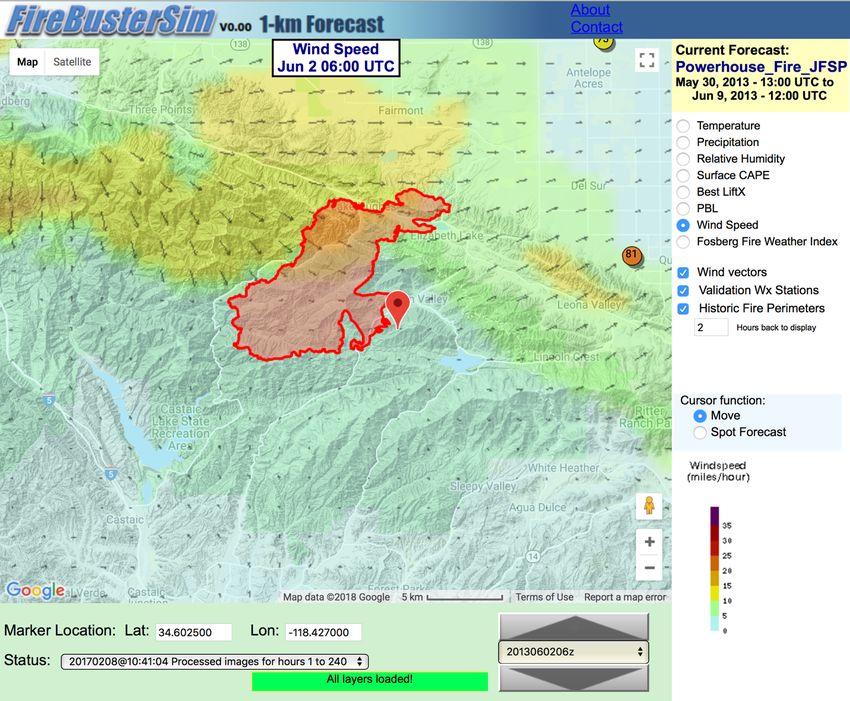
3.4 Example: Powerhouse Fire
The Powerhouse Fire (https://en.wikipedia.org/wiki/Powerhouse_Fire) in Los Ange-
les County, California, started at about 0230 PST on May 30, 2013. This fire burned
more than 12 141 ha (30,000 ac) and destroyed 53 structures. This fire was different
in nature than the previous two examples in that it was not associated with Santa
Ana winds. In fact, possibly driven by changes in synoptic conditions as well as
the diurnal variation in the mountain area, the wind changed directions a few times
during the initial stage of the fire. We use this case to highlight the high-resolution
forecast and simulation capability of FireBusterProg and FireBusterSim, respectively.
Figure 8 shows the FireBusterSim simulation of the Powerhouse Fire which
displays the simulated windspeed and wind vectors present on 2200 PST, June 1,
2013. Also shown are the fire perimeter reported at 2211 PST and available surface
station observations. Fire perimeters followed the simulated downscale wind
direction initially toward the west and south before it turned northward around 1600
PST. At 2200 PST, winds shifted to a southward direction over the fire’s northern
flank (fig. 8), and halted its northward progression. The forecasted wind demon-
strated a similar shift in wind direction (fig. 9). There is also a reversal of wind
to northerly (southward), likely owing to a nocturnal downslope wind at the time
when simulation revealed the same turn. A 1- to 2-hour delay for the time of wind
direction change was present throughout the length of the forecast when results
between FireBusterProg and FireBusterSim were compared. However, in general,
the downscaled forecasts matched well with those of the simulation and the RAWS
observations.
3.5 Example: Portable Spot Forecast
The spot forecast of surface variables in FireBuster might be a potentially useful
tool for ground crews. When the weather model resolution is coarse, the surface
variables produced by the model can be far from realistic owing to the unmatched
terrain elevations to the real world. Vertical interpolation or extrapolation would
be needed to substitute model values for actual surface values. FireBuster is rela-
tively less affected by such a problem because the high-resolution model surface
elevation is off only by a few meters from the true elevation. However, accessing
these forecasts through our data-laden web page would be limited by one’s Internet
connection speed in the field. Hence it is not very practical to operate the function
onsite through the FireBuster web page.
14FireBuster—A Web Application for High-Resolution Fire Weather Modeling
Figure 8—FireBusterSim 1-km run results showing surface wind (miles per hour in color) and wind vectors over the Los Ange-
les County area around the Powerhouse Fire, which ignited at 0230 PST on May 30, 2013. The map shows simulated weather
validated at 2200 PST on June 1, 2013. Fire perimeters reported for 2211 PST are also plotted.
To circumvent the problem, we extricated the spot forecast feature from Fire-
Buster and converted it to a standalone mobile web application (https://fwxfcst.us/
spot_forecast). Figure 10 shows the interface of this application. The device geolo-
cation is retrieved using the geolocation service feature in HTML5. The user can
also enter their desired location. Once “Get Forecast” is selected, the spot forecast
of the current 5-km run will be displayed first. From there, a 1-km run forecast can
be selected from the bottom menu if available. If this feature is proven useful to
users, it can be easily converted to an application for mobile devices.
15GENERAL TECHNICAL REPORT PSW-GTR-264
Figure 9—FireBusterProg 1-km run results showing surface wind (miles per hour in color) and wind vectors over the Los
Angeles County area around the Powerhouse Fire, which ignited at 0230 PST on May 30, 2013. The map shows simulated
weather validated at 2200 PST on June 1, 2013. Fire perimeters reported for 2211 PST are also plotted. The run was initialized
at 1200 UTC on June 1, 2013. The background terrain has been removed to better view wind vectors.
16FireBuster—A Web Application for High-Resolution Fire Weather Modeling
Figure 10—Mobile web spot forecast interface page. The current geolocation is shown on the upper portion of the page. The spot
forecast at current location from 5-km run will be shown in the bottom half of the page. If a 1-km run covers the current location, its
spot forecast data can be retrieved with a click.
17GENERAL TECHNICAL REPORT PSW-GTR-264
4. Summary
To provide the wildfire-fighting community with higher resolution and timely fire
weather information, we have developed a web-based experimental system called
FireBuster, designed to streamline and automate many intermediate processes.
The system uses the geographic information system in Google Maps to effectively
display meteorological variables. We are routinely producing forecasts at 5-km (~3
mi) resolution over California and Nevada. Users can then select any part in the
domain to request a special 1-km- (~0.6 mi-) resolution, 72-hour forecast through a
simple navigation process. All computations are done on HPCs at PSW Riverside
with a turnaround time fast enough to support fire operations. The resulting fire
weather variables can be retrieved within a reasonable time through a web interface
as forecasting of each 6-hour increment is completed. Near-surface weather from
the National Mesonest observational network is provided for future validation or
preliminary verification for the initial few hours of a forecast during the operation.
Fire perimeters of wildfires are also imported into the system daily to display along
with the fire weather variables. In addition, 72-hour spot forecast time series of
detailed surface wind, temperature, and humidity anywhere in the domain can be
easily retrieved.
We subsequently extricated the spot forecast function from the FireBusterProg
system and made it into a standalone mobile web application with the ability to
automatically input the user’s geolocation data. We believe that this feature has
the potential to be a relevant tool for ground crews for the purpose of retrieving
vital fire weather forecast information at their current location, and could poten-
tially save lives and property in the event of wildfires. If this web application is
found to be useful in the field, our plan is to convert this application into a mobile
device app. Although FireBuster features one of the highest resolution mesoscale
meteorological modeling frameworks for firefighting operational support, 1-km
grid spacing is still a bit too coarse to match the actual fire scale. Work is also
underway to improve the spatial resolution toFireBuster—A Web Application for High-Resolution Fire Weather Modeling
Acknowledgments
The development of FireBuster and FireBusterSim was supported by U.S. Forest
Service Research and Development, FS-NOAA Memorandum of Understanding
funds, and awards from the Forest Service Western Wildland Environmental Threat
Assessment Center, and Joint Fire Science Program. We are deeply indebted to our
former colleague Dr. Francis Fujioka, who inspired us to examine improved uses of
fire weather forecasting in the field and motivated us to develop this application. We
also thank Mark Jackson, Peter Roohr, and Eric Knapp, who helped us improve the
manuscript. Regional forecasts and simulations from these tools are experimental
and are intended for research use, hence no endorsement by the U.S. Department of
Agriculture is implied.
U.S. Equivalents
When you have: Multiply by: To get:
Meters (m) 3.8 Feet
Kilometers (km) .621 Miles
Hectares (ha) 2.471 Acres
References
Anderson, B.T.; Roads, J.O.; Chen, S.-C.; Juang, H.-M.H. 2000. Regional
simulation of the low-level monsoon winds over the gulf of California and
Southwest United States. Journal of Geophysical Research—Atmospheres.
105(D14): 17955–17969.
Cao, Y.; Fovell, R.G. 2013. Predictability and sensitivity of downslope windstorms
in San Diego County. Proceedings of the 15th conference on mesoscale processes.
Boston, MA: American Meteorological Society. https://ams.confex.com/
ams/15MESO/webprogram/Paper228055.html. (7 February 2019).
Chen, S.-C. 2001. Model mismatch between global and regional simulation.
Geophysical Research Letters. 29(5): 4.1–4.4.
Chen, S.-C.; Preisler, H.K.; Fujioka, F.; Benoit, J.W.; Roads, J.O. [et al.]. 2008.
Seasonal predictions for wildland fire severity. Third international symposium
on fire economics, planning and policy: common problem and approaches. Gen.
Tech. Rep. PSW-GTR-227. Albany, CA: U.S. Department of Agriculture, Forest
Service, Pacific Southwest Research Station. 13 p.
19GENERAL TECHNICAL REPORT PSW-GTR-264
Chen, S.-C.; Roads, J.O.; Juang, H.-M.H.; Kanamitsu, M. [et. al.]. 1999.
Global to regional simulation of California wintertime precipitation. Journal
of Geophysical Research—Atmospheres. 104 (D24): 31537–31532.
Environmental Modeling Center. 2003. The GFS atmospheric model. NCEP
Office Note 442, Camp Springs, MD: U.S. Department of Commerce, National
Oceanic and Atmospheric Administration, National Centers for Environmental
Prediction, Global Climate, and Weather Modeling Branch. http://www.emc.
ncep.noaa.gov/officenotes/newernotes//on442.pdf. (7 February 2019).
Fosberg, M.A. 1978. Weather in wildland fire management: the Fire Weather
Index. In: Proceedings of the conference on Sierra Nevada meteorology.
South Lake Tahoe, NV: American Meteorological Society; Boston, MA: U.S.
Department of Agriculture, Forest Service. 7: 1–4.
Fovell, R.G.; Cao, Y. 2017. The Santa Ana winds of Southern California:
winds, gusts, and the 2007 Witch Fire. Wind and Structures. 24(6): 529–564.
doi:10.12989/was.2017.24.6.529.
Glahn, H.R.; Ruth, D.P. 2003. The new digital forecast database of the National
Weather Service. Bulletin of the American Meteorological Society. February
2003: 195–201.
Han, J.; Pan, H.-L. 2011. Revision of convection and vertical diffusion schemes in
the NCEP Global Forecast System. Weather and Forecasting. 26: 520–533.
Headley, R. 1927. Fire weather forecasts needed by fire control executives. Journal
of Forestry. 25(4): 463–466.
Hesseln, H.; Amacher, G.S.; Deskins, A. 2010. Economic analysis of geospatial
technologies for wildfire suppression. International Journal of Wildland Fire.
19: 468–477. doi:10.1071/WF08155.
Juang, H.-M.H. 2000. The NCEP mesoscale spectral model: the revised version
of the nonhydrostatic regional spectral model. Monthly Weather Review. 128:
2329–2362.
Juang, H.-M.H.; Hong, S.Y. 2010: Forward semi-Lagrangian advection with
mass conservation and positive definiteness for falling hydrometeors. Monthly
Weather Review. 138: 1778–1791.
Juang, H.-M.H.; Kanamitsu, M. 1994. The NMC nested regional spectral model.
Monthly Weather Review. 122: 3–26.
20FireBuster—A Web Application for High-Resolution Fire Weather Modeling
Kleist, D.T.; Parrish, D.F.; Derber, J.C.; Treadon, R.; Errico, R.M.; Yang,
R. 2008. Improving incremental balance in the GSI 3DVAR analysis system.
Monthly Weather Review. 137: 1046–1060.
Liu, Y.; Goodrick, S.L.; Stanturf, J.A. . 2013. Future U.S. wildfire potential
trends projected using a dynamically downscaled climate change scenario. Forest
Ecology and Management. 294: 120–135. doi:10.1016/j.foreco.2012.06.049.
Mölders, N. 2008. Suitability of the weather research and forecasting (WRF)
model to predict the June 2005 fire weather for interior Alaska. Weather and
Forecast. 23: 953–973. doi:10.1175/2008WAF2007062.1.
Mölders, N.; Bruyère, C.; Gende, S.; Pirhalla, M. 2014. Assessment of the 2006–
2012 climatological fields and mesoscale features from regional downscaling of
CESM data by WRF-Chem over southeast Alaska. Atmospheric and Climate
Sciences. 4: 589–613. doi:10.4236/acs.2014.44053.
National Interagency Fire Center. 2017. Federal firefighting costs (suppression
only). https://www.nifc.gov/fireInfo/fireInfo_documents/SuppCosts.pdf. (7
February 2019).
Pennelly, C.; Reuter, G. 2017. Verification of the Weather Research and
Forecasting Model when forecasting daily surface conditions in southern
Alberta. Atmosphere-Ocean. 55(1): 31–41. doi:10.1080/07055900.2017.1282345.
Roads, J.O.; Chen, S.-C.; Cocke, S.; Druyan, L.; Fulakeza, M.; LaRow,
T.; Lonergan, P.; Qian, J.; Zebiak, S. 2003. IRI/ARCs regional model
intercomparison over Brazil. Journal of Geophysical Research. 108(D16): ACL
9-1–9-12.
Roads, J.O.; Tripp, P.; Juang, H.-M.H.; Wang, J.; Fujioka, F.; Chen, S.-C.
2010. NCEP/ECPC monthly to seasonal U.S. fire danger forecasts. International
Journal of Wildland Fire. 19: 399–414.
Rogers, E.; DiMego, G.; Black, T.; Ek, M.; Ferrier, B.; Gayno, G.; Janjic, Z.;
Lin, Y.; Pyle, M.; Wong, V.; Wu, W.S.; Carley, J. 2009. The NCEP North
American mesoscale modeling system: recent changes and future plans. 23rd
conference on weather analysis and forecasting/19th conference on numerical
weather prediction. Boston, MA: American Meteorological Association.
https://ams.confex.com/ams/23WAF19NWP/techprogram/paper_154114.htm.
(7 February 2019).
21GENERAL TECHNICAL REPORT PSW-GTR-264
Rolinski, T.; Capps, S.B.; Fovell, R.G.; Cao, Y.; D’Agostino, B.J.; Vanderburg,
S. 2016. The Santa Ana wildfire threat index: methodology and operational
implementation. Weather and Forecasting. 31: 1881–1897. doi:10.1175/
WAF-D-15-0141.1.
Takle, E.S.; Gutowski, W.J.; Arritt, R.W.; Pan, Z.; Anderson, C.J.; da Silva,
R.R.; Cayan, D.; Chen, S.-C.; Giorgi, F.; Christensen, J.H.; Hong, S.Y.;
Juang, H. -M.; Katzfey, J.; Lapenta, W.M.; Laprise, R.; Liston, G.E.; Lopez,
P.; McGregor, J.; Pielke, R.A., Sr.; Roads, J.O. 1999. Project to intercompare
regional climate simulations (PIRCS): description and initial results. Journal of
Geophysical Research—Atmospheres. 104(D16): 19443–19461.
Zheng, W.; Wei, H.; Wang, Z.; Zeng, S.; Meng, J.; Ek, M.; Mitchell, K.;
Derber, J. 2012. Improvement of daytime land surface skin temperature over
arid regions in the NCEP GFS model and its impact on satellite data assimilation.
Journal of Geophysical Research. 117: D06117. doi:10.1029/2011JD015901.
22This publication is available online at www.fs.fed.us/psw/.
Pacific Southwest Research Station
800 Buchanan Street
Albany, CA 94710You can also read