Exploring the use of artificial intelligence in price maximisation in the tourism sector: its application in the case of Airbnb in the Valencian ...
←
→
Page content transcription
If your browser does not render page correctly, please read the page content below
© Investigaciones Regionales – Journal of Regional Research, 42
(2018) – Pages 113 to 128
Section Articles

Exploring the use of artificial intelligence in price
maximisation in the tourism sector: its application
in the case of Airbnb in the Valencian Community
Luis Moreno-Izquierdo *, Galina Egorova *, Alexandre Peretó-Rovira *,
Adrián Más-Ferrando *

            Abstract: The use of machine learning is becoming more and more frequent
            in companies’ search for competitiveness. Literature on the subject show us how in
            many cases artificial intelligence can help companies to improve their knowledge
            about users, optimize prices or guide buyers in their choices.
            To confirm that the application of artificial intelligence models allows companies
            to obtain specifically better price optimisation procedures than with other tradition-
            al models, we have studied more than 10,000 Airbnb properties in the three main
            cities in the Valencian Community (Valencia, Alicante and Castellón), noting that
            the estimation process using neural networks offers significantly more satisfactory
            results than the use of hedonic models.

            JEL Classification: O32; L83; R1.

            Keywords: Machine Learning; Airbnb; tourism; hedonic prices; Valencian Region.

Explorando el uso de la inteligencia artificial en la maximización de precios
para el sector turístico: su aplicación en el caso de Airbnb en la Comunidad
Valenciana

            Resumen: El empleo del aprendizaje automático es cada vez más frecuente para
            explicar la competitividad de las empresas. La literatura nos muestra cómo la inte-
            ligencia artificial puede ayudar a empresas a mejorar su conocimiento de los usua-
            rios, optimizar los precios o guiar a los compradores en su proceso de elección.
            Para confirmar que aplicando modelos de inteligencia artificial se permite obte-
            ner específicamente mejores procedimientos de optimización de precios respecto a
            otros modelos tradicionales, se estudian más 10.000 propiedades de Airbnb en las
            tres capitales de la Comunidad Valenciana (Valencia, Alicante y Castellón), obser-
            vando que los resultados obtenidos con el modelo de redes neuronales artificiales
            son significativamente más satisfactorios que con el empleo de modelos hedónicos.

    * Applied Economic Analysis Department, University of Alicante.

    Received: 15 july 2018 / Accepted: 16 october 2018.

                                                113
114 Moreno-Izquierdo, L., Egorova, G., Peretó-Rovira, A., Más-Ferrando, A.
Clasificación JEL: O32; L83; R1.
Palabras clave: aprendizaje automático; Airbnb; turismo; precios hedónicos; re-
gión valenciana.
1. Artificial intelligence as a way of maximizing profits
and prices in the tourism sector
Autonomous and dynamic pricing in digital markets is a practice that started
gaining in popularity more than a decade ago, thanks to the huge volume of past and
real-time data available to many companies (Kutschinski et al., 2003). Until rela-
tively recently, as Lawrence (2003) points out, sellers could barely use their expe-
rience or intuition to price goods and services with a view to maximising results.
E-commerce and increased access to data, however, has made it possible to establish
an infrastructure for sellers with the potential for generating dynamic prices based on
three key elements: time (temporary dynamic pricing), buyers (price differentiation)
or bundling with other products or services (product differentiation).
The air transport market is a good example to look at when trying to understand
this development: from an ocean of data and its management through artificial intel-
ligence, a host of price maximization and differentiation processes can be carried
out. According to Piga and Filippi (2002), Mantin and Koo (2010), Malighetti et al.
(2010), Bachis and Piga (2011) and Moreno-Izquierdo et al. (2015), when dealing
with the same product (seats on a flight), airlines use algorithms in which, as well as
taking costs into account, they optimize the dates, the moment of purchase, the vol-
ume of sales made to date, or even specific interest in a certain destination.
This same strategy can be seen in other sectors, and not just those related to
tourism, as companies are increasingly able to collect, manage and analyse data,
presenting models and tools for optimising and maximising performance per user
that are increasingly precise, as pointed out by Webb et al. (2001) or Albretch et al.
(2007). The use of machine learning has been well studied for years; for example,
in recommendations to users on goods or services in which they have shown interest
(Jennings and Higuchi, 1993; Billsus and Pazzani, 1999); Alspector et al., 1997), e-
mail forwarding (Macskassy et al., 1999), modification of means of communicating
with web users (Litman and Pan, 2000) or the establishment of chatbots to speed up
and improve responses to customers (Shawar and Atwell, 2007). This scientific re-
search, however, cannot always be put into practice in companies. Although increas-
ingly accurate artificial intelligence predictive models are being tested, according to
Lang (1995) not all of these applications are profitable, since the extra profit that can
be obtained from greater predictive capacity does not always exceed the investment
necessary.
In the case of the tourism sector, as pointed out by Yu and Schwartz (2006) and
Claveria and Torra (2015), there has been intense development in research techniques
Investigaciones Regionales – Journal of Regional Research, 42 (2018) – Pages 113 to 128Exploring the use of artificial intelligence in price maximisation in the tourism sector... 115
and a growing interest in artificial intelligence over the last decade in response to
issues with profitability and sustainability. Ye et al. (2009) used comments left by
tourists on websites (blogs, forums, wikis...) to conduct a sentiment analysis on seven
destinations: New York, Los Angeles, Las Vegas, London, Rome, Paris and Venice.
Chen and Wang (2007) and Clavería et al. (2016) analysed different models to con-
trast the predicted volume of tourist arrivals to help policymakers propose strategies
and decisions to gain a competitive edge in China and Spain respectively. Meanwhile,
Akın (2015) used data on the volume of tourists arriving in Turkey to try to create
models for demand through different machine learning models, seeking to achieve
greater profitability per foreign tourist for a country that is increasingly dependent
on international arrivals. Another noteworthy example is the article by Yang et al.
(2015), who used different machine learning algorithms to predict the success of
hotel locations in the city of Beijing, identifying potentially profitable areas for the
construction of new hotels based on information from existing hotels, businesses in
the area, traffic density or the existence of metro stations, among other variables.
This evolution shows that, while we are talking about a relatively young field
of research, Jordan and Mitchell (2007) acknowledge that it is expanding fast, and
the practical applications often exceed expectations. There are, however, still many
new challenges to be overcome, in particular those related to the way in which the
machines themselves learn, their interaction in complex systems of various devices
and within their own architecture, or the processing of public and private user data.
So how does this apply to the case at hand? At Airbnb, artificial intelligence and
machine learning are essential in order to explain the development of its business
model. Chang (2017), in an article published on the Airbnb website itself, details
how Airbnb’s algorithms have been built to determine the rental price of real estate
on any given date. Approximately 150 variables are analysed, including the location
(country, market, neighbourhood), the average price on each date (price of stay, extra
cleaning costs), availability of the properties, or their quality (number of reviews,
user ratings), among a multitude of others. In addition, in all the information that
Airbnb manages, Natural Language Processing (NLP) is being used to decipher the
guest comments, host descriptions, and interaction between users, as described in
Laurent et al. (2015), in order to obtain more information with a view to optimising
the platform.
Equally, Ifrach (2015) points out how Airbnb uses machine learning to detect
owner preferences, not just those of tenants or users of the service. According to
Webb, Pazzani and Billsus (2001), observation of user behaviour patterns can pro-
vide useful examples for training artificial intelligence systems and thus create mod-
els for predicting future user behaviour. In this case, at Airbnb we find two different
types of customers (tourists and owners), with patterns that are in many cases polar
opposites, which adds complexity to the task of designing algorithms. That being
said, machine learning has helped to significantly improve matches between hosts
and guests using recommendations based on the behaviour of both hosts and guests,
revealing preferences that went beyond having the properties occupied for a maxi-
mum amount of time.
Investigaciones Regionales – Journal of Regional Research, 42 (2018) – Pages 113 to 128116 Moreno-Izquierdo, L., Egorova, G., Peretó-Rovira, A., Más-Ferrando, A.
Following the same line, Rystad, V. et al. (2017) remind us how the use of
machine learning allows us to improve the value proposition for customers, using
Airbnb as an example of the different objectives pursued through the creation of
artificial intelligence algorithms. Specifically, for the improvement of peer-2-peer
interaction, customisation of user experience, co-creation of content by hosts and
guests, search engine optimisation, trust between users and simplification of pro-
cesses.
Having arrived at this point and with real big data and artificial intelligence
applications that seem to be effective in cases such as these, different authors have
begun to make comparisons between econometric and machine learning models to
determine which of them have greater predictive capacity. In our case, and in addi-
tion to the previous articles such as Selim (2011), Limsombunchai et al. (2004) or
Peterson and Flanagan (2009) that we will cite below, we will compare the results
obtained through a hedonic price model with those of an artificial neural network
model for a base of more than 11,000 homes offered on Airbnb in three Spanish
Mediterranean destinations: Alicante, Valencia and Castellón. In determining the
model, more than twenty variables have been taken into account, which include
both elements specific to the property and others from the social, economic and
touristic environment of the destinations studied. In order to do this, a method-
ological comparison will then be made and the data will be analysed on the basis of
both models. The results show, as expected, that the neural network model is more
robust.
2. Hedonic Price Models and Artificial Neural Networks
2.1. Hedonic prices
When determining a property’s value, whether it be for rent or sale, the hedonic
pricing model has been one of the most widely used methods for decades, with the
understanding that pricing is based on a range of components that contribute a certain
value to the final good (Rigall-I-Torrent, R. et al., 2011). At first glance, it is impos-
sible to determine all the attributes that make up a product, since not only physical
or measurable factors must be taken into account, but also psychological or temporal
ones, for example. The methodology of hedonic prices allows us to estimate the value
contributed by each of the attributes (physical or otherwise) to a property, and to
make predictions about the behaviour of the rest of the properties when any of these
elements vary.
The methodology of hedonic prices is particularly useful for measuring the im-
pact of specific elements on the value of goods or services through a multiple regres-
sion analysis. In this way, the function of the price (P) that picks up each one of the
characteristics or elements can be expressed as:
Pi = b0 + b1 X1i + b2 X2i + ... + bj Xji + ei,
Investigaciones Regionales – Journal of Regional Research, 42 (2018) – Pages 113 to 128Exploring the use of artificial intelligence in price maximisation in the tourism sector... 117
where Pi is the price of good i, and each of the bXi the characteristics defined with
their corresponding regression coefficients. Finally, as is obvious, «e» represents the
margin of error.
This method has been used to determine the value of price components since the
1930s, and in the case of the tourism sector it has been used to determine the price of
hotel rooms (Espinet et al., 2003; Rigall-i-Torrent et al., 2011), private rental proper-
ties in holiday areas (Hamilton, 2007; Portolan, 2013), or Bed and Breakfasts (Monty
and Skidmore, 2003), among others.
In recent years, it has also notably been applied to estimate the value of differ-
ent attributes in price composition on the Airbnb platform, by experts like Dogru
and Beijing (2017), Gibbs et al. (2018), Chen and Xie (2017) or Wang and Nicolau
(2017), who mainly study attributes of homes such as parking facilities, washing
machines, dishwashers,... but also include variables related to social reputation;
others, like Ert et al. (2016) and Teubner et al. (2017), focus on issues such as
the photographs that owners upload to the platform, their star rating or owner re-
sponse. These studies show how the sharing of information by potential customers,
in addition to direct interaction between owners and guests —without intermedia-
tion— constitute what was a non-existent value-add in the tourism sector prior to
its digitalization.
2.2. Artificial Neural Networks
The Artificial Neural Networks (ANNs) model, on the other hand, was born as
part of research in the field of artificial intelligence, which was trying to model the
structure of the human brain and reproduce biological nervous systems’ capacity to
study and correct errors. In a manner of speaking, AANs is an artificial intelligence
model designed to replicate the processes of the human learning brain, generalise
results and respond in the most rational way possible in cases of absence or ignorance
of data (Shaw, 1992).
Neural networks make it possible to create and recognize patterns and provide
the capacity to process information that incorporates random components, with the
possibility of implementation in traditional statistical techniques (Otero and Trujillo,
1993). This is because distributions generated by non-linear and non-Gaussian pro-
cesses are more robust, based on less strict forms of distribution and have the capacity
to adapt or learn in changing environments (Lippman, 1987).
Put simply, we can represent neurons as systems formed by a branched informa-
tion input structure (dendrites), the nucleus and the branch output (axon), as can be
seen in Figure 1. In the structure of the brain, the axons of some neurons are con-
nected to the dendrites of others through synapses, one neuron being activated to
another from certain volumes and intensities of emitted-received signals (activation
threshold). This construction founded on a large number of simple elements allows
our brain to solve extremely complex problems, since each of the neurons takes a
Investigaciones Regionales – Journal of Regional Research, 42 (2018) – Pages 113 to 128118 Moreno-Izquierdo, L., Egorova, G., Peretó-Rovira, A., Más-Ferrando, A.
weighted sum of input signals, and in the event that the total input exceeds a certain
level, it transmits the signal to new neurons.
Figure 1. Functioning of a neuron
Synapses. Input
X1 Cell of the neuron
w1
X2 w2 Output
Axon
w3 S c
X3
w4
X4
The most common neural network model, reflected in James and Carol (2000)
(Figure 2), has three main components and three layers: the input data layer, the hid-
den layers -with the weighted summation functions and transformation function, and
the output layer. These processes have a large number of interconnections between
the nodes that form the layers. Through the information network, the first layer of
nodes is the one that receives the data input, transferring it to all the nodes that make
it up and once this information is collected by each one, it is adapted and transformed
by means of a predefined function. This transformation will be the output transferred
to the next layer, in turn becoming the input received by all the nodes in the second
layer through all the interconnections, until it reaches the last layer, where each ele-
ment receives information from the elements of the previous layers and provides an
output in a non-linear process.
So, neural networks are universal function approximators, a concept used by
Hornik, Stinchcombe, and White (1989), and their predictive capacity increases with
the number of layers and the number of neurons in them, although generally two or
three layers would be sufficient to solve the vast majority of the practical tasks of
classification, regression and prediction. With this, authors such as Otero and Trujillo
(1991) were able to demonstrate that neural networks can compete without signifi-
cant disadvantages with the best traditional statistical model when it comes to gener-
ating multi-period predictions.
Unlike the hedonic pricing model, ANN methodology allows non-linear relation-
ships between variables to be found and therefore can potentially provide better pre-
dictive capacity than multivariate analysis, according to Wilson et al. (2002). Other
authors, such as Claveria and Torra (2014) showed that they have a great capacity for
prediction, but that the ARIMA models surpassed them in predicting tourist demand,
although they do admit that the results of neural networks can be improved through
structure optimization and the incorporation of additional memory values.
Investigaciones Regionales – Journal of Regional Research, 42 (2018) – Pages 113 to 128Exploring the use of artificial intelligence in price maximisation in the tourism sector... 119
Figure 2. Functional structure of the neural network model
The aim of this study is to compare the two models in order to determine which
of them is the most robust in terms of predicting the value of rental properties on the
Airbnb platform. This comparison exercise has already been carried out by some pre-
vious authors, such as Selim (2011) in the Turkish market for the value of properties
in 2004, in which he compared the prediction results obtained between the hedonic
regression and the artificial network models and demonstrated the potential of the
latter to be a better alternative than the former in predicting the price of housing. A
similar result was reached in the study for 200 properties in New Zealand carried out
by Limsombunchai et al. (2004), in which the effect of factors such as the size of the
property, the number of bedrooms or its location, among others, was again analysed
by hedonic regression and neural networks. Peterson and Flanagan (2009) once more
emphasized that artificial neural networks generated fewer errors in predicting home
value prices for a sample of more than 45,000 homes in North Carolina. However, it
has not been applied to date in a comparison between tourist rental properties, as is
the case with Airbnb.
3. Data used for the study and results of the models
The goal of this study is to estimate rental value on Airbnb through a series of
defined attributes about the apartment itself, as related to the city in which the prop-
erty is located. The sample includes the apartments offered on Airbnb in the three
provincial capitals of the Valencian Community (Alicante, Valencia and Castellón)
during the months of May 2016 to May 2017. Valencian Community is one of the
most important tourist sun-and-beach destinations in Europe, receiving more than
nine million tourists per year. However, the three capitals of the region combine sun-
and-beach conditions with a complete service supply (such as universities or public
Investigaciones Regionales – Journal of Regional Research, 42 (2018) – Pages 113 to 128120 Moreno-Izquierdo, L., Egorova, G., Peretó-Rovira, A., Más-Ferrando, A.
and private hospitals), and highly-rated cultural activities, historic monuments and
famous restaurants. That implies relevant differences in the Airbnb composition with
respect to those destinations completely dependent on sun-and-beach tourism: The
three capitals cities have a lower seasonality of the tourism demand, and a less ratio
of second homes than the average of the Region of Valencia (36%).
In all the three cities studied (specially in Alicante and Valencia) there have been
a great increase of properties published in Airbnb since 2014, combining both full
apartments and rooms (full and shared). However, there is a big number of these
properties that have been never rented. This is a normal situation in collaborative
economy markets where there is an oversupply of goods (apartmets) and full infor-
mation.
Because of that, of all the homes that were offered May 2016 to May 2017 in the
Valencian Community, only those that were rented for at least one day were taken
into consideration, leaving out those that were inactive on Airbnb. Our dependent
variable will therefore be the average rental price, taking into account only those
properties that were rented for at least a day within the period being referred to.
In short, with regard to the estimation of the models, 8,096 properties in the city
of Valencia, 2,988 properties in the city of Alicante and 299 properties in Castellón
have been taken into consideration, each displaying significant differences. In the city
of Castellón, for example, single or shared room rentals predominate over complete
properties (56% compared to 44%), while in Valencia, complete properties account
for 60% of the supply and in Alicante they account for 70%.
Although these total numbers may seem very high, we must remember that the
collaborative economy is based on a basic assumption of «excess supply» (Moreno-
Izquierdo et al., 2015) and in this case it can be clearly observed by looking at the
occupancy rate. In the case of Castellón, the average occupancy rate of the properties
is 40%, and 30% in the case of single and shared rooms. In the case of Alicante, we
see a 43% occupancy rate for the complete apartments, and 35% for the rooms. And
as for Valencia, there is an occupancy rate of 48% in the case of complete buildings,
and 40% in the case of room rental.
According to the data obtained from AirDNA, as well as from the statistical data-
bases of the National Statistics Institute of Spain and the Generalitat Valenciana, the
following variables for the study of pricing in the apartments offered on Airbnb in the
three capital cities referred to (Table 1) were defined:
Table 1. Variables used for the exercise
Variable Meaning Source Mean SD
Properties Number of properties belonging to the AirDNA
7.413 18.011
owner
Superhost If the owner has a good reputation on AirDNA
0.102 0.303
Airbnb
Investigaciones Regionales – Journal of Regional Research, 42 (2018) – Pages 113 to 128Exploring the use of artificial intelligence in price maximisation in the tourism sector... 121
Variable Meaning Source Mean SD
Population Inhabitants in the area of the study INE 653,316.96 216,257.03
GDPpc GDP per capita in the study destination GVA 14,258.17 572.87
Sec/Main Volume of secondary properties in rela- GVA
9,997 3,221
tion to the total number of properties
Hot/Pop Volume of hotel beds in relation to the GVA
2.029 0.107
total population
Apt/Pop Volume of non-hotel beds in relation to GVA
0.030 0.006
total population
Entire home (dichotomous) AirDNA 0.632 0.480
Private room (dichotomous AirDNA 0.367 0.479
Shared room (dichotomous) AirDNA 0.006 0.077
Bedrooms Number of bedrooms AirDNA 1.756 1.043
Bathrooms Number of bathrooms AirDNA 1.337 0.561
MinStay Minimum authorised stay AirDNA 4.119 119.63
BusReady Advertised for companies AirDNA 0.064 0.245
N.Reviews Number of reviews left on Airbnb AirDNA 14.125 25.800
Overall Rate Guest ratings AirDNA 4.520 0.555
OccRate Occupancy rate for the property AirDNA 0.441 0.257
T.Rented Times the property or room has been AirDNA
14.856 18.642
rented
CancelStrict Strict cancellation policy AirDNA 0.355 0.478
CancelModerate Moderate cancellation policy AirDNA 0.294 0.455
CancelFlexible Flexible cancellation policy AirDNA 0.342 0.475
CancelSuperStrict Extremely strict cancellation policy AirDNA 0.001 0.037
N.Photos Number of photos the owner has put on AirDNA
18.361 12.876
Airbnb
3.1. Comparing of obtained results
Once the theoretical basis of both models has been introduced, in this case study,
to work the models correctly, we proceeded to divide the sample randomly: 70% of
the observations are aimed at the training stage of the models, while the remaining
30% is used to test the quality of the results.
After determining the variables that form part of the estimate, two regressions of
hedonic models are performed through the Ordinary Least Squares method, in the
Investigaciones Regionales – Journal of Regional Research, 42 (2018) – Pages 113 to 128122 Moreno-Izquierdo, L., Egorova, G., Peretó-Rovira, A., Más-Ferrando, A.
first case with Classical Standard Errors, and in the second with robust errors consis-
tent with Heterocedasticity. The model therefore looks like this:
Pi = b0 + b1Properties + b2Superhost + b3Population + b4GDPpc +
+ b5Sec/Main + b6Hot/Pop +b7Apt/Pop + b8Entire home + b9Private room +
+ b10Bedrooms + b11Bathrooms + b12MinStay + b13BusReady + b14N.Reviews +
+ b15Overall Rate + b16OccRate + b17T.Rented + b18CancelStrict +
+ b19CancelModerate + b20CancelFlexible + b21N.Photos + ei
with 21 variables that bring together different facts about the properties of the apart-
ment, but also about the cities used for the study.
The results obtained by hedonic regression are shown in Table 2, with two dif-
ferent models depending on the robustness of the errors. Three of the five variables
related to the city structure are omitted from the results of the two estimated models
because of their relationship with the variable «per capita income». This indicates
that the structure of tourism supply in these cities is, in turn, closely linked to the
average income of their inhabitants. It is worth indicating that in subsequent tests
carried out, as the number of cities in the model increased, these variables did reflect
results in the model.
Table 2. Hedonic price estimation results
Model 1:Classical Standard Model 2: Heterocedasticity
Variable
Errors HC1 consistent errors
Properties .4355309*** .4355309***
Superhost .5838822 .5838822
Population 2.42e-06 2.42e-06
GDPpc .0008722 .0008722
Sec/Main (omitted) (omitted)
Hot/Pop (omitted) (omitted)
Apt/Pop (omitted) (omitted)
Entire home 55.4549*** 55.4549***
Private room 16.16067*** 16.16067***
Bedrooms 11.21321*** 11.21321***
Bathrooms 25.80606 *** 25.80606 ***
MinStay –.0017646*** –.0017646***
BusReady 2.04221 2.04221
N.Reviews –.0459272** –.0459272**
Investigaciones Regionales – Journal of Regional Research, 42 (2018) – Pages 113 to 128Exploring the use of artificial intelligence in price maximisation in the tourism sector... 123
Model 1:Classical Standard Model 2: Heterocedasticity
Variable
Errors HC1 consistent errors
Overall Rate 5.15262*** 5.15262***
OccRate –32.8399*** –32.8399***
T.Rented –.0075623 –.0075623
CancelStrict 12.01599* 12.01599*
CancelModerate 8.743345 8.743345
CancelFlexible 8.336936 8.336936
N.Photos .4763268*** .4763268***
N: 8877 8877
Adj R-squared 0.4957 0.4967
F-Test 485.65*** 482.57***
*** = 99% significance (p-value less than 0.001).
** = significance at 95% (p-value less than 0.05).
* = significance at 90% (p-value less than 0.1).
The model presented shows good accuracy, with most of the variables selected
displaying a 99% significance, especially those related to the properties of the rent-
al homes. Likewise, the F-Fisher test also performed at a confidence level of 99%.
While it is true that the value of R2 is equal to 0.4967, a value below what has been
obtained in articles made in similar years, this is due to the lack of significance or
omission of the values of the variables that situate the context of the properties. In the
case of the purchase or rental value of properties, their location or context has a high
degree of explanation, and for reasons already explained our hedonic model is unable
to reflect, based on the variables chosen, this relationship.
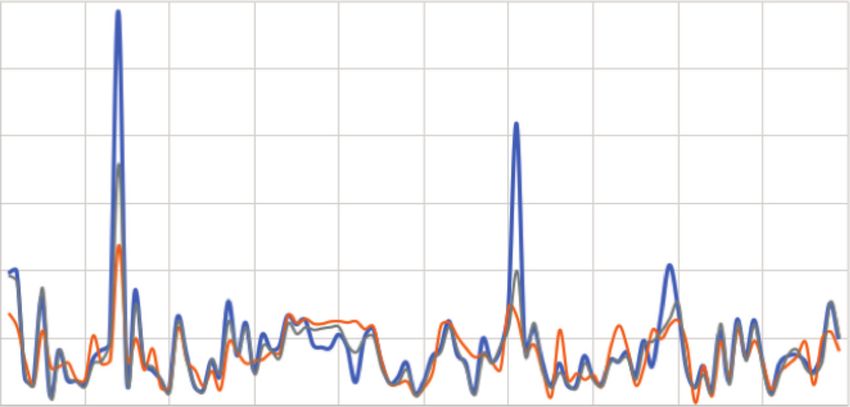
This difference in accuracy can be seen in Graph 1, where the price taken as a
dependent variable is compared with the estimate under the model with robust errors.
Taking 100 random values from the sample for a clear representation, we can see how
there are certain properties in which the real price is much higher than the estimate,
indicating this lack of explanation in the variables used in the model. In the same
graph, we can also observe how the estimate made using the neural network model
has better accuracy with respect to the prices used as our dependent variable.
In the process of developing our artificial neural network, a network of three
layers is selected with activation functions in the neurons in sigmoid or logistic type
hidden layers. This kind of neural network usually gives the best results in these types
of exercises according to the literature mentioned in this article. To find the Airbnb
rental price, the same set of variables that define our hedonic model are taken as in-
puts, and this set of data is used to train our model.
In the regularization algorithm, two phases of iterations were established for the
elimination of variables with excessively small coefficients within minimums. This
Investigaciones Regionales – Journal of Regional Research, 42 (2018) – Pages 113 to 128124 Moreno-Izquierdo, L., Egorova, G., Peretó-Rovira, A., Más-Ferrando, A.
method involves smoothing out and eliminating variables with large regularization
parameters and free construction of the model with small values. Models with small
regularization parameters can be useful if we assume that the variables remaining
after elimination are significant for constructing the model.
Graph 1. Comparison of real prices and estimated prices for 100 homes
600
Detected prices
Hedonic model prices
500 AAN model prices
400
300
200
100
0
0 10 20 30 40 50 60 70 80 90 100
Previously, we set the work areas of the neurons, which positively affects the
obtaining of a more efficient model, since it does not allow the work areas to leave
the data area, keeping all neurons operating.
As a result of all of the above, the neural network estimation process was found
to be far more satisfactory than using the two observed hedonic models, with an accu-
racy of 87% versus the 46% obtained with the hedonic regression model. In addition,
there was also a decrease in the mean square error, dropping to less than 2,700 with
the neural network model, confirming that the application of machine learning mod-
els allows companies such as Airbnb to obtain better price optimisation procedures
than with other traditional systems.
4. Conclusions
Machine learning models are making great strides in many scientific fields, but
they are also making a difference on a business level. Strategies related to communi-
cation and marketing, with new gamma systems, the interpretation of user reactions
or optimized pricing models, are today considered unthinkable by many companies
if not coupled with artificial intelligence and big data models.
In the case of tourism, the emergence of Airbnb in recent years has provided
a further example of how machine learning can optimise performance. Unlike air
transport, where only one provider (the airline) acts on the basis of its demand in-
Investigaciones Regionales – Journal of Regional Research, 42 (2018) – Pages 113 to 128Exploring the use of artificial intelligence in price maximisation in the tourism sector... 125
formation, Airbnb must manage millions of owners and practically the same number
of tourists. In other words, they must make it their mission to optimise two key ele-
ments: price according to the qualities of the product, and utility of demand in pro-
viding the best option to the user.
Airbnb employees themselves acknowledge in various articles published on their
website that without machine learning models it would be impossible to maximise
performance, and this article, to some degree, gives visibility to that statement. For
the data chosen —Airbnb apartments in three Spanish tourist destinations— there
can be no doubt that neural networks work better than traditional regression models.
This result makes us think first and foremost about relationships between variables
that are not only linear, and secondly, about the greater predictability of machine
learning models, which only increases with continued use, the amount of data avail-
able and the number of variables.
Unfortunately, today it is not so simple for all tourism companies to boast this
type of mechanism to optimize their performance: it requires vast quantities of data
and processing, as well as experts in data analysis. The tourism sector in sun-and-
beach destinations
In addition, two important issues in the practical application of artificial neural
networks are still the interpretability of results and the stability of the model, al-
though the solution to these problems may be to strengthen the model by including
Boosting and/or Naive Bayesian Classifier algorithms in the assembly.
In short, in the example used for apartment rental on Airbnb, neural networks
have led to a considerable improvement in prediction compared to the hedonic
price model. On a business level, this can mean a significant competitive advan-
tage, provided that the benefits of its application outweigh the costs of its devel-
opment.
5. References
Akin, M. (2015): «A novel approach to model selection in tourism demand modeling», Tour-
ism Management, 48, 64-72.
Albrecht, J., and Hwa, R. (2007): «A re-examination of machine learning approaches for sen-
tence-level MT evaluation», Proceedings of the 45th Annual Meeting of the Association of
Computational Linguistics, 880-887.
Alspector, J., Koicz, A., and Karunanithi, N. (1997): «Feature-based and clique-based user
models for movie selection: A comparative study», User Modeling and User-Adapted In-
teraction, 7(4), 279-304.
Bachis, E., and Piga, C. A. (2011): «Low-cost airlines and online price dispersion», Interna-
tional Journal of Industrial Organization, 29, 655-657.
Billsus, D., and Pazzani, M. J. (1999): «A hybrid user model for news story classification»,
UM99 User Modeling, Vienna, Springer, 99-108.
Chang, R. (2017): Using Machine Learning to Predict Value of Homes On Airbnb, Airbnb.
URL: https://medium.com/airbnb-engineering/using-machine-learning-to-predict-value-
of-homes-on-airbnb-9272d3d4739d.
Investigaciones Regionales – Journal of Regional Research, 42 (2018) – Pages 113 to 128126 Moreno-Izquierdo, L., Egorova, G., Peretó-Rovira, A., Más-Ferrando, A.
Chen, K. Y., and Wang, C. H. (2007): «Support vector regression with genetic algorithms in
forecasting tourism demand», Tourism Management, 28(1), 215-226.
Chen, Y., and Xie, K. (2017): «Consumer valuation of Airbnb listings: a hedonic pricing ap-
proach», International Journal of Contemporary Hospitality Management, 29(9), 2405-
2424.
Claveria, O., and Torra, S. (2014): «Forecasting tourism demand to Catalonia: Neural networks
vs. time series models», Economic Modelling, 36, 220-228.
Claveria, O., Monte, E., and Torra, S. (2015): «Tourism demand forecasting with neural net-
work models: different ways of treating information», International Journal of Tourism
Research, 17(5), 492-500.
— 2016): «Combination forecasts of tourism demand with machine learning models», Ap-
plied Economics Letters, 23(6), 428-431.
Dogru, T., and Pekin, O. (2017): What do guests value most in Airbnb accommodations? An
application of the hedonic pricing approach.
Ert, E., Fleischer, A., and Magen, N. (2016): «Trust and reputation in the sharing economy: The
role of personal photos in Airbnb», Tourism Management, 55, 62-73.
Espinet, J. M., Saez, M., Coenders, G., and Fluvià, M. (2003): «Effect on prices of the
attributes of holiday hotels: a hedonic prices approach», Tourism Economics, 9(2),
165-177.
Gibbs, C., Guttentag, D., Gretzel, U., Yao, L., and Morton, J. (2018): «Use of dynamic pricing
strategies by Airbnb hosts», International Journal of Contemporary Hospitality Manage-
ment, 30(1), 2-20.
Hamilton, J. M. (2007): «Coastal landscape and the hedonic price of accommodation», Eco-
logical Economics, 62(3-4), 594-602.
Hornik, K., Stinchcombe, M., and White, H. (1989): «Multilayer feedforward networks are
universal approximators», Neural networks, 2(5), 359-366.
Ifrach, B. (2015): How Airbnb uses machine learning to detect host preferences, Airbnb. URL:
https://medium.com/airbnb-engineering/how-airbnb-uses-machine-learning-todetect-
host-preferences-18ce07150fa3.
James, R. C., and Carol, E. B. (2000): «Artificial Neural Networks in Accounting and Finance:
Modeling Issues», International Journal of Intelligent Systems in Accounting, Finance and
Management, 9: 119-144.
Jennings, A., and Higuchi, H. (1993): «A user model neural network for a personal news ser-
vice», User Modeling and User-Adapted Interaction, 3(1), 1-25.
Jordan, M. I., and Mitchell, T. M. (2015): «Machine learning: Trends, perspectives, and pros-
pects», Science, 349(6245), 255-260.
Kutschinski, E., Uthmann, T., and Polani, D. (2003): «Learning competitive pricing strate-
gies by multi-agent reinforcement learning», Journal of Economic Dynamics and Control,
27(11-12), 2207-2218.
Lang, K. (1995): «Newsweeder: Learning to filter netnews», Machine Learning Proceedings
1995, 331-339.
Laurent, P., Chollet, T., and Herzberg, E. (2015): Intelligent automation entering the business
world.
Lawrence, R. D. (2003): «A machine-learning approach to optimal bid pricing», Compu-
tational modeling and problem solving in the networked world, Boston, MA, Springer,
97-118.
Limsombunchai, V., Gan, C., and Lee, M. (2004): «House Price Prediction: Hedonic Price
Model Vs. Artificial Neural Network», American Journal of Applied Sciences, 1:3,
193-201.
Lippmann, R. P. (1987): «An introduction to Computing with Neural Nets», IEEE ASSP Maga-
zine, April, 4-22.
Investigaciones Regionales – Journal of Regional Research, 42 (2018) – Pages 113 to 128Exploring the use of artificial intelligence in price maximisation in the tourism sector... 127
Litman, D. J., and Pan, S. (2000, July): «Predicting and adapting to poor speech recognition in
a spoken dialogue system», AAAI/IAAI, 722-728.
Macskassy, S. A., Dayanik, A. A., and Hirsh, H. (1999): «Emailvalet: Learning user prefer-
ences for wireless email», Proceedings of Learning about Users Workshop, IJCAI’99.
Malighetti, P., Paleari, S., and Redondi, R. (2010): «Has Ryanair’s pricing changed over time?
An empirical analysis of its 2006-2007 flights», Tourism Management, 31, 36-44.
Mantin, B., and Koo, B. (2010): «Weekend effect in airfare pricing», Journal of Air Transport
Management, 16, 48-50.
McCulloch W. S., and Pitts W. A, (1943): «Logical calculus of ideas immanent in nervous ac-
tivity», Bulletin of Mathematical Biophysics, 5, 115-133, https://www.cs.cmu.edu/~epxing/
Class/10715/reading/McCulloch.and.Pitts.pdf.
Monty, B., and Skidmore, M. (2003): «Hedonic pricing and willingness to pay for bed and
breakfast amenities in Southeast Wisconsin», Journal of Travel Research, 42(2), 195-199.
Moreno-Izquierdo, L., Ramón-Rodríguez, A., and Ribes, J. P. (2015): «The impact of the in-
ternet on the pricing strategies of the European low cost airlines», European Journal of
Operational Research, 246(2), 651-660.
Otero, J. M., and Trujillo, F. (1991): «Red neuronal para la Predicción de la Tasa de Actividad
Femenina». Comunicación presentada a la V Reunión ASEPELT-ESPAÑA, Gran Canaria,
20-21 de junio.
— (1993): «Predicción multivariante y mutiperiodo de una serie temporal económica median-
te una red neuronal», Estadística Española, 35, 345-375.
Peterson, S., and Flanagan, A. (2009): «Neural network hedonic pricing models in mass real
estate appraisal», Journal of Real Estate Research, 31(2), 147-164.
Piga, C., and Filippi, N. (2002): «Booking and Flying with Low-cost Airlines», International
Journal of Tourism Research, 4(3), 237-249.
Portolan, A. (2013): «Impact of the attributes of private tourist accommodation facilities onto
prices: A hedonic price approach», European Journal of Tourism Research, 6(1), 74.
Rigall-I-Torrent, R., and Fluvià, M. (2011): «Managing tourism products and destinations
embedding public good components: A hedonic approach», Tourism Management, 32(2),
244-255.
Rystad, V., Aarseth, H. W., and Fardal, F. L. (2017): How two-sided platform startups can use
machine learning to improve the value proposition (Master’s thesis, NTNU).
Selim, S. (2011): «Determinants of house prices in Turkey: Hedonic regression versus artificial
neural network», Expert Systems with Applications, 36(2), 2843-2852.
Shaw, J. (1992): «Neural network resource guide», AI Expert, 8(2), 48-54.
Shawar, B. A., and Atwell, E. (2007): «Chatbots: are they really useful?», Ldv forum, 22(1),
29-49.
Teubner, T., Hawlitschek, F., and Dann, D. (2017): «Price Determinants On Airbnb: How Rep-
utation Pays Off In The Sharing Economy», Journal of Self-Governance & Management
Economics, 5(4).
Wang, D., and Nicolau, J. L. (2017): «Price determinants of sharing economy based accom-
modation rental: A study of listings from 33 cities on Airbnb.com», International Journal
of Hospitality Management, 62, 120-131.
Webb, G. I., Pazzani, M. J., and Billsus, D. (2001): «Machine learning for user modeling»,
User modeling and user-adapted interaction, 11(1-2), 19-29.
Wilson, I. D., Paris, S. D., Ware, J. A., and Jenkins, D. H. (2002): «Residential property price
time series forecasting with neural networks», Knowledge-Based Systems, 15(5-6), 335-
341.
Yang, Y., Tang, J., Luo, H., and Law, R. (2015): «Hotel location evaluation: a combination of
machine learning tools and web GIS», International Journal of Hospitality Management,
47, 14-24.
Investigaciones Regionales – Journal of Regional Research, 42 (2018) – Pages 113 to 128128 Moreno-Izquierdo, L., Egorova, G., Peretó-Rovira, A., Más-Ferrando, A.
Ye, Q., Zhang, Z., and Law, R. (2009): «Sentiment classification of online reviews to travel
destinations by supervised machine learning approaches», Expert systems with applica-
tions, 36(3), 6527-6535.
Yu, G., and Schwartz, Z. (2006): «Forecasting short time-series tourism demand with artificial
intelligence models», Journal of Travel Research, 45(2), 194-203.
Zukerman, I., and Albrecht, D. W. (2001): «Predictive statistical models for user modeling»,
User Modeling and User-Adapted Interaction, 11(1-2), 5-18.
Investigaciones Regionales – Journal of Regional Research, 42 (2018) – Pages 113 to 128You can also read