Validation of MODIS and AVHRR Fire Detections in Australia
←
→
Page content transcription
If your browser does not render page correctly, please read the page content below
117
Validation of MODIS and AVHRR Fire Detections in

                                                                                                                     Validation of MODIS and AVHRR Fire Detections in Australia 117-131
Australia
Forghani, A.,1* Reddy, S.,2 Thankappan, M.2 and Cechet, B.3
1
  Science, Technology, Engineering and Mathematics (STEM), University of South Australia (UniSA)
 Adelaide, Australia, and Faculty of Science & Technology, and University of Canberra (UC), Canberra,
 Australia, E-mail: alan.forghani@unisa.edu.au
2
  Geoscience Australia, GPO Box 378 Canberra ACT 2601, Australia
3
  Australian Defence Force Academy (ADFA), University of New South Wales (UNSW), Campbell ACT
 2612, Australia
*Corresponding Author
DOI: https://doi.org/10.52939/ijg.v17i3.1907

Abstract
The Sentinel Bushfire Monitoring System is an internet-based mapping tool which provides timely spatial
information to fire agencies across Australia. The mapping system allows users to identify active fire
locations that pose a potential risk to communities and property. Sentinel at Geoscience Australia currently
provides hotspot information derived from Moderate Resolution Imaging Spectroradiometer (MODIS) and
Advanced Very High Resolution Radiometer (AVHRR) sensors on a continent-wide and daily basis enabling
the fire community and general public to locate active fires. There has been little validation undertaken of the
Sentinel since the system began operating in November 2002. Validation datasets have been collected for this
work during the 2003-2007 fire seasons. Five study areas were selected to validate the detection capabilities
of the MODIS and AVHRR hotspot product with fire activity that was mapped using high resolution earth
observation imagery. The objective is to evaluate the reliability with which hotspots identified in MODIS and
AVHRR thermal data can be used to identify fires. This consists of comparing the accuracy of AVHRR versus
MODIS and quantifying the accuracy of both products. This objective is achieved by characterising errors
through a stratified random sampling technique establishing a relationship between the ‘fire’ and ‘no fire’
condition, and error assessment using multi- source reference datasets over coincident MODIS and AVHRR
pixels. The validation framework comprised two key approaches including validation of AVHRR hotspots in
relation to MODIS hotspots and validation of both MODIS and AVHRR hotspots using multi-sensor earth
observation imagery datasets. The study identified sources of errors associated with the Sentinel hotspots
which could be used to improve the performance of hotspot algorithms and provide user-friendly information
for the users. Statistical analysis revealed that overall commission errors of MODIS and AVHRR hotspots
over the 5% sample data were 15% and 68% respectively, and overall omission errors of MODIS and
AVHRR hotspots were 17% and 23% respectively. An important outcome of this study is the production of a
database of fire locations derived from high-resolution imagery, which can serve as a resource for future
validation efforts as detection algorithms evolve and sensors change.

1. Introduction
Increasing efforts are being directed to produce          locations which are a potential risk to communities
comprehensive fire products such as hotspots at a         and property. A collaborative project between the
national/global scale. Hotspot is an area with            Defence Imagery and Geospatial Organisation
elevated thermal spectral response on an airborne or      (DIGO), CSIRO Land and Water and Geoscience
satellite image. There are two major fire mapping         Australia (GA) led to the implementation of the
systems in Australia that include the Sentinel            Sentinel national bushfire monitoring system in
Bushfire Monitoring System (https://hotspots.dea.-        2002, for detection and monitoring of bushfires in
ga.gov.au) and the Firewatch (https://srss.landgate.-     Australia. The system has been operated by
wa.gov.au/fire.php). These fire mapping systems           Geoscience Australia since 2005.
generate fire hotspot information from NOAA and               Key requirements for Near Real Time (NRT)
MODIS sensors to provide timely spatial                   detection and monitoring of fires consist of frequent
information to fire agencies across Australia. The        observations and rapid mapping of hotspot locations
mapping system allows users to identify active fire       at a national scale at least on a daily basis. The fire

International Journal of Geoinformatics, Volume 17, No. 3, June 2021
Online ISSN 2673-0014/ © Geoinformatics International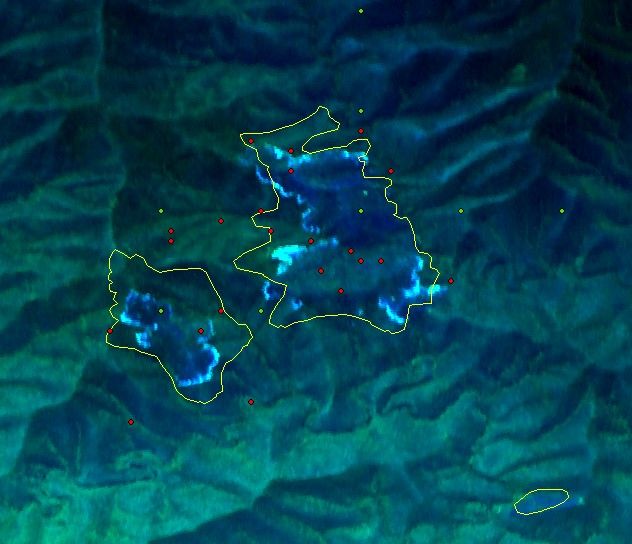
118
detection algorithm must be fast (within an hour of                    resolutions, each MODIS instrument views almost
acquisition), robust, accurate and automatic (without                  every point of the Earth approximately twice daily

                                                                                                                                           Validation of MODIS and AVHRR Fire Detections in Australia 117-131
human intervention) in order to implement control                      with a viewing swath of more than 2,330 km. Their
measures. Ahern et al., (1998 and 2001) noted that                     improved spatial resolution and spectral calibration
these requirements meet the needs of key users                         offer low cost, high quality data for active fires
including      regional/global     change     research                 studies. MODIS data offer a larger dynamic range
community, policy and decision makers as well as                       of radiance values (12-bit quantization) than
fire and emergency managers. The speed of                              AVHRR data (10-bit quantization), thereby
obtaining and disseminating fire information is                        reducing the saturation problem associated with fire
underpinned to a large extent, by the fire monitoring                  detection of AVHRR. The raw image data is
systems (Gregoire et al., 2000 and Ahmad and                           received by Geoscience Australia's Data Acquisition
Alkhatib, 2014). However, the accuracy of fire                         Facility at Alice Springs. The data is processed to
information is a common issue for the users. This                      create a surface temperature image known as the
paper will address the accuracy of Sentinel Bushfire                   MOD14 product. Hobart gives duplicated coverage
Monitoring as users continuously demand accurate                       of Eastern Australia, and extends coverage to New
product delivered rapidly.                                             Zealand. The MODIS data is processed to detect
    The accuracy of fire detection is calculated in                    hotspots applying a contextual algorithm (Giglio et
terms of commission and omission errors as well as                     al., 1999). Fires are identified by flagging pixels in
error distributions over various locations (Forghani                   the MODIS data where the temperature value
et al., 2007a). Commission and omission errors have                    exceeds threshold values (~300K. Principally, the
been reported by users and this validation work aims                   algorithm uses the strong emission of mid-infrared
to characterise and assess the accuracy of Sentinel                    radiation from fires (Matson and Dozier, 1981). It
hotspots. Errors of omission represent “failure to                     examines each pixel of the MODIS swath, and
detect fires” and errors of commission represent                       ultimately assigns each pixel to one of the following
“false alarms or false positives” pixels identified as                 classes: missing data, cloud, water, non-fire, fire or
fires. The focus of this paper is accuracy assessment                  unknown. Sentinel uses radiance (brightness)
of the Sentinel MODIS and AVHRR hotspots. To                           temperatures* (Rybicki et al., 2004) in the 4 µm and
facilitate discussion about accuracy of fire detection,                11 µm bands for detection of hotspots. The
we provide an overview of Sentinel bushfire                            algorithm developed by the University of
monitoring system and relevant literature. This                        Maryland/NASA detects hotspots if T4 - T11 ≥ 20K
paper describes work to quantitatively assess the                      (10K for night passes) and T4 > 320K (315K for
accuracy, in terms of rates of commission and                          night passes), where, T4 and T11 represent
omission errors, of MODIS and AVHRR fire                               brightness temperatures in Kelvin derived from
hotspot detections in Australia as produced by the                     MODIS bands 22 and 31 respectively (Kaufman et
Sentinel system. This type of research is a valuable                   al., 1998). Hotspots exceeding the threshold value
contribution to the data environment supporting fire                   of 305 K will be detected by Sentinel. MODIS
management in Australia, particularly as it makes                      channel 22 saturates at 335 Kelvin and channel 21
recommendations for the improvement and future                         saturates at about 504 Kelvin.
validation of the Sentinel system (Grang, 2009).                            The AVHRR sensor on-board the NOAA 17 and
                                                                       18 satellites cover 1.09 km² AVHRR pixel at nadir,
1.1 Geoscience Australia’s Sentinel Bushfire                           using two thermal bands in the spectral range of
Mapping System                                                         10.3 μm to 11.3 μm and 11.5 μm to 12.5 μm. The
The Sentinel system accesses data from the MODIS                       AVHRR bands 3B (3.55 - 3.93 μm) and 4 (10.30 -
and AVHRR satellites. MODIS (on Terra and Aqua)                        11.30 μm) are the most useful region of the
obtain images of Australia four times a day (twice                     electrometric spectrum for hotspot detection in
during the day and twice during the night). MODIS                      which fires appears as bright pixels. The AVHRR
has 36 spectral channels at three spatial resolutions,                 channel suitable for fire detection is the mid-
250m in two channels (red and near infrared (NIR)),                    infrared channel. Radiation is measured in five
500m in five channels (going from blue to short                        distinct wavebands. The visible channel 1 and near
wave infrared (SWIR) and one km at the remaining                       infrared (NIR) channel 2 measure reflected solar
29 channels (ranging from blue to thermal infrared                     radiation whereas the thermal channels 4 and 5
(TIR).Collecting data at three different spatial                       measure emitted thermal infrared.

* Brightness temperature is the temperature a black body in thermal equilibrium with its surroundings would have to be to duplicate the
observed intensity of a grey body object at a given frequency (https://en.wikipedia.org/wiki/Brightness_temperature).

International Journal of Geoinformatics, Volume 17, No. 3, June 2021
Online ISSN 2673-0014/ © Geoinformatics International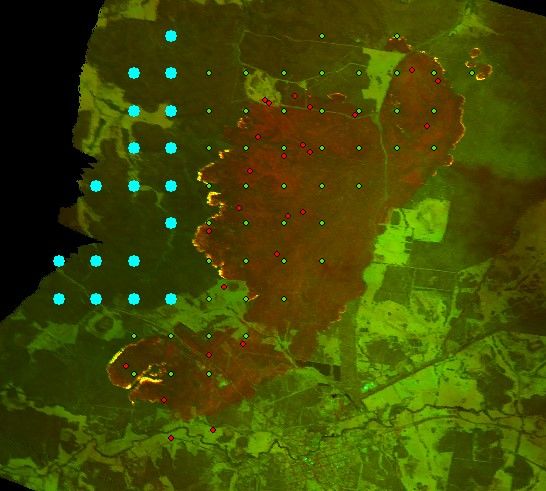
119
Channel 3, in the mid infrared, is a hybrid and           Csiszar et al., (2006), Schroeder et al., (2008) and
sensitive to a combination of both reflected and          Hawbaker et al., (2008) and Turner et al., (2012) at

                                                                                                                   Validation of MODIS and AVHRR Fire Detections in Australia 117-131
emitted radiances (Hay, 2000). This channel is            various scales. Justice et al., (2002) concluded that
highly sensitive to objects which are emitting            under the ideal conditions a fire of 0.005 ha can be
thermal energy at high temperatures (290 Kelvin),         detected with near 100% probability. However,
e.g. vegetation fires. The algorithm cannot detect        there is limited validation in Australian landscapes.
fires through thick cloud or smoke. Sentinel maps         Furthermore, a review of the literature revealed
hotspots from AVHRR band 4 and 3B using a fully           insignificant quantitative validation of Sentinel
automated contextual algorithm (Giglio et al., 1999       hotspots had been undertaken in Australia (Forghani
and Giglio, 2009) that was modified to Australian         et al., 2007 and 2014). Three major associated
environment by Rogers et al., (2006). The use of          factors are access to limited ground truth validation
AVHRR in addition to MODIS not only increases             data, affordability of high resolution data and
hotspot observations per day but it builds                funding issues for field data collection (Setzer and
redundancy in case of a MODIS sensor failure.             Malingreau, 1996). Consequently, there is a need for
                                                          a systematic quantification of the accuracy of both
1.2 Relevant Studies                                      MODIS and AVHRR hotspot products in Australia.
Hotspot detection algorithms and the science of fire      Fire detection accuracy (errors of commission and
detection have been widely discussed by Lee and           omission and their distribution) is also important
Tag (1990), Justice et al., 1993, Flasse and Ceccato      from the users’ perspective. Studies by Liew et al.,
(1996), Setzer and Malingreau (1996), Chu et al.,         (1998), Loboda and Csiszar (2006), Hyvarinen
1998), Giglio et al., (1999, 2003, 2008, 2009), Giglo     (2006) and Nakau et al., (2006) highlighted that
(2007 and 2009), Kushida, (2006), Li et al., (2001),      AVHRR derived fire products in general tended to
Morisette et al., (2002), Rogers et al., (2006),          overestimate burnt area/hotspots whereas MODIS
Molina-Pico et al., (2016), Lutakamale and Kaijage,       hotspots products tended to slightly underestimate
(2017), Mubarak et al., (2018) and Jang et al.,           burnt area/hotspots.
(2019), Gibson, et al., (2020), and FIRMS, (2021).            Liew et al., (1998) validated MODIS and
Most hotspot algorithms use fixed thresholds              AVHRR fire spots using SPOT 4 data over Sarawak
applied to single or multiple bands of thermal IR         in Malaysia and Sumatra in Indonesia; they
data for both MODIS and AVHRR sensors and                 concluded that most fires detected by SPOT were
contextual analysis of the pixel and its background       detected by MODIS also while some small fires
(Li et al., 2001). Limitations exist with fixed           detected by MODIS were not detected by SPOT.
threshold algorithms including the need to                The AVHRR exhibited high commission errors.
specifically tune thresholds for each application to      They suggested applying adaptive thresholds to
encompass unique environmental conditions                 overcome commission errors present in hotspots.
(Gautama et al., 2008). Other limitations include the     Wooster et al., (2003) used an adaptive thresholding
inability to detect small low intensity hotspots          approach to detect potential hot pixels containing
(Wang and Smith, 2007). In the MODIS version 3            active fires from bi-spectral infrared detection
active fire detection algorithm’s sensitivity to small    (BIRD) imagery (thermal infrared at 10μm).
fires was sacrificed to reduce false alarms over          Wooster et al., (2003) implemented hotspot
certain surface types during the day (Justice et al.,     detection algorithm developed by Zhukov et al.,
2002). The MODIS 4, contextual fire detection             (2005) which was tested over BIRD imagery in
algorithm was enhanced which increased the ability        Sydney. Also, Hyvarinen (2006) compared fires
to detect small cool fires (Giglio et al., 2003). Wang    detected from 2002 to 2005 by the Finnish detection
et al., (2007) further formulated an improved             system for AVHRR imagery and the MODIS based
algorithm from the MODIS version 4 contextual             system developed by NASA and the University of
algorithm to improve the algorithms ability to            Maryland. The research found very few fires greater
capture small cool fires. Evaluation of the MODIS         than 10 ha detected by satellite can be matched with
active fire product to quantify detection rates of both   in-situ observations of forest fires.
Terra and Aqua MODIS sensors was carried out by               Furthermore, Nakau et al., (2006) compared
Hawbaker et al., (2008). Finding, MODIS had the           detection of hotspots from AVHRR and MODIS
ability to capture large fires in the US, but may         satellite imagery over boreal forests in Alaska and
under represent fires in areas with high cloud, rapid     Siberia employing field data collected by fire
burning or small and low intensity fires.                 fighters and aerial surveys. A detection accuracy of
    Extensive validation of the MODIS active fire         46.5% was reported when comparing ground
products has been carried out by Justice et al.,          observation and hotspots detected from AVHRR
(2002), Giglio et al., (2003), Morisette et al., (2005)   imagery. Other studies such as Hiavka and

International Journal of Geoinformatics, Volume 17, No. 3, June 2021
Online ISSN 2673-0014/ © Geoinformatics International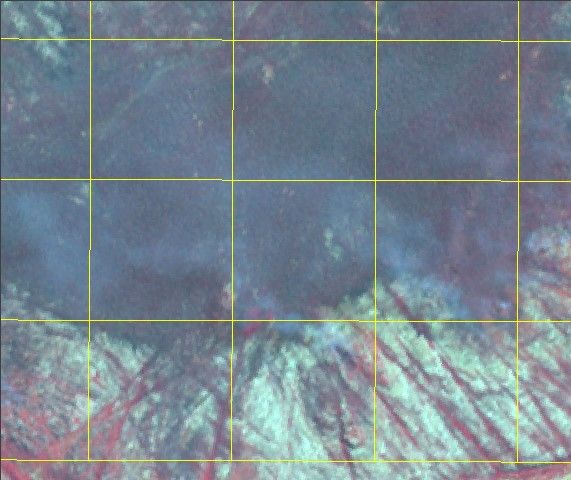
120
Livingston (1997) and Hiavka and Dungan (2002)            Western Australia. A detailed assessment of
investigated the effects of pixel size and model          Sentinel hotspots is therefore required. Davide

                                                                                                                  Validation of MODIS and AVHRR Fire Detections in Australia 117-131
based corrections for increasing the accuracy of          Ascoli et al., (2014) developed a method to linking
areal estimates of fragmented cover types. They           genetic algorithms (GA) to the Rothermel fire
degraded fire scar thematic maps derived from a           spread model. They validated GA randomly to
European Remote Sensing Satellite (ERS-1) image           create solutions of fuel model parameters to form an
with a 12m pixel spacing to a 100m and degraded           initial population. Solutions are then validated
fire scar thematic maps produced from a Landsat           against observations of fire rate of spread via a
MSS image with 57m pixel spacing to 250 MODIS             goodness-of-fit metric. They showed that GA
map. They used an approach similar to Oleson et al.,      improved the performance of the Rothermel model
(1995) and Moody and Woodcock (1996) who                  in three published custom fuel models for litter,
applied MODIS and Synthetic Aperture Radar                grass and shrub fuels and recommended that GA
(SAR) images to produce coarse resolution maps at         may be considered as a viable method to calibrate
250m and 100m respectively. In this regard, the           custom fuel models in fire modelling systems based
coarse resolution maps are simulated by degrading         on the Rothermel model.
the fine resolution map directly, rather than
degrading the original image and classifying it.          2. Validation Method
    Rogers et al., (2006) implemented hotspot             The study consists of two key approaches:
detection algorithm developed by Giglio (2007)            validation of AVHRR hotspots using MODIS
algorithm for Geoscience Australia Sentinel for           hotspot data and validation of both MODIS and
AVHRR hotspot products. A preliminary validation          AVHRR hotspots using high resolution imagery
exercise indicated that the system captures 85% of        such as ASTER and Landsat data. We used the
hotspots. Their study was undertaken over limited         datasets listed in Table 1(a and b) to validate the
areas in Queensland, the Northern Territory and           system as shown in Figure 1.
                                        Table 1a: Validation datasets
 Fire Validation Datasets       Source                      Location                Comments
 Daedalus 1268 Airborne         NSW Rural Fire Services     Eastern Australia       18 scenes
 Thematic Mapper (ATM)          (NSWRFS)
 ASTER                          Geoscience Australia        Australia wide          12 scenes (Table 1b)
 Landsat 5 and 7                Geoscience Australia        Australia wide          14 scenes
 MODIS                          Geoscience Australia        Australia wide          28 scenes,
 NOAA                           Geoscience Australia        Australia wide          25 scenes
 Fire polygons                  NSW Rural Fire Services                             ESRI shapefiles
                                Sydney
 Sentinel website (MODIS and    Geoscience Australia        Australia wide          ESRI shapefiles
 NOAA hotspots)
 Firewatch website (MODIS and   Firewatch Perth             Western Australia and   Comparison only
 NOAA hotspots)                                             Northern Territory
 Field information              NSW Rural Fire Services     Wollongong and          Photographs of fires
                                Illawarra                   Illawarra
       Table 1b: Parameters of ASTER and Landsat 7 data used to validate the Sentinel hotspots from
                                        the MODIS active fire

International Journal of Geoinformatics, Volume 17, No. 3, June 2021
Online ISSN 2673-0014/ © Geoinformatics International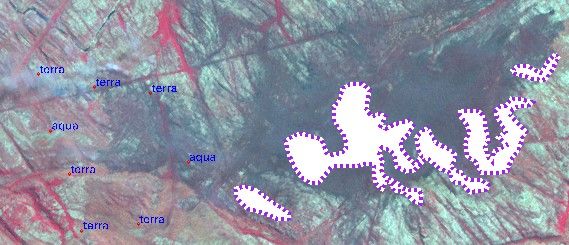
121

                                                                                                                                      Validation of MODIS and AVHRR Fire Detections in Australia 117-131
  (a) Spatial distribution of coincident Landsat imagery searched
                                                                    (b) Spatial distribution of coincident NSWRFS airborne scanner
      from GA earth observation archive over the fire season
                                                                                   imagery over during the fire season

  (c) Spatial distribution of coincident ASTER imagery over the
                                                                    (d) Spatial distribution of AVHRR and MODIS hotspots in the
                              fire season
                                                                                                fire season

   Figure 1: The spatial distribution of selected coincident imagery for analysing active fires in 2006-2007

2.1 Validation of AVHRR Hotspots Using MODIS
Hotspots                                                                 • The number of hotspots from each sensor were
In order to assess AVHRR hotspot detection                                 compared in to order provide a basis for
performance, the following process was used:                               selection of required reference earth
    • Daily hotspots derived from night passes of                          observation imagery (TM, ETM+, ASTER,
      AVHRR and MODIS data covering the period                             and NSWRFS airborne datasets) for areas with
      from October 2006 to February 2007 were                              high commission and omission errors (Figure
      collected. The time difference between                               2).
      selected MODIS and AVHRR passes is about
      two hours. For consistency, those AVHRR or                    A comparison of hotspots from AVHRR and
      MODIS hotspots beyond the two hour                            MODIS observations indicates that there are about
      difference of their detection time     were                   49.5% of AVHRR hotspots which match with
      excluded from the analysis.                                   MODIS hotspots. Given relative accuracy of
                                                                    MODIS hotspot products in comparison to AVHRR
   • Spatial analysis was applied to select AVHRR                   hotspots data (e.g. Liew et al., 1998, Ichoku et al.,
     hotspots using a buffering technique to                        2003, Loboda and Csiszar, 2006, Hyvarinen, 2006,
     compensate for differences in geolocational                    Nakau et al., 2006 and Gautam et al., 2007), and
     accuracies between two sensors. The New                        applying high confidence level (80-90%) of the
     South Wales Rural Fire Services (NSWRFS)                       MCD14ML product (Figure 2c), it was found that
     fire polygons digitised from airborne imagery                  about 50% of AVHRR hotspots are accounted as
     and field information were also used in the                    false alarms.
     spatial analysis process.

International Journal of Geoinformatics, Volume 17, No. 3, June 2021
Online ISSN 2673-0014/ © Geoinformatics International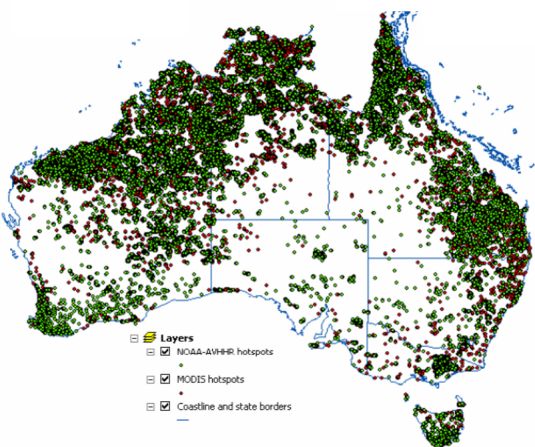
122
      Number of hotspots

                                                                                                                                     Validation of MODIS and AVHRR Fire Detections in Australia 117-131
            60000

            50000
                                                                                                    AVHRR - NOAA 17 & 18
            40000                                                                                   satellites
                                                                                                    AVHRR & MODIS match
            30000

            20000                                                                                   MODIS - Terra and Aqua
                                                                                                    satellites
            10000

                    0
                           October    November        December           January        February
                                        Fire season October 2006 to February 2007

                               Figure 2a: Summary of analysed hotspots for the fire season

 Figure 2b: Relative accuracy of AVHRR hotspots compared with MODIS hotspots detected by Sentinel
                    throughout Australia each day during the 2006-2007 fire seasons

  Figure 2c: Comparing relative accuracy of AVHRR hotspots with MODIS hotspots using confidence
                          level from MODIS Collection 5 active fire product

The months of November and December (days 26 to                                    AVHRR were spatially coincident with MODIS. In
61) experienced the highest commission errors as                                   addition, on 29 November 2006, AVHRR detected
shown above (Figure 2a and 2b). The cause of this                                  6381 hotspots compared to 2665 hotspots by
will be discussed in a later section. On 28 October                                MODIS. Of the AVHRR 6381 hotspots, only 2727
2006 for example, AVHRR detected 1114 hotspots                                     hotspots detected by AVHRR were spatially
compared to 310 hotspots by MODIS. Of the 1114                                     coincident with MODIS. In these two examples,
AVHRR hotspots, only 118 hotspots detected by                                      commission errors of AVHRR hotspots are mainly
International Journal of Geoinformatics, Volume 17, No. 3, June 2021
Online ISSN 2673-0014/ © Geoinformatics International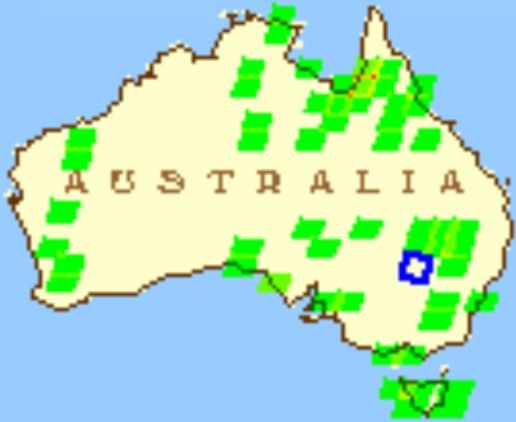
123
located in southern and eastern Australia. Locations    latitude ranges influencing the fire characteristics.
with the largest omission and commission errors         We used three strata based on regions (latitude) as

                                                                                                                   Validation of MODIS and AVHRR Fire Detections in Australia 117-131
were studied in detail using high resolution earth      shown in Figure 3: hotspots located in region 1
observation imagery.                                    (10°S, 20°S), hotspots in region 2 (20°S, 30°S) and
                                                        hotspots in region 3 (30°S, 43°S). Random samples
2.2 Validation of Hotspots Using High Resolution        were then selected from each stratum. The same
Earth Observation Imagery                               proportions are selected within each stratum,
2.2.1 Random sampling                                   making the sample a proportionately stratified
Accuracy assessment of the entire hotspots database     random sample. Taking inappropriate, inadequate,
demands significant resources (imagery, ground          or excessive sample sizes adversely influences the
survey data and staff). Reducing the number of          quality and accuracy of study. Based on the
observations was achieved through random                guidelines for sampling produced by Cochran
sampling. This study divided the hotspots into three    (1977) and Bartlett et al., (2001) 5% of hotspot
subgroups (strata) and took a simple random sample      samples from AVHRR (3265) and MODIS (3135)
in each subgroup based on some characteristic           from the fire season population of 65,315 and
which were decided according to the major               62,698 hotspots respectively were generated at
variables being studied (Yates, 1960). This involved    random, in a stratified manner, using the R
selection of 5% of MODIS and AVHRR hotspots             programming         environment        (http://cran.r-
from the total hotspots population for the fire         project.org/).
season using      a     stratified-random    sampling
(proportional or quota random sampling) approach        2.2.2 Error assessment using airborne data
followed by error estimation (within 5% sample          Generally,      airborne      campaigns/surveys     are
population) supported through a range of imagery        logistically expensive and may not be possible for
sources. An advantage of stratified sampling over       an endeavour such as this work due to
simple random sampling is that it enables               organisational priorities. However, this study took
representation of both the overall population and       advantage of airborne scanner data acquired by the
key subgroups of the population, especially small       NSWRFS (Cotterill, 2007). The spatial resolution of
minority groups. For this study, the variable of        these data varies from 6m to 11m and offer
interest is the geographical location of hotspot and    sufficient spatial detail for locating fire pixels.
the stratification factor that will be the geographic

                 Figure 3: Stratification of MODIS and AVHRR hotspots into three regions

International Journal of Geoinformatics, Volume 17, No. 3, June 2021
Online ISSN 2673-0014/ © Geoinformatics International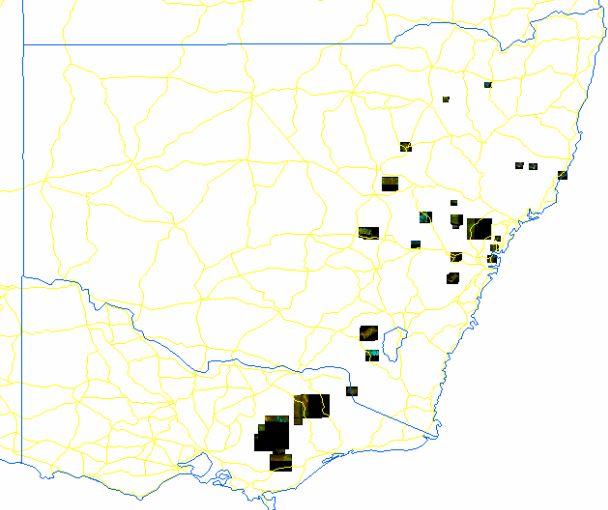
124

                                                                                                                                        Validation of MODIS and AVHRR Fire Detections in Australia 117-131
                                                                      MODIS and AVHRR hotspots are shown in red and green
                                                                  respectively. There are a number of false AVHRR hotspots that are
 MODIS and AVHRR hotspots are shown in red and green                   related to threshold values of hotspot detection algorithm
 respectively, and the small polygon on the bottom right shows
 fire polygon about one km2 (yellow) indicating a small fire is
 detected by neither MODIS nor by AVHRR

 MODIS hotspots (red) are superimposed on airborne image
                                                                   MODIS hotspots (red) are superimposed on airborne image and
 and no AVHRR hotspot is detected due to the size of fire
                                                                   AVHRR hotspots are shown in green and cyan that cyan dots are
 (0.24 km2)
                                                                                          false positives

 Commission error of AVHRR hotspots (cyan) and MODIS
 hotspots (red); area of each fire is about 0.20 - 0.95 km2.
 MODIS failed to detect these fires while they were detected         Omission error of AVHRR hotspot and presence of MODIS
 by AVHRR (green)                                                    hotspots (red); areal size of each fire is about 0.24 - 0.9 km2

   Figure 4: Examples of omission and commission errors of AVHRR and MODIS hotspots using airborne
                      imagery. Note: the hotspots (dot points) shown are not to scale

International Journal of Geoinformatics, Volume 17, No. 3, June 2021
Online ISSN 2673-0014/ © Geoinformatics International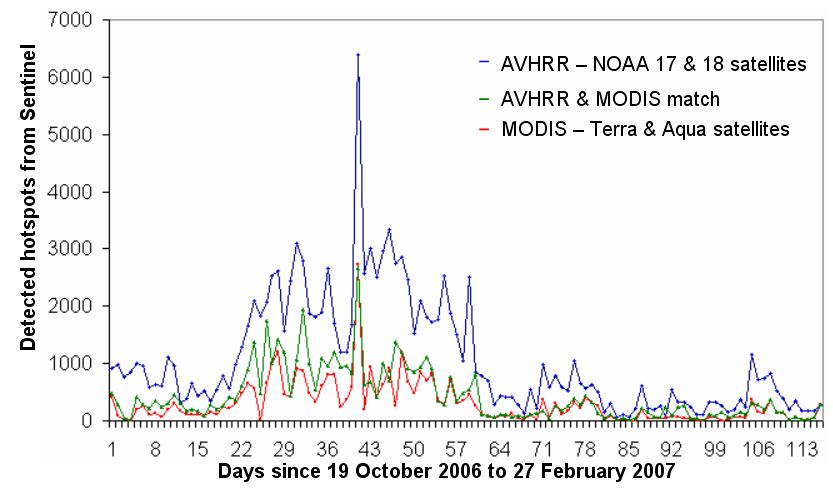
125
A hotspot was selected as ‘true’ fire if it satisfied the hotspots were superimposed on the reference
following conditions: (a) it falls within one of the images. Examination of thermal and multispectral
Validation of MODIS and AVHRR Fire Detections in Australia 117-131
perimeters of the burnt-area polygons; (b) its MODIS data reveals significant discrepancy in
thermal brightness temperature (290° to 338 Kelvin spatial location (1800m to 3800m) of the assessed
for AVHRR, and 305 to 504 Kelvin for MODIS), hotspots with the fire scars seen on ASTER data.
(c) there must be an obvious trace of smoke plume Quantitative assessment suggests that most hotspots
emanating from the fire, and (d) area of fires is detected from MODIS have high correspondence to
equal or greater than one km2. Figure 4 provides the fires mapped in ASTER and Landsat data. It was
examples of omission and commission errors of found that the MODIS Sentinel active fire detection
AVHRR and MODIS hotspots using reference algorithm performed well with low commission
airborne scanner data. (false alarm pixels) error rate but had a higher
omission (undetected active fire pixels) error rate
2.2.3 Error Assessment Using ASTER Imagery over most regions of Australia in the absence of
Imagery from Landsat 5 and 7 and ASTER play a cloud cover.
key role due to their low cost, their intermediate The analysis of a large number of high
scale and their wider coverage (relative to airborne resolution earth observation datasets highlighted a
scanner data). Comparative analysis of the ASTER number of error sources including sensor
and Landsat 7 data was carried out to validate malfunction, black out (pixel drop outs) in imagery,
hotspots over a number of regions in Australia anthropogenic heat sources, surface temperature,
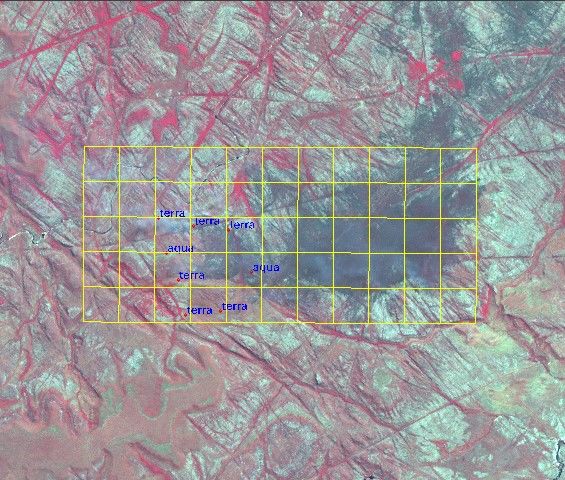
coving a total area of 375,025 km2. In Figure 5(a-c), fire spread rate, clouds cover, amount of smoke and
the MODIS 1000m grid is overlaid on ASTER 15m wind direction, etc). As an example, occurrence of
data and provides information on wind speed and hotspots over the Port Kembla steel factory areas
direction from the smoke plumes emanating from near Wollongong is dependent on the plant’s
hotspots in the snap-shot image. The smoke plume operational activities and varies from date to date.
dispersion pattern shows a south-easterly wind This is a typical error of classification in that it is a
direction. Figure 5(c) which is an examination of hotspot with an elevated spectral response which is
thermal and multispectral MODIS data reveals that being identified correctly but the response should
there is a significant spatial miss-registration (up to not be classified as a fire. A database of features
approximately 3800m) between the Sentinel such the Port Kembla Steel works linked to the
hotspots with the fire scars seen on ASTER data. Sentinel would be useful to refine the hotspots
Figure 5(d and e), show the ASTER thermal band presented on the Sentinel. During this study it
14 (10.95 - 11.65 µm) 90m pixel was acquired on became obvious that there are a small number of
8th August 2003 and indicate the fire front as series anthropogenic heat sources (e.g. plants, factories,
of bright spots. and industrial resources/infrastructure generated
heat) that are fixed in position and almost
3. Discussion and Results continuous in their presence throughout urbanised
Accuracy assessment of Sentinel hotspots was done areas. A database of these sources, their location,
in order to identify the types of errors and their and time of operation, temperature and size may
distribution. Fires which occurred in a two-hour provide the opportunity to filter out the false
window on the same date were buffered when hotspots from real active fires leading to an
distance between them was less than 0.003-0.015 improvement in the accuracy of identifying hotspots
degrees. The accuracy assessment results agree well detected from the satellite passes. Information about
with the spatial analysis methods applied to hotspots the behaviour of these targets would be useful for
from the two sensors. However, MODIS applications such as calibration and validation of
underestimated active fires by 23% on MOD14 sites in the future.
product that includes fire-mask, algorithm quality, Undetected Mt Kembla 2007 bushfire was a
radiative power, and numerous layers describing fire typical example of Sentinel omission error that is
pixel attributes. MOD14 products typically will fail attributed to fire spread rate and specific
to detect fires roughly smaller than half a pixel size environmental conditions. This particular fire
of the sensor at one km data (~50 ha). occurred at the under-story level burning rainforest
The geolocational accuracy of GA’s MODIS species, and shrubs between the upper forest canopy
products was assessed by Wang and Smith (2003) and the ground. Because the dense canopies
using Landsat products and they found that the impeded circulation of heat from the surface and
products were within 200m and 800m for Terra beyond under-story-canopy the temperature
MODIS and Aqua MODIS respectively. The threshold for hotspot detection by the Sentinel
MODIS, ASTER and Landsat footprints and the system was not reached.
International Journal of Geoinformatics, Volume 17, No. 3, June 2021
Online ISSN 2673-0014/ © Geoinformatics International126
Validation of MODIS and AVHRR Fire Detections in Australia 117-131
(b)Zoom area from previous map showing a few
examples active fires on ASTER 15m which have not
(a) Terra ASTER pass (composite product, bands 3, 2, 1) was been detected by Sentinel
acquired on 8th August 2003
(c) Undetected active fires and their smoke plumes are digitised
(e) Terra MODIS image, thermal band 31 (10.78 - 11.28
(d) Terra ASTER image, thermal band 14 (10.95 - 11.65
µm) 1000 m pixels acquired on 8th August 2003
µm) 90 m pixels acquired on 8th August 2003. This indicates
the fire front as a series of bright spots
Figure 5: Examples of omission and commission errors of AVHRR and MODIS hotspots using ASTER
imagery. Note: the hotspots (red dots) shown are not to scale
Also dense smoke associated with cool air hotspots. Error assessment based on visual
temperatures and a very slow dispersion rate could interpretation of imagery concluded overall
have hampered the detection of the fire by MODIS. commission errors of MODIS and AVHRR hotspots
AVHRR hotspots products tend to overestimate the over the 5% sampling strata (regions) are 15% and
number of hotspots in comparison with MODIS 68% respectively, and overall omission errors of
International Journal of Geoinformatics, Volume 17, No. 3, June 2021
Online ISSN 2673-0014/ © Geoinformatics International127
MODIS and AVHRR hotspots are 17% and 23% influence fire characteristics. We used three strata
respectively. A high commission error of AVHRR is based on regions (latitude) including region 1 (10°S,
Validation of MODIS and AVHRR Fire Detections in Australia 117-131
due to high threshold values designed at continental 20°S), region 2 (20°S, 30°S) and region 3 (30°S,
application. The poor performance of the AVHRR 43°S). Minimum and maximum temperature
algorithms (in terms of commission errors) is due thresholds based on region is reported in Table 2
not only to their quality but also to cloud cover, low and is presented in Figure 6. Threshold values
satellite overpass frequency and the saturation of encompass a range of high temperature areas.
AVHRR channel 3 at about 321 Kelvin. Minimum temperature threshold values are
Improvement in national fire detection probably can consistent over the three regions on MODIS
be achieved by further validation with a more hotspots, and there is a linear but steady decrease for
extensive in situ dataset that expands at least three AVHRR from region 1 to region 3. However,
years of data over the whole of the Australian maximum temperature threshold values remain the
continent. An improvement may be considered to same over the three regions on AVHRR hotspots.
include the addition of adaptive contextual This implies the need to re-assess threshold values
thresholds and an atmospheric correction for used in the contextual AVHRR hotspot detection
thermal bands. The geographic latitude ranges algorithm based on geographic areas.
Table 2: Summary of temperature threshold values for both MODIS and AVHRR hotspots
over the 5% sampling three regions
Sensor Min temperature (K) based on region Max temperature (K) based on region
10°S - 20°S 20°S - 30°S 30°S - 43°S 10°S - 20°S 20°S - 30°S 30°S - 43°S
MODIS 305.1° K 305.1° K 305.1° K 451.8° K 500° K 500° K
AVHRR 296.2° K 292.8° K 288.3° K 338.4° 338.4° K 338.4° K
Figure 6: Overall performance of threshold values over three sample regions
A comparison of the Sentinel MODIS hotspot 2.Change in calculation of fire confidence because
product (version C4) with coincident MCD45ML confidence of many fire pixels was significantly
hotspot product (version C5) provided by University high in C4.
of Maryland (UM) revealed that although some fires 3.Change in calculation of fire radiative power
did not appear in the C5 product compared to C4, (FRP).
but there was a global increase in the number of fire
pixels up to 3%. Changes in version C5 of the code Version C5 removed false alarms detected near to
include the following (Giglio, 2009): large fires; these false alarms would occur near true
fires, but offset by about 10 km. This is introduced
1.Rectifying a bug regarding switching between by a crosstalk-induced artifact caused by MODIS
bands 21 and 22; band 21 was sometimes detector’s anomaly in band 21. However, the rate of
incorrectly used instead of band 22. This false alarms increased; this issue was addressed in
improved the number of fire pixels to the order version C6 at UMD.
of up to 2 percent.
International Journal of Geoinformatics, Volume 17, No. 3, June 2021
Online ISSN 2673-0014/ © Geoinformatics International128
4. Conclusions and Recommendations • The revision of AVHRR thresholds; it was
In this study, it was established that multi-source
Validation of MODIS and AVHRR Fire Detections in Australia 117-131
demonstrated that hotspots products derived
earth observation data can play a useful role in from NOAA tend to overestimate the number
validation of real and false fires. Key conclusions of hotspots in comparison to MODIS hotspots.
from the validation are: Cross validation of AVHRR and MODIS
hotspots over 5% of the target areas within the
• A method for assessing the accuracy of three regions highlighted that errors are
MODIS and AVHRR hotspot products has linearly increasing from Region 1 towards
been developed. Li et al., (2000) established Region 3. The thresholds values used for
that about 4% of the fires detected are AVHRR are too high and the contextual
probably false alarms, but this study found that thresholds do not yield satisfactory results. The
false alarms of MODIS and NOAA are 15% performances obtained with the AVHRR
and 68% respectively. In addition, MODIS and hotspot detection algorithm are preliminary
NOAA respectively detected 83% and 77% of and need further validation with a more
fires equal or greater than one km2. The extensive in situ datasets which spans expands
accuracy of MODIS data is considered to be at least two years of data. An improvement
superior to AVHRR data when detecting may be considered to include the addition of
hotspots because it has higher sensitivity and adaptive contextual thresholds, and possibly an
fewer temperature saturation problems. atmospheric correction for thermal bands.
• The validation activities have resulted in the • Further validation activities on an ongoing basis
development of an error assessment database over the whole of the Australian continent.
for future use once the hotspots algorithms are Also future studies should compare and
modified and updated. Also, hotspot fire validate various fire detection algorithms over
detection accuracy assessment assists users to local fuels and weather regimes for Australian
determine the quality of individual hotspot fire landscapes (Forghani et al., 2007a and 2007b,
product. Access to a large archive of earth and et al., 2014).
observation imagery has allowed maximising
use of datasets for validation of hotspots Acknowledgements
products and can serve as an example for The authors are grateful for internal and external
growing the use of Geoscience Australia earth reviewers whose helpful comments greatly
observation archive into the future. improved this manuscript. We also thank John
• Comparing the Sentinel MODIS hotspots Woolner for supply of MODIS and AVHRR
(version C4) with coincident MCD45ML imagery and associated hotspots and Augusto
hotspot product (version C5 – subsequently Sanabria for assistance with statistical sampling.
reprocessed data) highlighted that some fires The New South Wales Rural Fire Services
did not appear in the C5 product compared to (NSWRFS) has kindly supplied airborne scanner
C4, there was a global increase in the number images and fire polygons for which their assistance
of fire pixels up to 3%. In general, the is highly appreciated. The RFS Illawarra has
difference is small (only a few percent) and provided field information. The Authors are also
insignificant for Australia. The Aqua MODIS grateful to anonymous reviewers for their valuable
shows the exact same trend. Sentinel has used comments and feedback on the manuscript. The
the C5 algorithm since April 2008. views expressed in this paper are the authors' and
not necessarily the views of their organisation.
Key recommendations from the validation are:
• An upgrade to Sentinel’s hotspot detection References
software in order to generate the Collection 6
(version C6) hotspot product is suggested. The Ahmad, A. and Alkhatib, A., 2014, A Review on
upgrade will improve hotspots product quality Forest Fire Detection Techniques. International
offered from GA. The upgrade will make GA Journal of Distributed Sensor. International
hotspot product more consistent with global Journal of Distributed Sensor Networks, Vol. 9,
historical hotspots archive. 41-10. DOI:10.1155/2014/597368.
• That a database of anthropogenic heat sources Ahern, F.J., Goldammer, J.G., Justice, C.O., (Eds.),
(e.g. plants, factories, etc) be maintained to 2001. Global and Regional Vegetation Fire
enhance Sentinel spatial accuracy by Monitoring From Space: Planning. A
attempting to filter out the false hotspots (man- Coordinated International Effort. SPB Academic
made error sources) from real, active hotspots. Publishing, The Haghe,The Netherlands.
International Journal of Geoinformatics, Volume 17, No. 3, June 2021
Online ISSN 2673-0014/ © Geoinformatics International129
Ahern F. , Janetos A. C., and E. Langham, 1998. Forghani, A., Cechet, B., Radke, J., Finney, M. and
Global Observation of Forest Cover: One Butler, B., 2007b, Applying Fire-Spread
Validation of MODIS and AVHRR Fire Detections in Australia 117-131
Component of CEOS' Integrated Global Simulation over Two Study Sites in California:
Observing Strategy. Proceedings of the 27th Lessons Learned and Future Plans. Proceedings
International Symposium on Remote Sensing of of the IEEE International Geoscience and
Environment, Tromso, Norway, June 8-12. Remote Sensing Symposium (IGARSS), 23-27
Bartlett, J. E., Kotrlik, J. W., Higgins, V. C.., 2001, July, Barcelona Spain, 3008-3013.
Organizational Research: Determining Sample Forghani, A., Kazemi, S., and L., Ge, 2014.
Size in Survey Research. Information Wildland Fire Behaviour Simulations
Technology, Learning, and Performance Journal, Employing an Integrated Weather-
Vol. 19, No. 1, 43-50. Topographical-Fuel Datasets and Remote
CFS., 2008, Fire Monitoring, Mapping, and Sensing. International Journal of
Modelling (Fire M3). Canadian Forest Fire Geoinformatics, Vol. 10, No. 4, December, 2014,
Service. Accessed online July 2008: pp. 35-43.
www.cwfis.cfs.nrcan.gc.ca/en/background/bi_F Gautam, R. S., Singh, D. and Mittal A.. 2007, A
M3_faq_e.php. Fuzzy Logic Approach to Detect Hotspots with
Chu, A., Kaufman, Y. J., Remer, L. A and Holben, NOAA/AVHRR Image Using Multi-Channel
B. N., 1998, Remote Sensing of Smoke from Information Fusion Technique. Journal Signal,
MODIS Airborne Simulator During SCAR-B Image and Video Processing, Vol. 1, No. 4, 347-
Experiment. Journal of Geophysical Research, 357.
Vol. 103(31), 979-988. Gibson, R., Danaher, T., Hehir, W., Collins, L.,
Cochran, W. G., 1977, Sampling Techniques, (3rd 2020. A Remote Sensing Approach to Mapping
ed.). New York: John Wiley & Sons. Fire Severity in South-Eastern Australia Using
Cotterill, R., 2007, Personal Communication. NSW Sentinel 2 and Random Forest. Remote Sensing
RFS Illawarra. of Environment, Volume 240, April 2020,
Csiszar, I. A., Morisette, J. T., Giglio, L., 2006, 111702.
Validation of Active Fire Detection from Giglio, L., Kendall, J.D., Justice C.O., 1999.
Moderate-Resolution Satellite Sensors: The Evaluation of global fire detection algorithms
MODIS Example in Northern Eurasia IEEE using simulated AVHRR infrared data.
Transactions on Geoscience and Remote Sensing, International Journal of Remote Sensing,
Vol. 44(7), 1757-1764. 20,1947-1985.
Davide Ascoli, A. B., Giorgio Vacchiano, A., Renzo Giglio, L., Descloitres, J., Justice, C.O., Kaufman,
Motta, A. and Giovanni Bovio, A., 2014, Y. 2003. An enhanced contextual fire detection
Building Rothermel Fire Behaviour Fuel Models algorithm for MODIS. Remote Sensing of
by Genetic Algorithm Optimisation. Environment, 87:273-282.
International Journal of Wildland Fire, Vol. Giglio, L, 2007. Characterization of the tropical
24(3), 317-328. diurnal fire cycle using VIRS and MODIS
FIRMS, 2021. The Fire Information for Resource observations, Remote Sensing of Environment,
Management System (FIRMS) developed in Volume 108, Issue 4, 29 June 2007, Pages 407-
2007 by the University of Maryland and 421.
NASA’s Applied Sciences Program and the Giglio, L., Csiszar, I., Restás, Á, Morisette, J. T.,
United Nations Food and Agriculture Schroeder, W., Morton, D., 2008. Active fire
Organization (UN FAO), USA. detection and characterization with the advanced
Flasse, S. P. and Ceccato, P., 1996, A Contextual spaceborne thermal emission and reflection
Algorithm for AVHRR Fire Detection. radiometer (ASTER). Remote Sensing of
International Journal of Remote Sensing, Vol. Environment, 112(6), 3055-3063
17, 419-424. Giglio, L., Loboda, T., Roy, D. P., Quayle, B., and
Forghani, A., Reddy, S., Thankappan, M. and Smith Justice, C. O., 2009. An active-fire based burned
C., 2007a, Validation of Sentinel Hotspots area mapping algorithm for the MODIS sensor.
Bushfire Monitoring System: Evaluation of Remote Sensing of Environment, 113(2), 408-
NOAA-AVHRR and MODIS Hotspots over 420.
Australian Continent. National Earth Giglio, L., 2009, Personal Communications,
Observation, Science and Strategy, Technical University of Maryland, USA.
Report – 24 July 2006 Geoscience Australia, 12
September 2007, 1-33.
International Journal of Geoinformatics, Volume 17, No. 3, June 2021
Online ISSN 2673-0014/ © Geoinformatics International130
Grang, I., 2009. Personal Communications, Data Kaufman, Y. J. and Fraser, R. S., 1997, The Effect
Quality and Improvement Section, Bureau of of Smoke Particles on Clouds and Climate
Validation of MODIS and AVHRR Fire Detections in Australia 117-131
Meteorology, Canberra, Australia. Forcing. Science, Vol. 277, 1636-1639.
Grégoire, J.-M., D. R. Cahoon, D. Stroppiana, Z. Li, Kaufman, Y. J., Justice, C.O., Flynn, L., Kendall, J.,
S. Pinnock, H. Eva, O. Arino, J. M. Rosaz, and I. Prins, E., Ward, D. E., Menzel, P. and Setzer, A,
Csiszar, Forest Fire Monitoring and Mapping for 1998, Monitoring Global Fires from EOS-
GOFC: Current Products and Information MODIS. Remote Sensing of Fires from EOS-
Networks Based on NOAA-AVHRR, ERS MODIS. Accessed online 25 February 2008:
ATSR, and SPOT-VGT. Global and Regional http://modis-atmos.gsfc.nasa.gov/_docs/Kaufm-
Vegetation Fire Monitoring From Space: an%20et%20al.%20(1998c).pdf.
Planning and Coordinated International Effort, Kushida, K., 2006, Investigation on MODIS Fire
edited by F. Ahern, J. G. Goldammer, and C. Detection Algorithms in Kalimanta Island.
Justice, pp. 105– 124, SPB Acad., The Hague, Accessed online 25 February 2007:
Netherlands, 2001. http://www.prime-intl.co.jp/geoss/materials/PD-
Hay., S. I., 2000, An Overview of Remote Sensing F/ForestFire/1day/1day_7_Kushida.pdf.
and Geodesy Ffor Epidemiology and Public Lee, T. F. and Tag, P. M., 1990, Improved
Health Application. Advances in Parasitology, Detection of Hotspots Using AVHRR 3.7 mm
Vol. 47, 1-35. Channel. Bulletin of American Meteorological
Hawbaker, T. J., Radeloff, V. C., Syphard, A. D., Society, Vol. 71(12), 1722-1730.
Zhu, Z. and Stewart, S. I., 2008, Detection Rates Liew, S.C. Lim, O.K., Kwoh, L.K., and Lim, H.,
of the MODIS Active Fire Product in the United 1998. Study of the 1997 Forest Fires in South
States, Remote Sensing of Environment, Vol. East Asia Using SPOT Quicklook Mosaics.
112(5), 2656-2664. Proceedings of the 1998 International
Hiavka, C. A., Livingston, G. P., 1997, Statistical Geoscience and Remote Sensing Symposium, Vol.
Models of Fragmented Land Cover and the 2, pp.. 879-881.
Effects of Coarse Spatial Resolution on the Li, Z., Kaufman Y. J., Ichoku, C., Fraser, R.,
Estimation of Area with Satellite Sensor Trishchenko, A. and Giglio, L., 2001, A Review
Imagery. International Journal of Remote of Satellite Fire Detection Algorithms:
Sensing, Vol. 18, No. 10, 2253-2259. Principles, Limitations and Recommendations.
Hiavka, C. A. and Dungan J. L., 2002, Areal In: F. Ahern, J. Goldammer and C.O. Justice,
Estimates of Fragmented Land Cover - Effects Editors, Global and Regional Fire Monitoring
of Pixel Size and Model Based Corrections. from Space: Planning. A Coordinated
International Journal of Remote Sensing, Vol. International Effort, SPB Academic, 199-226.
23, 711-724. Li, Z., Nadon, S., Cihlar, J. and Stocks, B., 2000,
Hyvarinen, O., 2006, Comparison of Fires Detected Satellite-Based Mapping of Canadian Boreal
by Satellite and In-Situ Data in Scandinavia. Forest Fires: Evaluation and Comparison of
Accessed online 25 February 2007: Algorithms. International Journal of Remote
www.eumetsat.int/groups/cps/documents/docum Sensing, Vol. 21(16), 3071-3082.
ent/pdf_conf_p48_s3_02-_hyvarine_v.pdf. Loboda, T. V. and Csiszar, I. A., 2006, Estimating
Ichoku, C., Kaufman, Y. J., Giglio, L.,. Li, Z., Burned Area from AVHRR and MODIS:
Fraser R. H., Jin, J.-Z. and Park, W. M., 2003, Validation Results and Sources of Errors.
Comparative Analysis of Daytime Fire Detection Accessed online 25 February 2007:
Algorithms, Using AVHRR Data for the 1995 www.iki.rssi.ru/earth/articles/sec9_13.pdf.
Fire Season in Canada: Perspective for MODIS. Lutakamale, A. S., and Kaijage, S., 2017, Wildfire
International Journal of Remote Sensing, Vol. Monitoring and Detection System Using
24(8), 1669-1690. Wireless Sensor Network: A Case Study of
Jang, E., Kang, Y., Im, J., Lee, D., Yoon, J. and Tanzania. Wireless Sensor Network, Vol. 9, 274-
Kim, S. K., 2019, Detection and Monitoring of 289.
Forest Fires Using Himawari-8 Geostationary Matson, M., Dozier J., 1981. Identification of
Satellite Data in South Korea. Remote Sensing, Subresolution High Temperature Sources Using
Vol.11, January 2019, 271-290. a Thermal IR Sensor. Photogrammetric
Justice, C.O., Malingreau, J.P., Setzer A.W., 1993. Engineering and Remote Sensing, Vol. 47, 1311-
Satellite remote sensing of fires: potential and 1318.
limitations. Fire in the Environment, edited by P.
J. Crutzen and J. G. Goldammer, New York:
John Wiley, pp. 77–88.
International Journal of Geoinformatics, Volume 17, No. 3, June 2021
Online ISSN 2673-0014/ © Geoinformatics International131
Molina-Pico, A., Cuesta-Frau, D., Araujo, A., Rogers, B., Reddy, S. and Fu F., 2006, Evaluation
Alejandre, J. and Rozas, A., 2016, Forest of Contextual AVHRR Hotspot Detection
Validation of MODIS and AVHRR Fire Detections in Australia 117-131
Monitoring and Wildland Early Fire Detection Algorithms for Australian Conditions.
by a Hierarchical Wireless Sensor Network. Proceedings of the 13th Australasian Remote
Journal of Sensors, Vol. (3-4), 1-8, Sensing and Photogrammetry Conference,
https://doi.org/10.1155/2016/8325845. National Convention Centre, Canberra,
Moody, A. and Woodcock C. E., 1996, Calibration- Australia, November 20 – 24, 1-6.
Based Models for Correction of Area Estimates Rybicki, G., Lightman, B. and Alan P.,
Derived from Coarse Resolution Land-Cover 2004, Radiative Processes in Astrophysics.
Data. Remote Sensing of Environment, Vol. 58, WILEY ‐ VCH Verlag GmbH & Co. KGa.
1-17. DOI:10.1002/9783527618170.
Morisette, J. T, Giglio, L., Csiszar, I. and Justice, C. Schroeder, W., Prins, E., Giglio, L., Csiszar, I.,
O., 2005, Validation of the MODIS Active Fire Schmidt, C., Morisette, J. and Morton, D.,
Product over Southern Africa with ASTER Data 2008,Validation of GOES and MODIS Active
International Journal of Remote Sensing, Vol. Fire Detection Products Using ASTER and
26(19), 4239- 4264. ETM+ Data, Remote Sensing of Environment,
Morisette, J. T., Privette, J. L. and Justice, C. O., Vol. 112 (5), 2711-2726
2002, A Framework for the Validation of Setzer, A. W. and Malingreau, J. P., 1996, AVHRR
MODIS Land Products. Remote Sensing of Monitoring of Vegetation Fires in the Tropics:
Environment, Vol. 83, 77-96. Toward the Development of a Global Product.
Mubarak, A., Mahmoud, I. and Honge, R., 2018, Biomass Burning and Global Change. Vol. 1:
Forest Fire Detection Using a Rule-Based Image Remote Sensing, Modelling and Inventory
Processing Algorithm and Temporal Variation. Development, and Biomass Burning in Africa,
Mathematical Problems in Engineering, Vol. 7, edited by J. S. Levine (MIT Press: Cambridge
1-8. MA), 25-39.
Nakau, K., Fukuda, M., Kushida, K., Hayasaka, H., Turner, D., Ostendorf, B. and Lewis M., 2012, A
Kimura, K. and Tani, H., 2006, Forest Fire Comparison of NOAA–AVHRR Fire Data with
Detection Based on MODIS Satellite Imagery, Three Landsat Data Sets in Arid and Semi-Arid
and Comparison of NOAA-AVHRR Satellite Australia. International Journal of Remote
Imagery with Fire Fighters' Information. 18-23. Sensing, Vol. 33(9), 2657-2682.
Accessed online 25 February 2007: Wang, L. and Smith C., 2003, Accuracy Assessment
http://www.iarc.uaf.edu/workshops/terrestrial_te of ACRES Landsat Orthocorrected Products.
am. Internal Report. Geoscience Australia, 1-7.
Oleson, K. W., Sarlin, S., Garrison, J., Smith, S., Wooster, M. J., Zhukov B. and Oertel D., 2003, Fire
Privette, J. L. and Emery, W. J., 1995, Unmixing Radiative Energy for Quantitative Study of
Multiple Land-Cover Type Reflectances from Biomass Burning: Derivation from the BIRD
Coarse Spatial Resolution Satellite Data. Remote Experimental Satellite and Comparison to
Sensing of Environment, Vol. 54, No. 2, 98-112. MODIS Fire Products. Remote Sensing of
RFS, 2007, Personal Communications, NSW Rural Environment, Vol. 86, 83–107.
Fire Services (RFS), March 2007. Yates, F., 1960, Sampling Methods for Censuses
and Surveys, 3rd Edition, London, Griffin.
Zhukov, B., Briess, K., Lorenz, E., Oertel, D. and
Skrbek, W., 2005, Detection and Analysis of
High-Temperature Events in the BIRD Mission.
Acta Astronautica Vol. 56, 65-71.
International Journal of Geoinformatics, Volume 17, No. 3, June 2021
Online ISSN 2673-0014/ © Geoinformatics InternationalYou can also read