Long-Term Converse Magnetoelectric Response of Actuated 1-3 Multiferroic Composite Structures - MDPI
←
→
Page content transcription
If your browser does not render page correctly, please read the page content below
magnetochemistry

Article
Long-Term Converse Magnetoelectric Response of Actuated 1-3
Multiferroic Composite Structures
Ryan Stampfli, Nha Uyen Huynh and George Youssef *

                                          Experimental Mechanics Laboratory, Mechanical Engineering Department, San Diego State University,
                                          5500 Campanile Drive, San Diego, CA 92182, USA; r.stampfli.me@gmail.com (R.S.); nhuynh2@sdsu.edu (N.U.H.)
                                          * Correspondence: gyoussef@sdsu.edu

                                          Abstract: Multiferroic composite materials operating under the principle of strain mediation across
                                          the interfaces separating different material boundaries address many limitations of single-phase mag-
                                          netoelectric materials. Although significant research has been conducted to explore their responses
                                          relating to the topography and directionality of material polarization and magnetic loading, there
                                          remain unanswered questions regarding the long-term performance of these multiferroic structures.
                                          In this study, a multiferroic composite structure consisting of an inner Terfenol-D magnetostrictive
                                          cylinder and an outer lead zirconate titanate (PZT) piezoelectric cylinder was investigated. The
                                          composite was loaded over a 45-day period with an AC electric field (20 kV/m) at a near-resonant
                                          frequency (32.5 kHz) and a simultaneously applied DC magnetic field of 500 Oe. The long-term
                                          magnetoelectric and thermal responses were continuously monitored, and an extensive micrographic
                                          analysis of pretest and post-test states was performed using scanning electron microscopy (SEM).
                                          The extended characterization revealed a significant degradation of ≈30–50% of the magnetoelectric
                                response, whereas SEM micrographs indicated a reduction in the bonding interface quality. The in-

                                          crease in temperature at the onset of loading was associated with the induced oscillatory piezoelectric
Citation: Stampfli, R.; Huynh, N.U.;
                                          strain and accounted for 28% of the strain energy loss over nearly one hour.
Youssef, G. Long-Term Converse
Magnetoelectric Response of
                                          Keywords: strain mediation; multiferroics; magnetoelectric coupling; long-term response; compos-
Actuated 1-3 Multiferroic Composite
                                          ite multiferroics
Structures. Magnetochemistry 2021, 7,
55. https://doi.org/10.3390/
magnetochemistry7040055

                                          1. Introduction
Academic Editor: Roman Boca
                                               Research interest in single and multiphase multiferroic materials has expanded greatly
Received: 29 March 2021                   in the past two decades to reduce the footprint of electronic devices while efficiently
Accepted: 16 April 2021                   managing power consumption. These research efforts are widely spread over multiple
Published: 20 April 2021                  investigation areas that span from chemistry to material science and from mechanical
                                          engineering to device reliability testing to understand and optimize the underlying fun-
Publisher’s Note: MDPI stays neutral      damental phenomena to improve the resulting magnetoelectric coupling metrics [1–4].
with regard to jurisdictional claims in   Multiferroics for magnetoelectric applications possess intrinsic or extrinsic coupling be-
published maps and institutional affil-   tween two or more ferroic order parameters, wherefore they can bidirectionally convert
iations.                                  electric energy to magnetic energy. When considered in the single-phase form, intrinsic
                                          multiferroics are uncommon and exhibit substantially reduced magnetoelectric coupling
                                          coefficients at room temperature, decisively restricting their integration in devices outside
                                          of laboratory conditions. In an engineering attempt to resolve these issues, multiferroic
Copyright: © 2021 by the authors.         composite materials, consisting of separate ferroelectric and ferromagnetic material phases,
Licensee MDPI, Basel, Switzerland.        can be created with a bidirectional coupling through charge, spin, or strain transfer across
This article is an open access article    material interfaces [2,3,5–10]. In the strain-mediated approach, the magnetostriction in
distributed under the terms and           ferromagnetic materials and the piezoelectric effect in ferroelectric materials are exploited.
conditions of the Creative Commons        The converse magnetoelectric effect (CME) is based on applying an electric field to the
Attribution (CC BY) license (https://     piezoelectric material, resulting in a change in the magnetization of the ferromagnetic
creativecommons.org/licenses/by/          material due to the mediation of strain. Therefore, the CME coefficient is the coupling
4.0/).

Magnetochemistry 2021, 7, 55. https://doi.org/10.3390/magnetochemistry7040055                   https://www.mdpi.com/journal/magnetochemistry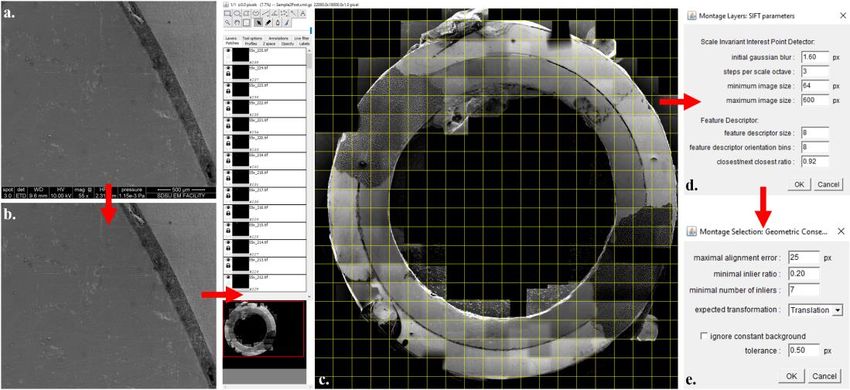
Magnetochemistry 2021, 7, 55                                                                                             2 of 13

                               efficacy metric between the applied and generated fields and is defined as the output
                               magnetic flux ratio to the input voltage.
                                     Although significant research effort has recently been dedicated to nanoscale investi-
                               gations of composite multiferroics, experimental studies of concentric cylinder composites
                               (1-3 composites [11]) remain relatively limited to the macroscale. The overall magneto-
                               electric response is then implicitly defined as a function of selecting the material phases,
                               the geometry, and the quality and type of the interface between the different constituents.
                               Chavez et al. investigated the CME response of concentric PZT/Terfenol-D composite
                               cylinders with epoxy-bonded and shrink-fit interfaces to elucidate the effect of the inter-
                               faces [12]. A maximum CME coefficient of 525 mG/V was found for the epoxy-bonded
                               interface, while the shrink-fit interface reached a mere 330 mG/V. This study was per-
                               formed using an axially polarized PZT phase, limiting the transferred strain across the
                               Terfenol-D cylinder interface to that from Poisson’s effect. Youssef et al. studied the same
                               structure to remedy this limitation but with a radially polarized PZT cylinder to achieve
                               direct piezoelectric strain transfer [13]. Contrary to their original hypothesis that this higher
                               strain would transfer to the Terfenol-D cylinder and result in a higher overall magnetoelec-
                               tric coupling, the CME of the radially polarized PZT composite was limited to 282 mG/V.
                               They attributed this clipping of the output to a mechanical clamping force that altered the
                               magnetostrictive response of the Terfenol-D cylinder within the investigated frequency
                               and bias magnetic field ranges [13]. Newacheck et al. continued the investigations of
                               Chavez et al. and Youssef et al. to identify the underpinnings of the hypothesized clamping
                               force through the application of a concurrent multidirectional bias magnetic field [14].
                               Their study detailed the CME response based on the direction of the applied electric field
                               and the magnetocrystalline anisotropy of the composite phases and confirmed that the
                               clamping force limited the overall ME coupling [14]. In addition to the investigation of
                               the bilayer cylinders, others have recently studied tricylinder structures using different
                               assembly techniques, as delineated in [15,16]. Interestingly, Newacheck et al. recently
                               discovered an extended frequency-modulated operation range of concentric multiferroic
                               cylinders beyond the magnetic field required to achieve the peak piezomagnetic response
                               and magnetic saturation [17]. The culmination of these studies provides the experimen-
                               tal validation of the standing hypothesis by Bichurin and Viehland regarding cylinder
                               structures outperforming their 2-2 laminated plate counterparts [12–14,17–19].
                                     Despite the recent influx of research on strain-mediated multiferroic composite struc-
                               tures, there is a gap in the knowledge on their long-term performance, hence the objective
                               of the present study. Here, a predefined crack was created at the interface between the
                               two material phases, i.e., within the epoxy layer. The composite structure was operated
                               under the converse magnetoelectric coupling paradigm. It was subjected to a continuous
                               load (exceeding one hundred billion cycles) under the influence of an electric field at a
                               near–resonant frequency and a bias magnetic field corresponding to the saturation level.
                               In addition to quantifying the emanating magnetic flux at the crack site and a diametrically
                               opposed location, the temperature change was continually monitored throughout the exper-
                               iment. After the conclusion of testing, a rigorous postmortem characterization protocol was
                               performed using scanning electron microscopy (SEM) to explicate the effect of extended
                               loading on the morphology of the epoxy layer of the sample. This was then compared to
                               the virgin, undamaged structures to glean information about the performance implications
                               of the intentionally debonded interface and the resulting fracture propagation behavior.

                               1.1. Sample Preparation
                                    The investigated concentric multiferroic cylinder composite structure consisted of two
                               discrete cylinders separated by a bonding interface. For the piezoelectric component, lead
                               zirconate titanate ceramic was used (PZT 841, APC International, Mackeyville, PA, USA).
                               The magnetostrictive cylinder was made of Terfenol-D (Etrema/TdVib, Ames, IA, USA)
                               with a standard composition of Tb0.3 Dy0.7 Fe1.92 [20]. A highly conductive silver-filled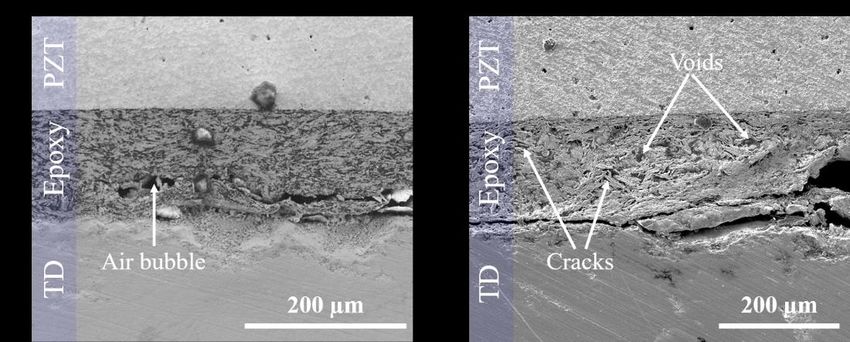
USA). The magnetostrictive cylinder was made of Terfenol-D (Etrema/TdVib, Ames, IA,
USA) with a standard composition of Tb0.3Dy0.7Fe1.92 [20]. A highly conductive silver-filled
two-part epoxy (MG Chemicals 8330S, Ontario, ON, Canada) was used to mechanically
bond the two cylinders.
Magnetochemistry 2021, 7, 55 3 of 13
The as-received dimensions of the Terfenol-D cylinder were a 20.03 mm inner diam-
eter (ID), a 25.02 mm outer diameter (OD), and a height of 10.01 mm. Since Terfenol-D is
extremely brittle, the only prebonding processing step was a perfunctory removal of the
naturally occurring oxideepoxy
two-part layer (MG
usingChemicals
400-grit sandpaper. The as-received,
8330S, Ontario, ON, Canada) radially polar-to mechanically
was used
ized PZT cylinder had an ID of 24.73
bond the two cylinders. mm, an OD of 30.24 mm, and a height of 5.01 mm.
Preattached conductive The silver electrodes
as-received on the of
dimensions interior and exterior
the Terfenol-D faceswere
cylinder wereaused
20.03dur-
mm inner diameter
ing the manufacturing process
(ID), a 25.02 mm forouter
polarization
diameter and wereand
(OD), left aattached
height of to facilitate
10.01 mm. an elec-
Since Terfenol-D is
tric field duringextremely
normal operation.
brittle, the The inner
only diameter of
prebonding the PZT cylinder
processing step was was carefully
a perfunctory removal of
and evenly sanded to achieve a uniform, concentric fit between the two cylinders.
the naturally occurring oxide layer using 400-grit sandpaper. The as-received, radially A 25-
μm-thick skived Teflon (polytetrafluoroethylene
polarized PZT cylinder had an ID (PTFE))
of 24.73spacer
mm,was aninserted
OD of 30.24between mm, theand a height of
two cylinders to create
5.01 mm.a Preattached
predefined crack to investigate
conductive the effecton
silver electrodes that
theextended
interior andloading
exterior faces were
had on the fracture propagation.
used during Subsequently,
the manufacturing processthe for
two-part silver-filled
polarization and were conductive
left attached to facilitate
epoxy was applied liberally,
an electric with
field care taken
during normal to operation.
avoid air pockets
The inner or voids, and then
diameter of theheat-
PZT cylinder was
cured for two hours at 65and
carefully °C.evenly
Following
sandedcuring, the Teflon
to achieve spacerconcentric
a uniform, was carefully removed
fit between the two cylinders.
A 25-µm-thick
to reveal the predefined crack.skived
GivenTeflon (polytetrafluoroethylene
the initial height difference between (PTFE))the spacer
two was inserted between
cylin-
ders, the sample thewas
twowetcylinders
sanded to to
create a predefined
a final compositecrack to investigate
height of 4.82 mm. theFigure
effect that extended loading
1 suc-
had on the documents
cinctly and schematically fracture propagation.
the preceding Subsequently, the two-part
sample preparation silver-filled conductive epoxy
process.
The samplewas
wasapplied liberally,
then fitted withwith
twocare taken
search to to
coils avoid air pockets
measure or voids, andforce
the electromotive then heat-cured for
two hours
(emf) at the cracked at 65 ◦ C. sites,
and uncracked Following
wherecuring,
a 36 AWG the Teflon spacer was carefully
polymer-sheathed copper mag- removed to reveal
net wire was usedthe predefined
to create thecrack. Given
16-turn theElectrodes
coils. initial heightweredifference
attached to between
the outer the and
two cylinders, the
sample was wet sanded to a final composite height
inner diameters of the composite cylinder using the same silver epoxy that was used to of 4.82 mm. Figure 1 succinctly and
schematically documents
bond the cylinders to apply the AC electric field.the preceding sample preparation process.
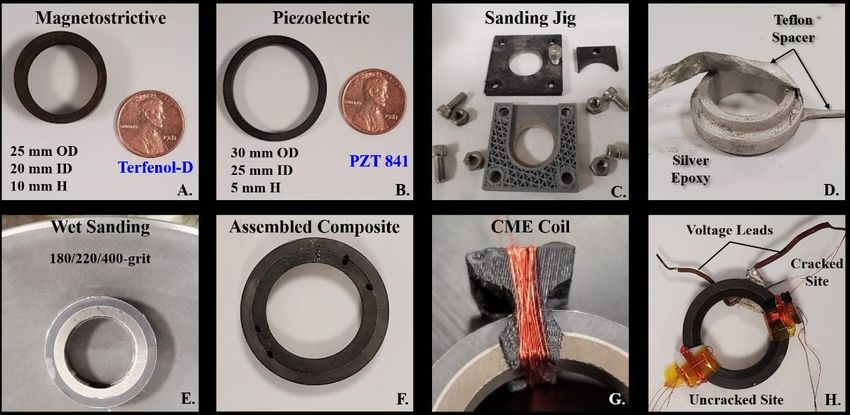
Figure 1. Overview
Figure 1. Overview of the
of the sample sample preparation
preparation process(A)
process showing showing (a) a Terfenol-D
a Terfenol-D cylinder
cylinder with the with the dimensions,
nominal
nominalwith
(B) a PZT cylinder dimensions, (b) a PZT
the as-received cylinder with
dimensions, (C) athe as-received
3D-printed dimensions,
sanding (c) a 3D-printed
jig for adjusting the sizesanding
of the PZT cylinder
jig for
to fit onto the adjustingcylinder,
Terfenol-D the size (D)
of the
anPZT cylinder
epoxy to fit
bonding onto
step the Terfenol-D
showing cylinder,
the Teflon (d) anto
spacer prior epoxy bond-
removal, (E) the result
ing step showing the Teflon spacer prior to removal, (e) the result of the wet-sanding process to
of the wet-sanding process to flatten the faces, (F) the final assembled composite cylinder, (G) the assembled search coil
flatten the faces, (f) the final assembled composite cylinder, (g) the assembled search coil to moni-
to monitor the CME, and (H) the composite structure with voltage leads for the AC electric field and the two CME coil
tor the CME, and (h) the composite structure with voltage leads for the AC electric field and the
locations that
twowere
CMEready for testing.
coil locations that were ready for testing.
The sample was then fitted with two search coils to measure the electromotive force
1.2. Micrographic Analysis
(emf) at the cracked and uncracked sites, where a 36 AWG polymer-sheathed copper
The micrographic analysis
magnet wire using
was used to scanning
create the electron microscopy
16-turn coils. (FEI
Electrodes Quanta
were 450to the outer and
attached
ESEM, Hillsboro, OR, USA) provided the ability to characterize the dimensions of the pre-
inner diameters of the composite cylinder using the same silver epoxy that was used to
defined crack and thethe
bond change in its to
cylinders length
applyafter
theextended loading,
AC electric field. as well as elucidating the
1.2. Micrographic Analysis
The micrographic analysis using scanning electron microscopy (FEI Quanta 450 ESEM,
Hillsboro, OR, USA) provided the ability to characterize the dimensions of the predefined
crack and the change in its length after extended loading, as well as elucidating the
evolution in the morphology of the epoxy interface. Acquiring a singular SEM image of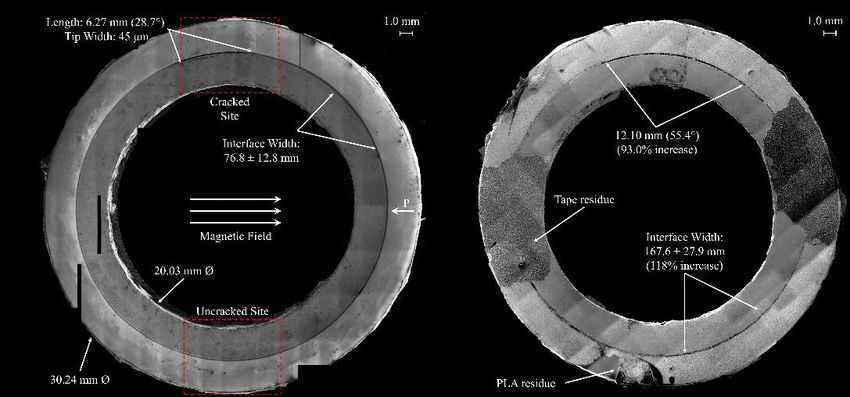
SEM micrographs at a magnification of 55× were sequentially collected to contiguously map
the entire surface of the sample, where a 20% overlap between successive images was used
to facilitate subsequent image reconstruction. It is essential to note that SEM was used in
lieu of an optical microscope since a preliminary investigation with the latter was futile. The
FIJI release of ImageJ2, which is image processing software, and the TrakEM2 plugin were
Magnetochemistry 2021, 7, 55 4 of 13
used to digitally stitch the images to reconstruct the geometry of the entire composite cylin-
der structure [21–23]. TrakEM2 is a specialized plugin that was designed to combine and
analyze sets of electron microscopy images, as was the case here [22–26].
The collected
the images were approximately
entire structure was not possible aligned
given to the
a square grid according
dimensions to the cylinder with
of the composite
20% overlap, asanshown in Figure of
outer diameter 2a–c. The
30.24 mm images
and anwereinnerthen montaged
diameter using
of 20.03 mm.the least- 230 separate
Therefore,
square linear feature correspondence
SEM micrographs method and translation
at a magnification of 55× were alignment
sequentially[26].collected
The SIFTto contiguously
(scale-invariantmap feature
the transform)
entire surface parameters and geometric
of the sample, where a 20% consensus
overlap filtering
between param-
successive images was
eters, which areusedresponsible for feature
to facilitate detection
subsequent image and image alignment,
reconstruction. It isrespectively,
essential to note that that SEM was
were used herein used areinshown
lieu ofinanFigure
optical2d,e [23,26]. The
microscope sincefeature descriptor
a preliminary size and maxi-
investigation with the latter was
mal alignment futile.
error areThekeyFIJIparameters for the overall
release of ImageJ2, which quality
is imageofprocessing
the final image
software,due and
to the TrakEM2
the relative lackplugin were used
of distinctive to digitally
features between stitch the images
images of the to reconstruct
composite, andthe thegeometry
initial of the entire
grid alignment composite cylinder previously.
process described structure [21–23].
Once allTrakEM2 is a specialized
tiles were aligned, thepluginrelative that
in-was designed to
combine
tensities were unified, and analyze
a blending sets was
process of electron
used tomicroscopy
combine theimages, as awas
tiles into singletheimage
case here [22–26].
without exceedinglyThe collected images
pronounced changes were approximately
in the alignedand
per-tile brightness to acontrast.
square grid according to the 20%
overlap, as shown in Figure 2a–c. The images were then montaged
As a result of the reconstruction step, the stitched SEM images of the entire multiferroic using the least-square
cylinder structurelinear
were feature
createdcorrespondence
before and after method
testing,and translation
showing alignment
the overall [26]. The SIFT (scale-
dimensional
invariant feature
changes of the composite cylindertransform)
with a focus parameters and geometric
on the interface. It is worth consensus
noting that filtering
de- parameters,
which
spite the concerted and are responsible
careful efforts for feature
in the detection
alignment and image
process, alignment, respectively,
the reconstructed images that were
used herein are shown in Figure 2d,e [23,26]. The
have two major artifacts, namely, missing sections due to the movement of the electron feature descriptor size and maximal
alignment error are key parameters for the overall
beam and misalignment between successive images and contrast discrepancies between im- quality of the final image due to the
relative lack of distinctive features between images of
age tiles due to the different interactions between the electron beam and the three materialsthe composite, and the initial grid
alignment process described previously. Once all tiles
(PZT, Terfenol-D, and silver epoxy). These artifacts were deemed cosmetic with no effect on were aligned, the relative intensities
the subsequentwere unified,
analyses; theacontrast
blendingartifacts
processdid wasnotused to combine
affect the tiles
the results into aherein,
reported single image without
given the distinctexceedingly
interactionpronounced
between each changes in the per-tile
of the materials and thebrightness
electron andbeam. contrast.
Figure 2. Figure 2. SEMreconstruction
SEM image image reconstruction
process process using ImageJ2/TrakEM2,
using ImageJ2/TrakEM2, wherewhere
(a) an(a)original
an original
SEMSEM
micrograph was
micrograph was (b) cropped
(b) cropped with removed labels, (c) the approximate alignment of the image was set using a squarewas
with removed labels, (c) the approximate alignment of the image grid, (d) SIFT
set using a square grid, (d) SIFT parameters were used for feature detection, and (e) geometric
parameters were used for feature detection, and (e) geometric consensus filter parameters were used to control the tile
consensus filter parameters were used to control the tile alignment.
alignment.
As a result of the reconstruction step, the stitched SEM images of the entire multiferroic
cylinder structure were created before and after testing, showing the overall dimensional
changes of the composite cylinder with a focus on the interface. It is worth noting that
despite the concerted and careful efforts in the alignment process, the reconstructed images
have two major artifacts, namely, missing sections due to the movement of the electron
beam and misalignment between successive images and contrast discrepancies between
image tiles due to the different interactions between the electron beam and the three
materials (PZT, Terfenol-D, and silver epoxy). These artifacts were deemed cosmetic with
no effect on the subsequent analyses; the contrast artifacts did not affect the results reported
herein, given the distinct interaction between each of the materials and the electron beam.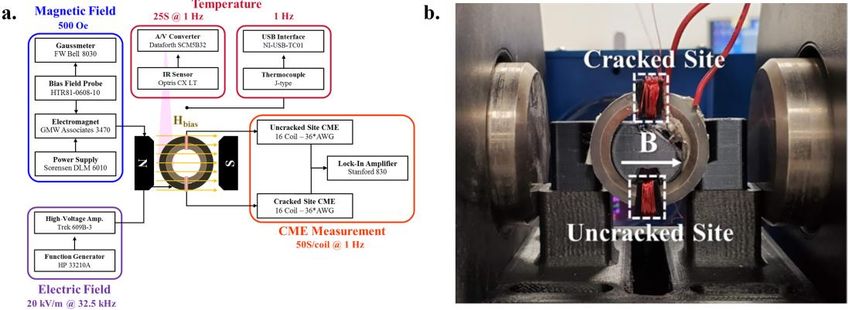
1.3. CME Measurement Setup
The sample was continuously loaded, electrically and magnetically, over 45 days
with a DC magnetic field of 500 Oe and a simultaneous AC electric field of 20 kV/m at a
frequency of 32.5 kHz to study the long-term performance of the multiferroic cylinder
composite structure. These conditions were selected based on a priori experimental stud-
Magnetochemistry 2021, 7, 55 5 of 13
ies [12–14,17–20,27–29]. The sample was held in place using a 3D-printed mount that was
centered perpendicularly between the two poles of an electromagnet. The sample mount
was designed to provide the minimum amount of mechanical constraint possible by
1.3. CME
loosely supporting Measurement
the cylinder Setupfrom its inside diameter while being magneti-
composite
cally transparent, negating any effects
The sample was continuouslyon the magnetic response
loaded, [14]. The
electrically and composite
magnetically,cyl- over 45 days
inder was oriented such that the bias magnetic field was diametrically
with a DC magnetic field of 500 Oe and a simultaneous AC electric field applied using an of 20 kV/m at
electromagnet (GMW
a frequencyAssociates
of 32.53470,
kHz San Carlos,
to study theCA, USA) and
long-term a Sorensen
performance ofDLM 6010
the multiferroic cylinder
power supply composite
(San Diego, CA, USA),
structure. These whereas
conditions the were
search coils wrapped
selected based on aaround the
priori experimental stud-
cracked and uncracked sites were located
ies [12–14,17–20,27–29]. Theatsample
the zenith was and
heldnadir
in placelocations
using a(Figure
3D-printed3b). Itmount that was
has been experimentally and computationally
centered perpendicularly between shown thatpoles
the two multiferroic cylinder compo-
of an electromagnet. The sample mount
sites experiencewas
thedesigned
largest strains in these regions [17,19,30]. The bias magnetic field
to provide the minimum amount of mechanical constraint possible by loosely was
monitored using a bias field
supporting the probe
cylinder (FW Bell HTR81-0608-10,
composite from its insidePortland, OR, USA)
diameter while beingcon-
magnetically trans-
nected to a gaussmeter (FW Bell any
parent, negating 3030,effects
Portland,
on the OR,magnetic
USA). The field probe
response [14].tip
Thewas placed cylinder was
composite
near the leadingoriented
edge ofsuch the that
samplethe bias magnetic
to ensure thatfield was diametrically
the bias field that wasapplied
measured usingwas an electromagnet
representative (GMW
of the biasAssociates
field for3470, San Carlos,
the entire sample. CA,TheUSA)
ACand a Sorensen
electric field was DLM 6010 power supply
applied
(San Diego,
using a high-voltage CA, USA),
amplifier whereas
(Advanced the search
Energy Trekcoils wrapped
609B-3, around
Denver, CO,theUSA)cracked
that and uncracked
was connected to a function generator (Hewlett-Packard 33210A, Palo Alto, CA, USA).experimentally
sites were located at the zenith and nadir locations (Figure 3b). It has been
The magnitudeand andcomputationally
frequency of theshown that multiferroic
AC electric cylinder
field were verified composites
using experience the largest
a high-voltage
strains inDPO-2012B,
oscilloscope (Tektronix these regionsBeaverton,
[17,19,30].OR, TheUSA).
bias magnetic field was monitored using a bias field
probe
The signals from(FW Bell HTR81-0608-10,
the search Portland,the
coils (used to calculate OR,CME)
USA)were connected
collectedto ausing
gaussmeter
a (FW Bell
3030, Portland, OR, USA). The field probe tip was
lock-in amplifier (Stanford Research Systems 830, Sunnyvale, CA, USA) and a synchro- placed near the leading edge of the
sample to ensure that the bias field that was measured
nized trigger signal from the function generator (Hewlett-Packard 33210A). Readings was representative of the bias field
for the entire sample. The AC electric field was applied
from both coils were averaged 25 times per second for a final sample rate of 1 Hz. Finally, using a high-voltage amplifier
(Advanced Energy
temperature measurements were madeTrek 609B-3,
using a Denver,
fixed-focus CO,IRUSA)
sensorthat was connected
(Optris PSC-CX LT, to a function gen-
Portsmouth, NH, erator
USA) (Hewlett-Packard
pointed near the33210A, Palo Alto,
crack region CA, USA).
to monitor The magnitude
localized temperature and frequency of
changes. The IR sensor data was sampled 50 times per second, with the readings averaged DPO-2012B,
the AC electric field were verified using a high-voltage oscilloscope (Tektronix
to output a 1 HzBeaverton,
data rate.OR, USA).
Figure
Figure 3. (a) 3. (a) Schematic
Schematic diagram overview
diagram overview of the experimental
of the experimental setup including
setup including loading loading and sam-
and sampling parameters, and
pling parameters, and (b) multiferroic composite cylinder in the testing configuration with
(b) multiferroic composite cylinder in the testing configuration with electromagnet poles, a coil mount, electro-
and CME coils
visible. magnet poles, a coil mount, and CME coils visible.
2. Results and Discussion
The signals from the search coils (used to calculate the CME) were collected using a
The resultslock-in amplifier
section (Stanford
is divided Research
into two Systems
subsections 830, Sunnyvale,
corresponding to CA,
the USA) and a synchronized
two main
trigger
forms of analyses signal above,
discussed from the function
starting generator
with (Hewlett-Packard
the micrographic analysis33210A).
based onReadings
the from both
coils were averaged 25 times per second for a final sample rate
SEM imaging, followed by a discussion of the CME response of the composite structure of 1 Hz. Finally, temperature
measurements
over the extended wereGiven
loading period. made theusing a fixed-focus
frequency of theIRapplied
sensor electric
(Optris field
PSC-CX
(32.5LT, Portsmouth,
NH, USA) pointed near the crack region to monitor localized temperature changes. The IR
sensor data was sampled 50 times per second, with the readings averaged to output a 1 Hz
data rate.
2. Results and Discussion
The results section is divided into two subsections corresponding to the two main
forms of analyses discussed above, starting with the micrographic analysis based on the
SEM imaging, followed by a discussion of the CME response of the composite structure over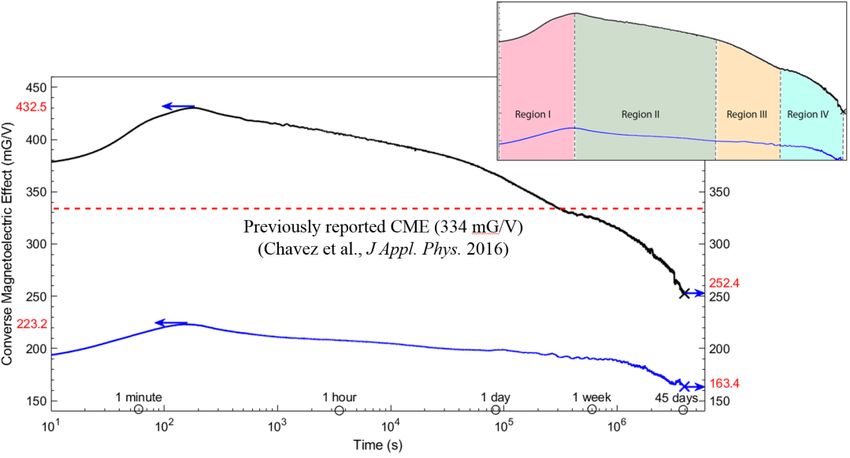
2021, 7, x FOR PEER REVIEW 6 of 13
Magnetochemistry 2021, 7, 55 6 of 13
kHz) and the total testing duration (45 days), in total, the multiferroic concentric cylinder
structure was subjected
the extended toloading
126 billion
period.fully
Givenreversed
the frequencyloading cycles.electric
of the applied The field
relatively high
(32.5 kHz) and
theistotal
number of cycles testing duration
consistent with the(45lifetime
days), in of
total, the multiferroic
electronic concentric cylinder structure
devices.
was subjected to 126 billion fully reversed loading cycles. The relatively high number of
cycles is consistent with the lifetime of electronic devices.
2.1. Results of the Micrographic Analysis
2.1. Results
Figure 4 shows the of the Micrographic
stitched Analysis of the sample before loading (Figure 4a
SEM images
Figure 4 shows and
based on 230 SEM micrographs) the stitched SEM
after the images ofloading
extended the sample before
period loading4b
(Figure (Figure
based4a
based on 230 SEM micrographs) and after the extended loading period (Figure 4b based on
on 226 SEM micrographs) as a result of the reconstruction steps discussed in the previous
226 SEM micrographs) as a result of the reconstruction steps discussed in the previous sec-
section. tion.
FigureFigure 4. Stitched
4. Stitched SEM images SEM images
of the of thecylinder
multiferroic multiferroic cylinder
composite composite
(a) before (a) the
testing, where before testing,
region where the
of the predefined
crack isregion of the predefined crack is annotated (here, black squares are areas of missing image
annotated (here, black squares are areas of missing image data), and (b) after the 45-day period of cyclic data),
loading.
Degradation
and (b) of the epoxy
after the interface quality is
45-day period ofclearly
cyclicvisible, as evidenced
loading. by theof
Degradation widespread
the epoxyvoid formation
interface and initial
quality is
crack lengthening.
clearly visible, as evidenced by the widespread void formation and initial crack lengthening.
The arc length of the predefined crack before loading was found to be 6.27 mm
The arc length of 5a),
(Figure the corresponding
predefined crack before loading
to a circumferential anglewas found
of 28.7 ◦ andto be 6.27 mm
representing (Fig-
a 2.27 mm
ure 5a), corresponding ◦ to a of
(10.5 ) increase circumferential
the planned length angle
of 4.0of
mm.28.7°
The and representing
difference between thea realized
2.27 mm and
planned crack lengths was attributed to the possible shifting of
(10.5°) increase of the planned length of 4.0 mm. The difference between the realized and the Teflon spacer during the
manufacturing process, given that the silver epoxy was very malleable before curing. To
planned crack lengths was attributed to the possible shifting of the Teflon spacer during
further characterize the crack, the crack tips were measured and found to have respective
the manufacturing process,
thicknesses given
of 43 that
and 47 µm,the silver that
indicating epoxy wascrack
the two verytips
malleable before
shared similar curing.
characteristic
To further characterize
sizes. Thethe
lastcrack,
notablethe crack tips
geometrical werewas
attribute measured and of
the thickness found to have
the silver epoxyrespec-
bonding
tive thicknesses interface,
of 43 and which was indicating
47 μm, of paramountthat importance
the twoascrack
it wastips
the basis
sharedof the strain mediation
similar charac-
teristic sizes. The last notable geometrical attribute was the thickness of the silver shows
and resultant magnetoelectric response of the composite structure. Figure 5c epoxya
representative interface between the composite phases, which was consistent with all other
bonding interface, which was of paramount importance as it was the basis of the strain
SEM micrographs collected around the circumferential interface. Common to the entire
mediation and resultant
circumference magnetoelectric
(except where theresponse
crack was of the composite
introduced) structure.
was the excellent Figure
interface 5c
quality,
shows a representative interface voids,
where no significant between theorcomposite
defects, pre-existing phases, whichwere
bond separation wasobserved.
consistent The
average interface width of 76.8 ± 12.8 µm was based on
with all other SEM micrographs collected around the circumferential interface. Common collected measurements at 20◦
increments around the circumference. The interface width difference was attributed to
to the entire circumference (except where the crack was introduced) was the excellent in-
(1) the hand-sanding process that was used to fit the two rings and (2) the malleability of
terface quality, where noepoxy
the silver significant
that was voids,
used to defects, or pre-existing
assemble the cylinders. bond separation were
observed. The average interface width of 76.8 ± 12.8 μm was based on collected measure-
ments at 20° increments around the circumference. The interface width difference was
attributed to (1) the hand-sanding process that was used to fit the two rings and (2) the
malleability of the silver epoxy that was used to assemble the cylinders.
Upon testing and removing the samples from the experimental setup, the electrode
wires and search coils were carefully detached from the composite structure. Without fur-
ther processing, the sample was reexamined using the electron microscope, closely follow-and Terfenol-D boundary. It is worthwhile to note that close examination of the tested
sample confirmed that the debonding sites were a byproduct of the long-term testing.
(3) The quality of the bonding layer at the onset of testing was noted to be ‘excellent’ as
the interface was free of voids or cracks, except for the predefined crack. However,
Magnetochemistry 2021, 7, 55 the bonding layer quality noticeably degraded during testing, as evidenced in Figure
7 of 13
6 by the nucleation of voids and cracks within the bonding layer, which was at-
tributed to the epoxy cohesion failure.
Magnetochemistry 2021, 7, x FOR PEER REVIEW 7 of 13
initial length of 6.27 mm (Figure 5a), i.e., an increase of 93.0% from the initial crack
length, corresponding to a total angle of 55.4°. The crack length nearly doubled due
to the oscillatory nature of the loading, where the applied AC electric field resulted
Figure
Figurein5.5. cyclic
A collection
A collection
strains of SEM
of SEM micrographs
that micrographs of
continuously of loaded
selected the
selected areas
areas before and
samples
before and
andafter the testing
induced
after the testing showing(a)
corresponding
showing
(a) the arc length
oscillatory of the predefined
magnetostriction crack
in before
the innertesting of
Terfenol-D6.27 mm, which
cylinder.
the arc length of the predefined crack before testing of 6.27 mm, which (b) extended to 12.10 (b)
In extended
other words, tomm
12.10
theafter
me-
mm after 45
chanical days of continuous
work loading,
provided loading, (c) a close-up view of the bonding layer showing the ini-
45 days of continuous (c)by the generated
a close-up view of thepiezoelectric
bonding layer strain and the
showing the induced piezo-
initial thickness
tial thickness of 76.8 ± 12.8 µ m, and (d) the thickness of the bonding layer that had increased to
of 76.8magnetic
± 12.8 µm,strain
and (d) cyclically loaded
the thickness thebonding
of the predefined layercrack to failure.
that had increased to 167.6 ± 27.9 µm
167.6 ± 27.9 µ m after the testing.
(2) the
after Gross debonding was noticeable along the interfaces, particularly at the silver epoxy
testing.
and Terfenol-D boundary. It is worthwhile to note that close examination of the tested
Upon
sample testing and removing
confirmed the samples
that the debonding sitesfrom
were the experimental
a byproduct of thesetup, the electrode
long-term testing.
wires and search coils were carefully detached from the composite
(3) The quality of the bonding layer at the onset of testing was noted to be ‘excellent’ as structure. Without
further theprocessing,
interface was thefree
sample was or
of voids reexamined
cracks, except using forthetheelectron
predefined microscope, closely
crack. However,
following the steps used in characterizing the virgin samples.
the bonding layer quality noticeably degraded during testing, as evidenced in FigureWith a focus on the interfaces
and the 6 bybonding layer, the post-stitching
the nucleation of voids and analysis revealed
cracks within thethree overarching
bonding observations:
layer, which was at-
1. The
tributedarc length of the predefined
to the epoxy cohesion failure. crack, which was the area of the most significant
interface debonding at the location of the Teflon strip, increased to 12.10 mm from an
initial length of 6.27 mm (Figure 5a), i.e., an increase of 93.0% from the initial crack
length, corresponding to a total angle of 55.4◦ . The crack length nearly doubled due
to the oscillatory nature of the loading, where the applied AC electric field resulted
in cyclic strains that continuously loaded the samples and induced corresponding
Figureoscillatory magnetostriction
6. SEM micrograph of the epoxy ininterface
the inner Terfenol-D
sandwiched cylinder.
between In other words,
the magnetostrictive Ter- the
mechanical work provided by the generated piezoelectric
fenol-D and piezoelectric PZT layers (a) before electrically and magnetically loading the sample strain and the induced
and (b) piezomagnetic
after the 45-daystrainperiod cyclically loaded the predefined crack to failure.
of cyclic loading.
2. Gross debonding was noticeable along the interfaces, particularly at the silver epoxy
and Terfenol-Da boundary.
Additionally, It is worthwhile
high magnification surfaceto note that of
inspection close
theexamination
Terfenol-D and of thePZTtested
cyl-
inders sample
showed confirmed
that the thatcracksthe(new
debonding sites were
or predefined) a byproduct
were boundedof the long-term
within the silvertesting.
epoxy
3.
bonding The quality of thethe bonding layer at the onset of testing wasmorphology,
noted to be ‘excellent’ forasa
Figure 5. layer, where
A collection of SEM active cylinders
micrographs maintained
of selected areas the same
before and after the testing except
showing
few the interface
chipping sites was free
at the of voids
outer rim or cracks,
ofbefore except
the Terfenol-D for the
ring. predefined
Overall, crack. However,
theextended
predefined the
crack
(a) the arc length of the predefined crack testing of 6.27 mm, which (b) to 12.10
did
mmnot bonding
afterpropagatelayer quality
through the
45 days of continuous noticeably
bonding
loading, degraded
(c) alayer.
close-up during
Instead, testing,
view ofitthe evolved as
bonding evidenced
tolayer in
an interfacial Figure
showing the ini-6
crack
that by the
tial thickness nucleation
was exhibited
of 76.8 in of voids
overµ m,
± 12.8 90% andand
of(d) cracks
thethe within
circumferential the bonding
thickness of theinterface,
bonding layerlayer, which
as shown
that had was attributed
inincreased
Figure 4b. to
167.6to the µepoxy
± 27.9 m after cohesion failure.
the testing.
Figure6.6.SEM
Figure SEMmicrograph
micrographofofthe
theepoxy
epoxyinterface
interfacesandwiched
sandwiched between
between thethe magnetostrictive
magnetostrictive Ter-
Terfenol-
fenol-D and piezoelectric PZT layers (a) before electrically and magnetically loading the sample
D and piezoelectric PZT layers (a) before electrically and magnetically loading the sample and (b)
and (b) after the 45-day period of cyclic loading.
after the 45-day period of cyclic loading.
Additionally, a high magnification surface inspection of the Terfenol-D and PZT cyl-
inders showed that the cracks (new or predefined) were bounded within the silver epoxy
bonding layer, where the active cylinders maintained the same morphology, except for aMagnetochemistry 2021, 7, 55 8 of 13
Additionally, a high magnification surface inspection of the Terfenol-D and PZT
cylinders showed that the cracks (new or predefined) were bounded within the silver
epoxy bonding layer, where the active cylinders maintained the same morphology, except
for a few chipping sites at the outer rim of the Terfenol-D ring. Overall, the predefined
crack did not propagate through the bonding layer. Instead, it evolved to an interfacial
crack that was exhibited in over 90% of the circumferential interface, as shown in Figure 4b.
Based on the SEM micrographs measurements leading to Figures 4 and 5, there was a
striking change in the thickness of the bonding layer separating the two cylinders through-
out testing. The as-fabricated thickness of the silver epoxy layer was 76.8 ± 12.8 µm, while
the thickness of the same layer after dynamic testing was found to be 167.6 ± 27.9 µm,
constituting a 118% increase in the bonding layer thickness. This difference resulted from
changes in the Terfenol-D ring dimension, which was measured to have an average outer
diameter of 24.82 mm after testing instead of 24.99 mm before testing. As discussed in the
experimental protocol, the testing stimuli included an AC electric field that was applied ra-
dially to generate piezoelectric strain, which was transferred across the interface to induce
piezomagnetic strain in the inner Terfenol-D ring. Additionally, the latter was subjected
to a diametrically applied bias magnetic field of 500 Oe, corresponding to the onset of
magnetic saturation of the material [19]. In summary, the Terfenol-D ring was under the
combined influence of compressive stress and bias magnetic field for an extended duration
and, as a result, permanently and nearly uniformly radially contracted.
In an effort to mechanistically explain the predominance of the interface debonding at
the silver epoxy/Terfenol-D interface with the lack of kinking, the framework of Dundurs’
parameters from linear elastic fracture mechanics of multilayered structures was brought
into consideration. Dundurs’ parameters describe the strain distributions and, therefore,
crack-branching behavior in a discrete composite as a function of the relative properties of
each material phase [31–33]:
µ(κ1 + 1) − (κ1 + 1) 1 µ1 (1 − 2ν2 ) − µ2 (1 − 2ν1 )
α= and β = (1)
µ(κ1 + 1) + (κ1 + 1) 2 µ1 (1 − 2ν2 ) + µ2 (1 − 2ν1 )
3 − νi
where µ = µ 2
µ1 , κi = 1+νi , µ is the shear modulus (taken to be 19 GPa for PZT, 0.3 GPa for
silver epoxy, and 12 GPa for Terfenol-D), and νi is Poisson’s ratio (taken to be 0.32 for PZT,
0.40 for silver epoxy, and 0.25 for Terfenol-D). Regardless of the investigated interface, the
parameters α and β from Equation (1) were found to be 0.96 and 0.16, respectively. Since α
is close to unity for both interfaces, this suggested that interface debonding was the most
probable form of failure, which was consistent with the results explicated in the previous
section. Composite interfaces with α (α − 2β) > 0 are characterized by compression of
the interface layer due to an elastic mismatch. In this configuration, as was the case for
both interfaces under consideration herein, an increase in the shear stresses was predicted,
leading to the increased likelihood of interfacial crack formation [31–33]. Since β was
nonzero, this suggested minor crack kinking in the crack tips, which was observed in some
locations around the outer diameter of the Terfenol-D cylinder.
The prominence of the interfacial cracks at the silver epoxy/Terfenol-D interface
was attributed to the contraction of the outer diameter of the Terfenol-D ring, which also
resulted in the cohesion failure that was sporadically exhibited within the bonding layer.
As the outer diameter contracted, it pulled the bonding layer in the radial direction, hence
the highlighted failure modes. While the Dundurs’ parameters indicated a near-equal
opportunity for either interface failure, the failure mode dominance along the Terfenol-D
is explained by the preceding discussion. Furthermore, sanding of the inner diameter
of the PZT ring resulted in better bonding at the PZT/silver epoxy interface. The latter
implies that mechanical interlocking at the PZT/silver epoxy interface played a major role
in improving the interfacial strength at that interface and resulted in a low probability of
debonding, as discussed before. On the other hand, the bonding surface of the Terfenol-D
ring, i.e., the outer diameter of the ring, was only gently buffed to remove surface oxidation
and avoid breakage of the intrinsically brittle material.Magnetochemistry 2021, 7, 55 9 of 13
2.2. The CME Response
Figure 7 shows the converse magnetoelastic coupling coefficient of the composite
cylinder structure, which was monitored at the crack site and a diametrically opposed
location. The CME was reported over 45 days of continuous actuation of the external PZT
cylinder and under the influence of a bias magnetic field. The axis of the search coils fitted
around the cylinder coincided with the direction of the bias magnetic field. By holistically
considering the CME shown in Figure 7, it is worth noting the following three overarching
observations. First, the average CME over the entire actuation period at the uncracked site
was around 75% higher than at the cracked location, whereas the CME at the uncracked
site was 342.5 ± 90.1 mG/V, while it was 193.3 ± 29.9 mG/V at the cracked site. The
former figure was found to be initially higher than the CME reported by Chavez et al. for a
similar fully intact composite structure in the first week of testing, but on average, it is in
good agreement [12]. The difference in the results reported herein compared to [12] was
attributed to the enhanced sample preparation process, as discussed in the previous section.
The disparity between the CME values at the observation sites was attributed to the pres-
ence of the predefined crack, given that the main mediator between electric and magnetic
energies in the investigated multiferroic paradigm is the mechanical strain. In other words,
the quality of the bonding layer was compromised at the crack site, which reduced the
efficacy of strain transduction and resulted in a lower CME. The poor strain transfer at the
crack site was consistent with the predictions of the effective medium theory and previous
experimental investigations [5,12,13,17–19,27,34,35]. A final note about the first observed
behavior of the CME is warranted since it is counterintuitive to expect any strain-mediated
coupling whatsoever at the crack site given the reasons regarding interface quality and the
dependence of transduction efficacy of the continuity conditions, as discussed above. The
ability to measure and report magnetoelectric coupling at the crack site is associated with
the self-boundedness of the cylinder geometry rather than its sole reliance on interface
quality, as is the case in other composite configurations, namely 2-2 laminated plates.
Here, the self-boundedness effect was defined as the high efficiency of strain mediation
between the ferromagnetic and piezoelectric materials because of the geometry and the
directionality of strain transfer in the composite. That is, the circumferential in-plane and
out-of-plane vibrational modes were coupled and continuous within the continuum of the
cylinder, as was recently shown experimentally and numerically in [17], which gave rise to
a local magnetostrictive strain in the proximity of the crack, hence, coupling electric and
magnetic energies.
Second, from the onset of testing until nearly 3 min of loading, the CME at both
observation locations was found to increase nearly monotonically to reach 223.2 mG/V
and 432.5 mG/V for the cracked and uncracked locations, respectively. While the CME
at the crack site increased at a rate of 183 µG/V·s, reaching the maximum after 160 s, the
CME at the uncracked site ascended at a rate of 472 µG/V·s to the peak value after 175 s.
The quasi-linear increase of the CME, regardless of the location or rate, was attributed to
the time required to fully develop the displacement field and associated vibrational modes
in the structure after the spontaneous generation of radial piezoelectric strain upon the
application of an electric field. In other words, and contrary to the supposition that is
usually employed in analytical models, each constituent material had a source of internal
losses, including electrical damping of the outer piezoelectric cylinder and mechanical
losses in the silver epoxy bonding layer, to name a few sources of structural damping.
Moreover, as additional high-frequency structural vibrations were stimulated due to the
coupling of lower frequency modes, the resulting overall mechanical strain increased, thus,
registering increasing values of magnetoelectric coupling until the steady-state response
was reached at 160 s and 175 s for the cracked and uncracked sites, respectively. The
difference in the rate of increase within this initial period was solely associated with the
quality of the interface, where the uncracked sites exhibited direct, bidirectional transfer
of piezoelectric and piezomagnetic strains. On the other hand, the crack site strains were
transduced ahead of the crack tips at fully intact locations, then propagated throughMagnetochemistry 2021, 7, 55 10 of 13
the magnetostriction cylinder, resulting in a localized oscillatory piezomagnetic strain
under the search coil surrounding the crack site. The indirect transfer of strain around
ry 2021, 7, x FOR PEER REVIEW 10 of 13
the crack site resulted in the slight observed time lag of 15 s between the uncracked and
cracked locations.
Figure Figure
7. CME7.response
CME response for cracked
for cracked (blue)
(blue) and and uncracked
uncracked (black)
(black) sites and thesites and the previously
previously reported
reported CME of identical
cylinderCME of identical
structure cylinder structure
under short-term under
loading ([12]) short-term
is shown loading
as a red dashed ([12])
line.isAshown aswas
time lag a red dashedbetween
observed line. the
A time lag
initial response wasofobserved
peaks between
cracked and the sites.
uncracked initialThe
response peaks
inset shows theofregions
cracked andmagnetoelectric
of the uncracked sites. The
response.
inset shows the regions of the magnetoelectric response.
Finally, once the CME reached its maximum values, the remainder of the response
Finally, oncecan
thebe divided into three successive regions, where regions II and III showed a quasilinear
CME reached its maximum values, the remainder of the response can
reduction in the magnetoelectric coupling but at two different rates. Region II extended
be divided into three successive regions, where regions II and III showed a quasilinear re-
for 11 h, over which, the CME reduced at a rate of 10.17 mG/V and 20.66 mG/V per
duction in the magnetoelectric
logarithmic decade coupling
of timebutinat two different
seconds rates. Region
for the cracked II extended
and uncracked sites, for 11
respectively. On
h, over which, thethe CME reduced at a rate of 10.17 mG/V and 20.66 mG/V per logarithmic
other hand, region III was taken to last for 3.6 days preceding region IV, within which,
decade of time intheseconds for rate
reduction the ofcracked
the CME and uncracked
values sites,slowed
accordingly respectively.
down to On a ratetheofother
6.91 mG/V per
hand, region III was taken
decade forto
thelast for 3.6
cracked days
site, whilepreceding region
it accelerated IV, within
to nearly doublewhich, theofreduc-
at a rate 51.66 mG/V per
decade
tion rate of the CME at the
values uncracked slowed
accordingly site. Thedown
terminalto astage
rate(region
of 6.91 IV in Figure
mG/V 7) was characterized
per decade for
by a rapid drop in the CME values as the testing time increased.
the cracked site, while it accelerated to nearly double at a rate of 51.66 mG/V per decade at Another characteristic of
region IV is the appearance of superimposed oscillation in the response. After 45 days of
the uncracked site. The terminal stage (region IV in Figure 7) was characterized by a rapid
testing, i.e., at the end of the testing period, the uncracked CME was found to be 255 mG/V
drop in the CME values as the testing time increased. Another characteristic of region IV is
instead of 163 mG/V for the CME at the crack site, which was a difference of only 56%.
the appearance ofThis
superimposed
correspondedoscillation
to an overall in the
rate response.
of decreaseAfter
of 3.9445mG/V
days of pertesting,
day andi.e.,1.33atmG/V per
the end of the testing period,
day for the uncracked
the uncracked CMEsites,
and cracked was respectively.
found to beThe 255continuous
mG/V instead of 163
reduction in the CME
mG/V for the CME at the
values atcrack
either site, which was
observation a difference
site, regardless of only
of the rate, 56%. This corresponded
was attributed to the degradation of
to an overall rate of
thedecrease
interface,ofwhere
3.94 mG/V per day cracks
the interfacial and 1.33 mG/V per
nucleated andday for the uncracked
propagated as elucidated based
and cracked sites,on the micrographic
respectively. analyses. Asreduction
The continuous the degradation rate ofvalues
in the CME the interface
at either quality
obser-accelerated,
vation site, regardless of the rate, was attributed to the degradation of the interface, where released
corresponding to region IV of Figure 7, the interfacial cracks propagated and
stressnucleated
the interfacial cracks waves thatand continued to circulate
propagated the cylinder
as elucidated due to
based onthetheself-boundedness
micrographic effect. In
other words, the incremental interfacial debonding was the source of the superimposed
analyses. As the degradation rate of the interface quality accelerated, corresponding to re-
oscillations observed in the CME response in region IV at the cracked and uncracked
gion IV of Figure locations.
7, the interfacial
Table 1 cracks
succinctlypropagated
summarizes andthereleased
underlyingstress waves that contin-
characteristics of the respective
ued to circulate the
regions. Future studies will extend the loading period until a catastrophicincre-
cylinder due to the self-boundedness effect. In other words, the failure occurs.
mental interfacial debonding was the source of the superimposed oscillations observed in
the CME response in region IV at the cracked and uncracked locations. Table 1 succinctly
summarizes the underlying characteristics of the respective regions. Future studies will ex-
tend the loading period until a catastrophic failure occurs.Magnetochemistry 2021, 7, 55 11 of 13
Table 1. Changes in magnetoelectric response for the response regions that are denoted in Figure 7
as a function of logarithmic time at the uncracked (UC) and cracked (C) sites.
Region I II III IV
175 s (UC)
Duration 11 h 3.6 days 41 days
160 s (C)
Uncracked CME (mG/V per decade) 61.36 −21.66 −51.66 −74.62
Cracked CME (mG/V per decade) 23.73 −10.17 −6.91 −27.45
As part of the experimental protocol, the surface temperature of the composite ring
structure was continuously monitored using an IR sensor that was aimed near the cracked
site. At the onset of testing, the temperature of the composite structure was recorded to
be 21.0 ◦ C, which reached a steady-state average of 94.3 ± 0.4 ◦ C over nearly the entire
loading period. The increase in temperature amounted to thermal energy (Q) of ≈216 J
due to the specific heat capacity (c, taken to be 350 J/kg·K) of the piezoelectric material
(Q = mc∆T). The increase in temperature was associated with energy losses (discussed
above due to damping) and was accounted for by using the strain energy density (U) due
to the piezoelectric strain, such that:
π 2 V 2
U= Yd (2)
2 δ
where, Y, V, d, and δ are the elastic modulus of PZT (76 GPa), the amplitude of the applied
voltage (100 V), the piezoelectric coefficient (3 × 10⁻¹⁰ m/V), and the wall thickness of
the sample in the polarization direction (2.5 mm), respectively. The total strain energy
release was found to be ≈782 J over the first ≈2600 s of actuation. Overall, the thermal
energy from the increase in temperature constituted nearly 28% of the strain energy over
the same period, which was found to be in excellent agreement with the previous results
of Zheng et al., which reported a 30% energy loss in piezoelectric materials due to Joule
heating [36].
In closing, several follow-up studies are planned to explicate the effect of the initial
crack on the fracture behavior as a function of the loading times. As part of such an effort,
the length of the initial crack can be controlled by adjusting the width of the Teflon spacer
used when introducing the crack (see Section 1.1 above). Another emphasis of future
studies is elucidating the electric field effect, which can be used to tune the induced strain
(i.e., the input mechanical energy). Increasing the electric field may result in different
fracture behavior than that reported above, hence the motivation for future investigations.
3. Conclusions
In conclusion, the research performed in this study was designed to resolve a funda-
mental gap in the understanding of the long-term performance of multiferroic composite
structures since devices based on this coupling paradigm are expected to undergo billions
of cycles. The most remarkable outcome of the study was the elucidation of a measur-
able converse magnetoelectric coupling coefficient at a location of a predefined crack in
the bonding layer, which was primarily attributed to the self-boundedness effect of the
cylinder structure. Furthermore, this study demonstrated that these structures experienced
significant degradation in the magnetoelectric response under extended loading. Over the
45-day testing period, the CME decreased by 48.4% at the uncracked site but only 26.7% at
the cracked site. The micrographic analysis additionally confirmed the interface bonding
and void nucleation fatigue-related behaviors and suggested the existence of additional
aging effects that deserve further investigation. While the experimental studies in this
research investigated samples for up to 45 days, corresponding to 126 billion loading cycles,
there were still ongoing changes in the magnetoelectric response observed at the end ofYou can also read