Enhanced electric field sensitivity of quantum dot/ rod two-photon fluorescence and its relevance for cell transmembrane voltage imaging
←
→
Page content transcription
If your browser does not render page correctly, please read the page content below
Nanophotonics 2021; aop

Research article

Stijn Jooken*, Yovan de Coene, Olivier Deschaume, Dániel Zámbó, Tangi Aubert, Zeger Hens,
Dirk Dorfs, Thierry Verbiest, Koen Clays, Geert Callewaert and Carmen Bartic*

Enhanced electric field sensitivity of quantum dot/
rod two-photon fluorescence and its relevance for
cell transmembrane voltage imaging
https://doi.org/10.1515/nanoph-2021-0077                              Keywords: electric field; quantum dot/rod; semiconductor
Received February 23, 2021; accepted May 4, 2021;                     nanoparticle; two-photon fluorescence; voltage sensing.
published online May 20, 2021

Abstract: The optoelectronic properties of semiconductor
nanoparticles make them valuable candidates for the long-             1 Introduction
term monitoring of transmembrane electric fields in
excitable cells. In this work, we show that the electric field        Quantum dots (QDs) or quantum rods (QRs) are semi-
sensitivity of the fluorescence intensity of type-I and quasi-        conductor nanoparticles (NP) typically composed of II–VI,
type-II quantum dots and quantum rods is enhanced under               III–V or IV–VI materials such as CdSe, CdS, InP or PbS among
two-photon excitation compared to single-photon excita-               others. Their sizes are smaller than the Bohr exciton radius
tion. Based on the superior electric field sensitivity of the         giving them unique optical and optoelectronic properties due
two-photon excited fluorescence, we demonstrate the                   to the confinement of the charge carriers in all three di-
ability of quantum dots and rods to track fast switching              mensions. As a consequence, quantum dots have a broad
E-fields. These findings indicate the potential of semi-              absorbance and a narrow emission spectrum (ideal for fluo-
conductor nanoparticles as cellular voltage probes in                 rescence multiplexing) that can be tuned by simply varying
multiphoton imaging.                                                  the size of the particle. Their quantum yields (QY) and long-
                                                                      term photostability are much less affected by photobleaching
                                                                      than those of organic fluorophores. Moreover, the much
*Corresponding authors: Stijn Jooken and Carmen Bartic, Department    larger absorption cross-sections for both single- and two-
of Physics and Astronomy, Soft Matter and Biophysics, KU Leuven,
                                                                      photon excited fluorescence (1PF & 2PF), even up to 106–
3001 Leuven, Belgium, E-mail: stijn.jooken@kuleuven.be (S. Jooken),
                                                                      107 GM [1, 2], justify why QDs are extensively used in bio-
carmen.bartic@kuleuven.be (C. Bartic). https://orcid.org/0000-
0003-4787-9086 (S. Jooken). https://orcid.org/0000-0001-9577-         logical imaging applications [3, 4].
2844 (C. Bartic)                                                           To reduce the probability of nonradiative decay
Yovan de Coene, Thierry Verbiest and Koen Clays, Department of        through surface states and guarantee a high fluorescence
Chemistry, Molecular Imaging and Photonics, KU Leuven, 3001           QY, the most commonly used QDs are semiconductor core–
Leuven, Belgium. https://orcid.org/0000-0002-1514-5865 (Y. de
                                                                      shell heterostructures, in which a second material with a
Coene). https://orcid.org/0000-0002-0822-176X (T. Verbiest).
https://orcid.org/0000-0001-9490-0023 (K. Clays)                      different band alignment is epitaxially grown around the
Olivier Deschaume, Department of Physics and Astronomy, Soft          semiconductor core. In a type-I structure, the bandgap of
Matter and Biophysics, KU Leuven, 3001 Leuven, Belgium. https://      the core material is smaller than the bandgap of the shell.
orcid.org/0000-0001-6222-0947                                         In these structures, the shell effectively passivates the
Dániel Zámbó and Dirk Dorfs, Institute of Physical Chemistry and
                                                                      surface of the core, reducing the number of surface
Electrochemistry, Leibniz Universität Hannover, 30167 Hannover,
                                                                      dangling bonds, enhancing the fluorescence QY and
Germany. https://orcid.org/0000-0001-7671-039X (D. Zámbó).
https://orcid.org/0000-0001-6175-4891 (D. Dorfs)                      photochemical stability. In a type-II or quasi-type-II
Tangi Aubert, Department of Chemistry, Ghent University, 9000         structure, either the conduction or valence band of the
Ghent, Belgium; and ICGM, University of Montpellier, CNRS, ENSCM,     core material is located within the bandgap of the shell in a
34000 Montpellier, France. https://orcid.org/0000-0003-0905-3822      staggered fashion. As a consequence, one carrier is
Zeger Hens, Department of Chemistry, Ghent University, 9000 Ghent,
                                                                      confined to the core while the other is either located in the
Belgium. http://orcid.org/0000-0002-7041-3375
Geert Callewaert, Department of Cellular and Molecular Medicine, KU   shell or delocalized over the entire particle. The latter is
Leuven Campus Kulak, 8500 Kortrijk, Belgium                           referred to as a quasi-type-II NP.

  Open Access. © 2021 Stijn Jooken et al., published by De Gruyter.   This work is licensed under the Creative Commons Attribution 4.0
International License.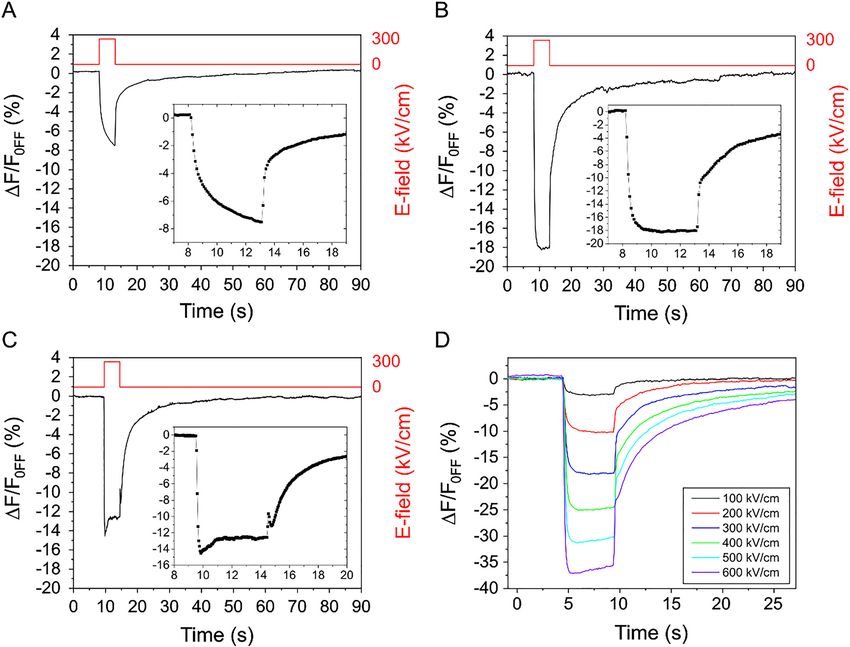
2 S. Jooken et al.: Enhanced electric field sensitivity
Because of their 3D confinement, a QD’s fluorescence of semiconductor heterostructures under single-photon
can be modulated by external electrical fields through a (1P) illumination in a controlled environment. While
combination of the Quantum-confined Stark effect (QCSE) lifetime and spectral imaging are promising detection
and QD ionization [5]. In the QCSE, an external electric field schemes as well, standard fluorescence intensity micro-
separates the charge carriers, creating a dipole moment. scopy is the most wide spread imaging modality in
Consequently, the reduced overlap between the electron microscopy and electrophysiology labs and hence the
and hole wave functions enhances the nonradiative decay focus of this work. Table 1 gives an overview of the reported
resulting in a decrease of the fluorescence intensity. In a voltage sensitivities of the fluorescence intensity to applied
symmetric QD, the decrease of the fluorescence emission in- E-fields of different types of QDs (omitting reported spectral
tensity due to the QCSE is known to be quadratic with the shifts and lifetime imaging). It clearly shows that type-II
applied E-field [6]. In an asymmetric QR, on the other hand, and quasi-type-II NPs exhibit much larger sensitivities
consisting of a QD core overgrown with a rod-shaped shell, compared to type-I NPs. However, previous reports only
the QCSE results in a linear decrease of the fluorescence in- studied 1PF changes and mostly investigated the E-field
tensity [7, 8]. Carrier ionization entails the possibility that sensitivity of dry or polymer encapsulated NPs.
upon photoexcitation a core carrier, electron or hole, is As such, the use of QDs has progressed in imaging
thermally ejected or tunnels to the QD’s surface. Any surface cellular membrane potentials, competing with voltage-
defect can potentially act as a trap state and capture the sensitive dyes and genetically encoded voltage in-
ejected charge carrier. Photoexcitation of such an ionized QD dicators (GEVIs) or hybrids thereof [15], which still suf-
then triggers nonradiative Auger recombination, which also fer from low brightness, photobleaching, toxicity and/or
quenches the fluorescence. In the presence of an external need for genetic manipulation. In principle, semi-
electric field, the confinement barrier is reduced, increasing conductor NPs offer a robust alternative capable of
the population of nonfluorescing, ionized QDs, also overcoming such limitations.
decreasing the fluorescence intensity [9]. To circumvent problems with QD membrane insertion,
In the last decade, several studies have investigated initial reports opted for an indirect modulation of fluores-
the electric field sensitivity of the fluorescence intensity cence through electron transfer [16] or Förster resonance en-
[5, 8, 10, 11], the spectral shift of the emission wavelength ergy transfer [17]. Recently lipid-coated type-II QRs have been
[7, 10, 12–14] and the radiative lifetime [7] of different types embedded within the cell membrane to successfully report
Table : Literature reports on QCSE-based E-field sensitivity of QD/QR PF intensity by application of well-controlled E-fields.
Nanoparticle Ø (nm) Capping Applied E-field ΔF =F Ref.
Quasi-type-II CdSe/CdS QD Bipyridine Steady-state, % below kV/cm []
Hz, Hz Ensemble % for kV/cm
In aqueous, ionic solution
Type-I InP/ZnS QD % below kV/cm
% for kV/cm
Type-I CdSe/ZnS QD TOPOa, oleic acid, oleylamine, Hz ± % for kV/cm []
Quasi-type-II CdS/CdSe/CdS hexadecylamine Single particle − ± % and ±
Embedded in a PVPb layer % for kV/cm
Quasi-type-II Te-doped CdSe/CdS QR − ± % and ± %
for kV/cm
Quasi-type-II CdSe/CdS QR ± % for kV/cm
Type-II ZnSe/CdS QR × − ± % and ± %
for kV/cm
Type-I CdSe/ZnS QD . Oleylamine, oleic acid, TOPO Steady-state % for kV/cm []
Embedded in PMMA film Ensemble % for kV/cm
Quasi-type-II CdSe/ZnSe QD % for kV/cm
% for kV/cm
CdSe QR × TOPO, oleic acid, Hz .% for kV/cm []
Quasi-type-II CdSe/CdS QRs × octadecylamine, oleylamine Single particle .% for kV/cm
Type-II CdTe/CdSe QDs Air exposed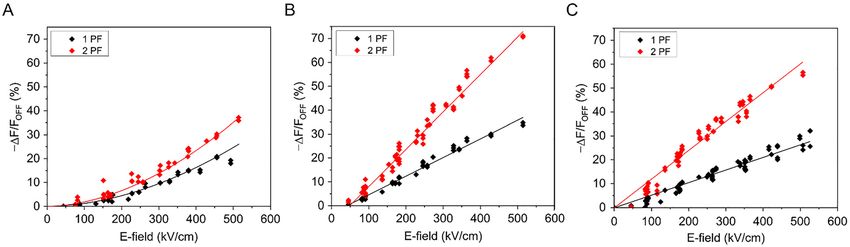
S. Jooken et al.: Enhanced electric field sensitivity            3

patch-clamp induced changes in membrane potential in               that the optoelectronic characteristics of our best per-
HEK293 cells [18, 19] and mouse cortical neurons [20]. How-        forming NPs make them suitable for detecting cardiac APs
ever, Ludwig et al. [20] reported limited (less than 10%)          by 2P imaging with an E-field sensitivity (ΔF/F0) of roughly
success in membrane insertion with varying degree of inser-        14% compared to a 1PF sensitivity of 8%.
tion and orientation (ideally orthogonal). Even with extensive
image processing, only few responsive NPs (0.6% of 1242
analyzed particles in 35 cells) were found. At a single particle   2 Materials and methods
level, QR fluorescence exhibited short intervals of voltage
sensitivity with a mean ΔF/F0 of 5–10% (0.6 nm wavelength          2.1 Materials
shift) for a 25 Hz voltage square wave with 60 mV amplitude
(∼150 kV/cm), which is only slightly smaller to the expected       Cadmium oxide (CdO, 99.998%), oleic acid (OA, 90%) were purchased
response in calibration experiments on particles with a            from Alfa Aesar. Tri-n-octylphosphine oxide (TOPO, 99%), elemental
similar shape and composition [11].                                sulfur (99.98%), 1-octadecene (ODE, 90%), poly-styrene-co-maleic
     Remarkably, two-photon (2P) imaging of direct modu-           anhydride (PSMA, 1700 g/mol), mercaptosuccinic acid (MSA), Jeff-
                                                                   amine polyetheramine (M600), ethanolamine (ethNH2), chloroform
lation of a QDs fluorescence by external electric fields is an
                                                                   (≥CHCl3, 99.8%), tetramethylammonium hydroxide pentahydrate
unexplored territory. While the nonlinear optical properties       (TMAH, ≥95.0%), 4-(2-hydroxyethyl)-1-piperazineethanesulfonic
of semiconductor NPs are a main area of interest in photonic       acid (HEPES) and collagen from bovine skin (6 mg/mL) were pur-
material research, especially their 2P absorption (2PA) cross-     chased from Sigma-Aldrich. Toluene (≥99.7%) and methanol
sections, so far only the effect of temperature changes on the     (MeOH, ≥99.8%), sulfuric acid (H2SO4), hydrogen peroxide (H2O2, 31%)
2PF was investigated [21]. The thermal sensitivity was found       were purchased from Honeywell. Hexamethyldisilazane (HMDS),
                                                                   1-methyl-2-pyrrolidone (NMP) and Microposit S1818 G2 were pur-
to be enhanced with respect to 1P excitation and attributed to
                                                                   chased from Microchemicals. Tri-n-octylphosphine (TOP, 97%), octa-
a temperature sensitive 2PA cross-section. In general, multi-      decylphosphonic acid (ODPA, 99.0%) and hexylphosphonic acid
photon bio-imaging benefits from a reduced photobleaching           (HPA, 99%) were obtained from Fisher Scientific and PCI, respectively.
and better spatial resolution due to a reduced excitation          All chemicals were used as received without further purification.
volume as well as an increased penetration depth, reduced
tissue damage and autofluorescence at near-infrared (NIR)           2.2 NP synthesis and water-transfer
excitation wavelengths. We have previously used 2P imaging
to report fluorescence changes occurring during the electrical      The 6 nm octadecylamine capped type-I CdSe/ZnS QDs (QD6) were
and contractile activity of spontaneously beating car-             purchased from Sigma-Aldrich (product n° 790206). The 9 nm oleic acid
diomyocytes [22].                                                  capped quasi-type-II CdSe/CdS QDs (QD9) were synthesized according to
     In an effort to further elucidate the potential of QDs for    the flash procedure [23, 24]. CdO (0.183 g), TOPO (5 g) and OA (2.5 g) were
                                                                   degassed in a Schlenk-line system at 150 °C for 1 h. After changing the
imaging membrane voltages in electrogenic cells, we
                                                                   vacuum to nitrogen, the temperature was set to 350 °C. After the complete
report here the electric field sensitivity of 1PF and 2PF of       dissolution of the CdO, TOP (1 mL) was injected. After the temperature
colloidal QDs and QRs upon transfer to the water phase. We         had recovered to 350 °C, a solution of CdSe QDs (0.2 µmol) mixed with
show for the first time that under 2P excitation, the electric     TOP:S (600 µL containing 40 mg elemental sulfur) and TOP (1.4 mL) was
field sensitivity is enhanced with respect to 1P excitation        rapidly injected. After 5 min reaction time, the solution was cooled down
                                                                   to 80 °C, at which point toluene (1 mL) was injected. At 40 °C, the solution
for three different water-solubilized NPs, a type-I CdSe/ZnS
                                                                   was precipitated via the addition of MeOH (3 mL) and centrifuged. The
QD with a 3.9 nm core size and a 6.3 nm total diameter, a          QDs were further purified twice using toluene and MeOH as solvent and
quasi-type-II CdSe/CdS QD with a 3.7 nm core size and              nonsolvent, respectively. Finally, the QDs were redispersed in toluene.
8.9 nm total diameter and a quasi-type-II CdSe/CdS dot-in-         The dot (3.5 nm) in rod (5 × 35 nm) phosphonic acid capped quasi-type-II
rod with a 3.7 nm core size, 35 nm length and 5 nm width.          CdSe/CdS QRs (QR35) were synthesized according to Carbone et al. [25]
These particles are henceforth referred to as QD6, QD9 and         with slight modifications. CdO (0.36 g), HPA (0.48 g), ODPA (1.74 g) and
                                                                   TOPO (18.0 g) were degassed in a Schlenk-line system at 150 °C for 45 min
QR35, respectively. All three NPs have narrow emission
                                                                   under stirring. After changing from vacuum to argon, the temperature
spectra with respective center wavelengths 630, 640 and            was set to 300 °C. After the complete dissolution of the CdO (20–40 min),
610 nm. Using microfabricated gold interdigitated elec-            TOP (10.8 mL) was injected swiftly. Ten minutes later, the temperature
trodes (IDE) [12, 22] we applied electric fields up to              was raised to 350 °C and the toluene solution of the CdSe QDs (0.48 μmol)
600 kV/cm and report both steady-state fluorescence                 mixed with TOP:S solution (16.62 mL containing 1.20 g elemental sulfur)
                                                                   was rapidly injected with a glass syringe. After 8 min reaction time, the
changes and the fluorescence modulation in AC (alter-
                                                                   solution was cooled down to 80 °C, at which point toluene (10 mL) was
nating current) fields of 0–250 kV/cm with frequencies              injected. At 40 °C, the solution was precipitated via the addition of MeOH
ranging from 0.5 to 10 Hz. Based on the analysis of the 1PF        (10 mL) and centrifuged (3750 g, 10 min). The dot-in-rods were centri-
and 2PF responses to transient electric fields, we conclude         fuged and redispersed in toluene in three consecutive cycles. Finally, the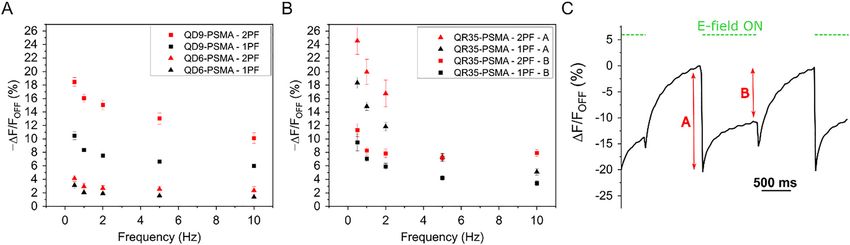
4          S. Jooken et al.: Enhanced electric field sensitivity

particles were redispersed in 6 mL toluene (final Cd concentration: ca.         emission was collected and processed by a Bruker IS/SM 500 spec-
70 g/L). Transmission electron microscopy (TEM) images of the particles        trometer in combination with an Andor Solis EMCCD camera (iXon
can be found in SI (Figure S1).                                                Ultra 897). The obtained 2PA cross-sections of the PSMA-encapsulated
      The NPs were first transferred from their initial organic solvent to     NPs are listed in SI (Figure S4).
water. All types of NPs were transferred by encapsulation of their
respective native ligands with PSMA using a slightly modified protocol
                                                                               2.5 Electrode fabrication
with respect to that described by Lees et al. [26]. Half of the anhydride
rings were opened with a Jeffamine M-600 polyetheramine, which con-
sists of nine polypropylene glycol (PPG) units and one polyethylene            Gold IDEs were fabricated on borosilicate glass chips by optical
glycol (PEG) unit, and the remainder was opened using ethNH2. The              lithography as reported previously [22]. Briefly, 4-inch borofloat glass
presence of the M600 provided steric stabilization in addition to the          wafers of 0.7 mm thickness were piranha cleaned (1:3 v/v H2O2 [30%]
electrostatic repulsion provided by the carboxylate residues from the          H2SO4 [98%]) for 20 min. Subsequently, HMDS was spin-coated as an
opened maleic anhydride rings. In the optimized protocols, 47 mg PSMA          adhesion promoter, followed by Microposit S1818 G2 positive resist
was dissolved in 50 μL chloroform (CHCl3) and added to 50 μL of the 1 μM       (3000 rpm, 30 s) and a 2 min soft bake. Using an EVG 620 illuminator,
QR35 stock solution, 30 mg PSMA was combined with 100 μL of a 10 μM            the resist was patterned and developed for 2 min 30 s in a 1:4 aqueous
QD6 stock solution and 15 mg PSMA with 100 μL of 1 μM QD9 stock                dilution of Microposit 351 developer. The silicon photomask (soda-
solution. After 4 h of shaking, 47, 30 and 15 μL of M600 was added,            lime, inverted) was ordered commercially from Compugraphics
respectively, followed by 100 μL of ethNH2 in 500 µL of water 3 h later.       (Glenrothes, Scotland). Finally, using a Baltzer BAE370 sputter coater,
After vigorous shaking for 10 min, the CHCl3 was evaporated using a            first a titanium adhesion layer was sputtered for 15 s at 200 W
rotary evaporator at 250 mbar, 40 °C. The resulting NP suspension was          RF-power followed by gold at 50 W for 3 min 20 s. Lift-off was carried
centrifuged and passed through a PD10 desalting column (GE Health-             out overnight in NMP. The resulting structures have a thickness of
care) to remove excess ligands. Alternatively to the PSMA encapsulation,       roughly 150–200 nm as found by atomic force microscopy (AFM)
some of the type-I CdSe/ZnS QDs (6 nm) were also transferred by ligand         probing (Figure S5).
exchange with MSA by combining 20 mg MSA with 100 μL of a 10 μM QD6                 Wafers were diced in 1 × 1 cm square chips and mounted and
stock solution in the presence of an equal volume of water and buffered at     bonded on a printed circuit board (PCB). The PCB has a standard
pH 10 using TMAH [27, 28]. And some of the quasi-type-II CdSe/CdS QDs          thickness of 1.58 mm and features a square 0.7 mm deep cavity in the
(9 nm) were transferred by coating with an 8.5 nm thick silica shell via the   center for fitting the glass IDE chip. A center hole of 0.8 mm diameter
reverse microemulsion method as described by Aubert et al. [29] (see SI        allows for transmission fluorescence microscopy in addition to
for details). This method likely involves an exchange of the native ligands    reflection microscopy. The top surface of the PCB features five copper
[30]. These silica-coated CdSe/CdS NPs were further functionalized with        bond pads on each side of the glass chip to allow for the individual
PEG ligands (9–12 PE units) to enhance colloidal stability and prevent         control of up to five IDE arrays. Using a custom microscope adaptor,
particle aggregation [31]. All water-transferred NPs were purified and          the PCB can be mounted upright or upside-down on a microscope
stored in a 20 mM pH 7.4 aqueous HEPES buffer at a concentration of            stage.
200 nM. Only the QD6-MSA was stored at pH 10 in an excess of MSA to
prevent rapid degradation of the organic coating. Absorbance and               2.6 Sample preparation
emission spectra after water-transfer can be found in SI (Figure S2).

                                                                               After bonding the glass IDE chip to the PCB, the top surface was coated
2.3 QY yield                                                                   by drying 10 µL of an 0.3 mg/mL collagen fiber solution. The collagen
                                                                               was pregelled for 24 h at 37 °C in a Binder incubator and horn sonicated
                                                                               for 10 s at 1 W (Branson sonifier 150). After drying and rinsing, the
The QY of the NPs were determined in 20 mM pH 7.4 HEPES buffer
                                                                               fibers were functionalized by incubating 20 µL of 200 nM NP solution
relative to rhodamine 6G (reference QY of 0.96 [32]) according to the
                                                                               for 4 h. The NPs were 30 min beforehand activated through the
method described by Würth et al. [33]. Absorbance was measured
                                                                               addition of 5 mM 1-ethyl-3-(3-dimethylaminopropyl)-carbodiimide
using a GE Healthcare Ultrospec 2100 Pro UV–Vis-NIR spectropho-
                                                                               (EDC) and 5 mM sulfo-N-hydroxysulfosuccinimide (s-NHS) to ensure
tometer. Fluorescence spectra were recorded using a Tecan Infinite
                                                                               covalent binding to the collagen fibers.
200PRO microwell plate reader (Tecan Trading AG, Männedorf,
Switzerland). Details on the calculations and the resulting QY values
are provided in SI (Figure S3, Table S1).                                      2.7 Fluorescence imaging

                                                                               1P excited fluorescence imaging was performed on an Olympus IX81
2.4 2PA cross-section                                                          inverted microscope equipped with an X-cite lamp with a maximum
                                                                               output power of 100 W. The excitation light was passed through a
To experimentally determine the 2PA cross-section of the NPs, the              460–495 nm bandpass filter and focused using a 20× objective
method described by Albota et al. [34] was followed, calibrating with          (Olympus LUCPLFLN20XRC NA 0.45). The average power in the focal
respect to fluorescein (aqueous, 0.1 mM, pH 12, 16 GM). A colloidal NP          plane amounted to ∼10 mW. Epi-fluorescence emission was passed
suspension was excited with vertically polarized excitation light              through a 510 nm long-pass filter (510IF) and collected using a
originating from a femtosecond pulsed laser (Insight DS+, Spectra-             Hamamatsu Orca-Flash4.0 V2 sCMOS camera.
Physics) tuned at 900 nm, with an output power of 1.85 W and repe-                  2PF imaging was performed on an upright Olympus BX61 W1
tition rate of 120 fs. The power incident on the sample was tuned using        microscope. The microscope was coupled to a tunable mode-locked
an achromatic half-wave plate. Under an angle of 90°, fluorescence              femtosecond laser (Insight DS, Spectra Physics) with a repetition rate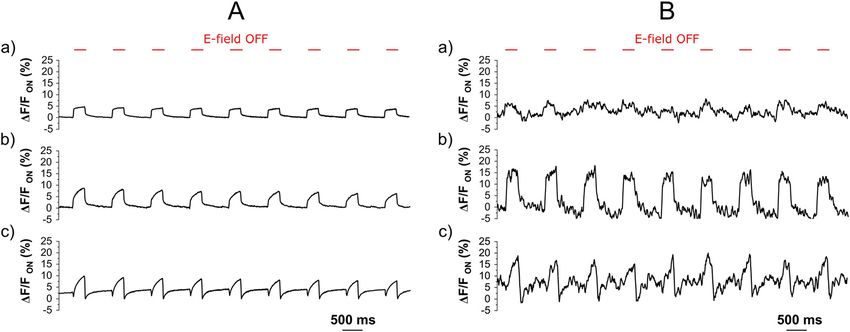
S. Jooken et al.: Enhanced electric field sensitivity   5

of 80 MHz and pulse widths of 120 fs. The laser power in the focal plane   matrix supporting cell viability in the context of bio-
was set to 5–20 mW by combining a polarizer and achromatic half-           imaging cellular electric fields [22]. For each IDE, the
wave plate. The excitation light was focused using a 40× objective
                                                                           electrode separation was carefully determined using AFM
(Nikon, 0.80 NA, 3.5 mm WD). Epi-fluorescence emission was passed
through a 475 nm long-pass filter and collected using Olympus               to account for variations in the electric field applied be-
FV10MP photomultiplier tubes.                                              tween IDEs. Moreover, QD coated fibers located in the gap
     Using a custom-made microscope adapter, PCBs were mounted             do not protrude above the height of the gold structures (SI
upright on the inverted microscope for 1P excited fluorescence and         Figure S5). A typical sample is shown in Figure 1.
upside-down on the upright microscope for 2P excited fluorescence
imaging. The PCBs were connected to an in-house fabricated high
voltage unit supplying DC (direct current) voltages up to 200 V or an
amplified function generator (AFG 302 Tektronix function generator
                                                                           3.1 Steady-state E-field dependence of
and an FLC electronics 20× F20A Voltage amplifier) to generate                  single- and two-photon fluorescence
AC-modulated voltages up to 75 V. For an electrode spacing of 3 µm the
corresponding electric field strengths were 600 and 250 kV/cm,              To determine the steady-state dependence of fluorescence
respectively. These field strengths are the relevant regime for cellular
                                                                           over E-field, an E-field, increased stepwise between 50 and
transmembrane E-fields (in the order of 100 kV/cm).
                                                                           600 kV/cm, was applied. The fluorescence of the nano-
                                                                           particles was recorded for 4 s with the electric field
                                                                           switched ON. Upon removal of the external E-field, the
3 Results and discussion                                                   particles were left to equilibrate for 60 s before applying the
                                                                           next voltage step. After background subtraction, the elec-
All three NP types were water-transferred by encapsulation                 tric field sensitivity was calculated as ΔF/FOFF × 100%
of the native hydrophobic ligands with amphiphilic PSMA.                   where ΔF = FOFF − FON, with FON and FOFF representing the
Additionally, QD6 was transferred by exchanging the                        average fluorescence emission signals over an IDE while
native ligands for MSA, and QD9 was encapsulated with a                    the external electric field was turned ON and OFF,
silica shell which also results in a direct interaction be-                respectively.
tween the silica matrix and the QD surface, involving most                      In Figure 2, the percentual fluorescence decrease (ΔF/
likely an exchange of the native ligands [30]. Details on the              FOFF) is shown as a function of external E-field. The data are
experimental protocols can be found in the Materials and                   grouped per particle, panels a, b and c showing the 1PF and
Methods section and SI. 1P and 2P excited fluorescence                      2PF E-field sensitivities of QD6-PSMA, QD9-PSMA and
emission spectra of the water-transferred NPs are supplied                 QR35-PSMA particles, respectively. For each NP type the
in SI (Figures S2–S4). The 1P QY were determined relative to               data were acquired over several 3 and 5 µm spaced IDEs on
rhodamine 6G and amount to (25 ± 2), (42 ± 6) and (69 ± 5)%                four distinct PCBs, with at least two IDEs per chip. Graphs
for QD6-PSMA, QD9-PSMA and QR35-PSMA, respectively                         showing the experimental data grouped by excitation
(at pH 7.5, 25 °C). Typically, water-transfer greatly reduces              mechanism (1P vs. 2P) are provided in SI (Figure S6). The
the 1P QY due to the interaction of the NP surface with                    effect of different 2P excitation wavelengths on the
water molecules and oxygen. Compared to state-of-the-art                   observed E-field sensitivities was investigated in experi-
phase transfer protocols, the employed polymer encapsu-                    ments at an excitation wavelength of 950 and 1000 nm and
lation protocol guarantees high QY retention in combina-                   has no impact on the results (Figure S7).
tion with a small hydrodynamic size and excellent long-                         The effect of a strong electric field on the QDs fluo-
term stability [26].                                                       rescence (1PF and 2PF) is known to be a combination of the
     The 2PA cross-sections of QD6-PSMA, QD9-PSMA and                      QCSE and QD ionization [10, 35–37]. In the QCSE effect, the
QR35-PSMA, determined by comparing the 2P emission                         reduced overlap of the electron and hole wave functions
spectrum with that of fluorescein, were (24 ± 4) × 102 GM,                 causes a reduction of the radiative decay rate. This results
(7 ± 1) × 103 GM and (22 ± 4) × 104 GM, respectively. Details              in a decrease of the fluorescence that depends quadrati-
on the experimental determination of the quantum effi-                      cally on the applied electric field. In the case of QD ioni-
ciencies and 2PA cross-sections can be found in SI                         zation, one of the photo-excited carriers, either electron or
(Figure S4).                                                               hole, is ejected from the quantum dot (either thermally or
     To measure the electric field sensitivity of the 1PF and              via tunneling) and localized at the QD surface [5]. Photo-
2PF, NP-decorated collagen fibers were deposited on arrays                 excitation of ionized QDs results in a strong quenching of
of gold IDEs – lithographically patterned on glass sub-                    fluorescence, a phenomenon that is known at the single
strates – with spacings of 3 and 5 µm (see Figure 1A).                     particle level as fluorescence intermittency or “blinking”
QD-functionalized collagen may act as an extracellular                     [38–40]. Nevertheless, the electric field decreases the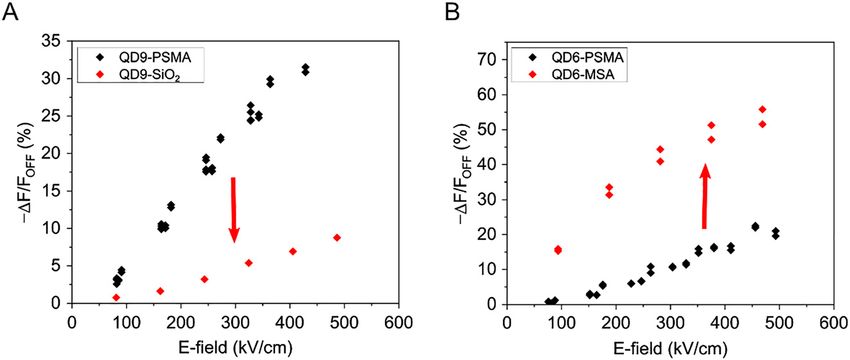
6 S. Jooken et al.: Enhanced electric field sensitivity
Figure 1: A. Illustration of a PCB with a central glass chip containing an array of IDEs with 5 or 3 µm separation. The bright field microscopy
images show both of these electrodes coated with collagen/QD9-PSMA; B. 1PF image of the quasi-type-II QD9-PSMA on a 5 µm spaced IDE with
the E-field switched OFF or ON (600 kV/cm).
Figure 2: Electric field induced decrease of the fluorescence intensity, ΔF/FOFF, under 1P excitation (460–495 nm) in black and 2P excitation
(900 nm) in red for the type-I QD6-PSMA (panel A), the quasi-type-II QD9-PSMA (panel B) and the quasi-type-II QR35-PSMA (panel C). Every
point represents a single measurement. Data are fit with a power low y0 + a.xb. The obtained values for y0, a and b are listed in Table 2.
Table : Fit parameters of the power laws performed on the data presented in Figure , panels a through c.
PF PF
NP y a b y a b
− −
QD-PSMA (. ± .) × (. ± .) ×
QD-PSMA (−. ± .) (. ± .) × − (− ± ) (. ± .) × −
QR-PSMA (. ± .) × − (. ± .) × − S. Jooken et al.: Enhanced electric field sensitivity 7
confinement barriers for electrons and holes and thereby largest for QR35-PSMA ((22 ± 4) × 104 GM), followed by
increases the probability for ionization. As the number of QD9-PSMA ((7 ± 1) × 103 GM) and finally QD6-PSMA
ionized QDs in an ensemble of QDs increases with ((24 ± 4) × 102 GM). The large 2PA cross-sections of semi-
increasing field strength, the population of quenched QDs conductor nanostructures are commonly attributed to
increases, resulting in a decrease of the ensemble fluores- Lorentz local field effect [2, 37, 43], supporting the hy-
cence. After some time, the ejected carrier returns to the pothesis that external E-fields will impact the 2PA cross-
QD, neutrality is restored together with the original fluo- section as well. Alternatively, considering that QD ioniza-
rescence. Experimental studies showed this to occur at tion provides a dominant contribution to the fluorescence
time scales of seconds to tens of seconds [41]. QD ionization quenching, intraband processes of 2P excited charge car-
has been identified as the main contribution to the fluo- riers can further increase nonradiative decay rates [44, 45].
rescence decrease in an externally applied electric field [9]. Single particle spectroscopy experiments are needed to
Previously, it has been shown experimentally on sin- further elucidate the exact mechanism(s) at play.
gle CdSe and core–shell QDs that the contribution of the Next, we briefly studied to what extent the level of
QCSE to the decrease in fluorescence intensity is propor- ionization can be controlled through the choice of the QD
tional to the square of the electric field for field strengths up coating material. For this purpose, we measured the elec-
to 250 kV/cm [10, 42]. Here, we find a quadratic depen- tric field dependence of silica-coated QD9 (QD9-SiO2) and
dence of ΔF/FOFF on the external E-field (see Table 2), mercaptosuccinic acid coated QD6 (QD6-MSA) particles
irrespective of the mode of excitation. For the quasi-type-II under 1P excitation. It is known that the type of ligand
QD9-PSMA, on the other hand, a quadratic curve doesn’t fit (electron-donating, etc.) affects the level of QD ionization
the experimental data well. For field strengths larger than through passivation of existing surface traps [46].
150 kV/cm, Figure 2B displays a linear behavior. This likely Figure 3A shows the relative change in fluorescence in-
indicates a more dominant contribution of QD ionization to tensity of QD9-PSMA (black) and QD9-SiO2 (red). The
the fluorescence quenching at high field strengths [5]. For change in intensity of the silica-coated particles was much
QR35-PSMA, finally, we found a linear dependence for both lower compared to the PSMA-encapsulated particles.
1P excitation and 2P excitation, similar to previous litera- Similarly, the electric field sensitivity of QD6-MSA was
ture reports [5, 10]. Due to the anisotropic shape of the rods, much stronger with respect to the PSMA-encapsulated
the exciton has a net dipole and the QCSE is linear in the variant and displayed saturation behavior at high field
external electric field. For an ensemble of nonoriented strengths that was not observed in any of the
rods, the QCSE could hence result in an increase or PSMA-encapsulated NPs. This suggests that the main
decrease of the PL of a specific NP. This indicates that the contribution to the E-field sensitivity is indeed QD surface
major contribution to the observed intensity change in ionization causing here a deviation from the quadratic
Figure 2C is again NP ionization. NP orientation along the trend.
direction of the E-field would potentially enhance the Thus, the ligand coating of the nanoparticle has a large
quenching even more. effect on the ionization and hence the electric field sensi-
The E-field sensitivity for each type of particle was tivity. For QD9-PSMA at 300 kV/cm, the sensitivity was
consistently larger under 2P excitation compared to 1P (24 ± 2)% while for the same particles with SiO2 surface
excitation. For an E-field of 300 kV/cm, the 1P quantum passivation it was only (5.4 ± 0.5)% (roughly a fivefold
efficiency of the NPs was reduced by (10 ± 1), (20 ± 2) and decrease). For QD6, the MSA-coating resulted in a fivefold
(16 ± 2)% respectively for QD6-PSMA, QD9-PSMA and increase.
QR35-PSMA. Based on the fit in Figure 2, the E-field sensi-
tivity of the fluorescence intensity of QD6-PSMA was a
factor (1.61 ± 0.04) increased under 2P excitation with 3.2 AC E-field fluorescence modulation
respect to 1P excitation. For the quasi-type-II NPs an
enhancement by (1.9 ± 0.2) and (2.5 ± 0.2) was found for We next studied the temporal behavior of the fluorescence
QD9-PSMA and QR35-PSMA, respectively. The mechanism of QD6-PSMA, QD9-PSMA and QR35-PSMA with an applied
behind the enhanced E-field sensitivity is unclear. It is E-field of (300 ± 5) kV/cm. Again, the E-field was switched
possible that the boosted fluorescence decrease under 2P on for 4 s and the 1PF was continuously recorded until the
excitation is due to E-field sensitivity of the 2PA cross- fluorescence emission recovered to its original intensity
section as was previously hypothesized to be the case for (Figure 4).
temperature [21]. The enhancement of the E-field sensitivity For QD6-PSMA and QD9-PSMA, switching the field ON
scaled with the magnitude of the 2PA cross-section, being did not instantly lower the QD’s fluorescence to its8 S. Jooken et al.: Enhanced electric field sensitivity
Figure 3: ΔF/FOFF as a function of electric field
under 1P excitation (460–495 nm) for (A) the
quasi-type-II QD9-PSMA (black) and QD9-
SiO2 (red) and for (B) the type-I QD6-PSMA
(black) and QD6-MSA (red).
minimum level but a clear ON transient was observed. This are trapped in the surface states. A ‘field-induced’ passiv-
ON transient was significantly faster for QD9-PSMA than ation of the trap states in QRs then causes an increase in the
for QD6-PSMA. Similarly, upon switching the external radiative decay rate. For the quasi-type-II QD, QD9-PSMA,
E-field off, an OFF transient was recorded for both NPs. For a small amount of photo-brightening could only be
QR35-PSMA, on the other hand, switching the field ON observed for very large E-fields strengths (>400 kV/cm)
immediately lowered the fluorescence to a minimum fol- (see Figure 4D). This different behavior between QR and QD
lowed by a small recovery phase, i.e. a brightening. We can be explained by the larger surface area of the QRs in
hypothesize that when the E-field is turned on the energy combination with different native ligands (oleic acid for
barriers for surface trap states are reduced and electrons QD9 vs. phosphonic acids for QR35). Photo-brightening
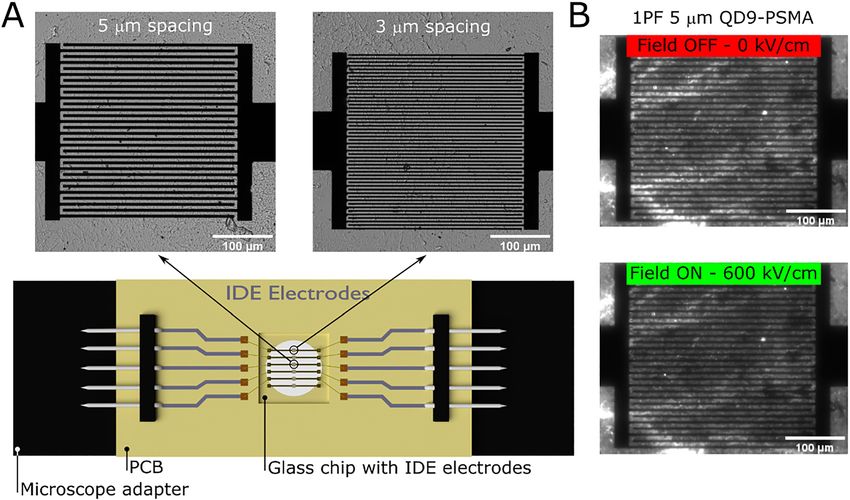
Figure 4: Temporal behavior of the 1P excitation ΔF/FOFF for an applied field of (300 ± 5) kV/cm for (A) the type-I QD6-PSMA, (B) the quasi-type-II
QD9-PSMA and (C) the quasi-type-II QR35-PSMA; (D) ΔF/FOFF transients of the quasi-type-II QD9-PSMA for a range of electric field strengths.S. Jooken et al.: Enhanced electric field sensitivity 9
was not observed for QD6-PSMA, as could be expected for Figures 5 and 6 show the corresponding traces of QD9-
type-I NPs, the outer surface of which is effectively shielded PSMA and QR35-PSMA under 1P and 2P illumination for a
by a ZnS layer. square stimulation wave with a high level of 150 kV/cm,
Upon switching the E-field OFF, again a slow fluo- a low level of 0 kV/cm and a 50% duty cycle. The applied
rescence recovery is recorded, with characteristic time frequencies are 0.5, 1, 2, 5 and 10 Hz with a frame sam-
scales in the seconds to tens of seconds range. The pling rate of 200 Hz (1P) and line scanning frequency of
observed recovery time (see Figure 4D) can be linked to 100 Hz (2P). In order to achieve the required temporal
field-induced defect creation and hence was more resolution in 2P imaging, a single line of approximately
prominent in larger particles and (quasi-)type-II parti- 200 pixels is imaged. This causes the signal-to-noise
cles. This transient behavior is intrinsic to carrier trap- ratio (SNR) in the 2PF traces to be drastically reduced
ping as it is not observed for spectral shifts in response to compared to the 1PF traces. Nevertheless, the fluores-
externally applied E-fields, which occur instantaneously cence traces clearly illustrate that a frequency increase
[7, 10]. The capacitance of the IDE was in the pF range suppressed the slow fluorescence recovery and hence
and can therefore not underlie the observed delay in the decreased ΔF/FOFF. Similar behavior was observed for
fluorescence recovery [47, 48]. QD6-PSMA (Figure S8). The E-field sensitivity ΔF/FOFF as
For transmembrane voltage imaging in living cells, the a function of AC frequency is summarized in Figure 7.
NPs are required to respond to fast switching electrical From 5 Hz onwards the 1P sensitivity stabilizes at
fields with magnitudes up to 150 kV/cm. For car- (1.8 ± 0.6), (5.8 ± 0.2) and (3.4 ± 0.4)% for QD6-PSMA,
diomyocytes, the typical duration of an action potential is QD9-PSMA and QR35-PSMA respectively. For 2P, the
around 200–300 ms, with physiologically relevant beat fluorescence changes are (2.4 ± 0.6), (10.1 ± 0.8) and
frequencies ranging from 0.2 to 3 Hz. Neurons, on the other (7.9 ± 0.5)% for QD6-PSMA, QD9-PSMA and QR35-PSMA.
hand, fire much faster, up to kHz rates in the case of cortical From frequencies above 2 Hz, QD9-PSMAs outperform
neurons. Hence, the slow ON and OFF QD fluorescence QR35-PSMAs as the latter have much slower
transients will clearly limit the E-field sensitivity in cellular OFF-transients. This behavior is particularly relevant for
preparations. biological applications as this OFF transient defines the
To experimentally probe the responses to field reliable detection limit in excitable cells where the
transients, alternating voltages were applied to the IDEs. transmembrane E-field decreases only for short periods
Figure 5: Effect of a frequency modulated E-field with an amplitude of 150 kV/cm on the fluorescence changes of the quasi-type-II QD9-PSMA
under (A) 1P excitation (460–495 nm) and (B) 2P excitation (900 nm) for different frequencies.10 S. Jooken et al.: Enhanced electric field sensitivity
Figure 6: Effect of a frequency modulated E-field with an amplitude of 150 kV/cm on the fluorescence changes of QR35-PSMA under (A) 1P
excitation (460–495 nm) and (B) 2P excitation (900 nm).
Figure 7: (A) ΔF/FOFF as a function of the frequency of the applied electric field for the type-I QD6-PSMA and the quasi-type-II QD9-PSMA under
1P excitation (460–495 nm, black) and 2P excitation (900 nm, red). (B) ΔF/FOFF as a function of the frequency for the quasi-type-II QR35-PSMA at
both locations indicated in the 0.5 Hz–150 kV/cm modulated fluorescence trace shown in panel C.
between successive APs. Nevertheless, changes in 2PF change was calculated as ΔF/FON using the NP fluores-
are consistently larger compared to 1PF for all three NPs cence intensity at −150 kV/cm as baseline.
(see Figure 7). Compared to a 3.3 Hz AC voltage wave, which corre-
sponds to an OFF-level duration of 300 ms, NPs are much
longer under the bias of the −150 kV/cm E-field (the resting
3.3 Simulated cardiac action potential potential) using the 60 bpm protocol. For QD6-PSMA and
QD9-PSMA the fluorescence intensity is stable (over long
The result of an experiment, simulating a 60 bpm train of periods of time and several repetitions) and the fluores-
cardiac action potentials is shown in Figure 8. APs were cence signals follow the transient fields with the expected
simulated by a square wave with a low level of −150 kV/cm, sensitivities. In line-scanning mode (200 pixels, 100 Hz),
corresponding to the resting membrane potential, a high which is necessary to achieve the required temporal reso-
level of 0 kV/cm and 15% duty cycle. The percentual lution, the SNR is drastically decreased (noise levels up toS. Jooken et al.: Enhanced electric field sensitivity 11
Figure 8: Optical response to a simplified 60 bpm cardiac action potential train with a resting potential corresponding to an electric field
of −150 kV/cm and a transient amplitude of the same magnitude of (a) the type-I QD6-PSMA, (b) the quasi-type-II QD9-PSMA and (c) the quasi-
type-II QR35-PSMA under 1P excitation (460–495 nm, panel A) and 2P excitation (900 nm, panel B).
3%), rendering the QD6-PSMA 2PF signal too low to detect response of the fluorescence of PSMA-encapsulated NPs
the E-field transients. The 2PF signal of QD9-PSMA, on the with three different configurations. By carefully controlling
other hand, exhibits the highest SNR in response to tran- the NP shell, we show that the surface coating has an
sient fields. For the QR35-PSMA the observed photo- important role in the E-field sensitivity by controlling the
brightening under E-field switching dominates the extent to which QD ionization contributes to the fluores-
response such that the fluorescence changes do not cence quenching.
follow the E-field profiles well. This is in striking contrast Additionally, we observe a slow E-field OFF recovery
to the 2PF responses to AC modulated fields presented in time, in the order of seconds, that causes a significant
Figures 5 and 6. The change in duty cycle (i.e. from 50% reduction in the sensitivity to AC modulated E-fields
in Figures 5–7 to 15% in Figure 8) clearly favors photo- from frequencies as low as 1 Hz. This slow recovery time
brightening when the E-field is switched ON at the constitutes a major limitation on the applicability of
expense of the (slower) 2PF recovery when the E-field is these NPs for the detection of fast neuronal signals,
briefly switched OFF. where action potentials have a duration of approxi-
mately 2 ms. For monitoring cardiomyocyte activity, on
the other hand, the impact is rather limited as demon-
4 Conclusion and perspectives strated by calibration experiments using a simplified
model for a 60 bpm cardiac action potential train. These
Previous studies on the E-field sensitivity of the fluores- results demonstrate that electrical activity with temporal
cence intensity of type-I and (quasi-)type-II semiconductor patterns in this range can be clearly detected. In this
NPs mainly report 1P data, obtained at various field experiment, the QD9-PSMA particles are found to
strengths and often compare sensitivities at E-fields as perform best with an AP detection sensitivity of about
large as 400 kV/cm. When imaging cell transmembrane (8 ± 1)% under 1P excitation and about double (i.e.
voltages, however, the local E-fields may vary from steady- (14 ± 3)%) under 2P excitation.
state to kHz modulated signals and also various combi- It is important to note, however, that the quasi-type-II
nations of NP types and coatings may be used. Moreover, QRs were not aligned along the direction of the electrical
despite the hypothesized potential and significant research field. Alignment is expected to increase the response
efforts, attempts to incorporate these NPs within cellular significantly and could be attempted to further increase the
membranes and use them for direct monitoring of the sensitivity. Large 2PF changes in response to applied fields
electric activity by 1PF have resulted in measured fluores- indicate that high QY, nonsymmetric structures such as
cence changes below expectations. QRs, might have superior performance as compared to
In this study, we show that the E-field sensitivity is other probe types for imaging cell activity with multi-
greatly enhanced under 2P excitation compared to 1P photon methods given that oriented membrane insertion
excitation. We have characterized in detail the E-field can be achieved.12 S. Jooken et al.: Enhanced electric field sensitivity
All NPs are particularly suitable for imaging biological TOP(O) tri-n-octyl phosphine (oxide)
samples by multiphoton methods due to the inherently
higher spatial and temporal resolution of multiphoton Author contributions: All the authors have accepted
microscopy combined with lower scattering and absorp- responsibility for the entire content of this submitted
tion at longer wavelengths. The SNR of the 2PF response of manuscript and approved submission.
a single line scan, though significantly lower than in the Research funding: S. Jooken acknowledges the financial
presented 1PF traces, is found to be satisfactory for support by the Flanders Research Foundation (FWO) –
detecting QY changes under the influence of a fast strategic basic research doctoral grant 1SC3819N. C. Bartic,
switching E-field. It strengthens our belief that 2PF imaging G. Callewaert and O. Deschaume acknowledge the
could improve future attempts to measure QY changes of financial support by the Flanders Research Foundation
cell membrane inserted NPs, despite the limited collection (FWO grant G0947.17N) and KU Leuven research grants
of potentially E-field responsive pixels. OT/14/084 and C14/18/061. T. Verbiest acknowledges
financial support from the Hercules Foundation, grant
AKUL/11/15.
Abbreviations Conflict of interest statement: The authors declare no
conflicts of interest regarding this article.
1P(F)/2P(F) single-photon (fluorescence)/two-photon (fluorescence)
2PA two-photon absorption cross-section
3D three dimensional
AC alternating current References
AP action potential
AFM atomic force microscopy [1] G. Nagamine, J. O. Rocha, L. G. Bonato, et al., “Two-photon
bpm beats per minute absorption and two-photon-induced gain in Perovskite quantum
DC direct current dots,” J. Phys. Chem. Lett., vol. 9, pp. 3478–3484, 2018.
EDC 1-ethyl-3-(3-dimethylaminopropyl)-carbodiimide [2] R. Scott, A. W. Achtstein, A. Prudnikau, et al., “Two photon
E-field electric field absorption in II–VI semiconductors: the influence of dimensionality
ethNH2 ethanolamine and size,” Nano Lett., vol. 15, pp. 4985–4992, 2015.
GEVI genetically encoded voltage indicator [3] F. Pinaud, S. Clarke, A. Sittner, and M. Dahan, “Probing cellular
GM Goeppert–Mayer events, one quantum dot at a time,” Nat. Methods, vol. 7,
HMDS hexamethyldisilazane pp. 275–285, 2010.
HEK human embryonic kidney [4] Y. R. Kumar, K. Deshmukh, K. K. Sadasivuni, and S. K. K. Pasha,
HEPES 4-(2-hydroxyethyl)-1-piperazineethanesulfonic acid “Graphene quantum dot based materials for sensing, bio-
HPA hexylphosphonic acid imaging and energy storage applications: a review,” RSC Adv.,
IDE interdigitated electrode vol. 10, pp. 23861–23898, 2020.
M600 jeffamine polyetheramine M-600 [5] C. E. Rowland, K. Susumu, M. H. Stewart, et al., “Electric field
MeOH methanol modulation of semiconductor quantum dot photoluminescence:
MSA mercaptosuccinic acid insights into the design of robust voltage-sensitive cellular
NMP 1-methyl-2-pyrrolidone imaging probes,” Nano Lett., vol. 15, pp. 6848–6854, 2015.
NP nanoparticle [6] S. I. Pokutnyi, L. Jacak, J. Misiewicz, W. Salejda, and G. G. Zegrya,
OA oleic acid “Stark effect in semiconductor quantum dots,” J. Appl. Phys., vol.
ODE 1-octadecene 96, pp. 1115–1119, 2004.
ODPA octadecylphosphonic acid [7] O. Bar-Elli, D. Steinitz, G. Yang, et al., “Rapid voltage sensing
PCB printed circuit board with single nanorods via the quantum confined stark effect,” ACS
PEG polyethylene glycol Photonics, vol. 5, pp. 2860–2867, 2018.
PPG polypropylene glycol [8] M. Caglar, R. Pandya, J. Xiao, et al., “All-optical detection of
PSMA poly-styrene-co-maleic anhydride neuronal membrane depolarization in live cells using colloidal
PVP polyvinylpyrrolidone quantum dots,” Nano Lett., vol. 19, pp. 8539–8549, 2019.
QCSE quantum-confined Stark effect [9] A. L. Efros, J. B. Delehanty, A. L. Huston, I. L. Medintz, M. Barbic,
QD/QR quantum dot/quantum rod and T. D. Harris, “Evaluating the potential of using quantum dots
QY quantum yield for monitoring electrical signals in neurons,” Nat. Nanotechnol.,
RF radio frequency vol. 13, pp. 278–288, 2018.
rpm rounds per minute [10] K. Park, Z. Deutsch, J. J. Li, D. Oron, and S. Weiss, “Single
sCMOS scientific Complementary metal-oxide-semiconductor molecule quantum-confined stark effect measurements of
s-NHS sulfo-N-hydroxysulfosuccinimide semiconductor nanoparticles at room temperature,” ACS Nano,
SNR signal-to-noise ratio vol. 6, pp. 10013–10023, 2012.
TEM transmission electron microscopy [11] Y. Kuo, J. Li, X. Michalet, et al., “Characterizing the quantum-
TMAH tetramethylammonium hydroxide pentahydrate confined stark effect in semiconductor quantum dots andS. Jooken et al.: Enhanced electric field sensitivity 13
nanorods for single-molecule electrophysiology,” ACS procedure guided by computational studies,” Langmuir, vol. 24,
Photonics, vol. 5, pp. 4788–4800, 2018. pp. 5270–5276, 2008.
[12] E. Rothenberg, M. Kazes, E. Shaviv, and U. Banin, “Electric field [28] S. Parani, G. Bupesh, E. Manikandan, K. Pandian, and
induced switching of the fluorescence of single semiconductor O. S. Oluwafemi, “Facile synthesis of mercaptosuccinic acid-
quantum rods,” Nano Lett., vol. 5, pp. 1581–1586, 2005. capped CdTe/CdS/ZnS core/double shell quantum dots with
[13] N. N. Hewa-Kasakarage, M. Kirsanova, A. Nemchinov, et al., improved cell viability on different cancer cells and normal
“Radiative recombination of spatially extended excitons in cells,” J. Nanoparticle Res., vol. 18, p. 347, 2016.
(ZnSe/CdS)/CdS heterostructured nanorods,” J. Am. Chem. Soc., [29] T. Aubert, S. J. Soenen, D. Wassmuth, et al., “Bright and stable
vol. 131, pp. 1328–1334, 2009. CdSe/CdS@SiO2 nanoparticles suitable for long-term cell labeling,”
[14] S. A. Empedocles and M. G. Bawendi, “Quantum-confined stark ACS Appl. Mater. Interfaces, vol. 6, pp. 11714–11723, 2014.
effect in single CdSe nanocrystallite quantum dots,” Science [30] A. Biermann, T. Aubert, P. Baumeister, E. Drijvers, Z. Hens, and
(80-), vol. 278, pp. 2114–2117, 1997. J. Maultzsch, “Interface formation during silica encapsulation of
[15] O. K. Nag, M. E. Muroski, D. A. Hastman, et al., “Nanoparticle- colloidal CdSe/CdS quantum dots observed by in situ Raman
mediated visualization and control of cellular membrane spectroscopy,” J. Chem. Phys., vol. 146, p. 134708, 2017.
potential: strategies, progress, and remaining issues,” ACS [31] E. Drijvers, J. Liu, A. Harizaj, et al., “Efficient endocytosis of
Nano, vol. 14, pp. 2659–2677, 2020. inorganic nanoparticles with zwitterionic surface
[16] O. K. Nag, M. H. Stewart, J. R. Deschamps, et al., “Quantum dot– functionalization,” ACS Appl. Mater. Interfaces, vol. 11,
peptide–fullerene bioconjugates for visualization of in vitro and pp. 38475–38482, 2019.
in vivo cellular membrane potential,” ACS Nano, vol. 11, [32] D. Magde, R. Wong, and P. G. Seybold, “Fluorescence quantum
pp. 5598–5613, 2017. yields and their relation to lifetimes of rhodamine 6G and fluorescein
[17] G. Chen, Y. Zhang, Z. Peng, D. Huang, C. Li, and Q. Wang, in nine solvents: improved absolute standards for quantum yields,”
“Glutathione-capped quantum dots for plasma membrane Photochem. Photobiol., vol. 75, pp. 327–334, 2007.
labeling and membrane potential imaging,” Nano Res., vol. 12, [33] C. Würth, M. Grabolle, J. Pauli, M. Spieles, and U. Resch-Genger,
pp. 1321–1326, 2019. “Relative and absolute determination of fluorescence quantum
[18] K. Park, Y. Kuo, V. Shvadchak, et al., “Membrane insertion of— yields of transparent samples,” Nat. Protoc., vol. 8, pp. 1535–
and membrane potential sensing by—semiconductor voltage 1550, 2013.
nanosensors: feasibility demonstration,” Sci. Adv., vol. 4, [34] M. A. Albota, C. Xu, and W. W. Webb, “Two-photon fluorescence
p. e1601453, 2018. excitation cross sections of biomolecular probes from 690 to
[19] J. Park, Y. Kuo, J. Li, Y.-L. Huang, E. W. Miller, and S. Weiss, 960 nm,” Appl. Opt., vol. 37, p. 7352, 1998.
“Improved surface functionalization and characterization of [35] G. W. Wen, J. Y. Lin, H. X. Jiang, and Z. Chen, “Quantum-confined
membrane-targeted semiconductor voltage nanosensors,” J. Stark effects in semiconductor quantum dots,” Phys. Rev. B, vol.
Phys. Chem. Lett., vol. 10, pp. 3906–3913, 2019. 52, pp. 5913–5922, 1995.
[20] A. Ludwig, P. Serna, L. Morgenstein, et al., “Development of [36] J. Seufert, M. Obert, M. Scheibner, et al., “Stark effect and
lipid-coated semiconductor nanosensors for recording of polarizability in a single CdSe/ZnSe quantum dot,” Appl. Phys.
membrane potential in neurons,” ACS Photonics, vol. 7, Lett., vol. 79, pp. 1033–1035, 2001.
pp. 1141–1152, 2020. [37] B. Zhu, F. Wang, C. Liao, et al., “Size confinement and origins of
[21] L. M. Maestro, E. M. Rodríguez, F. S. Rodríguez, et al., “CdSe two-photon absorption and refraction in CdSe quantum dots,”
quantum dots for two-photon fluorescence thermal imaging,” Opt. Express, vol. 27, p. 1777, 2019.
Nano Lett., vol. 10, pp. 5109–5115, 2010. [38] J. J. Peterson and D. J. Nesbitt, “Modified power law behavior in
[22] S. Jooken, Y. De Coene, O. Deschaume, et al., “Quantum dot- quantum dot blinking: a novel role for biexcitons and auger
functionalized extracellular matrices for in situ monitoring of ionization,” Nano Lett., vol. 9, pp. 338–345, 2009.
cardiomyocyte activity,” ACS Appl. Nano Mater., vol. 3, pp. 6118– [39] G. Yuan, D. E. Gómez, N. Kirkwood, K. Boldt, and P. Mulvaney,
6126, 2020. “Two mechanisms determine quantum dot blinking,” ACS Nano,
[23] M. Cirillo, T. Aubert, R. Gomes, et al., “‘Flash’ synthesis of CdSe/ vol. 12, pp. 3397–3405, 2018.
CdS core–shell quantum dots,” Chem. Mater., vol. 26, pp. 1154– [40] A. L. Efros and D. J. Nesbitt, “Origin and control of blinking in
1160, 2014. quantum dots,” Nat. Nanotechnol., vol. 11, pp. 661–671, 2016.
[24] E. Drijvers, J. De Roo, P. Geiregat, K. Fehér, Z. Hens, and T. Aubert, [41] P. Lochner, A. Kurzmann, J. Kerski, et al., “Real-time detection of
“Revisited Wurtzite CdSe synthesis: a gateway for the versatile single auger recombination events in a self-assembled quantum
flash synthesis of multishell quantum dots and rods,” Chem. dot,” Nano Lett., vol. 20, pp. 1631–1636, 2020.
Mater., vol. 28, pp. 7311–7323, 2016. [42] L. I. Gurinovich, A. A. Lutich, A. P. Stupak, et al., “Luminescence
[25] L. Carbone, C. Nobile, M. De Giorgi, et al., “Synthesis and in quantum-confined cadmium selenide nanocrystals and
micrometer-scale assembly of colloidal CdSe/CdS nanorods nanorods in external electric fields,” Semiconductors, vol. 43,
prepared by a seeded growth approach,” Nano Lett., vol. 7, pp. 1008–1016, 2009.
pp. 2942–2950, 2007. [43] X. Hu, Y. Zhang, D. Guzun, et al., “Photoluminescence of InAs/
[26] E. E. Lees, T.-L. Nguyen, A. H. A. Clayton, and P. Mulvaney, “The GaAs quantum dots under direct two-photon excitation,” Sci.
preparation of colloidally stable, water-soluble, biocompatible, Rep., vol. 10, p. 10930, 2020.
semiconductor nanocrystals with a small hydrodynamic [44] Y. Qu, W. Ji, Y. Zheng, and J. Y. Ying, “Auger recombination and
diameter,” ACS Nano, vol. 3, pp. 1121–1128, 2009. intraband absorption of two-photon-excited carriers in colloidal
[27] B. Pong, B. L. Trout, and J. Lee, “Modified ligand-exchange for CdSe quantum dots,” Appl. Phys. Lett., 2007, https://doi.org/
efficient solubilization of CdSe/ZnS quantum dots in water: a 10.1063/1.2716067.14 S. Jooken et al.: Enhanced electric field sensitivity
[45] F. T. Rabouw, R. Vaxenburg, A. A. Bakulin, et al., “Dynamics of of interdigital nanocapacitors coated with HfO2,” Sensors, vol.
intraband and interband auger processes in colloidal core–shell 15, pp. 1998–2005, 2015.
quantum dots,” ACS Nano, vol. 9, pp. 10366–10367, 2015. [48] R. Igreja and C. J. Dias, “Analytical evaluation of the interdigital
[46] S. J. Lim, L. Ma, A. Schleife, and A. M. Smith, “Quantum dot electrodes capacitance for a multi-layered structure,” Sens.
surface engineering: toward inert fluorophores with compact Actuators A Phys., vol. 112, pp. 291–301, 2004.
size and bright, stable emission,” Coord. Chem. Rev., vols. 320–
321, pp. 216–237, 2016.
[47] G. González, E. Kolosovas-Machuca, E. López-Luna, Supplementary Material: The online version of this article offers sup-
H. Hernández-Arriaga, and F. González, “Design and fabrication plementary material (https://doi.org/10.1515/nanoph-2021-0077).You can also read