A comprehensive rat transcriptome built from large scale RNA-seq-based annotation
←
→
Page content transcription
If your browser does not render page correctly, please read the page content below
8320–8331 Nucleic Acids Research, 2020, Vol. 48, No. 15                                                                   Published online 4 August 2020
doi: 10.1093/nar/gkaa638

A comprehensive rat transcriptome built from large
scale RNA-seq-based annotation
Xiangjun Ji 1,2 , Peng Li1,3 , James C. Fuscoe4 , Geng Chen 1 , Wenzhong Xiao3 ,
Leming Shi5 , Baitang Ning4 , Zhichao Liu4 , Huixiao Hong4 , Jun Wu1 , Jinghua Liu2 , Lei Guo4 ,
David P. Kreil6 , Paweł P. Łabaj6,7 , Liping Zhong8 , Wenjun Bao9 , Yong Huang8 , Jian He8 ,
Yongxiang Zhao8,* , Weida Tong4,* and Tieliu Shi1,10,*
1
  Center for Bioinformatics and Computational Biology, Institute of Biomedical Sciences and School of Life Sciences,

                                                                                                                                                              Downloaded from https://academic.oup.com/nar/article/48/15/8320/5880465 by guest on 02 November 2020
East China Normal University, Shanghai 200241, China, 2 School of Basic Medical Sciences, Southern Medical
University, Guangzhou, 510515, China, 3 Massachusetts General Hospital, Harvard Medical School, 51 Blossom St,
Boston, MA 02114, USA, 4 National Center for Toxicological Research, Food and Drug Administration, Jefferson, AR,
72079, USA, 5 Center for Pharmacogenomics, School of Pharmacy, Fudan University, Shanghai, 200438, China,
6
  Department of Biotechnology, Boku University Vienna, 1190 Muthgasse 18, Austria, 7 Małopolska Centre of
Biotechnology, Jagiellonian University, ul. Gronostajowa 7A, 30-387 Kraków, Poland, 8 Biological Targeting Diagnosis
and Therapy Research Center, Guangxi Medical University, Nanning 530021, China, 9 SAS Institute Inc., Cary, NC,
27513, USA and 10 Beijing Advanced Innovation Center for Big Data-Based Precision Medicine, Beihang University &
Capital Medical University, Beijing, 100083, China

Received November 24, 2019; Revised July 14, 2020; Editorial Decision July 19, 2020; Accepted July 21, 2020

ABSTRACT                                                                            INTRODUCTION
The rat is an important model organism in biomedical                                The rat (Rattus norvegicus) is utilized extensively as an an-
research for studying human disease mechanisms                                      imal model for studying human disease mechanisms and
and treatments, but its annotated transcriptome is                                  treatments. As an example, for toxicological studies, Gene
far from complete. We constructed a Rat Transcrip-                                  Expression Omnibus (GEO) (1,2) currently hosts 1964
                                                                                    datasets using the rat model, the most among all species, fol-
tome Re-annotation named RTR using RNA-seq data
                                                                                    lowed by 1323 datasets for human. However, despite efforts
from 320 samples in 11 different organs generated by
                                                                                    to improve the annotation of the rat transcriptome based
the SEQC consortium. Totally, there are 52 807 genes                                on cDNA and EST sequences, our knowledge on the tran-
and 114 152 transcripts in RTR. Transcribed regions                                 scriptome of rat is far from complete when compared with
and exons in RTR account for ∼42% and ∼6.5% of                                      that of human and mouse.
the genome, respectively. Of all 73 074 newly anno-                                    RNA-seq technology enables an unbiased and in-depth
tated transcripts in RTR, 34 213 were annotated as                                  analysis of the genome and transcriptome (3). Studies based
high confident coding transcripts and 24 728 as high                                on RNA-seq have revealed the complexity of the transcrip-
confident long noncoding transcripts. Different tis-                                tomes of eukaryotes (4,5) and have shown that many tran-
sues rather than different stages have a significant                                scripts have escaped our observation. Examples include:
influence on the expression patterns of transcripts.                                much of the genome is transcribed, including the regions
                                                                                    that were previously considered as junk DNAs; novel splice
We also found that 11 715 genes and 15 852 tran-
                                                                                    junctions were detected, demonstrating distinct splice sites
scripts were expressed in all 11 tissues and that 849
                                                                                    and intricate patterns of alternatively spliced RNAs that
house-keeping genes expressed different isoforms                                    may play important roles in the regulation and expression
among tissues. This comprehensive transcriptome                                     of the complex eukaryotic genome (5,6); most multi-exon
is freely available at http://www.unimd.org/rtr/. Our                               genes are shown to have multiple alternatively spliced iso-
new rat transcriptome provides essential reference                                  forms with different coding potentials.
for genetics and gene expression studies in rat dis-                                   Nowadays, RNA-seq provides direct RNA level re-
ease and toxicity models.                                                           sources for comprehensive transcriptome annotation with

* To
   whom correspondence should be addressed. Tel: +86 21 54345020; Fax: +86 21 54345020; Email: tlshi@bio.ecnu.edu.cn
Correspondence may also be addressed to Weida Tong. Tel: +1 870 5437142; Fax: +1 870 5437142; Email: Weida.Tong@fda.hhs.gov
Correspondence may also be addressed to Yongxiang Zhao. Tel: +86 771 5350964; Fax: +86 771 5352775; Email: yongxiang zhao@126.com
Disclaimer: The findings and conclusions in this report are those of the authors and do not necessarily represent the views of the FDA.


C The Author(s) 2020. Published by Oxford University Press on behalf of Nucleic Acids Research.
This is an Open Access article distributed under the terms of the Creative Commons Attribution License (http://creativecommons.org/licenses/by/4.0/), which
permits unrestricted reuse, distribution, and reproduction in any medium, provided the original work is properly cited.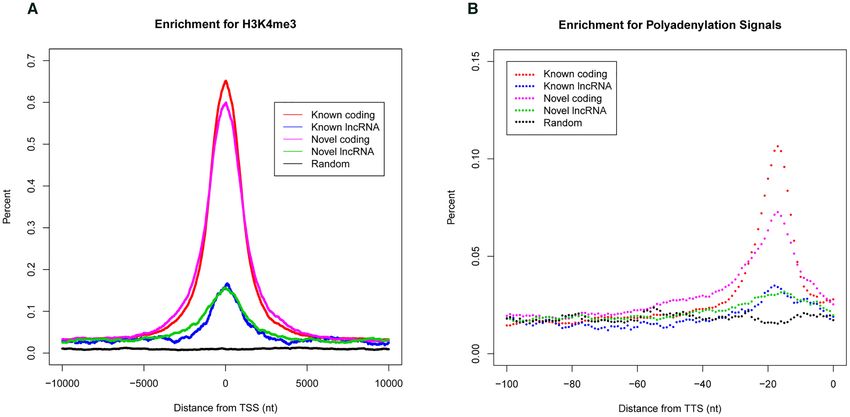
Nucleic Acids Research, 2020, Vol. 48, No. 15 8321

high sequencing depth and different types of samples             reads were assembled using two methods, Stringtie (23) and
and thus has been integrated into traditional annotation         QuaPra (24), respectively. Post this initial assembly, we used
pipelines including Ensembl (7), ENCODE (8) and PASA             Cuffcompare in Cufflinks suite to acquire common multi-
(9,10). For example, the transcriptomes of zebrafish, human      exon transcripts in at least two biological replicates with
and fission yeast released by Ensembl, ENCODE (11), Ace-         FPKM > 1 in the same condition. If a novel multi-exon
View (12) and Broad Institute (13), respectively, have been      transcript found in only one replicate covers all the introns
re-annotated with RNA-seq analysis.                              of another novel transcript which was found in at least two
   Nevertheless, it is still challenging to construct a com-     biological replicates with FPKM > 1 in the same strand,
prehensive transcriptome in the context of current RNA-          then the former transcript which obtained more exons was
seq data quality and computational methods. Generally,           retained and the latter one was abandoned. A mono-exon
transcriptome reconstruction strategies with RNA-seq data        transcript was defined as the one that the transcript should
fall into two categories, genome-independent and genome-         be detected in all four biological replicates with FPKM >
guided. Genome-independent methods are preferred when            1 and then the leftmost 5 end and rightmost 3 end of

                                                                                                                                   Downloaded from https://academic.oup.com/nar/article/48/15/8320/5880465 by guest on 02 November 2020
the target organisms do not have a complete reference se-        these copies from four biological replicates are the bound-
quence, whereas genome-guided approaches, with their in-         ary of the transcript. To obtain a tissue-specific transcrip-
creased sensitivity in detecting transcripts, are used for an-   tome, the common transcripts in all four biological repli-
notating organisms with a reference genome (14,15). In           cates from the same condition were merged using Stringtie-
addition, various pipelines and softwares have been pub-         merge and only transcripts longer than 200 bp were re-
lished for transcriptome reconstruction, but they have lim-      tained. The common transcripts in all conditions were then
ited compatibility (16), with notable inconsistencies of re-     merged using Stringtie-merge. The two transcriptomes de-
sults. Hence, only a few software tools, data resources or       rived by Stringtie and QuaPra were merged again. We then
analysis results based on large-scale RNA-seq technology         combined transcripts which were derived in the previous
are available for reusing in rat transcriptome analysis.         step with all the transcripts in Ensembl and RefSeq to-
   To generate a rat transcriptome with high resolution, we      gether into RTR. The performance of Stringtie and QuaPra
analyzed the rat BodyMap RNA-seq data generated by the           are shown in Supplementary Figure S4, which indicates the
SEQC consortium that consists of 320 deep-sequenced sam-         consistency and complementarity between the two assem-
ples (>40 M reads per sample) from 11 different tissues          blers.
(17,18). By carefully tuning the reconstruction pipeline, we
obtained a relatively complete and reliable set of rat tran-     Selection of newly annotated coding and noncoding tran-
scripts that was used to create a re-annotated transcriptome     scripts with high confidence
database and functional annotations comparable to that of
the well-annotated mouse transcriptome. We confirmed the         In RTR, we predicted the transcript coding ability by incor-
accuracy and reliability of RTR by comparing five other          porating three methods together: (i) CPAT (25), (ii) Pfam
datasets derived from the same organs in RTR.                    (26) and (iii) BLASTx (27). A newly annotated transcript
                                                                 in RTR was defined as a coding transcript with high confi-
                                                                 dence which simultaneously had a coding score greater than
MATERIALS AND METHODS                                            the cutoff in CPAT, had at least one Pfam domain and had
                                                                 high similarity with at least one known protein in all organ-
Data source                                                      isms in UniProtKB/Swiss-Prot where the similarity was es-
The RNA-seq data were obtained from the rat RNA-seq              timated by BLASTx (e-value < 1e-5). Similarly, if a newly
transcriptomic BodyMap across 11 tissues, 4 developmen-          annotated transcript failed all of the three tests, it was then
tal stages and both sexes generated by the SEQC consor-          considered as a noncoding transcript with high confidence.
tium (R. norvegicus, strain: F344; GEO dataset: GSE53960)
(17). Samples were prepared by Ribo-zero protocol. There         Evidence for active regulation of transcriptional start sites
are four biological replicates in each condition, i.e. sam-
ples sharing the same organ, the same development and the        To conduct analysis of transcription start site (TSS) inter-
same sex. All of the datasets used for checking the precision    vals, we downloaded the H3K4me3 ChIP-seq peak enrich-
of RTR were downloaded from the Sequence Read Archive            ment file (BED format) for the male liver at 9 weeks in rat
(SRA) at NCBI (https://www.ncbi.nlm.nih.gov/sra) (Sup-           (28). Intervals of ± 10 kb surrounding unique TSSs of tran-
plementary Tables S1 and 15) (19). The gene annotations          scripts in Ensembl and the newly assembled transcripts with
of Rnor6 were obtained from the Ensembl database (ver-           high confidence were generated using the BEDTools slop
sion 97) (7), RGD (20), RefSeq (version 95) (21). The            tool (29). To control for expression, TSSs were filtered to
gene annotation of GRCh38/hg38 was obtained from the             remove transcripts not expressed in male liver at 6 weeks in
Ensembl database (version 97). The gene annotation of            rat (FPKM < 0.5). Base-wise peak coverage was generated
GRCm38/mm10 was obtained from the Ensembl database               using the BEDTools coverage function and summed per-
(version 97).                                                    base coverage histogram was normalized by dividing by the
                                                                 number of expressed TSSs.

RNA-seq read alignment and transcript assembly pipeline          Identification of conserved splice junctions of RTR in human
                                                                 and mouse
The pipeline is depicted as a flowchart in Supplementary
Figure S3. All RNA-seq short reads were first aligned to         Only transcripts with splice junctions were aligned. We used
rat reference genome (rnor6) by HISAT2 (22). The aligned         Needle in EMBOSS (30) to align the fragments close to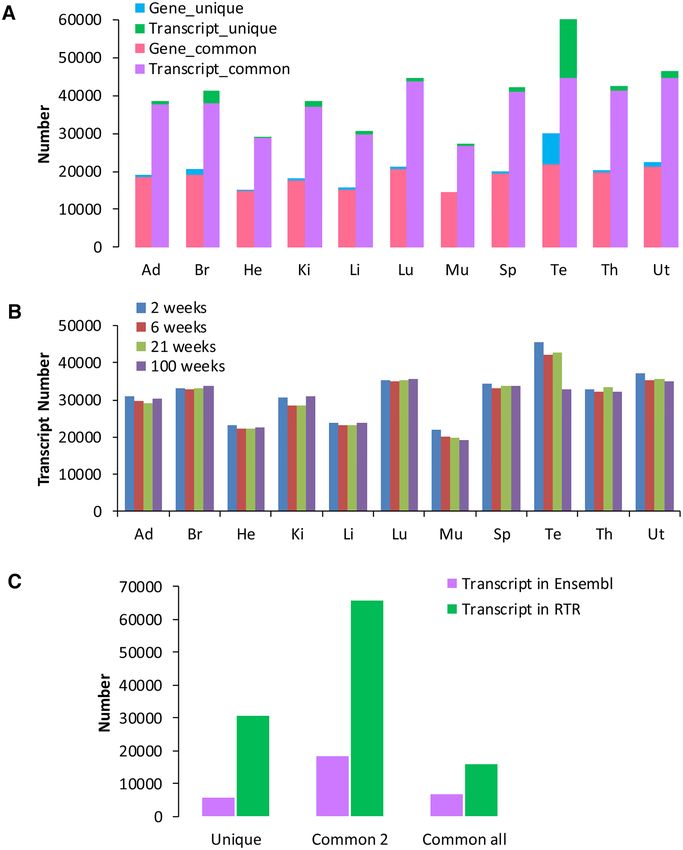
8322 Nucleic Acids Research, 2020, Vol. 48, No. 15

novel junctions in coding transcripts with high confidence        databases (Table 1, http://119.3.41.228:8888/static/RTR.gtf.
in rat to the fragments close to the junctions in the corre-      gz).
sponding homologous genes in human and mouse, respec-                By incorporating the publicly available data resources
tively (a region encompassing the nucleotides −6 to +6 rel-       (Ensembl (7), RefSeq (21)) with our RNA-seq data, we
ative to the splice junction was considered as ‘close’). Align-   found that ∼42% of genomic regions were transcribed and
ments were rejected in three cases: (i) there was more than       ∼6.5% of genomic regions were identified as exon regions
one gap occurring close to the splice junction; (ii) when the     in the resulting RTR transcriptome. Although the length
junction in the transcript in human or mouse was not in           of transcribed regions in RTR is only slightly longer than
the coding region, we used nucleotide alignment mode and          that in RGD (https://rgd.mcw.edu/) which previously was
matches with nucleotide identity
Nucleic Acids Research, 2020, Vol. 48, No. 15 8323

Table 1. Summary of four rat transcriptome datasets (RTR, RGD, rat in RefSeq (version 95), Rat Ensembl release (version 97)) and Mouse Ensembl
release (version 97)
                                     RTR                   RGD               Rat in RefSeq         Rat Ensembl v97        Mouse Ensembl v97
Total number(G/T)               52 807/114 152         41 293/71 746         17 347/19 005          32 883/41 078           55 573/142 333
Transcribed region (bases)       1 210 629 410         1 146 889 108          745 274 636            866 345 921             1 166 497 934
Transcribed region ratio             0.422                 0.400                 0.260                  0.302                    0.427
Exon number                         383 460               294 311               166 150                240 383                  413 177
Exon region (bases)               189 460 026           93 815 592            39 838 763              56 335 223              116 671 536
Exon region ratio                    0.066                 0.032                 0.014                  0.020                    0.043

G genes; T transcripts.

013 transcripts of which belong to 14 185 genes in Ensembl.              Gene coding ability and function prediction

                                                                                                                                                 Downloaded from https://academic.oup.com/nar/article/48/15/8320/5880465 by guest on 02 November 2020
As a result, the ratio of transcripts belonging to genes in
                                                                         Since current annotations of rat proteins include only 7989
Ensembl to the genes themselves increases from the origi-
                                                                         proteins in UniProtKB/Swiss-Prot and 27 902 proteins in
nal 1.30 to 2.71 in RTR. There are 19 924 newly annotated
                                                                         UniProtKB/TrEMBL (42), we further predicted the po-
genes in RTR, and the ratio of transcripts in newly anno-
                                                                         tential coding ability of the newly annotated transcripts
tated genes to the newly annotated genes themselves is 1.26,
                                                                         in RTR. Of all the 73 074 newly annotated transcripts,
which is comparable to the one in the known annotation in
                                                                         34 213 and 24 728 were considered as highly confident
Ensembl (1.25).
                                                                         coding transcripts and long noncoding transcripts, respec-
   As shown in Figure 1A, 34.3% of rat genes in RTR have
                                                                         tively (See ‘Materials and Methods’ section and Supple-
more than one isoform (multi-isoform genes), which is at an
                                                                         mentary Tables S3 and 4). The 34 213 coding transcripts
equivalent level to that of Mouse Ensembl release (version
                                                                         belong to 11 042 genes and these genes all have orthologs
97), while in Ensembl only 15.4% of rat genes have more
                                                                         in other species. Among the newly annotated transcripts
than one isoform. In addition, rat multi-isoform genes in
                                                                         with high confidence in this study, 791 coding transcripts
RTR have 4.39 isoforms on average, which is at an equiv-
                                                                         were located in 564 newly annotated genes while 21 301
alent level to that of the mouse annotation of Ensembl
                                                                         long noncoding transcripts were located in 17 913 newly
(4.45), while in Ensembl rat multi-isoform genes have only
                                                                         annotated genes. Interestingly, 39 newly annotated genes
2.41 isoforms in average. Furthermore, the percent of rat
                                                                         possess both coding and long noncoding transcripts with
genes with at least three isoforms in RTR (22.1%) is over six
                                                                         high confidence, similar to the 231 known genes with this
times as large as the one in Rat Ensembl release (version 97)
                                                                         property in Ensembl. Genes such as SRA (43) and VegT
(3.5%).
                                                                         (44) have both coding and noncoding transcripts which
   We further used ASTALAVISTA (38) to characterize
                                                                         indicates a gene may possess versatile functions (45). A
these alternative splicing (AS) events into seven different
                                                                         published RT-PCR experiment confirmed three multi-exon
categories: intron retention (IR), skipped exon (SE), al-
                                                                         lncRNAs in rat (Supplementary Figure S3D in (28)), two
ternative 5 donor site (A5SS), alternative 3 acceptor site
                                                                         of which (rnor lincRNA13804051, rnor lincRNA4244571)
(A3SS), alternative first exon, alternative last exon and mu-
                                                                         are verified as lncRNAs with high confidence in RTR
tually exclusive exons (MXE). The distribution of different
                                                                         (RTRG.42653.1 and RTRG.13897.2, respectively); another
AS events is similar between RTR (Figure 1B) and Ensembl
                                                                         multi-exon lncRNA (rnor lincRNA4825071) has earlier
(Supplementary Figure S1) with SE, the dominant mode of
                                                                         been added to Ensembl (ENSRNOT00000085828).
AS (39), being more prevalent in RTR than Ensembl. Re-
                                                                            To further corroborate active transcription of the newly
tained intron splicing events accounted for only 16.62% of
                                                                         annotated transcripts with high confidence, we intersected
all AS events in RTR which suggests that RTR is not likely
                                                                         intervals surrounding the TSSs of expressed transcripts in
affected by the incomplete splicing of pre-mRNA.
                                                                         male liver at 6 weeks in RTR with the ChIP-seq open source
   Splicing factors (SFs), which are RNA binding proteins
                                                                         data for histone 3 lysine 4 trimethylation (H3K4me3) ac-
that play key roles in AS regulation, often drive widespread
                                                                         quired from male liver at 9 weeks in rat (See ‘Materials
differences in AS patterns across different tissues through
                                                                         and Methods’ section and Figure 2A) (28). For comparison,
tissue- and cell-type-specific expression (40). Therefore, we
                                                                         transcripts were classified into four categories: (i) known
further explored those SFs in rat to understand the mech-
                                                                         coding transcripts in Ensembl; (ii) known lncRNAs in En-
anisms of various splicing events. By homology mapping
                                                                         sembl; (iii) novel coding transcripts with high confidence;
to human SFs (41), we identified 84 SF genes expressed in
                                                                         and (iv) novel lncRNAs with high confidence. Maximal en-
rat (Supplementary Table S2). Interestingly, Esrp2 shows
                                                                         richment of H3K4me3 histone modification at the TSSs of
higher expression levels in liver, lung and kidney while
                                                                         the newly assembled transcripts with high confidence but
it has very low expression levels in thymus and uterus;
                                                                         not at randomly shuffled control regions suggests that these
Elavl2 shows obvious tissue specificity, which is highly ex-
                                                                         transcripts possess actively regulated promoters.
pressed in brain at all development stages while having very
                                                                            To support the accuracy of 3 end of the newly annotated
low expression in other tissues (Supplementary Figure S2).
                                                                         transcripts with high confidence, we intersected intervals in
These tissue-specific expression patterns of different SFs
                                                                         the upstream 100 bp of the transcription termination sites
potentially contribute to the tissue-specific regulation of AS
                                                                         (TTSs) of all newly annotated transcripts with high confi-
events in rat.
                                                                         dence in RTR with the hexamer polyA signals (AATAAA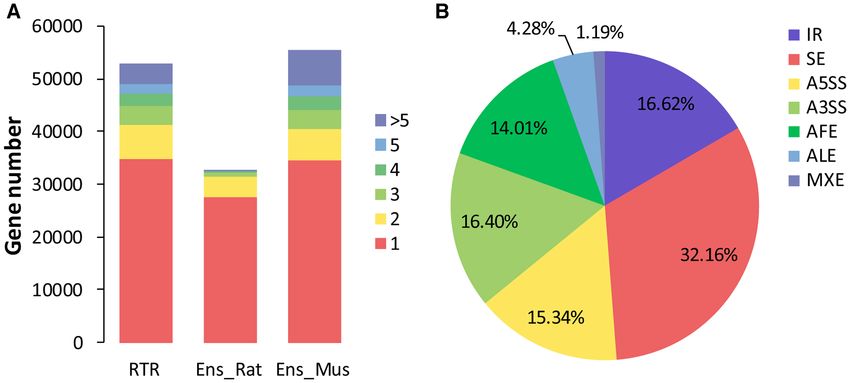
8324 Nucleic Acids Research, 2020, Vol. 48, No. 15
Downloaded from https://academic.oup.com/nar/article/48/15/8320/5880465 by guest on 02 November 2020
Figure 1. (A) The number of genes with different isoforms. Each block in a bar corresponds to the number of genes with multiple isoforms. Three tran-
scriptomes were compared, from left to right: RTR, Rat Ensembl release and Mouse Ensembl release. (B) The distribution of AS events in RTR.
Figure 2. TSS and TTS characterization in RTR. (A) ChIP-seq data enrichment for H3K4me3 from male liver at 9 weeks at 10-kb intervals surrounding
expressed TSSs (FPKM > 0.5) in male liver at 6 weeks in RTR. (B) Hexamer polyA signal (AATAAA, ATTAAA) enrichment in the upstream 100 bp of
TTSs in RTR.
and ATTAAA) (Figure 2B) (46). Transcripts were classified protein result supports the premise that the newly annotated
into four categories for comparison as stated above. Max- transcripts identified in RTR actually code for proteins.
imal enrichment of the hexamer polyA signals upstream There are 81 newly annotated genes encoding newly anno-
from the TTSs of the newly assembled transcripts with high tated proteins not appearing in known rat annotations but
confidence but not at randomly shuffled control regions with unambiguous BLASTx hits in human or mouse (Sup-
suggests that these transcripts possess actively polyadeny- plementary Table S5). The novel coding transcripts with
lation sites. high confidence were then annotated with GO terms using
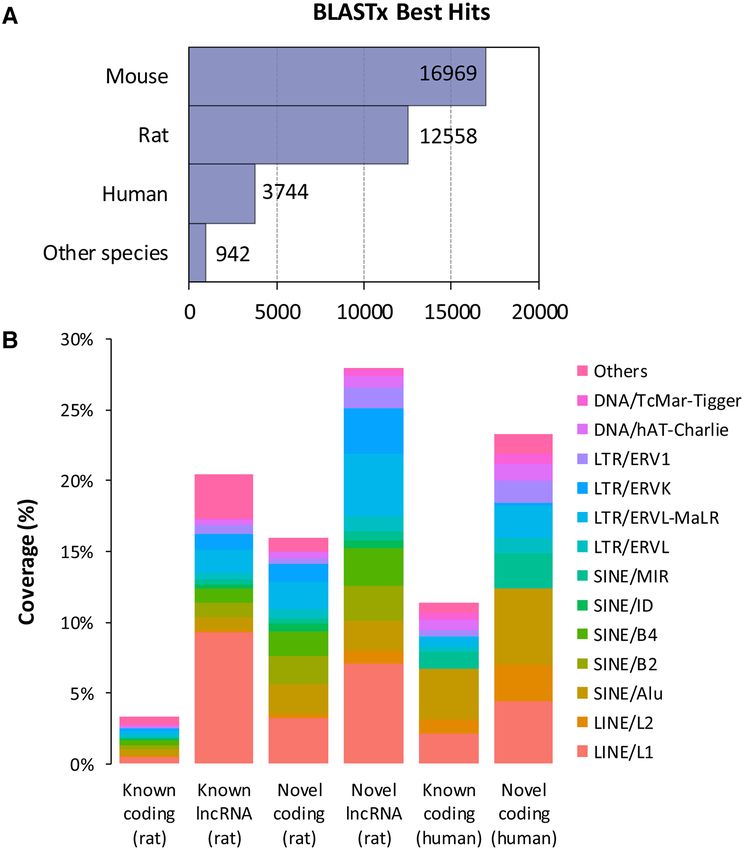
The 34 213 newly annotated coding transcripts with high Blast2GO suite and 33 589 of them were found associated
confidence were aligned to known proteins in all organ- with GO terms (Supplementary Table S6).
isms in UniProtKB/Swiss-Prot (27) with BLASTx and we We further checked the cross-species conservation of 34
only retained the best hits (See ‘Materials and Methods’ 082 newly annotated junctions in the novel coding tran-
section). Because of the relative paucity of rat proteins in scripts with high confidence; long noncoding RNAs (such
the databases used by BLASTx, ∼60% of the best hits were as Air and Xist) were not examined because of lack of strong
proteins from mouse and human instead of rat (Figure 3A conservation (47). A total of 32 571 of 34 082 junctions
and Supplementary Table S3). This cross-species transcript- belong to genes with homologous genes in human and 32Nucleic Acids Research, 2020, Vol. 48, No. 15 8325
Downloaded from https://academic.oup.com/nar/article/48/15/8320/5880465 by guest on 02 November 2020
Figure 3. Cross-species feature comparision of transcripts with high confidence in RTR. (A) The species distribution of the best BLASTx hits of newly
annotated coding transcripts with high confidence in RTR. (B) Repetitive content analysis between RTR and human in Ensembl. Sequence-based overlap
between exons and TEs was calculated.
212 of them belong to the genes with homologous genes in ports (51–53). To determine whether such increase in RTR
mouse. We then aligned the 32 571 and 32 212 junctions is due to the low annotation level of Ensembl in rat, we fig-
in rat to all the junctions in the corresponding homologous ured out that repetitive elements accounted for 11.4% of
genes in human and mouse, respectively. We found 41.1 and exonic nucleotides of lncRNAs and 23.3% of exonic nu-
49.2% of them were conserved in human and mouse, re- cleotides of coding transcripts in Ensembl in human, which
spectively (See ‘Materials and Methods’ section and Sup- are quite close to the counterparts in RTR.
plementary Tables S7 and 8).
Expression patterns among different tissues and stages
Role of transposable elements in RTR
We used alignment files (BAM format) acquired from 320
TEs, also known as repetitive DNA sequences, are spread samples to run Stringtie to calculate the expression levels of
widely in the genome and are important in genome func- genes and transcripts in RTR among different tissues and
tion and evolution (48). Some of the functional repeat se- stages in the reference-only mode with the parameter e (23).
quences are located in known long noncoding RNAs in- Transcripts/genes which have FPKM > 0.5 in at least two
cluding Kcnq1ot1 (49) and Xist (50). Figure 3B shows or more samples in a stage and tissue were considered to
the percentages derived from dividing base-by-base over- be expressed in this biological condition. Transcripts/genes
lap between different types of TEs and exons from differ- which are considered to be expressed in at least one stage in
ent types of transcripts by the total length of transcripts a tissue were considered expressed in this tissue. Expression
in human and rat. The percentages in both coding and patterns of different tissues vary considerably. Most of the
long noncoding newly annotated transcripts with confi- genes and transcripts detected in one tissue were also ex-
dence in RTR (15.9 and 28.6%, respectively) are higher pressed in at least one other tissue (designated as ‘common’
than the percentages in the counterparts in Ensembl in rat in Figure 4A). Testis possesses the most expressed genes and
(3.3 and 20.4%, respectively). The most abundant families transcripts and the highest proportions of unique genes and
in novel transcripts with confidence in RTR are LINE/L1, transcripts among all organs, which is consistent with what
LINE/L2, SINE/Alu, SINE/B2, SINE/B4, SINE/MIR is seen in humans (54). Most of the testis-specific transcripts
and LTR/ERVL-MaLR, which is consistent with earlier re- are involved in spermatogenesis. We also drew a landscape8326 Nucleic Acids Research, 2020, Vol. 48, No. 15
Downloaded from https://academic.oup.com/nar/article/48/15/8320/5880465 by guest on 02 November 2020
Figure 4. Expression analysis among tissues. (A) The distribution of genes and transcripts among tissues. Blue bar means the gene number uniquely
expressed in the corresponding tissue. Pink bar means the number of genes not only expressed in the corresponding tissue but also expressed in at least one
other tissue. The aggregate length of blue bar and pink bar is the number of genes expressed in the corresponding tissue. The format of gene information
shown in the figure is the same as the one of transcript information. Tissues studied are: Ad, adrenal; Br, brain; He, heart; Ki, kidney; Lu, lung; Li, liver;
Mu, skeletal muscle; Sp, spleen; Th, thymus; Te, testis; and Ut, uterus. (B) The distribution of transcripts under all of the 44 conditions. (C) The statistics
of transcripts from Ensembl and RTR according to tissues. ‘Common 2’ denotes the transcripts that were identified in at least two tissues. ‘Common all’
denotes the transcripts that were identified in all of the 11 tissues.
of expression patterns of transcripts in RTR under all of prevalent than tissue-specific transcripts in both RTR and
the 44 conditions with different tissues and developmen- Ensembl, which demonstrates that there are close associa-
tal stages (Figure 4B). We then made a two-way ANOVA tions among tissues. For example, transcripts in heart and
analysis on the gene abundance of all genes in RTR and muscle are both enriched in several biological processes
found that tissue type has a significant influence on gene in Gene Ontology by hypergeometric test (37), e.g. sar-
abundance in 44 539 genes while developmental stage has coplasmic reticulum calcium ion transport (GO:0070296),
a significant influence in only 25 439 genes (Bonferroni- endoplasmic reticulum to cytosol transport (GO:1903513)
adjusted, P-value < 0.05). (Bonferroni-adjusted, P-value < 0.05).
Transcripts in RTR are more tissue-specific than those There are 15 852 transcripts expressed > 0.5 FPKM
in existing databases like Ensembl (Figure 4C). Transcripts among all of the 11 tissues, which we deem as house-keeping
which are expressed in at least two tissues are much more transcripts (Supplementary Table S9). These transcriptsNucleic Acids Research, 2020, Vol. 48, No. 15 8327
Downloaded from https://academic.oup.com/nar/article/48/15/8320/5880465 by guest on 02 November 2020
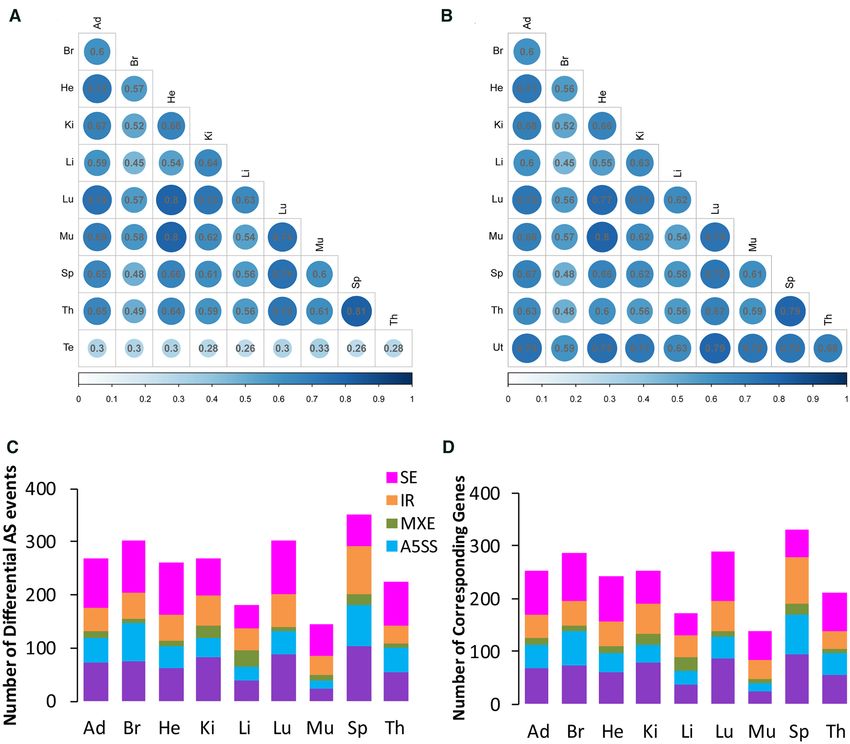
Figure 5. Spearman’s correlation coefficients of gene abundance between all organs at 21 weeks in male (A) and female (B) rats, respectively. Numbers of
differential AS events (C) and the corresponding genes (D) between male and female rats for all nine non-sex organs at 21 weeks.
show enrichment for fundamental functional pathways in Differences in splicing and gene expression between males and
KEGG (55) such as metabolic pathways, RNA transport females in adulthood
and spliceosome (Bonferroni-adjusted, P-value < 0.05). We
We calculated the Spearman’s correlation coefficients of
also found that 11 715 genes are expressed in all these tissues
gene abundance between all organs at 21 weeks in male (Fig-
which we deem as house-keeping genes (Supplementary Ta-
ure 5A) and female rats (Figure 5B), respectively (FDR-
ble S10). A total of 849 house-keeping genes express differ-
adjusted P-value < 0.05). We restricted our analysis to the
ent isoforms among tissues (Supplementary Table S11) (56).
genes which were considered to be expressed in at least
We then compared the gene abundance of RTR measured
one biological condition (FPKM > 0.5) for each compar-
by FPKM with an external gene abundance dataset mea-
ison. Spleen and thymus, heart and muscle show the max-
sured by RPKM across rat organ development (E-MTAB-
imum values in both sexes as displayed in the hierarchi-
6811) (57). Supplementary Table S12 shows the Spear-
cal clustering heatmap of gene expression profiles in Figure
man’s correlation coefficients between the common bio-
1C in the previous SEQC publication (17). Coefficients be-
logical conditions available from the two gene abundance
tween testis and non-sex organs in male rats show the min-
datasets. RTR genes with transcripts in Ensembl were se-
imum values. Thymus shows the highest sum of absolute
lected to conduct the common gene set for the calculation.
value of coefficient difference from all other non-sex organs
Nearly all the coefficients are around 0.85 except for testis
(0.19), i.e. thymus in females shows lower correlations with
at 2 weeks which may result from different reference tran-
all other non-sex organs than the male counterparts, which
scriptomes and technical effects.8328 Nucleic Acids Research, 2020, Vol. 48, No. 15
may result from better thymic function in females compared it is a DSG (Chi-square test, P-value > 0.05) between male
with males (58). and female rats for the same non-sex organ at 21 weeks and
We then calculated the Spearman’s correlation coeffi- between testis and ovary at 16 weeks.
cients of gene abundance between male and female rats in
different non-sex organs (FDR-adjusted P-value < 0.05).
RTR presentation in website
Genes were selected as stated above. The coefficients are
∼0.96 except for the coefficient in liver (0.92), which is RTR is freely available at http://www.unimd.org/rtr/. There
consistent with the fact that the liver shows the most sex- are six sections in the website: Home, Browse, Down-
different DEGs (1478) among non-sex organs as is shown loads, FAQ, Search and Contact Us. In the Browse sec-
in the result below. tion, our website displays all 52 807 genes in the order of
Differential gene expression profiles between male and fe- their locations in the rat reference genome (rnor6). IDs of
male rats for all nine non-sex organs at 21 weeks were an- newly annotated genes begin with ‘RTRG.’ while IDs of
alyzed with the DESeq2 package and a gene was consid- genes/transcripts in known databases (Ensembl, RefSeq)
Downloaded from https://academic.oup.com/nar/article/48/15/8320/5880465 by guest on 02 November 2020
ered differentially expressed when at least a 1.5-fold differ- are retained. Transcript information can be searched by
ence in expression existed between sexes (|log2FoldChange| clicking the Gene ID field of the queried gene. A gene can
> 0.585) plus a FDR-adjusted P-value < 0.05 (See ‘Mate- be displayed in Genome Browser of UCSC by clicking its
rials and Methods’ section and Supplementary Tables S13 Location field. The information in each cell in the table can
and 14). More genes showed sex-different expression in be displayed in real time by typing key words in the search
the liver and kidney as reported in previous publications box. Since there is loading delay in the Browse section ow-
(17,59). Totally, there are 3044 sex-different DEGs, only ing to the large dataset, we offer the Search section without
12.5% of which are sex-different DEGs in more than one loading delay. Records can be displayed by typing key words
tissue. More genes were found preferentially expressed in in the search box in the Search section.
male vs female. Male-dominant genes outnumbered female- For each selected gene, we displayed the expression pro-
dominant genes in each non-sex organ (1951 versus 1212 in file in each tissue and developmental stage in a boxplot. We
all). also calculated the positively/negatively correlated genes of
We used rMATS to identify five types of AS events be- the selected gene by organ. We displayed these highly corre-
tween male and female rats for all nine non-sex organs at 21 lated genes with the selected gene in a table with correlation
weeks: SE, IR, MXE, alternative 5 donor site (A5SS), al- coefficients from high to low with the minimum value over
ternative 3 acceptor site (A3SS) (36). Among the five major 0.9 in the organ-specific mode and over 0.7 in the global-
types of differential AS events, SE was the most frequent in organ mode. We only calculated the genes with the expres-
most organs except for spleen (See ‘Materials and Methods’ sion level over 1 FPKM in at least two samples. By hovering
section). In contrast, MXE was the least common differen- the mouse over the correlated gene in the table, the correla-
tial AS pattern (Figure 5C). Most of the differential spliced tion coefficient is displayed; upon mouse click, the boxplot
genes (DSGs) undergo only one differential AS event (Fig- of this correlated gene is displayed.
ure 5C and D).
To assess the global correlation in AS patterns between
DISCUSSION
male and female rats for all nine non-sex organs at 21 weeks,
we restricted our analysis to the alternatively spliced cas- RNA-seq data provide great advantages in both biologi-
sette exons with at least 20 reads mapped to one of the three cal status and genome coverage for the comprehensive un-
exon-exon junctions in an AS event in all samples during derstanding of the transcriptome. By developing and ap-
comparison. We observed high correlations in the exon in- plying novel software and streamlined analysis pipelines
clusion levels of these exons which means high similarities for integrating dispersed RNA-seq data into reliable and
of AS events between male and female rats for all nine non- reusable data resources, transcriptome analysis and mining
sex organs (Pearson correlation r: ∼0.98, P-value < 2.2e-16) to understand biological function can be enhanced. In this
(Supplementary Figure S5). The exon inclusion level of an study, we reconstructed a rat transcriptome by combining
alternatively spliced cassette exon in any given tissue was existing rat annotation resources with rat BodyMap data.
estimated from the counts of ESTs mapped uniquely to the This new comprehensive rat transcriptome now has com-
exon inclusion or skipping exon–exon junctions. pleteness and annotation comparable to the well-annotated
To analyze DEGs and DSGs between sex gonads, we mouse transcriptome. Transcripts in RTR cover over 97%
compared testis and ovary at 16 weeks from the same exter- of the identified transcripts in 5 other datasets which ver-
nal rat RNA-seq dataset used above (E-MTAB-6811) with ifies the accuracy of RTR (Supplementary Table S1). This
DESeq2 and rMATS after processing the fastq files (35,36). small difference may be attributable to unique transcripts in
A total of 4013 differential AS events were identified from a certain individual and sequencing errors.
2361 DSGs. Similar to the expression trend in non-sex or- Although the analysis pipeline has been documented, re-
gans, more genes were preferentially expressed in male vs liable sample-specific transcriptome needs improvement in
female (9079 versus 5087). Among 2361 DSGs detected in each link. Since novel coding transcripts of high confidence
testis vs ovary at 16 weeks, 833 DSGs undergo more than in RTR were predicted in-silico, it is worthwhile to con-
one differential AS event, which is much higher than those sider some additional studies to produce specific antibod-
multi-differential AS events happened between male and fe- ies of some interesting newly discovered coding isoform se-
male rats in all nine non-sex organs (Figure 5C and D). quences of genes. As the transcriptome is better defined, the
Whether a gene is a DEG has no correlation with whether accurate definition of each gene becomes more complicated.Nucleic Acids Research, 2020, Vol. 48, No. 15 8329
RTR is a re-annotated transcriptome derived from com- SUPPLEMENTARY DATA
mon tissues of different developmental stages under normal
Supplementary Data are available at NAR Online.
experimental conditions. In its present development, RTR
may not contain all genes/transcripts because RNA-seq
data are not available from every rat tissue/cell type under ACKNOWLEDGEMENTS
all possible experimental conditions, diseases and patholo-
gies. Although expression of genes/transcripts may oscillate T.S. and X.J. designed the study and wrote the manuscript.
with a period of about 24 h (60), the RTR website only cov- Data analysis and interpretation were performed by X.J.
ers the expression of genes/transcripts at one point in the and P.L. The RTR online database was designed and con-
44 conditions. structed by T.S. and X.J. P.L., G.C., W.X., L.S., B.N., H.H.,
However, RTR appears to accurately and comprehen- Z.L., J.L., L.G., D.P.K., P.P.Ł., L.Z., W.B., Y.H., J.H., Y.Z.
sively represent the transcriptome landscape of the rat to and W.T. offered suggestions. T.S., X.J., J.C.F., Y.Z. and
a considerable extent (Supplementary Table S15). For ex- W.T. revised the manuscript. All authors read and approved
Downloaded from https://academic.oup.com/nar/article/48/15/8320/5880465 by guest on 02 November 2020
ample, RTR contained 98.5% of transcripts identified in the final manuscript.
a normal liver sample (SRP028932; Supplementary Table
S1), while only 94.3% were identified in hypertensive liver FUNDING
samples from the same experiment. Further, RTR identi-
fied 98.6% of transcripts in an independent study of the China Human Proteome Project [2014DFB30010,
whole kidney (SRP041131; Supplementary Table S1) but 2014DFB30030]; National Science and Technology
only 97.2% of the transcripts in the S1 renal proximal tubule Major Project [2019ZX09301-132]; National Key Research
from the same experiment. Thus, for a more complete def- and Development Program of China [2015AA020108]; Na-
inition of the rat transcriptome, additional RNA-seq data tional Science Foundation of China [31671377, 31771460,
is required from tissues and cell types not represented in 31801118]; Program for Changjiang Scholars, Innovative
the Rat BodyMap database, as well as transcripts from rats Research Team in University [IRT 15R13]; Shang-
with disease/pathological states and under different envi- hai Municipal Science and Technology Major Project
ronmental conditions. [2017SHZDZX01]; Open Research Fund of Key Labo-
The rat has been widely used in toxicological studies. ratory of Advanced Theory and Application in Statistics
However, results from preclinical findings in the rat model and Data Science––MOE, ECNU, Beihang University &
sometimes cannot be reliably extrapolated to human clini- Capital Medical University Advanced Innovation Center
cal trials. The underlying mechanisms behind this problem for Big Data-Based Precision Medicine Plan [BHME-
have not been fully understood. The incomplete annotation 201804, BHME-201904] and The Special Fund of the
for the rat genome and transcriptome has seriously inhib- Pediatric Medical Coordinated Development Center of
ited the cross-species comparison studies necessary to in- Beijing Hospitals Autority [XTCX201809]. Funding for
vestigate these inconsistencies between rat and human, and open access charge: National Science and Technology
this may have contributed to the limitations of this animal Major Project [2019ZX09301-132].
model. Our new comprehensively re-annotated transcrip- Conflict of interest statement. The authors declared no po-
tome provides a valuable reference for biomedical research tential conflicts of interest.
in understanding human diseases, and performing studies
on drug toxicity and adverse effects using the rat animal REFERENCES
model.
1. Barrett,T. and Edgar,R. (2006) Mining microarray data at NCBI’s
Of the detected 73 074 newly annotated transcripts, Gene Expression Omnibus (GEO)*. Methods Mol. Biol., 338,
19.3% of the transcripts could not be assigned a coding 175–190.
function by our pipeline. Inconsistent results from software 2. Davis,S. and Meltzer,P.S. (2007) GEOquery: a bridge between the
used for the judgement of coding ability appeared to be the Gene Expression Omnibus (GEO) and BioConductor.
cause. Newly annotated transcripts with ambiguous coding Bioinformatics, 23, 1846–1847.
3. Ji,X.J., Feng,G.S., Chen,G. and Shi,T.L. (2018) Lack of correlation
ability may be due to shortcomings of these softwares or between aristolochic acid exposure and hepatocellular carcinoma.
because a transcript may act in both coding and noncoding Sci. China Life Sci., 61, 727–728.
roles (45,61). 4. Gustincich,S., Sandelin,A., Plessy,C., Katayama,S., Simone,R.,
This comprehensive re-analysis of the rat BodyMap Lazarevic,D., Hayashizaki,Y. and Carninci,P. (2006) The complexity
of the mammalian transcriptome. J. Physiol., 575, 321–332.
RNA-seq data significantly expands the rat transcriptome. 5. Pan,Q., Shai,O., Lee,L.J., Frey,B.J. and Blencowe,B.J. (2008) Deep
The numbers of genes and transcripts were increased greatly surveying of alternative splicing complexity in the human
over existing databases. The ratio of multi-isoform genes transcriptome by high-throughput sequencing. Nat. Genet., 40,
has been extensively increased from 15.4% in Ensembl to 1413–1415.
34.3% in RTR (Figure 1). Based on the information by tis- 6. Xue,C., Zhang,H., Lin,Q., Fan,R. and Gao,C. (2018) Manipulating
mRNA splicing by base editing in plants. Sci. China Life Sci., 61,
sue in RTR, we found that most of the transcripts are widely 1293–1300.
shared among tissues and we also identified a more compre- 7. Zerbino,D.R., Achuthan,P., Akanni,W., Amode,M.R., Barrell,D.,
hensive set of house-keeping genes and transcripts than ever Bhai,J., Billis,K., Cummins,C., Gall,A., Giron,C.G. et al. (2018)
before. This new rat transcriptome provides an essential ref- Ensembl 2018. Nucleic Acids Res., 46, D754–D761.
8. Rosenbloom,K.R., Dreszer,T.R., Long,J.C., Malladi,V.S.,
erence for genetics and gene expression studies in rat disease Sloan,C.A., Raney,B.J., Cline,M.S., Karolchik,D., Barber,G.P.,
and toxicity models. Clawson,H. et al. (2012) ENCODE whole-genome data in the UCSC
Genome Browser: update 2012. Nucleic Acids Res., 40, D912–D917.8330 Nucleic Acids Research, 2020, Vol. 48, No. 15
9. Haas,B.J., Delcher,A.L., Mount,S.M., Wortman,J.R., Smith,R.K. Jr, 31. Haeussler,M., Zweig,A.S., Tyner,C., Speir,M.L., Rosenbloom,K.R.,
Hannick,L.I., Maiti,R., Ronning,C.M., Rusch,D.B., Town,C.D. et al. Raney,B.J., Lee,C.M., Lee,B.T., Hinrichs,A.S., Gonzalez,J.N. et al.
(2003) Improving the Arabidopsis genome annotation using maximal (2019) The UCSC Genome Browser database: 2019 update. Nucleic
transcript alignment assemblies. Nucleic Acids Res., 31, 5654–5666. Acids Res., 47, D853–D858.
10. Rhind,N., Chen,Z., Yassour,M., Thompson,D.A., Haas,B.J., 32. Tempel,S. (2012) Using and understanding RepeatMasker. Methods
Habib,N., Wapinski,I., Roy,S., Lin,M.F., Heiman,D.I. et al. (2011) Mol. Biol., 859, 29–51.
Comparative functional genomics of the fission yeasts. Science, 332, 33. Quinlan,A.R. and Hall,I.M. (2010) BEDTools: a flexible suite of
930–936. utilities for comparing genomic features. Bioinformatics, 26, 841–842.
11. Djebali,S., Davis,C.A., Merkel,A., Dobin,A., Lassmann,T., 34. Liao,Y., Smyth,G.K. and Shi,W. (2014) featureCounts: an efficient
Mortazavi,A., Tanzer,A., Lagarde,J., Lin,W., Schlesinger,F. et al. general purpose program for assigning sequence reads to genomic
(2012) Landscape of transcription in human cells. Nature, 489, features. Bioinformatics, 30, 923–930.
101–108. 35. Love,M.I., Huber,W. and Anders,S. (2014) Moderated estimation of
12. Thierry-Mieg,D. and Thierry-Mieg,J. (2006) AceView: a fold change and dispersion for RNA-seq data with DESeq2. Genome
comprehensive cDNA-supported gene and transcripts annotation. Biol., 15, 550.
Genome Biol., 7, S12. 36. Shen,S., Park,J.W., Lu,Z.X., Lin,L., Henry,M.D., Wu,Y.N., Zhou,Q.
Downloaded from https://academic.oup.com/nar/article/48/15/8320/5880465 by guest on 02 November 2020
13. Haas,B.J., Zeng,Q., Pearson,M.D., Cuomo,C.A. and Wortman,J.R. and Xing,Y. (2014) rMATS: robust and flexible detection of
(2011) Approaches to fungal genome annotation. Mycology, 2, differential alternative splicing from replicate RNA-Seq data. PNAS,
118–141. 111, E5593–E5601.
14. Garber,M., Grabherr,M.G., Guttman,M. and Trapnell,C. (2011) 37. The Gene Ontology, C. (2019) The Gene Ontology Resource: 20 years
Computational methods for transcriptome annotation and and still GOing strong. Nucleic Acids Res., 47, D330–D338.
quantification using RNA-seq. Nat. Methods, 8, 469–477. 38. Foissac,S. and Sammeth,M. (2007) ASTALAVISTA: dynamic and
15. Chen,G., Shi,T. and Shi,L. (2017) Characterizing and annotating the flexible analysis of alternative splicing events in custom gene datasets.
genome using RNA-seq data. Sci. China Life Sci., 60, 116–125. Nucleic Acids Res., 35, W297–W299.
16. Pauli,A., Valen,E., Lin,M.F., Garber,M., Vastenhouw,N.L., 39. Sammeth,M., Foissac,S. and Guigo,R. (2008) A general definition
Levin,J.Z., Fan,L., Sandelin,A., Rinn,J.L., Regev,A. et al. (2012) and nomenclature for alternative splicing events. PLoS Comput. Biol.,
Systematic identification of long noncoding RNAs expressed during 4, e1000147.
zebrafish embryogenesis. Genome Res., 22, 577–591. 40. Chen,H.C. and Cheng,S.C. (2012) Functional roles of protein splicing
17. Yu,Y., Fuscoe,J.C., Zhao,C., Guo,C., Jia,M., Qing,T., Bannon,D.I., factors. Biosci. Rep., 32, 345–359.
Lancashire,L., Bao,W., Du,T. et al. (2014) A rat RNA-Seq 41. Kim,J., Zhao,K., Jiang,P., Lu,Z.X., Wang,J., Murray,J.C. and
transcriptomic BodyMap across 11 organs and 4 developmental Xing,Y. (2012) Transcriptome landscape of the human placenta.
stages. Nat. Commun., 5, 3230. BMC Genomics, 13, 115.
18. Wang,K., Vijay,V. and Fuscoe,J.C. (2017) Stably expressed genes 42. UniProt,C. (2019) UniProt: a worldwide hub of protein knowledge.
involved in basic cellular functions. PLoS One, 12, e0170813. Nucleic Acids Res., 47, D506–D515.
19. Leinonen,R., Sugawara,H., Shumway,M. and International 43. Leygue,E. (2007) Steroid receptor RNA activator (SRA1): unusual
Nucleotide Sequence Database, C. (2011) The sequence read archive. bifaceted gene products with suspected relevance to breast cancer.
Nucleic Acids Res., 39, D19–D21. Nucl. Recept. Signal., 5, e006.
20. Shimoyama,M., De Pons,J., Hayman,G.T., Laulederkind,S.J., Liu,W., 44. Kloc,M., Wilk,K., Vargas,D., Shirato,Y., Bilinski,S. and Etkin,L.D.
Nigam,R., Petri,V., Smith,J.R., Tutaj,M., Wang,S.J. et al. (2015) The (2005) Potential structural role of non-coding and coding RNAs in
Rat Genome Database 2015: genomic, phenotypic and environmental the organization of the cytoskeleton at the vegetal cortex of Xenopus
variations and disease. Nucleic Acids Res., 43, D743–D750. oocytes. Development, 132, 3445–3457.
21. Pruitt,K.D., Tatusova,T., Brown,G.R. and Maglott,D.R. (2012) 45. Chen,G., Yang,J., Chen,J., Song,Y., Cao,R., Shi,T. and Shi,L. (2016)
NCBI Reference Sequences (RefSeq): current status, new features and Identifying and annotating human bifunctional RNAs reveals their
genome annotation policy. Nucleic Acids Res., 40, D130–D135. versatile functions. Sci. China Life Sci., 59, 981–992.
22. Kim,D., Langmead,B. and Salzberg,S.L. (2015) HISAT: a fast spliced 46. Fu,Y., Sun,Y., Li,Y., Li,J., Rao,X., Chen,C. and Xu,A. (2011)
aligner with low memory requirements. Nat. Methods, 12, 357–360. Differential genome-wide profiling of tandem 3 UTRs among
23. Pertea,M., Pertea,G.M., Antonescu,C.M., Chang,T.C., Mendell,J.T. human breast cancer and normal cells by high-throughput
and Salzberg,S.L. (2015) StringTie enables improved reconstruction sequencing. Genome Res., 21, 741–747.
of a transcriptome from RNA-seq reads. Nat. Biotechnol., 33, 47. Nesterova,T.B., Barton,S.C., Surani,M.A. and Brockdorff,N. (2001)
290–295. Loss of Xist imprinting in diploid parthenogenetic preimplantation
24. Ji,X., Tong,W., Ning,B., Mason,C.E., Kreil,D.P., Labaj,P.P., Chen,G. embryos. Dev. Biol., 235, 343–350.
and Shi,T. (2019) QuaPra: efficient transcript assembly and 48. Bucher,E., Reinders,J. and Mirouze,M. (2012) Epigenetic control of
quantification using quadratic programming with Apriori algorithm. transposon transcription and mobility in Arabidopsis. Curr. Opin.
Sci. China Life Sci., 62, 937–946. Plant Biol., 15, 503–510.
25. Wang,L., Park,H.J., Dasari,S., Wang,S., Kocher,J.P. and Li,W. (2013) 49. Mohammad,F., Pandey,R.R., Nagano,T., Chakalova,L., Mondal,T.,
CPAT: coding-potential assessment tool using an alignment-free Fraser,P. and Kanduri,C. (2008) Kcnq1ot1/Lit1 noncoding RNA
logistic regression model. Nucleic Acids Res., 41, e74. mediates transcriptional silencing by targeting to the perinucleolar
26. El-Gebali,S., Mistry,J., Bateman,A., Eddy,S.R., Luciani,A., region. Mol. Cell. Biol., 28, 3713–3728.
Potter,S.C., Qureshi,M., Richardson,L.J., Salazar,G.A., Smart,A. 50. Wutz,A., Rasmussen,T.P. and Jaenisch,R. (2002) Chromosomal
et al. (2019) The Pfam protein families database in 2019. Nucleic silencing and localization are mediated by different domains of Xist
Acids Res., 47, D427–D432. RNA. Nat. Genet., 30, 167–174.
27. Altschul,S.F., Madden,T.L., Schaffer,A.A., Zhang,J., Zhang,Z., 51. Kapusta,A., Kronenberg,Z., Lynch,V.J., Zhuo,X., Ramsay,L.,
Miller,W. and Lipman,D.J. (1997) Gapped BLAST and PSI-BLAST: Bourque,G., Yandell,M. and Feschotte,C. (2013) Transposable
a new generation of protein database search programs. Nucleic Acids elements are major contributors to the origin, diversification, and
Res., 25, 3389–3402. regulation of vertebrate long noncoding RNAs. PLos Genet., 9,
28. Kutter,C., Watt,S., Stefflova,K., Wilson,M.D., Goncalves,A., e1003470.
Ponting,C.P., Odom,D.T. and Marques,A.C. (2012) Rapid turnover 52. Kim,J. and Deininger,P.L. (1996) Recent amplification of rat ID
of long noncoding RNAs and the evolution of gene expression. PLos sequences. J. Mol. Biol., 261, 322–327.
Genet., 8, e1002841. 53. Serdobova,I.M. and Kramerov,D.A. (1998) Short retroposons of the
29. Quinlan,A.R. (2014) BEDTools: the Swiss-Army tool for genome B2 superfamily: evolution and application for the study of rodent
feature analysis. Curr. Protoc. Bioinform., 47, 11.12.1–11.12.34. phylogeny. J. Mol. Evol., 46, 202–214.
30. Li,W., Cowley,A., Uludag,M., Gur,T., McWilliam,H., Squizzato,S., 54. Djureinovic,D., Fagerberg,L., Hallstrom,B., Danielsson,A.,
Park,Y.M., Buso,N. and Lopez,R. (2015) The EMBL-EBI Lindskog,C., Uhlen,M. and Ponten,F. (2014) The human
bioinformatics web and programmatic tools framework. Nucleic testis-specific proteome defined by transcriptomics and
Acids Res., 43, W580–W584. antibody-based profiling. Mol. Hum. Reprod., 20, 476–488.Nucleic Acids Research, 2020, Vol. 48, No. 15 8331
55. Kanehisa,M., Sato,Y., Kawashima,M., Furumichi,M. and Tanabe,M. 58. Pido-Lopez,J., Imami,N. and Aspinall,R. (2001) Both age and gender
(2016) KEGG as a reference resource for gene and protein affect thymic output: more recent thymic migrants in females than
annotation. Nucleic Acids Res., 44, D457–D462. males as they age. Clin. Exp. Immunol., 125, 409–413.
56. Trapnell,C., Williams,B.A., Pertea,G., Mortazavi,A., Kwan,G., van 59. Huby,R.D.J., Glaves,P. and Jackson,R. (2014) The incidence of
Baren,M.J., Salzberg,S.L., Wold,B.J. and Pachter,L. (2010) Transcript sexually dimorphic gene expression varies greatly between tissues in
assembly and quantification by RNA-Seq reveals unannotated the rat. PLoS One, 9, e115792.
transcripts and isoform switching during cell differentiation. Nat. 60. Yu,Q. (2018) Biological clock: the oscillator of gene expression. Sci.
Biotechnol., 28, 511–515. China Life Sci., 61, 128–130.
57. Cardoso-Moreira,M., Halbert,J., Valloton,D., Velten,B., Chen,C., 61. Sampath,K. and Ephrussi,A. (2016) CncRNAs: RNAs with both
Shao,Y., Liechti,A., Ascencao,K., Rummel,C., Ovchinnikova,S. et al. coding and non-coding roles in development. Development, 143,
(2019) Gene expression across mammalian organ development. 1234–1241.
Nature, 571, 505–509.
Downloaded from https://academic.oup.com/nar/article/48/15/8320/5880465 by guest on 02 November 2020You can also read