Spatially-resolved proteomics and transcriptomics: An emerging digital spatial profiling approach for tumor microenvironment
←
→
Page content transcription
If your browser does not render page correctly, please read the page content below
Visualized Cancer Medicine 2021, 2, 1
Ó The Authors, published by EDP Sciences, 2021
https://doi.org/10.1051/vcm/2020002
                                                                                                                                       Available online at:
                                                                                                                                   https://vcm.edpsciences.org

    TECHNOLOGICAL ADVANCES                                                                                                                 OPEN        ACCESS

Spatially-resolved proteomics and transcriptomics: An emerging
digital spatial profiling approach for tumor microenvironment

Nan Wang1, Rongshui Wang1, Xue Zhang1, Xia Li1, Yan Liang2, and Zhiyong Ding1,*
1
    Mills Institute for Personalized Cancer Care, Fynn Biotechnologies Ltd., Gangxing 3rd Rd, High-Tech and Innovation Zone,
    Bldg. 2, Rm. 2201, Jinan City, Shandong Province 250101, PR China
2
    NanoString Technologies, Inc., Seattle, WA, USA

              Received 17 September 2020, Accepted 4 December 2020, Published online 3 March 2021

              Abstract – Digital spatial profiling (DSP) is an emerging powerful technology for proteomics and transcriptomics
              analyses in a spatially resolved manner for formalin-fixed paraffin-embedded (FFPE) samples developed by nanoString
              Technologies. DSP applies several advanced technologies, including high-throughput readout technologies (digital
              optical barcodes by nCounter instruments or next generation sequencing (NGS)), programmable digital micromirror
              device (DMD) technology, and microfluidic sampling technologies into traditional immunohistochemistry (IHC)
              and RNA in situ hybridization (ISH) approaches, creating an innovative tool for discovery, translational research,
              and clinical uses. Since its launch in 2019, DSP has been rapidly adopted, especially in immuno-oncology and tumor
              microenvironment research areas, and has revealed valuable information that was inaccessible before. In this article, we
              report the successful setup and validation of the first DSP technology platform in China. Both DSP spatial protein and
              RNA profiling approaches were validated using FFPE colorectal cancer tissues. Regions of interest (ROIs) were
              selected in the areas enriched with tumor cells, stroma/immune cells, or normal epithelial cells, and multiplex spatial
              profiling of both proteins and RNAs were performed. DSP spatial profiling data were processed and normalized
              accordingly, validating the high quality and consistency of the data. Unsupervised hierarchical clustering as well as
              principal component analysis (PCA) grouped tumor, stroma/immune cells, and normal epithelial cells into distinct
              clusters, indicating that the DSP approach effectively captured the spatially resolved proteomics and transcriptomics
              profiles of different compartments within the tumor microenvironment. In summary, the results confirmed the expected
              sensitivity and robustness of the DSP approach in profiling both proteins and RNAs in a spatially resolved manner.
              As a novel technology in highly complex spatial analyses, DSP endows refined analytical power from the tumor
              microenvironment perspective with the potential of scaling up to more analyzable targets at relatively low cell input
              levels. We expect that the DSP technology will greatly advance a wide range of biomedical research, especially in
              immuno-oncology and tumor microenvironment research areas.

              Key words: Digital spatial profiling, Spatially resolved, Proteomics, Transcriptomics, Tumor microenvironment

Introduction                                                                        normal tissues. Dysfunction and reshaping of tumor-
                                                                                    surrounding cell composition, networks, hypoxia, secretory
    Since the paradigm shift to disentangle the underlying                          fluids as well as extracellular pH all contribute to the formation
mechanisms of oncogenesis from solely tumor-centric princi-                         of TME [2, 3].
ples to a more conceivably dynamic interplay and crosstalk                               Therapeutic implications derived from or hinting at TME
involving normal and cancerous epithelial cells, fibroblasts,                        related mechanisms have been brought to attention. Ample
immune cells, and extracellular matrix (ECM) back in the                            amounts of data manifested reciprocal interactions between
mid-1980s, cumulative works were in progress to underpin                            TME and specific anticancer agents through direct intervention
the significant roles of the tumor microenvironment (TME) in                         or indirect bypass effects on different cells within the microen-
localized neoplasm as well as a metastatic invasion [1]. Nowa-                      vironment. By large, TME causes resistance to drugs by
days, research communities broadly appreciate that TME har-                         (1) inducing anti-apoptotic effects to compromise the efficacy
bors complex populations of cell types distinctive from                             of immunotherapies, (2) causing desmoplastic stroma which
                                                                                    hampers penetration of chemotherapeutic agents to actionable
    *Corresponding author: zhiyong.ding@fynnbio.com                                 sites, (3) prohibiting anticancer drug delivery through stalling

     This is an Open Access article distributed under the terms of the Creative Commons Attribution License (https://creativecommons.org/licenses/by/4.0),
                  which permits unrestricted use, distribution, and reproduction in any medium, provided the original work is properly cited.

The display of videos embedded in this PDF depends on the software used (PDF reader, video player, installed codec, direct display in the browser, etc.). Please see
           the Adobe Acrobat page for more explanation. You can also find the videos at https://vcm.edpsciences.org/10.1051/vcm/2020002/#movies
2                                           N. Wang et al.: Vis Cancer Med 2021, 2, 1

blood supply, and (4) rendering constitutive activation of           T cell exhaustion upon predisposition to stimulatory antigens
survival signaling pathways [1, 4, 5]. On the other hand,            within confined microenvironments, which leads to restrained
chemotherapy, radiotherapy, genotoxic agents, and anti-angio-        T cell activities and challenges in modulating common
genic drugs pose negative feedback effects on TME, many of           targetable neoantigens in different subsets of patients [11, 13,
which include reprogramming of immune cells, fibroblasts,             14]. As the opposite tactic, active immunotherapy adopts the
and interstitial humoral regulation, involving inflammatory           major conceptual dogma to generate controlled and normalized
cytokines, tumor-initiating growth factors, and antibodies           immuno-active responses to circumvent undesirable immuno-
[1, 6]. Therefore, it is not surprising from oncology perspectives   genic effects while maintaining expected on-target effects. This
that targeting tumor-TME interactions has become a research          “modified” immune enhancement strategy opened up a new
hotspot in the past 15 years and therapeutic interventions target-   avenue to explore, especially with the successful underpinning
ing tumorigenic TME have been extensively investigated. Early        of immune checkpoint inhibitor anti-PD-1/PDL1 therapies in
phase discoveries predominantly focused on oncogenic and             an expended spectrum of late-stage malignancies. Many of those
angiogenic receptor tyrosine kinase (RTKs) such as epidermal         are solid tumors such as advanced melanoma, metastatic non-
growth factor receptor (EGFR), vascular endothelial growth           small cell lung cancer (NSCLC), metastatic squamous-cell head
factor receptor (VEGFR), and platelet-derived growth factor          and neck carcinoma (HNSCC), hepatocellular carcinoma, renal
receptor (PDGFR). Expression of these RTKs on designated             cell carcinoma as well as others [15–20]. The remarkable suc-
cells in regional and distal TME promotes tumor proliferation        cess of this controlled immune activation further speaks to the
and vasculogenesis, which further strengthens the concept of         profound but yet ill-defined mechanisms at local TME. This
mutual influence between evading cancer cells and surrounding         phenomenon was well supported by ample amount of evidence
TME [7–9].                                                           indicating that only measuring tumor biomarkers much as
     With rapid development and advances in immuno-                  PD-L1 expression, tumor mutation burden (TMB), high
oncology, the past 10 years also witnessed an unprecedented          microsatellite instability or mismatch repair deficiency
magnitude in immunotherapies and combinational regimes               (MSI-H)/dMMR) has limited predictive power to perfectly strat-
tailored to obtain durable patient responses in various clinical     ify patients [21–25].
studies. This in turn fundamentally redefined our ability to fight         Not until a few years ago did we realize that spatially defined
cancer. Two well-defined mainstream strategies to modulate            phenotypic and molecular architectures may have eminent
immune responses in the context of TME have brought signifi-          potentials to classify solid tumors according to their distinct
cant attention to date. Passive immunotherapy generally utilizes     characteristics. Three classes of TME outlined tumor types have
extrinsically administrated agents such as antibodies, antibody-     been depicted: (1) “inflamed” tumor bears highly infiltrated
drug conjugates (ADCs), tumor-infiltrating lymphocytes                immune cells and proinflammatory cytokines, (2) “immune
(TILs) or T cells subpopulations-based cell therapies (chimeric      desert” tumor bears minimal effector immune cell infiltrates,
antigen receptor T cells, CAR-T or T cell receptor                   and (3) “immune excluded” tumor has immune cells present
engineered T cells, TCR-T) to directly defeat cancer cells in a      in the stroma but not the tumor parenchyma [26]. In line with
target-specific manner. On the contrary, active immunotherapy         this classification, by incorporating the TME information, the
is designed to evoke endogenous immune activity via complex          tumor immunity in the microenvironment (TIME) classification
mechanisms [10]. While CAR-T based adoptive T cell therapy           has been proposed. TIME emphasizes that resetting tumors into
(ACT) is primarily designated to treat hematopoietic cancers         a TILs and PD-L1 positive status within the TME is critical to
and has shown its efficacy in some types of cancer such as            have pronounced immunogenic anti-tumor effects [27]. Those
diffuse large B-cell lymphoma (Yescarta) and non-Hodgkin             findings, though preliminary, uncovered a novel landscape that
lymphoma (Kymriah), it has not yet delivered largely convinc-        will set benchmarks for immune therapies in the future, and
ing evidence for its applicability in patients with solid tumors     henceforth a deeper understanding of the TME and tumor inter-
[11]. In parallel, seeking for high affinity-enhanced, tumor-         actions will be needed. To deconvolute mechanisms such as
reactive TCR-T while maintaining minimal levels of off-target        molecular causations of low TILs entry into tumor enriched
toxicity in solid tumors still proved to be challenging [11]. In     regions, types of driver TILs components or cell populations
solid tumors, cancerous origins are often rooted in epithelial       to predict therapeutic responses and their underlying phenotypic
cells instead of immune cells, therefore there is no compensatory    and molecular pathways, the complexity and heterogeneity at a
human immunoglobulin administration regime existing as is the        single tumor lesion within individual patients, as well as the
case in B cell lymphoma therapies, making the solid tumors hard      acquired optimal synergies of immunotherapies combined with
to manipulate. As a consequence, the lack of specificity is often     other conventional targeted therapies, radio(chemo)therapies,
accompanied by off-target toxicity leading to an array of down-      cancer vaccines, and oncolytic virus, more advanced technolo-
stream effects on T-cells and natural killer cells and causing       gies and platforms built for TME specific applications are in
cytokine release syndrome and other related immunopathogenic         urgent demand [10, 28–30].
effects [12]. By nature, solid tumors also have limited trafficking       Tissue-based high-plex molecular profiling technologies
to facilitate the regional spread of those therapeutic agents,       emerged as one of the most prominent and powerful tools for
which is even more important when treating metastatic cancer         TME based analysis due to their capacity to enable protein
or cancer with multiple lesions at different organ sites.            and RNA profiling while keeping spatial information intact.
Moreover, histological heterogeneity and TME are key features        Traditional morphological driven low-to-medium plex protein
prohibitive for drugs to function. Known causations include          assays such as multiplex IHC and cyclic immunofluorescence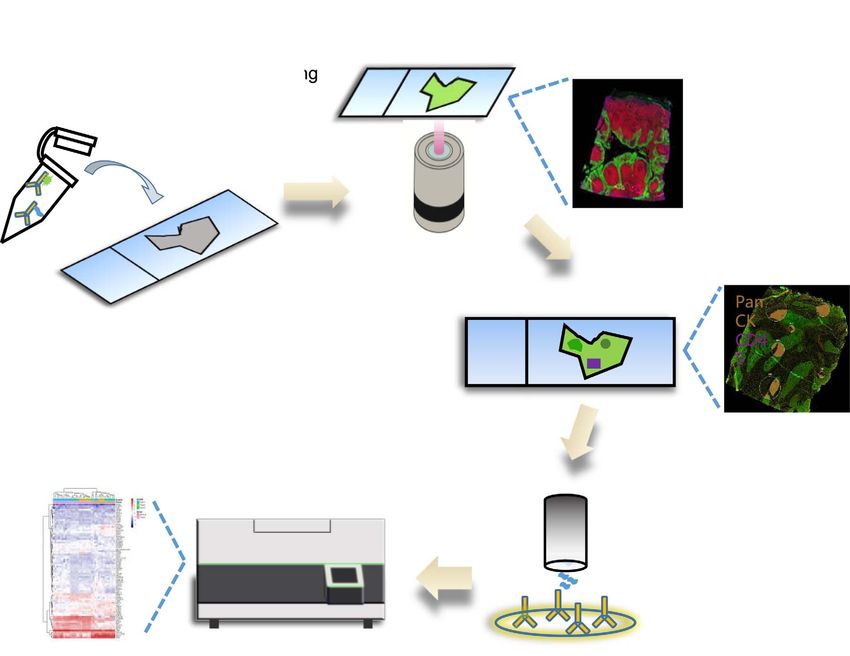
N. Wang et al.: Vis Cancer Med 2021, 2, 1                                                3

both rely on the cyclic collection of images and time-              understanding of TME based research leading to the ultimate
consuming processes although their multiplexing capabilities        improvement of immunotherapies.
are limited to 30–60 targets per slide [31–33]. Mass spectrom-
etry (MS) based methods such as imaging mass spectrometry
(IMS), though non-biased, require heavy instrumentation and         Technical briefs of DSP
pre-digestion as well as sophisticated setups to obtain the             DSP combines conventional immunofluorescence tech-
best spatial resolution down to 30 lm [34–36]. Metal-isotope-       niques with digital barcoded antibodies or oligonucleotides to
labeled MS methods such as mass spectrometry immunohisto-           allow morphologically outlined and high-plex expression profil-
chemistry (MSIHC) and multiplex ion-beam imaging (MIBI)             ing. The experimental procedure starts with routine 5 lm FFPE
also require expensive instrumentation and non-standardized         or fresh-frozen tissue sections mounted on charged slides. A
laboratory procedures, and the plexing potential is plagued         multi-color fluorescence staining mixture (up to 4) with addi-
around 100 at maximum with semiquantitative measuring               tional high-plex probe sets (oligo-conjugated antibodies or tar-
capacity [35, 37, 38]. From gene expression perspectives, rela-     get specific oligos) designed to suit experimental needs either
tively low plex technologies like RNAscope has outstanding          for proteins or RNAs respectively is incubated with the slides
sensitivity but cannot simultaneously profile hundreds of thou-      (similar to conventional immunofluorescence or IHC). This
sands of genes. More advanced spatial transcriptome technolo-       one-step incubation is then followed by high-resolution scan-
gies such as high-definition spatial transcriptomics (HDST),         ning using the DSP instrument to allow ultimate precision for
although capable of quantifying thousands of transcripts at even    ROI selection. ROI selection accepts various user-defined con-
a sub-cellular resolution (2 lm minimum at research level and       tours from circle to any polygon shapes. The collection of dig-
100 lm at a commercial level in practice), are generally incom-     ital probes within ROIs is performed by a micro-sized
patible with formalin-fixed paraffin-embedded (FFPE) tissues,         programmable digital micromirror device (DMD) which sheds
which are the most broadly available tissue type in clinical set-   UV light on selected ROIs to release the photocleavable oligos.
tings, and have expensive reagent costs that hamper general         Released oligo probes are aspirated via a capillary sipper
access for research purposes [39–41].                               sequentially. The resultant single strand oligos are then hybri-
     Digital spatial profiling (DSP) is a novel method for           dized to target specific fluorescence reporter probes to enable
medium-to-high plex spatial profiling of proteins and RNAs           digital counting performed by the nanoString nCounter digital
compatible with FFPE samples [42]. It is developed by nano-         barcode counting system, and the numerally transformed read-
String technologies, Seattle, WA, to empower quantification          ings directly reflect the expression level of targets [44].
of proteins and RNAs under the same experimental setup,             The schematic presentation of the DSP workflow is shown in
which is rather simplified with outstanding precision due to         Figure 1. The accompanying video demonstrates a visual proto-
its bona fide molecular barcode counting technology proprietar-      col of the DSP approach (Video 1).
ily designed [43, 44]. One superior advantage of DSP over
other technologies in the same category is the capacity to com-
partmentalize user-defined region of interests (ROIs) in spatial-    Methods in brief
directed patterns using multiple fluorescence labeling and in the
meantime enabling more than 100-plex protein and 1,800-plex         Validation of DSP performance with cell lines
RNA analysis [42, 45, 46]. Using this technology, Dimm’s
group proved its robustness by comparing it with quantitative           Two high-density homogenous HEK293 cell microarray
immunofluorescence (QIF) and by profiling 44 immune mark-             slides obtained from nanoString were used to validate the
ers in pure compartments consisting of macrophage, leukocyte,       DSP approach at Mills Institute for Personalized Cancer Care
and tumor respectively in a melanoma TMA cohort receiving           (MIPCC), Fynn Biotechnologies (FynnBio). The DSP core
checkpoint inhibitor therapies. They found the PD-L1 expres-        protein module (Immune Cell Core Profiling) consisting of
sion in the macrophage could potentially serve as a sole predic-    20 specific antibodies for immune-related targets and a standard
tive biomarker for progression-free survival PFS, overall           morphology panel comprising Pan-Cytokeratin (Pan-CK,
survival OS, and response [47]. Similarly in NSCLC patient          marker for epithelium cells/tumor cells), CD45 (marker for
cohorts, by pre-defined compartmentalization, they also identi-      immune cells) and SYTO13 (nuclei) were used for the valida-
fied a group of biomarkers that potentially play significant prog-    tion (for the full list of core protein targets and other details,
nostic roles [48]. Moreover, two studies also used DSP to probe     refer to nanoString websites https://www.nanostring.com).
the spatially guided expression patterns of B lymphocytes           Three circular ROIs on each slide spanning from the diameter
within the tertiary lymphoid structures (TLSs) in the TME that      range of 200 lm, 400 lm, and 600 lm were selected respec-
are predictive of good patient responses. They found distinct B     tively, and subject to downstream DSP processes.
cell subsets in TME defined by higher proliferative capacity
with higher Ki67 and CD40 expression, whereas pre-filtrating         Spatial profiling of protein and RNA of colorectal
T cell populations within tumor areas have higher expression        cancer tissue using DSP
of TIM3, PD1, and GZMB indicative of poor response to
immunotherapies [49, 50]. These findings together strengthen             We used serial sections of a colorectal cancer FFPE tissue
the necessity of incorporating spatial information with high-       mounted on slides to validate the spatial profiling of both
plex expression profiling, a new territory that is unexplorable      protein and RNA by the DSP approach. FFPE slides went
using conventional methods, but one that will deepen our            through conventional tissue pre-processing (deparaffinization
4                                             N. Wang et al.: Vis Cancer Med 2021, 2, 1

Figure 1. Schematic diagram of DSP workflow. 1. FFPE tissue sections mounted on slides are processed by standard IHC procedure and
incubated with morphology marker reagents (fluorescence-labeled antibodies or dyes) and a mix of oligo conjugated antibodies. 2. High-
quality images up to four channels of fluorescence are obtained. 3. ROIs are selected on the DSP instruments based on the morphological
fluorescence marker. 4. Oligos in specific ROIs are released by UV light and collected by a microcapillary tube and dispensed into 96-well
plates for subsequent processing. This oligo release and collection cycle is repeated for each ROI. 5. Digital counting by nCounter instruments
to generate protein or RNA profiling data in a spatially resolved manner. Alternatively, highly multiplexed RNA profiling could be achieved
using specific sequence adaptors (Unique Dual Index UDI) to allow NGS readout.

                                                                         epithelial and tumoral regions, CD45 for immune cells, and
                                                                         nuclear stain SYTO13 for tri-colored tissue compartmentaliza-
                                                                         tion as ROI selection references. Twelve circular ROIs on each
                                                                         slide were drawn and selected. For protein profiling, the areas of
                                                                         selected ROIs were between 20,000 and 120,000 lm2. For RNA
                                                                         profiling, due to the relatively low counts compared to proteins,
                                                                         ROIs were selected between 38,000 and 380,000 lm2 to ensure
                                                                         successful quality controls in data analysis. All oligos from
                                                                         48 ROIs for protein profiling and 48 ROIs for RNA profiling
Video 1. A visual protocol of the Digital Spatial Profiling (DSP)         were collected into 96-well plates using the proprietary
Approach. https://vcm.edpsciences.org/10.1051/vcm/2020002#V1             UV-guided technology in the DSP approach. Resultant oligos
                                                                         representing individual targets for individual ROIs were pooled
                                                                         together by column, hybridized to the beads-on-string barcoded
and rehydration). For protein profiling, 20-plex immune cell              counterpart oligos, and counted by nanoString nCounter.
profiling core module plus 2 additional modules (IO Drug
Target and Immune Cell Typing), each containing about                    Data processing and statistical analysis
10 targets were used. For RNA profiling, the immune pathways
module with a 96-plex RNA probe set was used. In both profil-                 Raw reporter code count (RCC) files generated by
ing approaches, we applied the same standard fluorescence-                nCounter were transformed into tabulated excel files with all
labeled morphology marker panel consisting of Pan-CK for                 interpretable values presented for all ROIs. External RNA
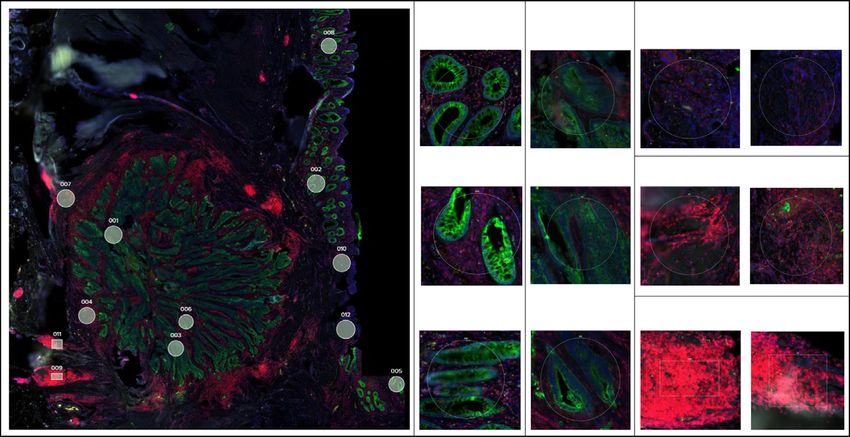
N. Wang et al.: Vis Cancer Med 2021, 2, 1                                                    5

Figure 2. Validation of the DSP protein profiling workflow. (A) ROI selection of FFPE HEK293 cell pellet slides. Circular ROIs of three
different sizes (200 lm, 400 lm, or 600 lm in diameter) were selected on each slide, labeled as 001, 002, and 003, respectively. Cell nuclei
were stained by STYO13 (blue) and cells were stained by fluorophore-labeled Pan-CK antibody (green). (B) Upper panel: Correlation of
nCounter counts (y-axis) and ROI area (x-axis). Lower panel: nCounter counts of Ki-67 and Beta-2 microglobulin from three ROIs of different
sizes normalized with housekeeping genes in duplicate slides (green and orange). (C) Volcano plot and box plots of individual proteins in
HEK293 cells from duplicate slides. LogFC > 1 and p-value < 0.05 are denoted as significant. Data are FDR adjusted with blue and yellow
representing individual slides.

Controls Consortium (ERCC)) internal spike-in negative and              and all p values were set to 0.05 as the cutoff. For unsupervised
positive controls were used to assess data quality and the perfor-      hierarchical clustering, log transformed data were median-cen-
mance of each experiment. Based on the values of ERCC                   tered before plotting. All unsupervised clustering and principal
normalization factors, a range between 0.3 and 3 for individual         component analysis (PCA), statistical calculations, and all
ROIs was chosen to eliminate outliers that are incompatible for         graphical presentations were conducted using R graphical user
downstream analysis. To filter out any skewness of the data,             interfaces (GUIs).
minimum nuclei count of 20 and surface area of 1,600 lm2
were set for protein profiling and minimum nuclei count of               Results of DSP workflow validation
200 and surface area of 6,000 lm2 for RNA profiling. Data that
pass quality control (QC) were then normalized by the geomet-               Two FFPE HEK293 cell pellet slides were used at MIPCC
ric mean of selected housekeeping gene expression counts.               to validate the DSP protein profiling workflow, with the core
UBB, RAB7A, OAZ1, POLR2A, and SDHA were used to                         protein module consisting of 20 antibodies, together with
normalize nCounter counts for RNA profiling. S6, Histone                 IO Drug Target module and Immune Cell Typing module
H3, and GAPDH were used to normalize for protein profiling.              (38 antibodies in total). The quantification capability of the
Normalized data were then log-transformed and subject to                approach was assessed by measuring the readouts generated
further analysis. For statistical analyses, paired t-tests (intra-      from three ROIs at different sizes (200 lm, 400 lm, and
slide ROIs) and unpaired t-tests (inter-slide ROIs) were used           600 lm in diameter) (Fig. 2A). For proteins with known expres-
to test differential expression profiles. False discovery rate           sion in HEK293 cells, nCounter counts from ROIs with different
(FDR) was adjusted using the Benjamini-Hochberg method                  sizes showed a linear increase when plotted against the area of
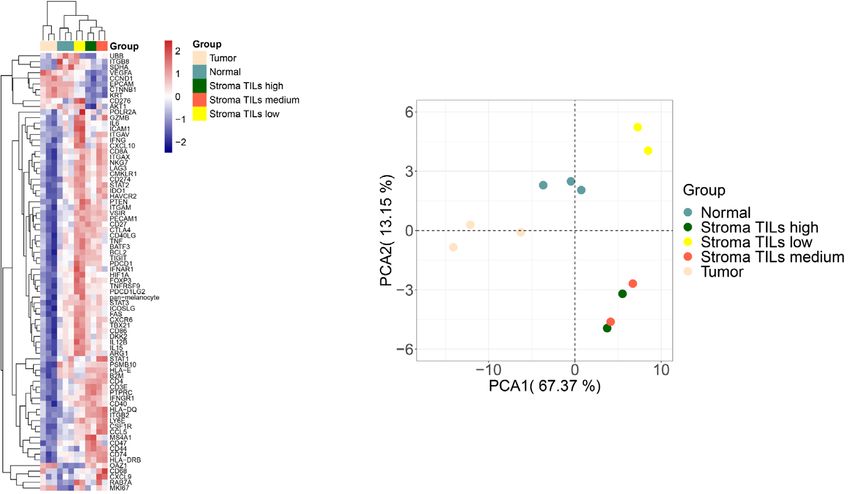
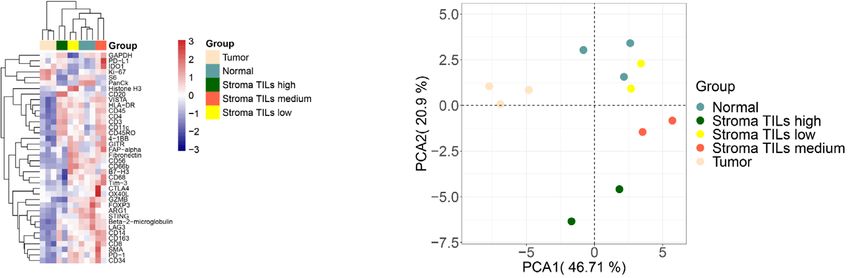
6                                             N. Wang et al.: Vis Cancer Med 2021, 2, 1

Figure 3. Validation of the DSP protein and RNA profiling approaches using colorectal cancer tissues. (A) ROI selection of normal, tumor,
and stromal cells on FFPE tissue slides. Morphology markers (SYTO13 for nuclei staining, blue; Pan-CK for tumor/ epithelial cells, green;
CD45 for immune cells, red) were used to guide 12 ROI selections of tumor, stroma, or normal epithelial cells enriched areas. Based on the
abundance of tumor-infiltrating lymphocytes (TILs), 2 stromal TILs low, 2 stroma TILs medium, and 2 stroma TILs high ROIs were selected.
Two sets of ROIs at the same locations were selected from 2 serial sections of the FFPE tissue for protein and RNA profiling, respectively.
(B) Unsupervised hierarchical clustering of 12 ROIs representing different histological regions (normal epithelial cells, tumor, and stroma)
based on 38-plex protein profiling. ROIs belonging to the same group are color-coded. (C) PCA clustering of different group assignments in
protein profiling. Groups represents ROIs from different histological regions. (D) Unsupervised hierarchical clustering of 12 ROIs representing
different histological regions (normal epithelial cells, tumor, and stroma) based on 78-plex RNA profiling. ROIs belonging to the same group
are color-coded. (E) PCA clustering of different group assignments in RNA profiling. Groups represent ROIs from different histological
regions.
N. Wang et al.: Vis Cancer Med 2021, 2, 1                                               7

the ROIs. Two representative proteins (high and medium count       characterization at this sub-histological resolution. The results
values), Ki-67 (Cor = 0.9771) and Beta-2 microglobulin             showed that the DSP spatial profiling data were of high quality
(Cor = 0.9737) are shown in Figure 2B. Upon housekeeping           and consistent after standard normalization and process. Results
gene normalization using S6, Histone H3, and GAPDH, the            of further analyses including unsupervised hierarchical cluster-
size-oriented effects were removed allowing direct inter-ROI       ing and PCA demonstrated that ROIs from the tumor, stroma/
comparison of protein expression, which in this case had no        immune cells, and normal epithelial cells were grouped into
statistically significant difference as expected (Fig. 2B, lower    distinct clusters, indicating that the specific protein or RNA
panel). On this basis, by pooling normalized counts from three     expression information from different cellular contexts on the
ROIs within each slide, no protein was differentially expressed    slides was precisely captured. Though our demonstrative work
between the duplicated slides under log2 fold-change (Log          is simple, many other sophisticated approaches of DSP usage
FC) > 1 and adjusted p-value < 0.05 as cutoffs (Fig. 2C). Taken    have been demonstrated elsewhere [42, 51–53]. Several ROI
together, our data proved the reliability of the DSP technology    selection strategies are available to suit various research
and ensured our follow-up studies on tissue-based assays.          needs such as global deep profiling for full tissue sections,
                                                                   segmentation mode for precise analysis between tissue com-
                                                                   partments, and rare cell profiling mode [42]. In our experience,
Validation of DSP on colorectal cancer tissues                     even at a low cell input level, DSP could still perform well but
     To gain further insight into the validity of DSP on tissue-   our work is currently limited to cell line data with more to
based assays, we used two serial sections of a colorectal cancer   elucidate at the tissue level and that could hopefully inform
FFPE tissue to allow protein and RNA profiling in parallel to       us more on the technical robustness and multiplexing capacity
directly compare expression at transcript and protein levels.      in the future. Our tissue work aimed to assess the reliability of
To generate biologically meaningful data, we selected 12 ROIs      the assay and by profiling only 12 ROIs with very few repli-
on each slide at different histological regions according to       cates within each group, we were able to show the very clear
fluorescence-guided staining and annotated as different groups      separation of predefined groups (normal, tumor-enriched, and
for clustering analysis. Representative scans and ROIs selected    immune-enriched regions) based on both transcript and protein
are graphically demonstrated in Figure 3A. We first carried         levels proving the assay reliability.
out ROI selection for RNA profiling and then cross-referenced            The latest development of DSP is to couple with NGS and
them to all ROIs for the protein profiling and this ensured a       thus to expand the multiplexing capabilities for RNA profiling
direct in-situ comparison between RNA and protein expression       [42]. Currently, commercially available detectable targets are
at this sub-histological level. For both protein and RNA profil-    around 100 for proteins and 1,800 for RNAs covering
ing, unsupervised hierarchical clustering assigned tumor,          comprehensive key genes in oncology, immune-oncology, as
stroma, and normal epithelial cells into distinct groups.          well as many other pathways in cancer. Future development
(Figs. 3B and 3D). In addition, stroma ROIs with a different       to cover the full gene expression spectrum is underway.
abundance of tumor-infiltrating lymphocytes (TILs) were also             As an innovative research tool, DSP holds multiple attri-
effectively clustered. These clearly defined clusters were also     butes that are unmet by many parallel technologies. First,
reflected by the PCA data with clearly separated tumoral and        accredited by its proprietary barcode technology, it is applicable
stromal groups (Figs. 3C and 3E). Within the stroma compart-       to measuring both proteins and RNA in-situ in a highly quan-
ment, as our ROI selection criteria were primarily based on        titative manner. We have tested in our hand the quantification
immune cell-enriched regions, our data demonstrated a great        capability of DSP for proteogenomic analysis and both levels
concordance as indicated by high CD4, CD3, and CD8 expres-         have shown reliable data respectively. Secondly, this is one
sion at the protein level and CD4 and CD8A at the RNA level.       of the very few technologies dedicated to high-plex FFPE sam-
Again, higher Pan-Ck protein expressions were observed at both     ples profiling at sub-spatial resolution and this significantly
tumor and normal epithelial regions whereas tumor regions          broadens the application potential of the technology [46].
featured relatively higher Ki-67 and AKT indicating high prolif-   Thirdly, customizable fluorescence-guided morphology mark-
erating potentials. Moreover, normal epithelial regions had        ers allow computationally defined segmentation within ROIs
generally higher effective infiltrated immune cells as compared     facilitating further purification of samples and/or rare cells to
to corresponding tumor regions as indicated by the expression of   be analyzed at user’s choices. Lastly, unlike laser captured
Granzyme B and CD8 at the protein level (Fig. 3D). Those find-      microdissection (LCM), samples remain intact during the entire
ings together reconfirmed the robustness of this assay.             workflow allowing other downstream application of samples
                                                                   such as IHC and conventional HE staining. When the slides
                                                                   are available, HE staining is recommended to provide addi-
Discussion                                                         tional information. On the contrary, DSP also bears certain
                                                                   limitations. Its resolution cannot reach the single-cell level
    To validate the DSP technology platform, we performed          though computational-based inference tools may be applied in
DSP spatial profiling for both protein and RNA using FFPE           the near future based on bulk transcription profiling data [54].
colorectal cancer tissues mounted on slides. Regions of Interest   Though near single-cell sensitivity for some specific protein
(ROIs) were selected in the areas enriched with tumor cells,       was achieved by others and in our hands (data not shown), a
stroma/immune cells, or normal epithelial cells on serial          better signal-noise ratio for certain antibody probes may need
sections of the tissue to compare protein data with RNA data.      to be improved, [42]. Currently, an alternative method is to
Currently, no parallel technology could facilitate proteogenomic   select multiple rare cells containing ROIs a user-defined
8 N. Wang et al.: Vis Cancer Med 2021, 2, 1
phenotype group to obtain sufficient counting. Expansion of 9. Nguyen AN, Stebbins EG, Henson M, et al. Normalizing the
protein targets is also essential for higher plexing needs. More- bone marrow microenvironment with p38 inhibitor reduces
over, the future direction of integrating DSP with other spatial multiple myeloma cell proliferation and adhesion and suppresses
analysis software may help obtain multi-dimensional data for osteoclast formation. Exp Cell Res. 2006;312(10):1909–23.
advanced analysis [54]. 10. Sanmamed MF, Chen L. A paradigm shift in cancer
immunotherapy: From enhancement to normalization. Cell.
2019;176(3):677.
Conclusion 11. Weber EW, Maus MV, Mackall CL. The emerging landscape of
immune cell therapies. Cell. 2020;181(1):46–62.
DSP developed by nanoString, is a groundbreaking technol- 12. Kennedy LB, Salama AKS. A review of cancer immunotherapy
ogy providing insights into a wide range of biomedical toxicity. CA Cancer J Clin. 2020;70(2):86–104.
research, especially immuno-oncology and tumor microenvi- 13. Wherry EJ, Blattman JN, Murali-Krishna K, et al. Viral
ronment areas. DSP integrates multiple cutting-edge technolo- persistence alters CD8 T-cell immunodominance and tissue
gies, including high-throughput detection technologies (NGS distribution and results in distinct stages of functional impair-
ment. J Virol. 2003;77(8):4911–27.
or digital optical barcodes), programmable DMD technologies,
and microfluidic sampling, into traditional IHC and RNA in situ 14. Schumacher TN, Schreiber RD. Neoantigens in cancer
immunotherapy. Science. 2015;348(6230):69–74.
hybridization (ISH) approaches, creating an innovative tool for
15. Forde PM, Chaft JE, Smith KN, et al. Neoadjuvant PD-1
spatial-resolved proteomics and transcriptomics analyses on
Blockade in resectable lung cancer. N Engl J Med. 2018;378(21):
FFPE samples as well as fresh frozen tissues. We set up the first 1976–86.
DSP platform in China at MIPCC, FynnBio in 2019, right after
16. Ferris RL, Blumenschein G Jr, Fayette J, et al. Nivolumab
nanoString Technologies launched the technology. As an early for recurrent squamous-cell carcinoma of the head and neck.
method establishment approach, we have validated this innova- N Engl J Med. 2016;375(19):1856–67.
tive technology platform demonstrating the expected sensitivity 17. Kang YK, Boku N, Satoh T, et al. Nivolumab in patients with
and robustness of the approach. We expect that the DSP plat- advanced gastric or gastro-oesophageal junction cancer refractory
form will greatly advance biomedical research especially in to, or intolerant of, at least two previous chemotherapy regimens
immuno-oncology and tumor microenvironment areas. (ONO-4538-12, ATTRACTION-2): a randomised, double-blind,
Though the limitation of numbers of cells in selected ROIs, placebo-controlled, phase 3 trial. Lancet. 2017;390(10111):
discrete cells labeled by specific morphology marker could still 2461–71.
be collected and counted sufficiently. Currently, up to 2,000 18. Schachter J, Ribas A, Long GV, et al. Pembrolizumab versus
RNAs could be detected for each ROI because of the replace- ipilimumab for advanced melanoma: final overall survival
ment of the readout method, and panels for the entire transcrip- results of a multicentre, randomised, open-label phase 3 study
tome or even genome could go into service in the foreseeable (KEYNOTE-006). Lancet. 2017;390(10105):1853–62.
future. 19. El-Khoueiry AB, Sangro B, Yau T, et al. Nivolumab in patients
with advanced hepatocellular carcinoma (CheckMate 040): an
open-label, non-comparative, phase 1/2 dose escalation and
Conflict of interest expansion trial. Lancet. 2017;389(10088):2492–502.
20. Ribas A, Wolchok JD. Cancer immunotherapy using checkpoint
The authors declare that they have no conflict of interest.
blockade. Science. 2018;359(6382):1350–5.
21. Yarchoan M, Hopkins A, Jaffee EM. Tumor mutational burden
and response rate to PD-1 inhibition. N Engl J Med. 2017;
References
377(25):2500–1.
22. Lu S, Stein JE, Rimm DL, et al. Comparison of biomarker
1. Maman S, Witz IP. A history of exploring cancer in context. Nat modalities for predicting response to PD-1/PD-L1 checkpoint
Rev Cancer. 2018;18(6):359–76. blockade: A systematic review and meta-analysis. JAMA
2. Joyce JA, Pollard JW. Microenvironmental regulation of Oncol. 2019;5(8):1195–1204.
metastasis. Nat Rev Cancer. 2009;9(4):239–52. 23. Tumeh PC, Harview CL, Yearley JH, et al. PD-1 blockade
3. Ghirelli C, Hagemann T. Targeting immunosuppression for induces responses by inhibiting adaptive immune resistance.
cancer therapy. J Clin Invest. 2013;123(6):2355–7. Nature. 2014;515(7528):568–71.
4. Kroemer G, Galluzzi L, Kepp O, et al. Immunogenic cell death 24. Spranger S, Luke JJ, Bao R, et al. Density of immunogenic
in cancer therapy. Annu Rev Immunol. 2013;31:51–72. antigens does not explain the presence or absence of the T-cell-
5. Shiao SL, Coussens LM. The tumor-immune microenvironment inflamed tumor microenvironment in melanoma. Proc Natl
and response to radiation therapy. J Mammary Gland Biol Acad Sci USA. 2016;113(48):E7759–E68.
Neoplasia. 2010;15(4):411–21. 25. Danilova L, Wang H, Sunshine J, et al. Association of PD-1/
6. Katz OB, Shaked Y. Host effects contributing to cancer therapy PD-L axis expression with cytolytic activity, mutational load,
resistance. Drug Resist Updat. 2015;19:33–42. and prognosis in melanoma and other solid tumors. Proc Natl
7. Pegram M, Slamon D. Biological rationale for HER2/neu Acad Sci USA. 2016;113(48):E7769–E77.
(c-erbB2) as a target for monoclonal antibody therapy. Semin 26. Chen DS, Mellman I. Elements of cancer immunity and the
Oncol. 2000;27(5 Suppl 9):13–9. cancer-immune set point. Nature. 2017;541(7637):321–30.
8. Jain RK. Normalizing tumor microenvironment to treat cancer: 27. Zhang Y, Chen L. Classification of advanced human cancers
bench to bedside to biomarkers. J Clin Oncol. 2013;31(17): based on Tumor Immunity in the MicroEnvironment (TIME) for
2205–18. cancer immunotherapy. JAMA Oncol. 2016;2(11):1403–4.N. Wang et al.: Vis Cancer Med 2021, 2, 1 9
28. Murciano-Goroff YR, Warner AB, Wolchok JD. The future of 43. Lee J, Geiss GK, Demirkan G, et al. Implementation of a
cancer immunotherapy: microenvironment-targeting combina- multiplex and quantitative proteomics platform for assessing
tions. Cell Res. 2020;30(6):507–19. protein lysates using DNA-barcoded antibodies. Mol Cell
29. Harrington KJ, Puzanov I, Hecht JR, et al. Clinical development Proteomics. 2018;17(6):1245–58.
of talimogene laherparepvec (T-VEC): a modified herpes 44. Geiss GK, Bumgarner RE, Birditt B, et al. Direct multiplexed
simplex virus type-1-derived oncolytic immunotherapy. Expert measurement of gene expression with color-coded probe pairs.
Rev Anticancer Ther. 2015;15(12):1389–403. Nat Biotechnol. 2008;26(3):317–25.
30. Pan RY, Chung WH, Chu MT, et al. Recent development and 45. Beechem JM. High-plex spatially resolved rna and protein
clinical application of cancer vaccine: targeting neoantigens. detection using digital spatial profiling: A technology designed
J Immunol Res. 2018;2018:4325874. for immuno-oncology biomarker discovery and translational
31. Lin JR, Izar B, Wang S, et al. Highly multiplexed immunoflu- research. Methods Mol Biol. 2020;2055:563–83.
orescence imaging of human tissues and tumors using t-CyCIF 46. Decalf J, Albert ML, Ziai J. New tools for pathology: a user’s
and conventional optical microscopes. Elife. 2018;7. review of a highly multiplexed method for in situ analysis of
32. Stack EC, Wang C, Roman KA, et al. Multiplexed immuno- protein and RNA expression in tissue. J Pathol. 2019;247(5):
histochemistry, imaging, and quantitation: a review, with an 650–61.
assessment of Tyramide signal amplification, multispectral 47. Toki MI, Merritt CR, Wong PF, et al. High-plex predictive
imaging and multiplex analysis. Methods. 2014;70(1):46–58. marker discovery for melanoma immunotherapy-treated patients
33. Dixon AR, Bathany C, Tsuei M, et al. Recent developments in using digital spatial profiling. Clin Cancer Res. 2019;25(18):
multiplexing techniques for immunohistochemistry. Expert Rev 5503–12.
Mol Diagn. 2015;15(9):1171–86. 48. Zugazagoitia J, Gupta S, Liu Y, et al. Biomarkers associated
34. Walch A, Rauser S, Deininger SO, et al. MALDI imaging mass with beneficial PD-1 checkpoint blockade in Non-Small-Cell
spectrometry for direct tissue analysis: a new frontier for Lung Cancer (NSCLC) identified using high-plex digital spatial
molecular histology. Histochem Cell Biol. 2008;130(3):421–34. profiling. Clin Cancer Res. 2020.
35. Giesen C, Wang HA, Schapiro D, et al. Highly multiplexed 49. Sautes-Fridman C, Petitprez F, Calderaro J, et al. Tertiary
imaging of tumor tissues with subcellular resolution by mass lymphoid structures in the era of cancer immunotherapy. Nat
cytometry. Nat Methods. 2014;11(4):417–22. Rev Cancer. 2019;19(6):307–25.
36. Aichler M, Walch A. MALDI Imaging mass spectrometry: 50. Helmink BA, Reddy SM, Gao J, et al. B cells and tertiary
current frontiers and perspectives in pathology research and lymphoid structures promote immunotherapy response. Nature.
practice. Lab Invest. 2015;95(4):422–31. 2020;577(7791):549–55.
37. Ahmed M, Broeckx G, Baggerman G, et al. Next-generation 51. Amaria RN, Reddy SM, Tawbi HA, et al. Neoadjuvant immune
protein analysis in the pathology department. J Clin Pathol. checkpoint blockade in high-risk resectable melanoma. Nat
2020;73(1):1–6. Med. 2018;24(11):1649–54.
38. Angelo M, Bendall SC, Finck R, et al. Multiplexed ion beam 52. Rozeman EA, Prevoo W, Meier MAJ, et al. Phase Ib/II trial
imaging of human breast tumors. Nat Med. 2014;20(4):436–42. testing combined radiofrequency ablation and ipilimumab in
39. Wang F, Flanagan J, Su N, et al. RNAscope: a novel in situ uveal melanoma (SECIRA-UM). Melanoma Res. 2020;30(3):
RNA analysis platform for formalin-fixed, paraffin-embedded 252–60.
tissues. J Mol Diagn. 2012;14(1):22–9. 53. Farren MR, Sayegh L, Ware MB, et al. Immunologic alterations
40. Stahl PL, Salmen F, Vickovic S, et al. Visualization and in the pancreatic cancer microenvironment of patients treated
analysis of gene expression in tissue sections by spatial with neoadjuvant chemotherapy and radiotherapy. JCI. Insight.
transcriptomics. Science. 2016;353(6294):78–82. 2020;5(1).
41. Vickovic S, Eraslan G, Salmen F, et al. High-definition spatial 54. Koelzer VH, Sirinukunwattana K, Rittscher J, et al. Precision
transcriptomics for in situ tissue profiling. Nat Methods. immunoprofiling by image analysis and artificial intelligence.
2019;16(10):987–90. Virchows Arch. 2019;474(4):511–22.
42. Merritt CR, Ong GT, Church SE, et al. Multiplex digital spatial 55. Van TM, Blank CU. A user’s perspective on GeoMxTM digital
profiling of proteins and RNA in fixed tissue. Nat Biotechnol. spatial profiling. Immuno-Oncol Technol. 2019;1:11–8.
2020;38(5):586–99.
Cite this article as: Wang N, Wang R, Zhang X, Li X, Liang Y & Ding Z. Spatially-resolved proteomics and transcriptomics: An
emerging digital spatial profiling approach for tumor microenvironment. Visualized Cancer Medicine. 2021; 2, 1.You can also read