High cut off dialysis mitigates pro calcific effects of plasma on vascular progenitor cells - Nature
←
→
Page content transcription
If your browser does not render page correctly, please read the page content below
www.nature.com/scientificreports
OPEN High cut‑off dialysis mitigates
pro‑calcific effects of plasma
on vascular progenitor cells
Theres Schaub1,2, Daniel Janke1, Daniel Zickler1, Claudia Lange3, Matthias Girndt4,
Ralf Schindler1, Duska Dragun1,5,6* & Björn Hegner1,5,6,7*
Mortality of patients with end-stage renal disease tremendously exceeds that of the general
population due to excess cardiovascular morbidity. Large middle-sized molecules (LMM) including
pro-inflammatory cytokines are major drivers of uremic cardiovascular toxicity and cannot be removed
sufficiently by conventional high-flux (HFL) hemodialysis. We tested the ability of plasma from 19
hemodialysis patients participating in a trial comparing HFL with high cut-off (HCO) membranes
facilitating removal of LMM to induce calcification in mesenchymal stromal cells (MSC) functioning
as vascular progenitors. HCO dialysis favorably changed plasma composition resulting in reduced
pro-calcific activity. LMM were removed more effectively by HCO dialysis including FGF23, a typical
LMM we found to promote osteoblastic differentiation of MSC. Protein-bound uremic retention
solutes with known cardiovascular toxicity but not LMM inhibited proliferation of MSC without
direct toxicity in screening experiments. We could not attribute the effect of HCO dialysis on MSC
calcification to distinct mediators. However, we found evidence of sustained reduced inflammation
that might parallel other anti-calcifying mechanisms such as altered generation of extracellular
vesicles. Our findings imply protection of MSC from dysfunctional differentiation by novel dialysis
techniques targeted at removal of LMM. HCO dialysis might preserve their physiologic role in vascular
regeneration and improve outcomes in dialysis patients.
Despite advances over the last decades, morbidity and mortality in patients with end-stage renal disease (ESRD)
especially due to cardiovascular complications remain unacceptably h igh1. A plethora of life-style interventions
and pharmacologic therapies targeting traditional cardiovascular risk factors such as hypertension, diabetes and
hypercholesterolemia as well as nontraditional risk factors including disturbed calcium-phosphate-parathyroid
hormone metabolism have been studied but only few of them have proven b eneficial2. Thus, the uremic syn-
drome, caused by about 150 known and probably many more unknown uremic retention solutes (URS) with
roperties3, remains an unsolved medical problem. While current dialysis procedures
a large variety of toxic p
effectively remove small water soluble molecules up to 15 kDa, members of two other classes of URS, large mid-
dle molecules (LMM) with a molecular weight > 15 kDa and protein bound molecules (PBM), are difficult to
be removed. Yet, many LMM and PBM including pro-inflammatory cytokines, parathyroid hormone, p-cresyl
sulfate and indoxyl sulfate have been identified as major drivers of pathologies associated with the uremic
syndrome3. Hemodiafiltration (HDF) had been developed to remove LMM more efficiently but there is increas-
ing evidence that HDF does not provide a survival advantage over conventional high-flux (HFL) hemodialysis
independently of convective volumes in clinical p ractice4. An alternative promising strategy with recent technical
advances is enhanced removal of LMM by dialysis membranes with higher molecular weight cut-offs (HCO)
between 50 and 60 kDa similar to healthy kidneys5. As an example, this approach has been shown to reduce
1
Clinic for Nephrology and Intensive Care Medicine, Charité – Universitätsmedizin Berlin, Corporate Member of
Freie Universität Berlin, Humboldt-Universität Zu Berlin, and Berlin Institute of Health, Campus Virchow‑Clinic,
Augustenburger Platz 1, 13353 Berlin, Germany. 2Institute of Cell Biology and Neurobiology, Charité –
Universitätsmedizin Berlin, Corporate Member of Freie Universität Berlin, Humboldt-Universität Zu Berlin, and
Berlin Institute of Health, Berlin, Germany. 3Clinic for Stem Cell Transplantation, Department of Cell and Gene
Therapy, University Medical Center Hamburg-Eppendorf, Hamburg, Germany. 4Department of Internal Medicine
II, Martin-Luther-University Halle-Wittenberg, Halle, Germany. 5Berlin-Brandenburg School for Regenerative
Therapies (BSRT), Berlin, Germany. 6Center for Cardiovascular Research (CCR), Charité University Hospital, Berlin,
Germany. 7Vivantes Ida Wolff Hospital for Geriatric Medicine, Juchaczweg 21, 12351 Berlin, Germany. *email:
duska.dragun@charite.de; bjoern.hegner@gmx.de
Scientific Reports | (2021) 11:1144 | https://doi.org/10.1038/s41598-020-80016-7 1
Vol.:(0123456789)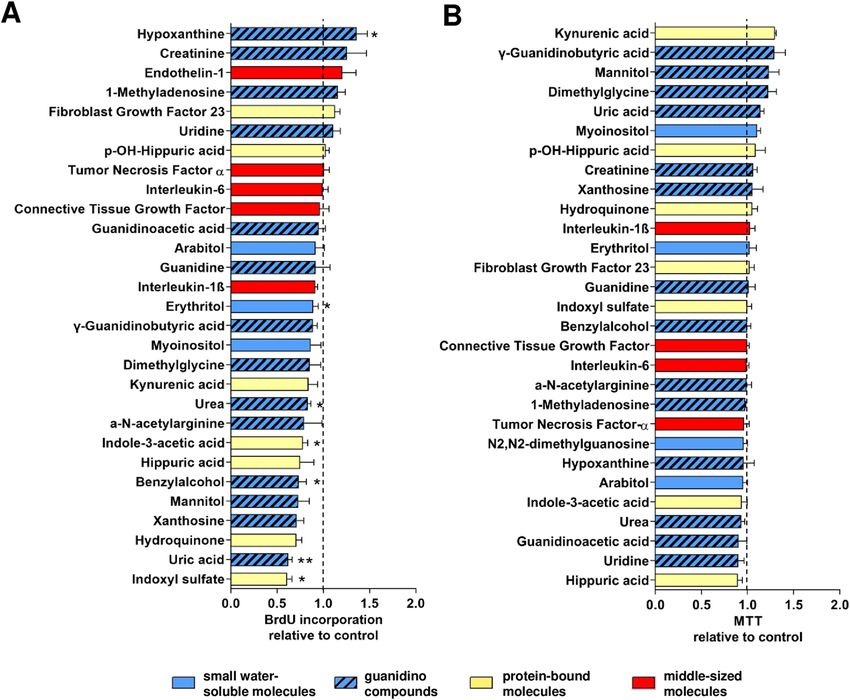
www.nature.com/scientificreports/
systemic inflammation in maintenance hemodialysis p atients6, but effects on cardiovascular pathologies and
clinical end-points have not been studied in detail.
Severe calcification of the tunica intima and tunica media of arteries, the hallmark of uremic vasculopathy,
is a key determinant of cardiovascular risk in ESRD7. Vascular regeneration depends on local vascular precur-
ericytes8,9, that can differentiate into mature vascular cells such as vascular smooth muscle cells
sor cells, the p
(VSMC) and are replenished by mesenchymal stromal cells (MSC)10. MSC are progenitor cells residing in a
perivascular niche11 that can be isolated from all vascularized tissues12. They feature multi-lineage differentiation
potential including VSMC13 and osteoblast phenotypes in combination with high regenerative capacity also for
the vasculature14. Active transformation of VSMC to calcifying cells with an osteoblast-like phenotype similar
to intramembranous and enchondral bone formation is a key process in arterial c alcification7,15. Yet, a majority
of osteoblast-like cells in calcifying intimal and medial vascular lesions forming in a mouse model of chronic
kidney disease have been found to be derived from MSC-like cells in the arterial a dventitia16. Thus, protection
of the undifferentiated physiologic state of MSC preserving their regenerative properties holds promise to offset
accelerated vascular calcification in patients suffering from chronic kidney disease more effectively than strate-
gies solely targeted at VSMC with a terminally differentiated phenotype.
In a previous study, we identified the three LMM interleukin-1β (IL-1β), tumor necrosis factor-α (TNF-α),
and fibroblast growth factor-2 (FGF-2) as the strongest inducers of osteoblastic transformation of MSC in an
unbiased screening approach testing 63 individual URS17. Pharmacologic blockade of IL-1β, TNF-α and FGF
in combination potently protected MSC from calcifying phenotype c onversion17. However, clinical application
of small-molecules or biological agents targeting multiple pro-inflammatory cytokines and FGF-2 can be costly
and associated with considerable side effects. Enhanced removal of LMM by HCO dialysis holds promise to pre-
serve MSC regenerative capacity without excessive costs and risks. In this report, we describe the effects of HCO
dialysis on osteoblastic differentiation and calcification of MSC and investigate possible protective mechanisms.
Results
Dialysis with HCO membranes reduces the ability of patient plasma to induce osteoblastic dif‑
ferentiation in MSC. We had access to sera from a subgroup of 19 patients participating in a randomized
controlled clinical trial testing conventional HFL dialyzers against dialyzers characterized by a higher molecular
weight cut-off (HCO; Fig. 1A) in maintenance hemodialysis6. In a cross over-design as shown in Fig. 1B, stable
dialysis patients were first treated with an HFL membrane for 2 weeks (equilibration 1) and were then divided
into 2 groups: One group was continued on the HFL membrane while the other group was switched to an HCO
membrane for 3 weeks (experimental phase 1). After a wash out-phase of 2 weeks where all patients were dia-
lyzed with the HFL membrane (equilibration 2), patients that were treated with the HFL membrane in experi-
mental phase 1 received the HCO membrane in experimental phase 2 whereas patients treated with the HCO
membrane in experimental phase 1 were now continued on the HFL dialyzer for another 3 weeks (experimental
phase 2). To specifically study the effects of these different dialysis modalities on osteoblastic transformation and
calcification of vascular progenitors, we took advantage of an in vitro model using human MSC isolated from
bone marrow aspirates of 20 healthy donors as described e arlier17. Pre-dialysis plasma after 3 weeks of dialysis
with either an HFL membrane or with an HCO membrane was tested.
Overall, the potential for induction of osteoblastic differentiation in MSC was reduced in plasma obtained
under HCO dialysis compared to HFL dialysis as indicated by ALP activity (51.52 ± 2.2 U/g protein versus
72.08 ± 5.3 U/g protein; Fig. 2A). Paired analysis of the two samples from each patient revealed that ALP activ-
ity was lower after exposure to HCO-plasma compared to HFL-plasma for every individual patient (Fig. 2B).
Reduction rates varied between 0.02 and 0.61 (Fig. 2B). Calcium deposition was also decreased when MSC were
exposed to plasma from patients treated with HCO membranes compared to plasma obtained during a period
of HFL dialysis (60.2 ± 5.8 µg/mg protein versus 95.4 ± 6.5 µg/mg protein; Fig. 2C). Similar to ALP activity, this
result was found for every single patient with reduction rates in a range from 0.09 to 0.68 (Fig. 2D). To exclude
the possibility that the observed effects depended on the MSC preparation used in the experiments, we combined
the plasmas from all 19 patients to 4 different plasma pools that were all applied to MSC preparations from 4 dif-
ferent donors. Again, ALP activity and calcium deposition were lower when cells were exposed to HCO-plasma
pools in comparison to HFL-plasma pools independently of the MSC preparation (Fig. 2E,G). The same effect
was seen for every single combination (Fig. 2F,H).
HCO dialysis reduces mediators with a molecular weight between 24 and 66 kDa more effec‑
tively than HFL dialysis. An in-depth re-analysis of a broad panel of 33 mediators with potential impact
on vascular calcification in chronic kidney disease (CKD) from the original study6 together with eight addi-
tional molecules covering a molecular weight range from 2.7 to 2500 kDa was performed on the plasma of the
patients included in this sub-study to reveal potential mechanisms of reduced MSC osteoblastic differentiation.
Standard clinical chemistry differed only with respect to albumin (66 kDa) which was lower in plasma obtained
after 3 weeks of HCO dialysis than at baseline or after 3 weeks of HFL dialysis (Table 1). Several mediators with
a molecular weight up to 22.5 kDa were reduced after a single dialysis with both HFL or HCO membranes (IL-
8, leptin, TNF-α, free light chain kappa (FLCκ); Table 2, Fig. 3). However, reduction rates for leptin and FLCκ
were significantly higher with HCO dialysis (Fig. 3B,D). MCP-1 was decreased only after treatment with HCO
membranes (Table 2, Fig. 4A). In the segment between 24.5 and 61 kDa, only free light chain lambda (FLCλ) was
significantly reduced by HFL dialysis while a single HCO dialysis resulted in lower levels of 8 mediators includ-
ing sIL-2RA, FGF23, IL-12p40, sTNFR2, sFAS, FLCλ, sTNFR1, and µPAR (Table 2). Reduction rates for all 8
molecules were higher with HCO than with HFL membranes (Figs. 3E, 4B–H). Importantly, concentrations of
sIL-2RA, FLCλ, and sTNFR1 were significantly lower in plasma obtained pre-dialysis after 3 weeks of treatment
Scientific Reports | (2021) 11:1144 | https://doi.org/10.1038/s41598-020-80016-7 2
Vol:.(1234567890)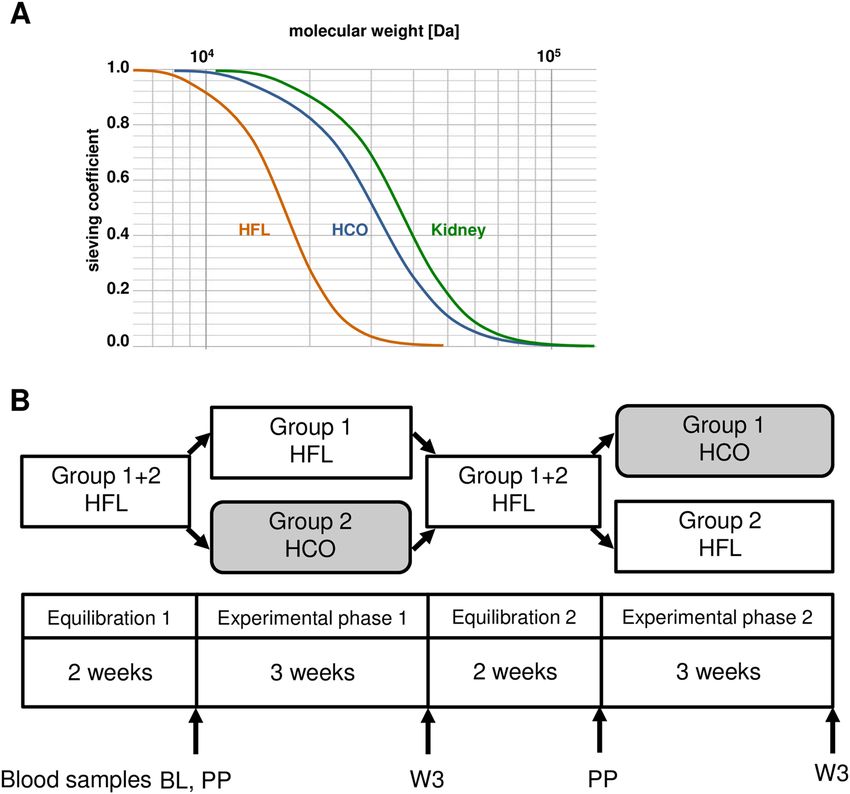
www.nature.com/scientificreports/
Figure 1. Clinical trial comparing HFL with HCO dialysis membranes. (A) Scheme showing the elimination
characteristics of HFL and HCO membranes in comparison to healthy kidneys with sieving coefficient plotted
against molecular weight. (B) Cross over-design of the randomized study with 2 cycles of equilibration and
experimental phases. BL: Baseline blood samples for clinical chemistry drawn pre-dialysis at the first dialysis
session of experimental phase 1. PP: Experimental blood samples drawn pre- and post-dialysis at the first
dialysis session of experimental phases 1 and 2. W3: Experimental blood samples drawn pre-dialysis at the first
dialysis session after completion of the 3-week experimental phases 1 and 2.
with HCO membranes than after 3 weeks with HFL membranes suggesting a long-lasting effect (Table 2). These
results indicate superior removal of molecules accumulating in CKD including pro-inflammatory cytokines by
HCO dialysis especially in the range of 24.5 to 66 kDa corresponding to LMM.
On the other hand, the concentrations of some mediators particularly in the low molecular weight range were
increased after either HFL or HCO dialysis or both (Table 2) reflected by negative reduction rates (Fig. 5). Most of
these mediators were pro-inflammatory cytokines (Rantes, MIP-1β, IL-2) or related to a pro-inflammatory state
(hepcidin, sCD40L, oxLDL). IL-10 was the only anti-inflammatory mediator in this group and showed higher
levels after a single HFL dialysis as well as after 3 weeks of HFL dialysis (Table 2) since the reduction rate was
lower in the negative range compared to HCO dialysis (Fig. 5A). The only mediator with higher concentrations
after 3 weeks of HCO dialysis was oxLDL (Table 2).
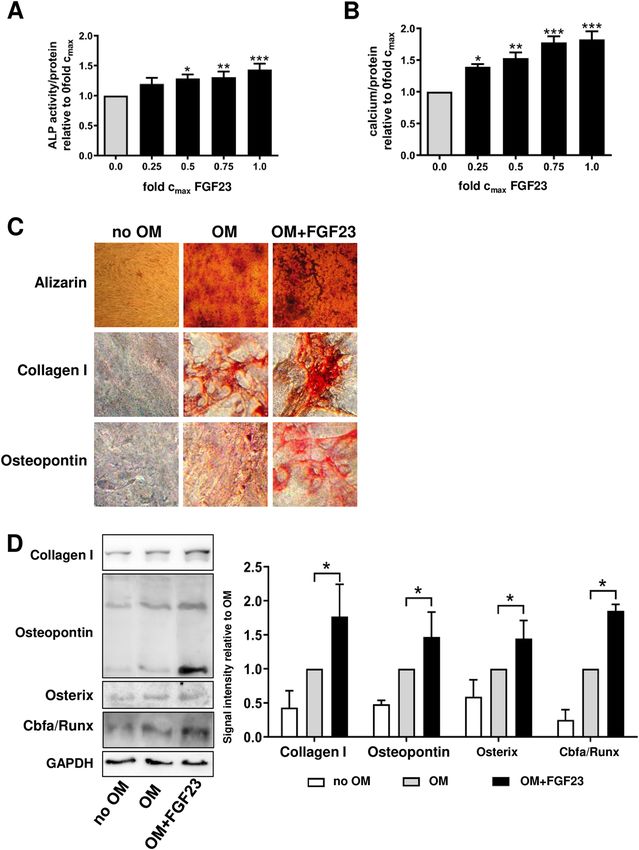
FGF23 is a LMM capable of inducing osteoblastic differentiation in MSC. We asked, whether
or not FGF23, a prototypical mediator of the LMM group characterized by a higher reduction rate with HCO
compared to HFL membranes and significant removal by HCO dialysis, exerted pro-calcifying effects on MSC
similar to IL-1β and TNF-α that had been identified as potent promotors of MSC calcification17. MSC have
been shown to express FGF receptors 1–4 that signal upon binding of FGF2318–20. Incubation of MSC with
FGF23 resulted in a dose-dependent increase in ALP activity (Fig. 6A) and deposition of calcified extracellular
matrix (Fig. 6B,C). FGF23 treated cells stained positive for collagen I and osteopontin (Fig. 6C). These osteoblast
marker proteins as well as Osterix and Cbfa/Runx were markedly upregulated as demonstrated by western blot
analysis (Fig. 6D) indicating osteoblastic differentiation of MSC enhanced by FGF23.
Screening of individual URS for proliferation and toxicity. Since vascular calcification is not only
driven by osteoblastic differentiation of vascular cells and their progenitors but also by other mechanisms such
Scientific Reports | (2021) 11:1144 | https://doi.org/10.1038/s41598-020-80016-7 3
Vol.:(0123456789)www.nature.com/scientificreports/
Figure 2. Effect of dialysis with HCO membranes on plasma induced osteoblast differentiation and calcification
of MSC. (A–D) MSC were incubated with OM containing plasma from dialysis patients treated either with
conventional HFL dialyzers or from the same patients after a 3-week course of dialysis with HCO membranes.
n = 19. (A,B) ALP activity and (C,D) calcium deposition normalized to protein content measured on single-
patient level. (B) ALP activity and (D) calcium deposition with HCO plasma relative to HFL plasma (set to 1.0)
showing reduced osteoblastic differentiation and calcium deposition for every single patient. (E–H) Plasma
from all 19 patients were combined to 4 different plasma pools for both treatment modalities. Each plasma pool
was applied to 4 MSC preparations from different healthy donors. n = 16. (E,F) ALP activity and (G,H) calcium
deposition were normalized to protein content. (F) ALP activity and (H) calcium deposition with HCO plasma
relative to HFL plasma (set to 1.0) showing reduced osteoblastic differentiation and calcium deposition for
every single combination of a plasma pool and MSC preparation. ALP activity was assessed after incubation for
7 days. Calcium deposition was measured after incubation for 3 weeks. ***P < 0.001.
as proliferation and cell death21 we extended our screening approach for biologic effects of URS on MSC. Prolif-
eration of MSC in response to 29 individual URS at their highest reported concentration found in patients with
ESRD3,22–27 was tested by measuring BrdU incorporation. Hypoxanthine increased proliferation by 36% (Fig. 7A)
whereas erythritol, urea, benzyl alcohol, and uric acid, four other water soluble URS, reduced proliferation by
Scientific Reports | (2021) 11:1144 | https://doi.org/10.1038/s41598-020-80016-7 4
Vol:.(1234567890)www.nature.com/scientificreports/
Reference Baseline HFL HCO P Kruskal–Wallis
Sodium mmol/L 135–145 139 (137; 140) 138 (136; 139) 138 (137; 140) 0.494
Potassium mmol/L 3.6–4.8 5.6 (4.6; 6.2) 5.5 (4.8; 6.2) 5.7 (4.6; 6.0) 0.962
Calcium mmol/L 2.20–2.60 2.29 (2.19; 2.37) 2.25 (2.14; 2.39) 2.13 (2.03; 2.27) 0.077
Phosphate mmol/L 0.8–1.5 1.5 (1.2; 1.8) 1.7 (1.4; 1.9) 1.8 (1.4; 2.0) 0.392
Creatinine µmol/L 44–106 675 (562; 871) 688 (575; 851) 682 (605; 860) 0.986
Urea mmol/L 1.7–9.3 19.4 (16.0; 22.1) 19.4 (13.7; 22.7) 15.8 (13.1; 20.2) 0.087
CRP mg/LVol:.(1234567890)
Scientific Reports |
1st dialysis HFL 1st dialysis HCO 3 weeks HFL 3 weeks HCO
MW
(2021) 11:1144 |
Substance (kDa) Pre-dialysis M (LQ; UQ) Post-dialysis M (LQ; UQ) P Pre-dialysis M (LQ; UQ) Post-dialysis M (LQ; UQ) P Pre-dialysis M (LQ; UQ) Pre-dialysis M (LQ; UQ) P
404,230 (254,132; 283,698 (184,481;
Hepcidin 2,7 342,011 (194,235; 528,690) 335,465 (215,773; 708,317) 653,607) 515,155 (280,154; 850,283) * 530,866) 351,833 (231,874; 587,840)
Insulin 5,8 726.2 (523.8; 941.5) 498.8 (324.2; 737.0) 479.6 (281.0; 1079.0) 483.2 (221.9; 629.4) 468.2 (157.9; 991.5) 436.2 (331.5; 725.3)
www.nature.com/scientificreports/
IL-8 8 12.70 (9.40; 20.70) 9.80 (6.30; 12.45) ** 13.00 (8.70; 18.60) 7.90 (6.15; 12.95) *** 13.50 (10.00; 18.85) 17.00 (8.55; 27.80)
Rantes 8 5.1 (2.8; 8.7) 8.3 (3.1; 17.0) 3.4 (2.0; 10.1) 15.2 (4.7; 25.5) *** 8.3 (3.1; 17.0) 5.3 (3.9; 11.8)
MIP-1α 8 14.00 (11.85; 17.53) 14.45 (12.35; 21.83) 13.65 (10.88; 16.80) 14.25 (11.23; 23.03) 13.20 (11.08; 16.90) 14.55 (12.60; 24.75)
MIP-1β 8 33.85 (16.75; 55.53) 42.55 (36.10; 71.05) ** 28.70 (16.58; 60.43) 52.05 (26.20; 63.95) *** 25.50 (16.88; 49.05) 29.30 (15.10; 62.10)
C3a 10 114.7 (85.0; 184.9) 127.5 (102.8; 224.0) 130.6 (80.8; 224.3) 136.8 (106.4; 172.5) 109.1 (96.8; 144.5) 109.9 (70.9; 167.9)
GRO 11 227.6 (110.0; 285.7) 160.7 (104.4; 359.5) 217.1 (129.9; 314.9) 192.2 (119.2; 357.9) 227.1 (126.9; 389.5) 219.8 (162.9; 378.0)
MCP-1 14 363.5 (232.8; 509.0) 381.5 (256.6; 495.7) 395.2 (258.9; 525.4) 275.2 (192.9; 367.8) ** 373.2 (255.8; 499.5) 357.3 (224.8; 462.6)
IL-2 15,5 3.4 (0.8; 36.1) 4.4 (0.8; 35.9) 2.3 (0.6; 20.7) 5.6 (1.6; 31.6) ** 2.1 (0.8; 28.8) 4.4 (2.8; 24.0)
Leptin 16 19.50 (6.58; 63.80) 13.45 (4.53; 44.85) ** 19.80 (6.73; 73.03) 10.35 (4.88; 33.80) *** 21.95 (5,85; 75.78) 17.15 (5.23; 57.28)
TNF-α 17 22.45 (18.88; 24.05) 14.20 (10.15; 16.63) *** 21.85 (16.50; 24.73) 12.25 (7.93; 16.60) *** 19.45 (17.78; 25.43) 21.15 (17.45; 25.03)
IL-4 17 3.5 (3.1; 5.5) 3.1 (1.8; 8.1) 0.9 (0.8; 12.4) 3.4 (1.6; 10.9) 2.4 (1.2; 4.8) 2.1 (1.4; 5.4)
IL-1RA 17 58.4 (20.8; 258.7) 49.9 (22.2; 321.7) 40.8 (17.3; 283.6) 51.6 (20.0; 435.7) 42.8 (10.4; 296.9) 24.1 (10.0; 224.5)
IL-1β 17,5 0.80 (0.30; 2.70) 2.00 (0.53; 5.93) 6.05 (2.40; 9.70) 2.25 (1.13; 7.80) 3.25 (0.48; 8.43) 1.90 (1.05; 10.55)
sCD40L 18 616.5 (436.3; 956.1) 1152.0 (710.0; 1964.0) *** 658.0 (506.1; 1134.0) 1037.0 (754.7; 1543.0) 701.7 (493.2; 861.4) 651.1 (361.1; 790.4)
FLCκ 22,5 114.5 (87.2; 177.5) 58.5 (42.1; 77.2) *** 125.5 (95.8; 218.0) 33.8 (21.2; 42.6) *** 118.0 (84.4; 154.0) 99.8 (73.2; 130.3)
GMCSF 24,5 7.0 (2.1; 18.9) 5.6 (2.6; 24.2) 9.1 (3.6; 33.6) 9.2 (1.8; 30.0) 5.6 (2.6; 24.2) 3.6 (1.7; 20.2)
sIL-2RA 24,8 85.0 (70.0; 201.6) 115.6 (83.6; 145.6) 125.2 (78.8; 194.4) 74.1 (45.0; 94.1) *** 143.7 (83.2; 205.7) 89.2 (50.9; 121.7) *
IFN-γ 25 4.90 (1.23; 23.90) 4.40 (1.18; 22.95) 2.80 (0.85; 20.18) 7.85 (0.88; 18.25) 5.35 (1.25; 14.58) 2.40 (1.05; 25.65)
IL-6 28 5.6 (2.8; 11.5) 5.9 (2.9; 9.1) 6.1 (3.1; 10.7) 5.9 (3.5; 8.8) 5.8 (2.4; 12.9) 5.1 (2.9; 12.3)
FG23 32 830.4 (211.9; 3606.0) 439.9 (179.1; 2127.0) 316.4 (169.6; 2426.0) 285.1 (102.7; 814.4) * 650.4 (262.4; 2109.0) 577.4 (188.2; 2983.0)
IL-17A 35 1.65 (0.65; 8.65) 2.40 (0.95; 7.25) 1.15 (0.45; 8.18) 2.05 (0.28; 6.40) 1.80 (0.60; 7.35) 1.20 (0.35; 15.80)
IL-10 36 2.05 (1.63; 4.25) 4.20 (2.43; 6.54) * 1.95 (1.63; 4.05) 2.75 (1.75; 4.75) 3.35 (1.70; 5.95) 2.05 (1.40; 5.08) *
MIF 37 10.7 (5.9; 28.3) 16.3 (6.5; 29.4) 16.2 (10.6; 24.2) 10.6 (5.8; 26.5) 11.6 (6.6; 23.7) 8.8 (3.2; 25.9)
sRAGE 40 1.65 (0.98; 3.73) 2.20 (1.20; 3.55) 1.85 (1.05; 3.78) 2.30 (1.00; 3.00) 1.75 (1.08; 4.58) 1.60 (0.83; 3.18)
https://doi.org/10.1038/s41598-020-80016-7
IL-12p40 40 35.85 (20.83; 51.10) 34.15 (19.53; 57.95) 30.80 (23.65; 60.03) 18.75 (12.30; 40.38) * 38.30 (21.20; 51.70) 30.35 (16.20; 60.13)
sTNFR2 42 14.80 (12.05; 17.35) 16.00 (13.53; 17.93) 15.65 (12.50; 18.45) 12.35 (9.30; 14.03) *** 14.60 (12.08; 17.55) 13.00 (11.85; 17.60)
sFAS 43 3.15 (2.78; 3.83) 3.70 (2.75; 4.10) 3.40 (2.23; 4.33) 2.60 (2.00; 3.15) * 3.55 (2.88; 4.48) 4.05 (3.10; 5.18)
FLCλ 45 76.2 (61.8; 102.5) 60.4 (44.7; 81.3) *** 76.2 (62.7; 105.2) 22.3 (18.5; 37.9) *** 74.1 (60.9; 97.4) 59.2 (50.9; 75.5) **
suPAR 47,5 6299 (5206; 7165) 5771 (5187; 8841) 6630 (5101; 7510) 3499 (3291; 5436) ** 6317 (5625; 6689) 5809 (4792; 7604)
sIL-6R 50 30.75 (23.63; 37.48) 31.00 (25.10; 37.13) 28.65 (26.75; 34.98) 27.65 (23.93; 35.90) 30.35 (26.50; 37.63) 31.55 (26.58; 35.98)
PLA2G7 50 150.1 (81.3; 231.7) 136.8 (96.6; 197.8) 138.8 (90.7; 269.0) 142.2 (97.2; 236.5) 131.8 (85.0; 212.3) 131.3 (106.1; 218.8)
sTNFR1 55 11.80 (8.25; 16.23) 12.35 (8.98; 15.90) 12.40 (8.98; 16.53) 4.25 (2.98; 6.43) *** 13.10 (8.43; 16.80) 9.60 (7.48; 13.15) *
Adiponectin 67 3.35 (2.38; 8.75) 4.40 (2.23; 9.50) 3.90 (2.10; 6.40) 4.85 (2.68; 8.10) 3.65 (2.35; 8.38) 5.45 (3.05; 8.98)
IL-12p70 70 2.10 (1.08; 14.05) 3.50 (1.60; 13.55) 3.05 (0.70; 24.35) 4.25 (2.50; 40.95) 2.55 (1.15; 27.23) 2.75 (1.10; 35.50)
E-selectin 85 16.40 (13.33; 20.80) 17.20 (13.38; 23.03) 17.20 (12.00; 23.48) 18.15 (12.95; 26.25) 16.45 (12.15; 23.48) 15.15 (12.50; 24.18)
sICAM 90 195.5 (164.9; 240.1) 203.8 (169.8; 257.5) 202.5 (174.0; 239.0) 203.3 (192.5; 236.2) 181.4 (169.3; 248.9) 200.6 (167.5; 245.5)
sgp130 100 251.3 (225.0; 288.0) 264.9 (227.0; 286.6) 258.8 (221.6; 300.6) 259.9 (212.4; 302.2) 254.2 (203.7; 279.0) 260.5 (216.5; 285.1)
sVCAM 100 162.0 (135.0; 185.0) 165.2 (142.8; 187.7) 178.0 (137.0; 191.8) 159.5 (124.6; 203.3) 166.7 (138.5; 184.5) 156.4 (139.5; 182.9)
oxLDL 2.500 60,218 (57,053; 64,083) 67,472 (62,573; 70,355) 62,380 (59,113; 68,346) 77,245 (70,095; 85,697) * 63,063 (57,652; 70,177) 73,395 (66,106; 99,762) **
Table 2. Plasma concentrations of a panel of 41 mediators at the beginning and the end of each experimental phase. Blood samples were collected pre- and post-dialysis at the first dialysis
session of each experimental phase and pre-dialysis at the first dialysis session after completion of the 3-week experimental phases. Green marks: lower concentrations post- versus pre-dialysis
or after 3 weeks of HCO versus HFL dialysis. Red marks: higher concentrations post- versus pre-dialysis or after 3 weeks of HCO versus HFL dialysis. Median (25% percentile; 75% percentile),
n ≤ 19, *P < 0.05, **P < 0.01, ***P < 0.001.
6www.nature.com/scientificreports/
Nevertheless, in the pre-dialytic samples that were used to assess the influence of membrane permeability
on osteoblastic differentiation of MSC besides albumin only four mediators, three of them considered anti-
inflammatory, were detected at lower levels after 3 weeks of HCO dialysis compared to HFL dialysis: sIL-2RA,
IL-10, FLCλ, and sTNFR1. In our previous studies, IL-10 at uremic concentrations did not enhance calcifica-
tion of M SC17 and neither sIL-2RA nor sTNFR1 had an impact on calcification of VSMC over a broad range of
concentrations28. From a different perspective, those URS with the highest potential for induction of osteoblastic
differentiation in MSC as identified in an unbiased screening, IL-1β and TNF-α17, did not differ significantly
between the two groups pre-dialysis after three weeks although there was a trend to lower IL-1β levels with
HCO membranes. We chose to examine pre-dialytic instead of post-dialytic plasma because the concentrations
pre-dialysis would reflect more reliably the composition of the extracellular milieu throughout the whole inter-
dialytic interval. Based on these findings, we were not able to identify any LMM that could directly account for
the observed protective effects of HCO dialysis on MSC calcification.
Since many protein-bound molecules including indoxyl sulfate and indole-3-acetic acid have been implicated
in CKD-associated vascular p athologies36,37 it has been speculated that albumin loss caused by HCO dialysis
could result in enhanced clearance of protein-bound URS with consecutively reduced propensity of plasma to
induce calcification. However, protein-bound toxins did not influence osteoblastic differentiation of MSC in vitro
as assessed by ALP activity after 7 d ays17. Moreover, dialysis with a medium cut-off (MCO) membrane designed
to promote removal of LMM while retaining a lbumin38 for 12 weeks markedly reduced the ability of plasma to
induce calcification of VSMC in vitro in comparison to HFL d ialysis39 although differences in albumin levels
were marginal40. These findings argue against a pivotal role for albumin-bound URS to explain the protective
effect of HCO dialysis with regard to MSC calcification as described in this paper. On the other hand, we found
an inhibitory effect of indoxyl sulfate and indole-3-acetic acid on proliferation of MSC (Fig. 7B) that could trans-
late into impaired vascular regenerative properties contributing to the well-established adverse cardiovascular
outcome associated with these URS.
From the list of differentially concentrated mediators after the 3-week experimental phases sTNFR1 stands
out since higher levels have been shown to predict kidney disease progression, cardiovascular events and death
in multiple CKD and non-CKD populations41,42. Although sTNFR1, a functional antagonist of TNF-α, might
not exert toxic effects on the cardiovascular system itself, it might reflect a pro-inflammatory high-risk state as
shedding of sTNFR1 is a key component of the inflammatory r esponse43,44. Thus, lower levels of sTNFR1 might
indicate a sustained reduction of inflammation by HCO dialysis while pro-inflammatory molecules themselves
have already equilibrated at the end of the interdialytic interval. In the same line of evidence, transcripts of
numerous pro-inflammatory mediators were downregulated in peripheral blood leukocytes pre-dialysis when
MCO membranes were used6. Interestingly, sTNFR1 has also been attributed a role as a stabilizer of TNF-α
augmenting some of its e ffects45. Consequently, reductions in sTNFR1 might not necessarily result in increased
TNF-α activity, but might as well have an opposite, anti-inflammatory effect.
A potential powerful means of cardiovascular protection conferred by HCO dialysis not covered by our test
system could be a favorable impact on extracellular vesicles (EV) such as exosomes and microparticles (MP):
Circulating levels of MP derived from endothelial cells independently predict all-cause and cardiovascular mor-
tality in hemodialysis p atients46. CKD patients with vascular calcification have a higher burden of endothelial
MP than those without vascular calcification and their endothelial MP were capable of inducing the osteoblast
marker protein osteocalcin in VSMC in vitro47. As a link to inflammation, TNF-α stimulates the production
of bone morphogenic protein-2 enriched endothelial MP that can promote transition from a contractile to a
calcifying phenotype in V SMC48. Given a size between 30 and 1000 nm for E V49 and a pore size of 8–12 nm for
the HCO membrane50, it appears unlikely that EV can effectively be filtered by any dialysis procedure. It has
been observed that MP counts rise after one hour of d ialysis51 most likely as a sign of bioincompatibility of the
procedure. However, Ruzicka et al. found reduced levels of MP after completion of a 4-h HFL dialysis session52.
The proposed mechanism was adsorption of MP to the dialysis m embrane52. This body of evidence raises the
possibility that HCO dialysis might promote a persistent reduction in MP with pro-calcifying activity on MSC
and VSMC due to dampening effects on inflammation, enhanced MP extraction or both. In addition, certain
URS can stimulate the production of MP with characteristically altered compounds turning them into even
more harmful vehicles with influences on remote targets such as endothelium, VSMC and c oagulation53. HCO
dialysis could advantageously modify the composition of those MP because this modality can remove several
URS with higher efficiency.
In summary, we clearly demonstrated a substantial change in functional properties of plasma from patients
undergoing HCO dialysis compared to HFL dialysis resulting in profoundly reduced pro-calcifying activity on
MSC. Several pro-inflammatory mediators and LMM with the potential to stimulate osteoblastic differentiation
of MSC such as FGF23 were removed more effectively by HCO dialysis and we found evidence of persistently
reduced inflammation. Although we were not able to specify the agents that conferred protection or whose
enhanced reduction caused less harm, we propose a model where a greater transient relief from uremic toxicity
in general and pro-inflammatory stimuli in particular initiates long-standing beneficial mechanisms that help
preserve the regenerative potential of MSC and prevent vascular calcification. These mechanisms might include
a favorable impact on MP counts and their composition. Clinical application of HCO dialysis is limited by
significant albumin losses, but recently developed MCO membranes used in expanded hemodialysis provide a
similar clearance of LMM with an acceptable loss of a lbumin54. However, whether or not these promising new
dialysis techniques can substantially reduce cardiovascular damage and significantly improve patient outcome
needs to be addressed by subsequent clinical studies.
Scientific Reports | (2021) 11:1144 | https://doi.org/10.1038/s41598-020-80016-7 7
Vol.:(0123456789)www.nature.com/scientificreports/
Figure 3. Mediators that were reduced after both a single HFL and HCO dialysis. Blood samples were collected
pre- and post-dialysis at the first dialysis session of both experimental phases. Reduction rates were calculated
as 1-(concentration post-dialysis/concentration pre-dialysis). (A) IL-8, n = 19; (B) Leptin, n = 19; (C) TNF-α,
n = 19; (D) FLCκ, n = 19; (E) FLCλ, n = 19. **P < 0.01, ***P < 0.001.
Methods
All studies involving human material were conducted in accordance with the Declaration of Helsinki and had
been approved by local ethic authorities. The clinical trial involving dialysis patients was approved by the ethics
committee of the medical faculty of the Martin-Luther-Universität Halle-Wittenberg (#2011-78). Isolation of
MSC from bone marrow donors was approved by the ethics committee of the Ärztekammer Hamburg (#2572).
All subjects provided written informed consent.
Clinical trial comparing HCO and HFL dialysis membranes. We conducted a sub-study on patients
from a randomized open-label clinical trial involving 43 stable chronic dialysis patients that has been described
previously in detail6. Briefly, patients were dialyzed in a crossover design for 3 weeks each with conventional HFL
dialyzers (Polyflux 210H, Gambro) and with HCO dialyzers (HCO 1100, Gambro) characterized by a higher
molecular weight cut-off (experimental phases 1 and 2). Experimental phases were separated by a wash out-
phase of 2 weeks with conventional HFL dialysis. The 19 patients included in this sub-study had a median age of
73 (range 50–84) years. 11 (57.9%) were male, 8 (42.1%) were female. Baseline blood samples were drawn at the
first dialysis session of each experimental phase pre- and post-dialysis. Another sample was obtained pre-dialysis
at the end of each 3-week experimental phase.
Scientific Reports | (2021) 11:1144 | https://doi.org/10.1038/s41598-020-80016-7 8
Vol:.(1234567890)www.nature.com/scientificreports/
Figure 4. Mediators that were reduced after a single HCO but not HFL dialysis. Blood samples were collected
pre- and post-dialysis at the first dialysis session of both experimental phases. Reduction rates were calculated
as 1-(concentration post-dialysis/concentration pre-dialysis). (A) MCP-1, n = 19; (B) sIL-2RA, n = 19; (C)
FGF23, n = 18; (D) IL-12p40, n = 19; (E) sTNFR2, n = 19; (F) sFAS, n = 19; (G) sTNFR1, n = 19; (H) µPAR, n = 11.
*P < 0.05, **P < 0.01, ***P < 0.001.
Analysis of blood samples. Routine parameters were analyzed in the central clinical chemistry laboratory
of the University Hospital of the Martin-Luther-University Halle. Inflammation related proteins were quantified
as described in the original publication of the trial6.
Scientific Reports | (2021) 11:1144 | https://doi.org/10.1038/s41598-020-80016-7 9
Vol.:(0123456789)www.nature.com/scientificreports/
Figure 5. Mediators that were increased after either HFL or HCO dialysis or both. Blood samples were
collected pre- and post-dialysis at the first dialysis session of both experimental phases. Reduction rates were
calculated as 1-(concentration post-dialysis/concentration pre-dialysis). (A) Hepcidin, n = 19; (B) RANTES,
n = 19; (C) MIP1b, n = 19; (D) IL-2, n = 8; (E) sCD40L n = 19; (F) IL-10, n = 17; (G) oxLDL, n = 9. *P < 0.05.
Isolation and culture of MSC, induction of osteoblastic differentiation, measurement of ALP activity and
calcium deposition, alizarin staining, immunocytochemistry and Western Blot analyses were performed fol-
lowing the same protocols used in previous studies17,35.
Isolation and culture of MSC. MSC can be isolated from all vascularized tissues12 where they reside as
pericytes in the vessel wall and function as vascular progenitor cells55. Bone marrow is an easily accessible and
well established source providing sufficient numbers of cells. Bone marrow aspirates were acquired from 20
Scientific Reports | (2021) 11:1144 | https://doi.org/10.1038/s41598-020-80016-7 10
Vol:.(1234567890)www.nature.com/scientificreports/
Figure 6. FGF23 induces osteoblastic differentiation in MSC. (A) ALP activity in MSC treated with different
concentrations of FGF23 in OM for 7 days. (B) Calcium deposited by MSC cultured for 3 weeks with
increasing concentrations of FGF23 in OM. “fold c max” denotes the x-fold concentration of the highest reported
concentration found in uremic patients. Values were normalized to protein content and are expressed relative
to OM without FGF23 (set to 1.00); n = 4. (C) Alizarin staining and immunocytochemistry for osteoblast
marker proteins after incubation of MSC for 3 weeks in OM with FGF23 at the highest reported concentration
in uremia. A representative experiment is shown. (D) Western blot analysis for expression of osteoblast marker
proteins after treatment of MSC with OM and FGF23 at the highest concentration found in ESRD for 3 weeks.
Representative blots and statistical analysis of 3 independent experiments are displayed. *P < 0.05, **P < 0.01,
***P < 0.001.
healthy donors of allogenic bone marrow transplants (7 female, 13 male) with a median age of 31 (range 0.5–42)
years. MSC were isolated as described p reviously56. In brief, bone marrow mononuclear cells were purified by
Ficoll density gradient centrifugation, plated at 400,000 cells/cm2 and cultured in α-MEM (#E15-862, PAA)
supplemented with 100 U/mL penicillin (PAA), 100 μg/mL streptomycin (PAA), 2 IU/ml heparin (Ratiopharm),
and 5% freshly thawed platelet lysate (PL) at 37 °C and 5% C O2. Nonadherent cells were washed off with PBS
after 2–3 days. Medium was changed twice a week. When cultures reached about 70% confluence, cells were
Scientific Reports | (2021) 11:1144 | https://doi.org/10.1038/s41598-020-80016-7 11
Vol.:(0123456789)www.nature.com/scientificreports/
Figure 7. Screening of individual URS for proliferation and toxicity. (A) BrdU incorporation and
(B) metabolism of MTT were measured after exposure of MSC to URS at the highest reported uremic
concentrations for 24 h. Results are expressed relative to the appropriate solvent control (set to 1.00).
Means + SEM, n ≤ 14, *P < 0.05, **P < 0.01.
detached with 0.05% Trypsin/0.02% EDTA (PAA), counted, and re-plated at 500 cells/cm2 in 175 cm2 flasks
(Sarstedt). All MSC preparations were tested for expression of a characteristic surface marker profile (positive
for CD73, CD90, and CD105; negative for CD11b, CD14, CD19, CD34, CD45, and HLA-DR). Multilineage dif-
ferentiation capacity into adipocytes, chondrocytes, and osteoblasts was confirmed according to the standard
criteria for the definition of MSC57.
Induction of osteoblastic differentiation. MSC (passages 2 to 5) were seeded in complete α-MEM at
140,000 cells per well in 6-well plates. Medium was changed the following day to osteoblast induction medium
(OM) consisting of Dulbecco’s Modified Eagle’s Medium (DMEM; PAA) supplemented with 2 mM glutamine
(PAA), penicillin/streptomycin (PAA), 1% FCS (PAA), 10 mM β-glycerophosphate (Applichem), 500 µM ascor-
bic acid, and 100 nM dexamethasone (all from Sigma). Medium was subsequently changed every 2–3 days.
In the experiments with patient plasma, FCS in OM was replaced by 2.5% patient plasma throughout the
whole experiment with medium changes every 2–3 days. Plasma was extracted from whole blood by centrifuga-
tion and was used without any further processing.
Alkaline phosphatase activity. Activity of ALP in MSC was measured after exposure to the differ-
ent experimental conditions for 7 days. After washing with PBS, cells were lysed with 400 µl ALP lysis buffer
(150 mM Tris pH 10.0, 0.1 mM ZnCl2, 0.1 mM MgCl2, 1% Triton-X100) at room temperature under constant
agitation for 30 min. Supernatants were immediately frozen at − 80 °C. For measurement of ALP activity, an ali-
quot was centrifuged for 10 min at 12,000 rpm and 4 °C. Each sample was measured in triplicate. 50 µl per well
were mixed with 200 µl pre-warmed (37 °C) substrate solution (ALP buffer with freshly dissolved p-Nitrophenyl
phosphate at 2.7 mM) in 96-well plates. Optical densities (OD) were measured at 405 nm and followed over a
60 min incubation period at 37 °C in intervals of 10 min. A time point during the linear phase was chosen and
∆OD values to baseline ODs were calculated and divided by the protein concentration of the sample as deter-
mined with the DC Protein Assay (Bio-Rad) for normalization. Finally, each ∆OD/protein ratio was related to
the ∆OD/protein ratio of the appropriate control.
Calcium deposition. Deposition of extracellular calcium by MSC undergoing osteoblastic differentiation
was assessed after 3 weeks of incubation with OM supplemented with the indicated experimental constituents.
Calcified cells were scraped off in 500 µL 0.6 M HCl and incubated in microtubes overnight under constant agi-
Scientific Reports | (2021) 11:1144 | https://doi.org/10.1038/s41598-020-80016-7 12
Vol:.(1234567890)www.nature.com/scientificreports/
tation at 4 °C to solubilize the calcium. Samples were centrifuged for 60 min at 20,000g and 4 °C. Supernatants
were transferred to new microtubes for calcium measurement. Pellets were dissolved in 25 µl 0.1 M NaOH/0.1%
SDS solution for protein quantification with the DC protein assay (Bio-Rad). Supernatants were analyzed in
duplicate in 96-well plates and compared to a calcium standard curve. 10 µL were mixed with 150 µL color rea-
gent (0.1 mg/mL ortho-cresophthalein complexone, 1 mg/mL 8-hydroxy-quinoline, 0.7 M HCl) and 150 µl AMP
buffer (15% 2-amino-2-methyl-1-propanol in H2O, pH 10.7) and incubated for 15 min at room temperature.
ODs were measured at 540 nm. Calcium concentrations were calculated by means of the standard curve and
normalized to protein content.
Alizarin staining. 140,000 MSC per well were seeded in 6-well plates in 1% FCS/DMEM and allowed to
adhere overnight. After incubation for 3 weeks as indicated, cells were fixed with ice-cold methanol for 30 min
at − 20 °C and air dried. 5% Alizarin (1,2-dihydroxyanthraquinone, Sigma) in 0.1 M boric acid buffer (pH 4) was
filtered and applied to the cells for 1 h at room temperature. After several wash steps with PBS (pH 6.0), wells
were dried and micrographs were taken on a Zeiss Axiovert 40 CFL using a Canon PowerShot A649.
Immunocytochemistry. 50,000 cells per well were seeded on 15 mm glass-coverslips (Roth) placed in
12-well plates in 1% FCS/DMEM and allowed to adhere overnight. After incubation for 3 weeks as indicated,
cells were fixed with 4% paraformaldehyde (Sigma) in PBS for 10 min, and permeabilized for 3–5 min with 0.5%
Triton X-100 (Applichem) in PBS. After blocking overnight in 3% BSA/PBS at 4 °C, primary antibodies (Osteo-
pontin abcam ab8448, Collagen I abcam ab34710; 1:500 in blocking solution) were incubated for 2 h at 37 °C
in a wet chamber. After three washes with PBS, slides were incubated with appropriate secondary antibodies
(HRPO-conjugated IgG, Dianova) for 2 h at room temperature. Signal was developed with AEC High Sensitiv-
ity Substrate Chromogen Ready to use (Dako) for about 10 min. Coverslips were washed extensively, and cells
were counterstained with Mayer’s hematoxylin (Medite) followed by a final wash in water pH 12.6 with NaOH.
Photomicrographs were taken as described above.
Western blot. 360,000 cells were incubated in 6 cm dishes for 3 weeks as indicated. Cells were lysed (20 mM
Tris pH 7.5, 350 mM NaCl, 1% Triton X-100, 1 × Roche complete protease inhibitor cocktail, 1 mM PMSF, 1 mM
sodium orthovanadate, 10 nM β-glycerophosphate, 5 mM NaF) for 20 min on ice. After centrifugation, protein
concentrations in the supernatants were quantified with the DC protein assay (Bio-Rad). 5 × Laemmli buffer
(250 mM Tris pH 6.8, 500 mM DTT, 10% SDS, 0.5% Bromophenol blue, 35% Glycerol) was added, and samples
were heated to 99 °C for 5 min. 50 µg total protein per lane were separated by SDS-polyacrylamid-gel-electro-
phoresis and electrotransferred to a PVDF membrane (GE Healthcare) following standard protocols. Blocking
was performed with 10% BSA /0.1% Triton X-100/TBS for 2 h at room temperature. All antibodies were diluted
in blocking solution: Collagen I (abcam) and Cbfa/Runx (MBL) 1:500; Osteopontin (abcam) 1:1000. GAPDH
(hytest) served as a loading control and was applied at 1:100,000. After incubation with appropriate secondary
antibodies (Dianova), SuperSignal West Pico Chemiluminescent Substrate (Thermo Fisher) was used for devel-
opment in a G:BOX F3 device (Syngene).
Panel of individual URS. To screen for biologic effects of URS on MSC, individual URS were tested at
the highest concentrations reported in patients with chronic renal failure requiring renal replacement therapy
(cmax) as suggested in the 2003 and 2007 EUTox r eports23,58 and subsequent publications on uremic t oxicity25,59,60.
Appropriate solvent controls were included in all experiments. Protein bound URS were applied in presence of
35 g/L human albumin as recommended by EUTox23. For details see Table S1.
Cell proliferation assay. 5000 cells per well were seeded in 96-well plates in complete α-MEM and allowed
to adhere overnight. The next day, medium was changed to α-MEM without FCS or PL. 24 h later, cells were
exposed to the URS at the concentrations listed in Table S1 in α-MEM without FCS or PL in presence of BrdU
(1:500). BrdU incorporation as a surrogate for proliferation was measured after incubation for another 24 h with
the BrdU cell proliferation kit (Roche) following the manufacturer’s instructions. Each independent experiment
consisted of five replicates for every measurement. Results were expressed relative to the appropriate solvent
control.
MTT. 3-(4,5-Dimethyl-2-thiazolyl)-2,5-diphenyl-2H-tetrazoliumbromid (MTT) was dissolved to a concen-
tration of 5 g/L in 0.9% NaCl solution and sterile filtered with 0.22 µm filters. 24 h after seeding of 4500 cells
per well in 96-well plates in complete α-MEM, incubation with URS at the concentrations listed in Table S1 in
α-MEM without FCS or PL was started. 0.1% sodium azide was used a positive control. After 24 h, 10 µl MTT
solution per well were added and incubation was continued for 4 h. Wells were washed with PBS and formazan
crystals formed by metabolically active cells were dissolved in 100 µl isopropanol. Absorbance was measured
in a microplate reader at a wavelength of 590 nm and 690 nm as a reference. After subtraction of background
absorbance, means of five replicates were calculated and expressed relative to the appropriate solvent control.
Statistics. All data are detailed as median with 25% and 75% quartiles in brackets unless otherwise indi-
cated. The Wilcoxon matched pairs test was applied to compare the effects of plasma obtained after HFL and
HCO dialysis on osteoblastic differentiation of MSC and to test for differences in reduction rates of HFL and
HCO membranes. Statistical comparison of multiple groups was performed with the Kruskal–Wallis test or the
Friedman test when a paired analysis was appropriate. Dunn’s Multiple Comparisons Test was used as a post hoc
Scientific Reports | (2021) 11:1144 | https://doi.org/10.1038/s41598-020-80016-7 13
Vol.:(0123456789)www.nature.com/scientificreports/
test. 1-way ANOVA followed by Dunnett’s post hoc test was used to evaluate dose–response curves. Significance
was considered at a value of P < 0.05. All analyses were performed with GraphPad Prism version 5.02 for Win-
dows, GraphPad Software, San Diego California USA.
Received: 11 June 2020; Accepted: 10 November 2020
References
1. Wanner, C., Amann, K. & Shoji, T. The heart and vascular system in dialysis. Lancet 388, 276–284 (2016).
2. Vanholder, R. et al. Deleting death and dialysis: conservative care of cardio-vascular risk and kidney function loss in chronic kidney
disease (CKD). Toxins (Basel) 10, 237 (2018).
3. Vanholder, R., Pletinck, A., Schepers, E. & Glorieux, G. Biochemical and clinical impact of organic uremic retention solutes: a
comprehensive update. Toxins (Basel) 10, 33 (2018).
4. Locatelli, F. et al. Mortality risk in patients on hemodiafiltration versus hemodialysis: a “real-world” comparison from the DOPPS.
Nephrol. Dial Transpl. 33, 683–689 (2018).
5. Gondouin, B. & Hutchison, C. A. High cut-off dialysis membranes: current uses and future potential. Adv. Chronic Kidney Dis.
18, 180–187 (2011).
6. Girndt, M. et al. High cut-off dialysis in chronic haemodialysis patients. Eur. J. Clin. Invest. 45, 1333–1340 (2015).
7. London, G. M., Marchais, S. J., Guerin, A. P. & Metivier, F. Arteriosclerosis, vascular calcifications and cardiovascular disease in
uremia. Curr. Opin. Nephrol. Hypertens. 14, 525–531 (2005).
8. Hirschi, K. K. & D’Amore, P. A. Pericytes in the microvasculature. Cardiovasc. Res. 32, 687–698 (1996).
9. Edelman, D. A., Jiang, Y., Tyburski, J., Wilson, R. F. & Steffes, C. Pericytes and their role in microvasculature homeostasis. J. Surg.
Res. 135, 305–311 (2006).
10. de Souza, L. E., Malta, T. M., Kashima Haddad, S. & Covas, D. T. Mesenchymal stem cells and pericytes: to what extent are they
related?. Stem Cells Dev. 25, 1843–1852 (2016).
11. Crisan, M. et al. A perivascular origin for mesenchymal stem cells in multiple human organs. Cell Stem Cell 3, 301–313 (2008).
12. Gomez-Salazar, M. et al. Five decades later, are mesenchymal stem cells still relevant?. Front. Bioeng. Biotechnol. 8, 148 (2020).
13. Hegner, B. et al. mTOR regulates vascular smooth muscle cell differentiation from human bone marrow-derived mesenchymal
progenitors. Arterioscler Thromb. Vasc. Biol. 29, 232–238 (2009).
14. Gu, W., Hong, X., Potter, C., Qu, A. & Xu, Q. Mesenchymal stem cells and vascular regeneration. Microcirculation 24, e12324
(2017).
15. Neven, E., De Schutter, T. M., De Broe, M. E. & D’Haese, P. C. Cell biological and physicochemical aspects of arterial calcification.
Kidney Int. 79, 1166–1177 (2011).
16. Kramann, R. et al. Adventitial MSC-like cells are progenitors of vascular smooth muscle cells and drive vascular calcification in
chronic kidney disease. Cell Stem Cell 19, 628–642 (2016).
17. Hegner, B. et al. Targeting proinflammatory cytokines ameliorates calcifying phenotype conversion of vascular progenitors under
uremic conditions in vitro. Sci. Rep. 8, 12087 (2018).
18. Coutu, D. L., Francois, M. & Galipeau, J. Inhibition of cellular senescence by developmentally regulated FGF receptors in mesen-
chymal stem cells. Blood 117, 6801–6812 (2011).
19. Richter, B. & Faul, C. FGF23 actions on target tissues-with and without Klotho. Front. Endocrinol. (Lausanne) 9, 189 (2018).
20. Sato, C. et al. Fibroblast growth factor-23 induces cellular senescence in human mesenchymal stem cells from skeletal muscle.
Biochem. Biophys. Res. Commun. 470, 657–662 (2016).
21. Shroff, R. C. et al. Dialysis accelerates medial vascular calcification in part by triggering smooth muscle cell apoptosis. Circulation
118, 1748–1757 (2008).
22. Vanholder, R. et al. A bench to bedside view of uremic toxins. J. Am. Soc. Nephrol. 19, 863–870 (2008).
23. Vanholder, R. et al. Review on uremic toxins: classification, concentration, and interindividual variability. Kidney Int. 63, 1934–1943
(2003).
24. Vanholder, R., Laecke, S. V., Verbeke, F., Glorieux, G. & Biesen, W. V. Uraemic toxins and cardiovascular disease: in vitro research
versus clinical outcome studies. NDT Plus 1, 2–10 (2008).
25. Vanholder, R. et al. Review on uraemic solutes II—variability in reported concentrations: causes and consequences. Nephrol. Dial
Transpl. 22, 3115–3121 (2007).
26. Vanholder, R., Schepers, E., Pletinck, A., Nagler, E. V. & Glorieux, G. The uremic toxicity of indoxyl sulfate and p-cresyl sulfate: a
systematic review. J. Am. Soc. Nephrol. 25, 1897–1907 (2014).
27. Vanholder, R., Schepers, E., Pletinck, A., Neirynck, N. & Glorieux, G. An update on protein-bound uremic retention solutes. J.
Ren. Nutr. 22, 90–94 (2012).
28. Zickler, D. et al. High cut-off dialysis in chronic haemodialysis patients reduces serum procalcific activity. Nephrol. Dial Transpl.
31, 1706–1712 (2016).
29. Zhang, L., Issa Bhaloo, S., Chen, T., Zhou, B. & Xu, Q. Role of resident stem cells in vessel formation and arteriosclerosis. Circ. Res.
122, 1608–1624 (2018).
30. Golle, L. et al. Bone marrow-derived cells and their conditioned medium induce microvascular repair in uremic rats by stimulation
of endogenous repair mechanisms. Sci. Rep. 7, 9444 (2017).
31. Vogt, I., Haffner, D. & Leifheit-Nestler, M. FGF23 and phosphate-cardiovascular toxins in CKD. Toxins (Basel) 11, 647 (2019).
32. Nasrallah, M. M. et al. Fibroblast growth factor-23 (FGF-23) is independently correlated to aortic calcification in haemodialysis
patients. Nephrol. Dial Transpl. 25, 2679–2685 (2010).
33. Desjardins, L. et al. FGF23 is independently associated with vascular calcification but not bone mineral density in patients at
various CKD stages. Osteoporos Int. 23, 2017–2025 (2012).
34. Scialla, J. J. et al. Fibroblast growth factor 23 is not associated with and does not induce arterial calcification. Kidney Int. 83,
1159–1168 (2013).
35. Schaub, T. et al. mTORC1 and mTORC2 differentially regulate cell fate programs to coordinate osteoblastic differentiation in
mesenchymal stromal cells. Sci. Rep. 9, 20071 (2019).
36. Ito, S. & Yoshida, M. Protein-bound uremic toxins: new culprits of cardiovascular events in chronic kidney disease patients. Toxins
(Basel) 6, 665–678 (2014).
37. Yamamoto, S. Molecular mechanisms underlying uremic toxin-related systemic disorders in chronic kidney disease: focused on
beta2-microglobulin-related amyloidosis and indoxyl sulfate-induced atherosclerosis-Oshima Award Address 2016. Clin. Exp.
Nephrol. 23, 151–157 (2019).
Scientific Reports | (2021) 11:1144 | https://doi.org/10.1038/s41598-020-80016-7 14
Vol:.(1234567890)www.nature.com/scientificreports/
38. Boschetti-de-Fierro, A., Voigt, M., Storr, M. & Krause, B. MCO membranes: enhanced selectivity in high-flux class. Sci. Rep. 5,
18448 (2015).
39. Willy, K. et al. Expanded haemodialysis therapy of chronic haemodialysis patients prevents calcification and apoptosis of vascular
smooth muscle cells in vitro. Blood Purif. 45, 131–138 (2018).
40. Zickler, D. et al. Medium cut-off (MCO) membranes reduce inflammation in chronic dialysis patients-a randomized controlled
clinical trial. PLoS ONE 12, e0169024 (2017).
41. Castillo-Rodriguez, E. et al. Inflammatory cytokines as uremic toxins: “Ni Son Todos Los Que Estan, Ni Estan Todos Los Que
Son”. Toxins (Basel) 9, 114 (2017).
42. Neirynck, N., Glorieux, G., Schepers, E., Verbeke, F. & Vanholder, R. Soluble tumor necrosis factor receptor 1 and 2 predict out-
comes in advanced chronic kidney disease: a prospective cohort study. PLoS ONE 10, e0122073 (2015).
43. Aderka, D. et al. Shedding kinetics of soluble tumor necrosis factor (TNF) receptors after systemic TNF leaking during isolated
limb perfusion. Relevance to the pathophysiology of septic shock. J. Clin. Invest. 101, 650–659 (1998).
44. Deng, M., Loughran, P. A., Zhang, L., Scott, M. J. & Billiar, T. R. Shedding of the tumor necrosis factor (TNF) receptor from the
surface of hepatocytes during sepsis limits inflammation through cGMP signaling. Sci. Signal 8, ra11 (2015).
45. Aderka, D., Engelmann, H., Maor, Y., Brakebusch, C. & Wallach, D. Stabilization of the bioactivity of tumor necrosis factor by its
soluble receptors. J. Exp. Med. 175, 323–329 (1992).
46. Amabile, N., Guerin, A. P., Tedgui, A., Boulanger, C. M. & London, G. M. Predictive value of circulating endothelial microparticles
for cardiovascular mortality in end-stage renal failure: a pilot study. Nephrol. Dial Transpl. 27, 1873–1880 (2012).
47. Soriano, S. et al. Endothelial damage and vascular calcification in patients with chronic kidney disease. Am. J. Physiol. Renal Physiol.
307, F1302-1311 (2014).
48. Buendia, P. et al. Endothelial microparticles mediate inflammation-induced vascular calcification. FASEB J. 29, 173–181 (2015).
49. Erdbrugger, U. & Le, T. H. Extracellular vesicles in renal diseases: more than novel biomarkers?. J. Am. Soc. Nephrol. 27, 12–26
(2016).
50. Boschetti-de-Fierro, A., Voigt, M., Storr, M. & Krause, B. Extended characterization of a new class of membranes for blood puri-
fication: the high cut-off membranes. Int. J. Artif. Organs 36, 455–463 (2013).
51. de Laval, P. et al. Acute effects of haemodialysis on circulating microparticles. Clin. Kidney J. 12, 456–462 (2019).
52. Ruzicka, M. et al. Effect of hemodialysis on extracellular vesicles and circulating submicron particles. BMC Nephrol. 20, 294 (2019).
53. Favretto, G. et al. Endothelial microparticles in uremia: biomarkers and potential therapeutic targets. Toxins (Basel) 11, 267 (2019).
54. Ronco, C. et al. Expanded haemodialysis: from operational mechanism to clinical results. Nephrol. Dial Transpl. 33, iii41–iii47
(2018).
55. Bautch, V. L. Stem cells and the vasculature. Nat. Med. 17, 1437–1443 (2011).
56. Lange, C. et al. Accelerated and safe expansion of human mesenchymal stromal cells in animal serum-free medium for transplanta-
tion and regenerative medicine. J. Cell Physiol. 213, 18–26 (2007).
57. Dominici, M. et al. Minimal criteria for defining multipotent mesenchymal stromal cells. The International Society for Cellular
Therapy position statement. Cytotherapy 8, 315–317 (2006).
58. Cohen, G. et al. Review on uraemic toxins III: recommendations for handling uraemic retention solutes in vitro—towards a
standardized approach for research on uraemia. Nephrol. Dial Transpl. 22, 3381–3390 (2007).
59. Gerritsen, K. G. et al. Effect of GFR on plasma N-terminal connective tissue growth factor (CTGF) concentrations. Am. J. Kidney
Dis Off. J. Natl. Kidney Found. 59, 619–627 (2012).
60. Duranton, F. et al. Normal and pathologic concentrations of uremic toxins. J. Am. Soc. Nephrol. 23, 1258–1270 (2012).
Acknowledgements
The authors thank Gambro Dialysatoren GmbH, Hechingen, Germany for supporting the study with dialyzers.
This work was supported in part by EU funding through SysKID (HEALTH-F2-2009-241544).
Author contributions
Manuscript preparation: T.S. and B.H., Data acquisition: T.S., D.J., D.Z. and B.H., Important intellectual contri-
bution to the manuscript: T.S., D.Z., C.L., R.S., M.G., D.D. and B.H., Conception and design of the study: T.S.,
D.Z., R.S., M.G., D.D. and B.H., Final approval of manuscript: T.S., D.J., C.L., D.Z., R.S., M.G., D.D. and B.H.
Funding
Open Access funding enabled and organized by Projekt DEAL.
Competing interests
RS and DZ report grants from Gambro. MG reports grants from Baxter Inc during the conduct of this study.
RS, DZ and BH have a licensed patent (US 2015/0110887 A1) “Permselective membrane for treating vascular
calcification in chronic hemodialysis patients”. TS, DJ, CL, and DD have no competing interests as defined by
Nature Research, or other interests that might be perceived to influence the results and/or discussion reported
in this paper.
Additional information
Supplementary Information The online version contains supplementary material availlable at https://doi.
org/10.1038/s41598-020-80016-7.
Correspondence and requests for materials should be addressed to D.D. or B.H.
Reprints and permissions information is available at www.nature.com/reprints.
Publisher’s note Springer Nature remains neutral with regard to jurisdictional claims in published maps and
institutional affiliations.
Scientific Reports | (2021) 11:1144 | https://doi.org/10.1038/s41598-020-80016-7 15
Vol.:(0123456789)You can also read