Post traumatic olfactory loss and brain response beyond olfactory cortex - Nature
←
→
Page content transcription
If your browser does not render page correctly, please read the page content below
www.nature.com/scientificreports
OPEN Post‑traumatic olfactory
loss and brain response
beyond olfactory cortex
Robert Pellegrino1,2,3*, Michael C. Farruggia4,5, Dana M. Small4,5,6,7 & Maria G. Veldhuizen8
Olfactory impairment after a traumatic impact to the head is associated with changes in olfactory
cortex, including decreased gray matter density and decreased BOLD response to odors. Much less
is known about the role of other cortical areas in olfactory impairment. We used fMRI in a sample
of 63 participants, consisting of 25 with post-traumatic functional anosmia, 16 with post-traumatic
hyposmia, and 22 healthy controls with normosmia to investigate whole brain response to odors.
Similar neural responses were observed across the groups to odor versus odorless stimuli in the
primary olfactory areas in piriform cortex, whereas response in the frontal operculum and anterior
insula (fO/aI) increased with olfactory function (normosmia > hyposmia > functional anosmia).
Unexpectedly, a negative association was observed between response and olfactory perceptual
function in the mediodorsal thalamus (mdT), ventromedial prefrontal cortex (vmPFC) and posterior
cingulate cortex (pCC). Finally, connectivity within a network consisting of vmPFC, fO, and pCC could
be used to successfully classify participants as having functional anosmia or normosmia. We conclude
that, at the neural level, olfactory impairment due to head trauma is best characterized by heightened
responses and differential connectivity in higher-order areas beyond olfactory cortex.
A fifth (17–24%) of the population has an impaired sense of s mell1. Quantitatively the level of impairment may
range from partial loss (hyposmia) to total loss (anosmia), while qualitative impairments include distortion
(parosmia) or phantom smells (phantosmia). The etiology of these conditions may be peripheral, resulting
from damage to the olfactory epithelium or its nerves, or central, with damage to either the olfactory bulb or
primary/secondary cortices. Traumatic injury is among the main causes of olfactory impairment with 20–68%
of impacts leading to olfactory function loss, depending on the severity of the t rauma2. Acute olfactory impair-
ment is the most common occurrence after a traumatic impact with recovery beginning around 3 months from
the incident3,4. Yet, chronic impairment does occur regularly from trauma5 and has a worse recovery rate than
other etiologies5,6. It is also associated with increased anxiety and post-concussion symptoms a year from the
time of trauma1,7.
To objectively measure olfactory impairment, an individual must complete a battery of tests (e.g., Sniffin’
Sticks8); however, these tests are susceptible to inattention, cultural differences, and even deception. Recent
advances in functional MRI (fMRI) analyses give rise to another option for predicting olfactory loss. Connec-
tome-based Predictive Modeling, or CPM, can be used to ‘fingerprint’ (or identify) an individual from a group
based upon their brain connectivity p rofile9. CPMs are able to predict fluid i ntelligence9, attention10, personality11,
12 13
adiposity , and drug abstinence . Distinguishing group differences in severity of olfactory impairment using
functional scans has not been attempted but was suggested in a recent study14. Additionally, to identify the neural
correlates of post-traumatic olfactory loss may reveal mechanisms underlying loss and help identify treatment
targets for rehabilitation and recovery.
Neural reorganization after olfactory loss. To date, most studies of olfactory loss have focused on
structural differences between healthy and impaired individuals. Many of these studies include patients with
1
Smell & Taste Clinic, Department of Otorhinolaryngology, TU Dresden, Fetscherstrasse 74, 01307 Dresden,
Germany. 2Department of Food Science, Institute of Agriculture, University of Tennessee, Knoxville, TN 37996,
USA. 3Monell Chemical Senses Center, Philadelphia, PA, USA. 4Interdepartmental Neuroscience Program, Yale
University, 333 Cedar Street, New Haven, CT 06510, USA. 5Department of Psychiatry, Division of Nutritional
Psychiatry, Yale University School of Medicine, 300 George Street, New Haven, CT 06511, USA. 6Department
of Psychology, Yale University, New Haven, CT 06511, USA. 7Modern Diet and Physiology Research Center, Yale
University, New Haven, USA. 8Department of Anatomy, Faculty of Medicine, Mersin University, Ciftlikkoy Campus,
33343 Mersin, Turkey. *email: pellegrino.robert@gmail.com
Scientific Reports | (2021) 11:4043 | https://doi.org/10.1038/s41598-021-83621-2 1
Vol.:(0123456789)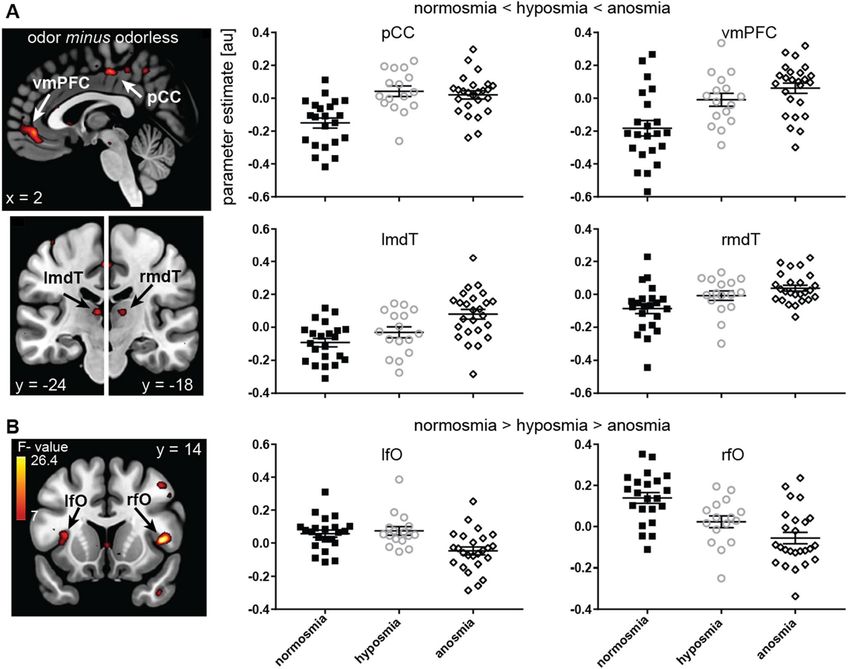
www.nature.com/scientificreports/
Figure 1. Participant gender and age by group. Left panel shows a histogram of men (solid black bars) and
women (solid gray bars) count. Center panel shows mean (center line) age with standard error of the mean
bars (shorter upper and lower bars), with individual data points overlaid for normosmia (solid black squares),
hyposmia (open gray circles), and functional anosmia (open black diamonds) participant groups. Right panel
shows the duration of olfactory impairment in months, showing the relevant hyposmia and anosmia groups
only. Bracket indicates significant post-hoc t test between groups (corrected for multiple comparisons) with p
value.
different etiologies, including idiopathic origins. Here we briefly review only studies measuring acquired dys-
function, as congenital anosmia does not show equivalent changes in the b rain15. In general, grey matter volume
decreases in primary (e.g. piriform) and secondary olfactory structures (e.g. insula, orbitofrontal cortex, anterior
cingulate cortex and hippocampus) for anosmic patients and atrophy increases with impairment duration16,17.
The grey matter volume in the cerebellum, a brain area associated with the sensorimotor act of sniffing, also
decreases18. Similarly, a lack of olfactory afferent input decreases the volume of the olfactory b ulb19,20 and the
adjacent olfactory sulcus, positioned between the gyrus rectus and medial orbitofrontal g yrus21.
The characterization of functional changes in patients with olfactory loss, whether found in voxel-wise acti-
vations or regional connectivity, has received far less attention than characterization of structural changes22,23.
Spectral and olfactory event-related electroencephalogram (EEG) discriminate among severity of olfactory loss
with negative correlations between response and loss24–27. However, an absent signal from the scalp electrode
locations does not guarantee the inability to smell28, although recent advances with olfactory bulb EEG indicate
improved specificity29. Previous functional MRI (fMRI) studies of olfactory impairment are often difficult to
interpret because of methodological issues, including small sample s izes30–32, no control g roup33, or the use of
bimodal odors that induce both olfactory and trigeminal responses34–37. However, a handful of rigorous studies
do indeed exist, and these suggest that olfactory loss is reflected in decreased response in olfactory circuits that
is often associated with loss duration. For example, a recent study reported activation of the right primary olfac-
tory cortex that was graded according to olfactory ability, with a response greater in hyposmia than anosmia,
and greater in normosmia than hyposmia. Loss duration did not influence this pattern, but in the contralateral
(left) primary olfactory cortex, response was negatively associated with the duration of impairment for patients
with hyposmia but not patients with anosmia while response in the left insula was negatively associated with
duration of loss in patients with anosmia38, a finding that has been replicated39,40. Studies have also demon-
strated reduced anterior c ingulate41 and right orbitofrontal cortex activation in patients with h yposmia38,41 and
anosmia41. Rather than decreased responses, increased responses to odors vs odorless in cortical areas may also
characterize functional impairment. To this point, increases in activation to odors have been demonstrated in
parahippocampal and parietal cingulate c ortex39,41, as well as connectivity in a functional network consisting of
olfactory, somatosensory and integration regions in response to bimodal o dors37.
The aim of the current study was to test whether the neural response to odors can be used to discriminate
between patients of different categories of olfactory impairment severity (functional anosmia, hyposmia and
normosmia). Additionally, we wanted to identify the neural correlates of post-traumatic olfactory loss. To achieve
these objectives, we used fMRI to measure the neural responses to odors compared to an odorless control in a
relatively large post-traumatic patient population with a range of olfactory impairment (hyposmia and functional
anosmia) compared to a similarly sized healthy control group with confirmed normosmia. Control and patient
groups were analyzed with voxel-wise analysis and CPM for a predictive model. We hypothesized that reduced
responses in canonical olfactory cortex (piriform, insula and orbitofrontal cortex) will be associated with olfac-
tory impairment and that these networks will have predictive value.
Results
Participant characteristics. Participants consisted of 63 individuals with either clinically defined nor-
mosmia, hyposmia, or anosmia. On average, participants were 54.4 years of age (Std 13.2, range 22–75). Overall,
the effect of group on age was marginally significant (p = 0.091, Supplementary Table S1), but post hoc t-tests
(corrected for multiple comparisons) showed participants with anosmia were significantly older than their coun-
terparts with normosmia (p < 0.05, Fig. 1.) In total more men participated (25 women, 38 men); however, there
were more women (10) than men (6) with hyposmia (Fig. 1.), with a marginally significant effect of group on
gender (p = 0.097, Supplementary Table S1). Therefore, we included age and gender as covariates-of-no-interest
in the subsequent fMRI analyses. Duration of impairment ranged from 2.03 to 211 months and was not signifi-
Scientific Reports | (2021) 11:4043 | https://doi.org/10.1038/s41598-021-83621-2 2
Vol:.(1234567890)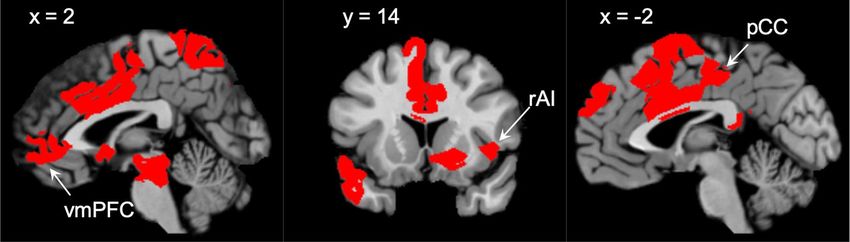
www.nature.com/scientificreports/

                                  Figure 2.  Threshold (upper left panel), discrimination (upper right), identification (lower left), and composite
                                  TDI (lower right) score from Sniffin’ Sticks test by group. Legend details as in Fig. 1.

                                  Figure 3.  Perceived intensity (left panel), pleasantness (center), and free identification (right) of odors by
                                  group. Legend details as in Fig. 1.

                                  cantly different between anosmia and hyposmia groups (Fig. 1, Supplementary Information Table S1). Thresh-
                                  old, discrimination, identification, and composite TDI scores at time of clinical testing showed significant differ-
                                  ences in all olfactory domains of the Sniffin’ Sticks between all groups (p < 0.05, Fig. 2, Supplementary Table S1).

                                  Olfactory function at fMRI scan. The odors presented in the fMRI scan session were rated as less intense
                                  by participants with anosmia or hyposmia than by participants with normosmia, and participants with anosmia
                                  in turn rated the odors as less intense than participants with hyposmia (Fig. 3). Ratings of pleasantness of the
                                  odors displayed a weaker relation with olfactory impairment group. Participants with anosmia rated the odors as
                                  less pleasant than participants with normosmia or hyposmia, but there was no significant difference in pleasant-
                                  ness ratings between the participants groups with normosmia and hyposmia. Free identification (no response

Scientific Reports |   (2021) 11:4043 |                https://doi.org/10.1038/s41598-021-83621-2                                                        3

                                                                                                                                                    Vol.:(0123456789)
www.nature.com/scientificreports/
Figure 4. Cross-correlations between olfactory function measures and distribution of scores regardless of
group. Diagonal shows histograms and density plots of distribution of scores. Below the diagonal scatterplots
illustrate the relation between variables indicated at the bottom of each column and the left of each row. Lines
illustrate best fit of linear regression, with the transparent gray area indicating 95% confidence bands. Above the
diagonal the Pearson correlation and p value of significant statistic are given. Ns not significant.
categories provided) of the odors was significantly impaired in participants with anosmia, with most participants
only giving incorrect responses, compared to the participants with hyposmia and normosmia. Most participants
with normosmia gave 100% correct responses on free identification and performed significantly better than the
participants with hyposmia. Note that while performance on free identification of odors follows the general pat-
tern of olfactory impairment, these scores also show a substantial amount of variation; some participants with
hyposmia identify 100% of the odors correctly, while others with hyposmia identify 0% of the odors correctly.
Likewise, we observe a large overlap in pleasantness ratings of the odors across groups.
TDI correlates well with the olfactory function measures obtained at the fMRI scan (all r’s > 0.73, except
pleasantness ratings; Fig. 4), indicating that neural response to the odors used in the fMRI scan is representative
of olfactory impairment as assessed by Sniffin’ Sticks. Pleasantness of the odors is the only variable that shows
little to no relation to the other variables.
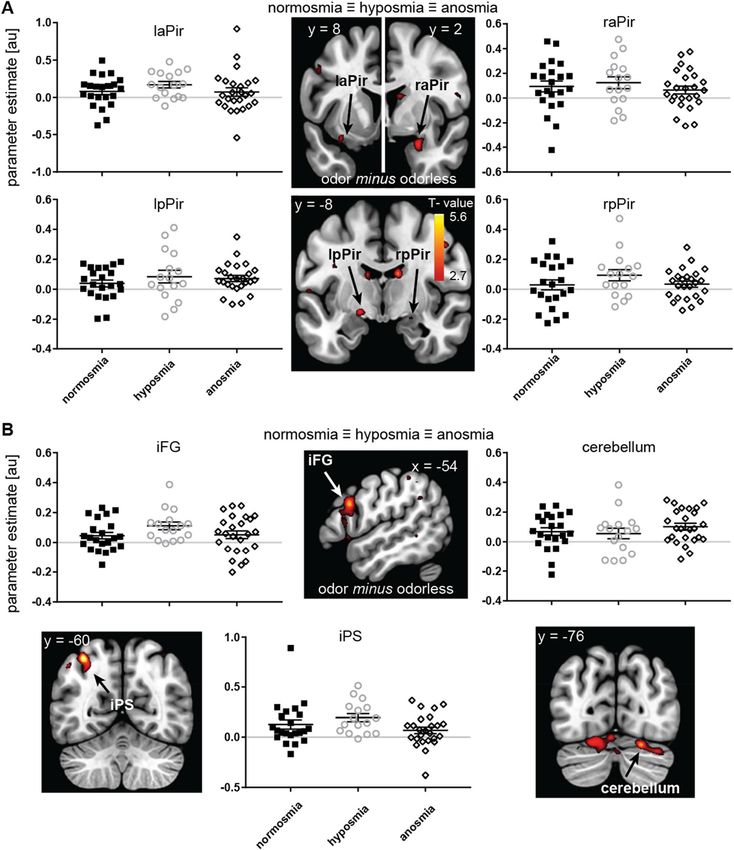
Voxel‑wise neural response to odor vs odorless for all olfactory impairment groups. Each
group exhibited a positive response in right anterior piriform (aPir)/ventral insula (Fig. 5A; Supplementary
Table S2). A similar pattern of results was observed for left aPir and bilateral posterior piriform (pPir). While
these latter peaks were not significant for multiple comparisons, we report them in Fig. 5A and Supplementary
Information Table S2. This serves to illustrate a similar magnitude of response across groups in all areas of piri-
form cortex, including those areas that others previously showed to differ between normosmia and anosmia38.
Each group shows an average neural response to odors vs odorless stimuli. (i.e. a parameter estimate above 0).
While in each group there may be individuals that showed a smaller response to odor compared to odorless (i.e.
a parameter estimate below 0), such individuals were present in each group in similar proportions relative to
the total group size. Equivalence tests confirm the absence of a difference between the anosmia and normosmia
groups in the clusters in piriform cortex (Supplementary Information Table S3).
We additionally observed unpredicted responses to odor vs odorless across all groups in intra-parietal sulcus
(iPS), cerebellum and inferior frontal gyrus (iFG) (Fig. 5B; Supplementary Table S2).
Scientific Reports | (2021) 11:4043 | https://doi.org/10.1038/s41598-021-83621-2 4
Vol:.(1234567890)www.nature.com/scientificreports/
Figure 5. Neural response to odor-odorless regardless of olfactory impairment, (A) in a ROI of piriform
cortex, and (B) in unpredicted regions. Sections (slice location indicated in MNI-coordinate) show canonical
anatomical template with SPM T-map overlaid, thresholded at puncorrected < .005, and a minimum of 5 contiguous
voxels. Color gradient scale depicts supra-threshold T values. Graphs show parameter estimates (in arbitrary
units) for the voxel with the peak t value in the cluster on the y-axis. For illustrative purposes we plotted a line
through y = 0, to illustrate that, on average, each group shows positive neural response to odor vs odorless in
anterior and posterior piriform (aPir and pPir), inferior frontal gyrus (iFG), intra parietal sulcus (iPS) and
cerebellum. Legend details as in Fig. 1.
Scientific Reports | (2021) 11:4043 | https://doi.org/10.1038/s41598-021-83621-2 5
Vol.:(0123456789)www.nature.com/scientificreports/
Figure 6. Neural response to odor minus odorless as a function of olfactory impairment. (A) clusters in
posterior cingulate cortex (pCC), ventromedial prefrontal cortex (vmPFC) and bilateral medio-dorsal thalamus
(mdT) showing increasing neural response with increased olfactory impairment, such that participants with
anosmia have stronger response than those with hyposmia and those with hyposmia in turn have greater
response than those with normosmia. (B) clusters in bilateral frontal operculum and left anterior insula
(lfO/rfO) showing increased neural responses with increased olfactory function, such that participants with
normosmia have greater response than those with hyposmia and those with hyposmia in turn have greater
response than those with anosmia. Color gradient scale depicts supra-threshold F values (thresholded at
puncorrected < .005). Other legends as in Fig. 5.
Voxel‑wise response to odor vs odorless as a function of olfactory impairment. Next, in an
additional voxel-wise analysis, we specified an F-contrast of linear changes in neural response as a function of
group to isolate brain regions that respond in a pattern of increasing neural response with increasing olfactory
impairment (positive linear trend) or increasing olfactory function (negative linear trend). We observed mul-
tiple clusters in pCC, vmPFC, and bilateral mdT in which participants with anosmia had a stronger response
than those with hyposmia and those with hyposmia in turn had greater response than those with normosmia
(Fig. 6A; Supplementary Table S4). Conversely, we observed greater response in participants with normosmia
than those with hyposmia and greater response in those with hyposmia than those with anosmia in the left aI/
fO and right fO (Fig. 6B; Supplementary Table S4).
A brain‑behavior relationship for smell using CPM. Using a leave-one-out cross validation framework, we
determined a whole-brain functional connectivity network that explains approximately 17% of the variance in
TDI score in a novel individual after controlling for age, which we know from the literature and from this cohort
(p = 0.02, r2 = 0.078) to negatively predict TDI42. While this model was significant (p < 0.001), we noted a very
large mean squared error (110.93), which hinders model interpretation and utility. Therefore, we undertook a
binary classification approach, aiming to use CPM to determine a brain-behavior relationship capable of dis-
criminating between two of the groups (i.e. between anosmia and normosmia, between anosmia and hyposmia,
and between hyposmia and normosmia). We found that this network can discriminate between individuals with
Scientific Reports | (2021) 11:4043 | https://doi.org/10.1038/s41598-021-83621-2 6
Vol:.(1234567890)www.nature.com/scientificreports/
Figure 7. Nodes, or regions, with the highest number of connections in the brain-behavior model include
members of both default mode (vmPFC and pCC) and salience (rfO/raI) networks. Edges thresholded at
p = 0.01.
anosmia or normosmia with a combined accuracy of approximately 64% after controlling for age. That is, in
64% of cases, an individual was correctly classified as either having anosmia or normosmia. The sensitivity for
detecting anosmia in this sample is 72%, while the specificity is 55%. The positive predictive value (PPV) for this
test was 64%, while the negative predictive value (NPV) was 63%. Notably, controlling for motion, gender, or
impairment duration did not appreciably alter these results. The network contains highly connected nodes that
roughly correspond to regions from the voxel-wise analyses (i.e. Fig. 6A,B) such as raI, vmPFC, and pCC (Fig. 7,
Supplementary Table S5). We furthermore found high-degree nodes in other regions, such as the striatum and
midbrain (Supplementary Table S5). However, we did not see mdT emerge among the 10% high-degree nodes
(Supplementary Table S5); though this does not necessarily imply that it does not play a role in classification.
This method could not reliably distinguish between the other groups; hyposmia and normosmia, or hyposmia
and anosmia.
Discussion
The goal of the current work was to test whether neural response to odors could be used to discriminate between
patients in different categories of olfactory impairment severity. We predicted that reduced responses to odors vs
odorless in the canonical olfactory cortex (piriform, insula and orbitofrontal cortex) would be associated with
olfactory function. As predicted, olfactory loss was associated with reduced responses in anterior insula/frontal
operculum. However, we did not observe reduced responses in other canonical olfactory areas, and we unexpect-
edly observed increased responses in mdT, pCC, and vmPFC. Moreover, a functional connectivity network that
included several of the neural correlates that differed between groups in our voxel-wise fMRI analyses—fO, pCC,
and vmPFC, was able to (within-sample) predict olfactory function differences between anosmia and normosmia
at above-chance levels. To our knowledge, this is the first model capable of categorizing those with and without
smell at above-chance levels using functional brain scans.
The insula and overlying frontal operculum are known to play a role in chemosensation, with olfactory projec-
tions terminating in the ventral and posterior agranular insula43 and indirect connections to frontal operculum
through orbitofrontal c ortex44. The region isolated here was dorsal to the agranular insula areas. This region shows
consistent activation in odor vs. non-odor comparisons across studies45 and a recent parcellation of primary
olfactory areas in humans shows that frontal operculum and anterior insula are both functionally connected
with piriform cortex46. In normosmia, this region of the insula and overlying operculum is involved in attention
to odors45,47 and may reflect awareness of odors or engagement in any task related to odors. In contrast, pCC
and vmPFC responses to odors vs odorless were enhanced in those with smell loss. These two regions are often
reported in a network of regions known as “default mode network,” that engages during times of rest or the
absence of a task48. The specific pattern of decreased and increased responses to odors with olfactory impairment
observed here suggests that patients with functional anosmia may be displaying lapses in task-engagement49.
This may be due to the lack of input from an odor-related task; or put another way, the impaired participant
is in a state of boredom during a long scanning session where nothing happens and their “mind wanders”50.
However, it is important to note that patients with hyposmia, who typically can still smell something, showed
roughly similar responses to the functional anosmia group in the pCC for example (see Fig. 6). In contrast, the
hyposmia group showed intermediate responses (between functional anosmia and normosmia) in the vmPFC.
This suggests that there may be more than one process reflected in the differences between groups we observed.
Indeed, it has been noted that the default mode network may reflect multiple interwoven networks51. Interme-
diate responses in hyposmia would be consistent with other suggested functions of the default network such
as memory retrieval51—a cognitive process previously speculated to be enhanced in this patient population41.
Another possibility is that activations in pCC and vmPFC reflect (negative) self-referential thinking, with patients
with decreasing function experiencing greater degrees of frustration regarding their inability to perceive the
odors presented to them52. Lastly, participants were asked to make a variety of judgements in between runs (no
scanning) related to odor intensity and quality. While we cannot rule out that the neural responses reflect those
judgements, we think such higher-order processing would be more likely to follow a non-linear pattern, such
that patients with hyposmia, sensing only part of the odor, will engage more in identification attempts than
patients with normosmia or anosmia53. Since the pattern of responses generally follows that of impairment and
Scientific Reports | (2021) 11:4043 | https://doi.org/10.1038/s41598-021-83621-2 7
Vol.:(0123456789)www.nature.com/scientificreports/
since the responses are made in between runs, we cannot infer any specific cognitive processes during scanner.
Future studies should employ tasks to more explicitly test the role of these areas in olfactory (dys)function and
their potential (mal)adaptive role in olfactory recovery, rehabilitation and/or training.
Our voxel-wise fMRI analyses showed an increase in mdT response to odors vs odorless with impairment.
Response in mdT has been shown to be associated with attention to and encoding of odor s timuli54,55, as well as
odor novelty or task complexity56. Perhaps increased mdT response in the current work reflects increased direc-
tion of attentional resources towards processing of signals in the primary olfactory cortex that are not advancing
to regular higher-order processing and/or attempts to recognize odors. Beyond its specific role in olfaction, mdT
has broad connectivity to the pCC and vmPFC regions and it has been suggested that pulvinar and mdT may
be involved in suppression of task positive networks and/or enhancement of the default mode n etworks48. Thus,
it is also possible that mdT responses here reflect its mediating role in focusing on internal processes, such as
sensory memories. However, we did not find evidence for a role for the mdT in the connectivity network that
can classify participants in the normosmia and functional anosmia groups. This apparent contradiction likely
reflects the inherent differences in metrics used (i.e. functional connectivity versus voxel-wise responses); we
used both approaches for enhanced rigor and because they each uniquely contribute information about how
olfactory impairment affects neural responses. CPM relies on a 268-node functional parcellation of the brain,
rather than an anatomical parcellation, which could obscure effects from small nuclei in the thalamus.
We observed no difference in piriform activation across olfactory impaired groups and their healthy counter-
parts as well as no evidence of piriform cortex connectivity contributing to our model. Several previous studies
in patients with olfactory loss do not observe differences in piriform cortex responses to odors39–41; however, to
our knowledge we are the first to explicitly assess whether responses in piriform cortex are of similar magnitude
across functionally different groups with reference to an expected effect size from another study38. Why would
patients with olfactory loss still show a neural response to odor vs odorless in the primary olfactory cortex? This
may be understood in the context of the type of olfactory impairment, in this case post-traumatic, which may
lead to functional anosmia, but not complete anosmia (as observed in congenital cases for example). Reichert
et al.40 demonstrated piriform activation in response to sniffing clean air among patients with functional anosmia,
and suggested that these patients may still have partially intact pathways from the olfactory epithelium to the
piriform, but no higher-order processing leading to perception. Such patients may not be aware of odors, but
still show neural responses to odors. This is consistent with numerous studies showing that unconscious odor
detection may alter brain a ctivity57–59, and even b
ehavior60. Functional neuroimaging studies on patients with
isolated congenital olfactory impairment, which to our knowledge do not exist at this time, may lend substance
to this explanation. Interestingly, very recently a report on intact resting-state networks in olfactory areas were
confirmed in congenital anosmia61. The current results suggest that the post-traumatic damage causing olfactory
dysfunction is central and in other brain areas than the primary olfactory cortex, however, it is also possible that
this network reflects regions that have adapted to cope with olfactory loss.
Conclusion
With increased post-traumatic olfactory function (normosmia > hyposmia > functional anosmia) we observed
greater responses to odor vs odorless stimuli in frontal operculum, but not in piriform cortex. In addition, we
observed reduced responses with increased olfactory function in mediodorsal thalamus, ventromedial prefrontal
cortex and posterior cingulate cortex. Connectivity in a large-scale network that includes frontal operculum,
ventromedial prefrontal cortex and posterior cingulate cortex discriminates between patients with anosmia or
normosmia. These results imply that olfactory function in the central nervous system is not best captured by
responses to odor vs odorless in canonical olfactory cortex. Rather, olfactory function is best characterized by
connectivity in functional networks excluding canonical olfactory cortex. Future studies should focus on testing
the role of these functional networks and whether modulation of these networks may improve function.
As hinted at in past papers, objective diagnosis of olfactory impairment is possible with functional scans via
fMRI, implicating its potential clinical usefulness. Similar to E EG26, this neuroimaging technique provides a
non-invasive and objective (albeit expensive) avenue for impairment assessment as certain brain networks sig-
nify presence of olfactory dysfunction. Creating a larger training set of patients and controls along with adding
additional variables to the CPM may increase its discriminating power. As mentioned earlier, structural differ-
ences from voxel-based morphometry have showed many differences between olfactory impairment groups.
Thus, combining both structural and functional imaging measures may make the model more specific (e.g.,
discriminate hyposmia from anosmia).
Methods
Participants. Patients who entered hospital treatment for traumatic impact were evaluated for study eligi-
bility. These patients underwent a standard ear, nose, and throat (ENT) examination with an endoscope as well
as objective olfactory testing with Sniffin’ Sticks. Patients having an age-adjusted composite score within the
hyposmia (~ 16 to 32) or functional anosmia range (< 16) were invited to participate in the study8. “Functional”
anosmia is a quantitatively reduced olfaction to the extent that a subject has no function useful in daily life
while anosmia is the absence of all olfactory function1. In this report, the “anosmia” group includes individuals
with “functional” anosmia as well as total olfactory loss or “true” anosmia, so it should be noted that there may
still be residual function in individuals in this group. We will refer to this group from here on as “anosmia”. All
participants filled out a medical questionnaire and had no major comorbidities, acute diseases, or took medicine
that would significantly impact their sense of smell. A control sample (n = 22) was recruited in and around the
campus of the Technical University and hospital in Dresden. Participants in the control sample were tested, and
scored within the healthy olfactory functionality range (~ > 32) and will be described as the “normosmia” group
Scientific Reports | (2021) 11:4043 | https://doi.org/10.1038/s41598-021-83621-2 8
Vol:.(1234567890)www.nature.com/scientificreports/
hereafter. Participants with normosmia reported that they had no previous head traumas nor olfactory issues
while the patient groups reported no olfactory issues prior to their trauma. Traumatic damage severity scores
were calculated for a subset (50 out of 63) of the patients (by a neurologist on staff that inspected the anatomical
MRI images) with a range from none to severe depending on the 11 brain regions evaluated62. This quantifica-
tion is a composite of both degree of lesion and the number of brain regions affected. We also calculated a sum
score of regions affected regardless of degree of lesion and refer to that as “extent scores”). Previous research has
shown the severity of damage correlates with olfactory function17. We evaluated the severity and extent scores in
our subset of 16 out of 22 participants with normosmia, 15 out 16 participants with hyposmia and 19 out of 25
participants with anosmia and observed that the groups differed on these scores, such that there was for more
widespread and severe damage in participants with anosmia/hyposmia relative to participants with normosmia.
This same numerical trend was present for the difference between the anosmia and hyposmia groups, however
the effects here did not reach significance (see Supplementary Table S1; Supplementary Fig. S1). These observa-
tions confirm that olfactory dysfunction here reflects degree of brain trauma.
fMRI Procedure and Processing. Procedure. For fMRI acquisition, participants underwent a block de-
sign during which the common, culturally-relevant odors peach and coffee were delivered at neat concentra-
tions (peach and coffee; Frey & Lau, Henstedt-Ulzburg, Germany). These odors were selected from pilot studies
with an expert panel (n = 6) and produced little or no trigeminal sensation as indicated by ratings. Odors were
presented intranasally with an olfactometer (2 L/min flow). During each run, one odor was presented to one of
the nostrils, in alternating 6 ON and 6 OFF blocks, for a total of 96 volumes. The duration of one run was 4 min.
The ON blocks were 20 s long, with 6 odor presentations (stimulus duration of 2 s) separated by 1 s interstimu-
lus intervals (ISIs). OFF blocks consisted of continuous presentation of running air. There were no differences
between ON and OFF blocks, with the exception of ON blocks having an odor in the airstream. There were total
of four runs, for each combination of odor and nostril that were randomized within participant. At the end of
each of run, while the scanner was not collecting volumes, individuals were asked to verbally rate the intensity
[not perceived (0) to extremely strong (10)] and valence [very unpleasant (-5) to very pleasant (5)] of the odor
as well as try to freely identify the odor (4 odors, expressed as proportion correct). Participants had the study
design explained to them and were asked to breathe normally throughout the scanning session. Each session
took approximately 45 min.
fMRI scanning parameters. A 1.5 T magnetic resonance imaging scanner (Siemens Sonata; Siemens, Erlangen,
Germany) with a full-head eight channel receiver coil was used for image acquisition. A gradient echo T2-sen-
sitive echo planar imaging sequence was employed for 96 functional volumes in thirty-three slice locations,
covering the entire head (repetition time [TR]: 2500 ms, echo time [TE]: 40 ms, image matrix: 64 × 64, in-plane
resolution: 3 mm, through-plane resolution: 3.75 mm). Our TE was selected because it had been established for
1.5 T scanners for the imaging of limbic structures63. Images were acquired in the axial plane oriented parallel
to the planum sphenoidale to minimize artifacts. A full brain (192 slices) T1-weighted turbo FLASH three-
dimensional sequence was acquired to overlay functional data (TR: 2180 ms, TE: 3.93 ms, slice thickness: 1 mm).
Data analysis. Demographic and behavioral data. Demographic and behavioral data were analyzed with
GraphPad Prism 7.01 (GraphPad Software Inc.). We calculated normality for impairment duration, TDI, the
TDI subscales, age, free ID, intensity and pleasantness ratings. For all variables except impairment duration, we
used an ordinary one-way ANOVA with group as the between-subjects factor if normality was not violated, and
Kruskal–Wallis ANOVA if normality was violated for one or more groups. To test for differences in impairment
duration between hyposmia and anosmia, we used a non-parametric Mann–Whitney U test. Post-hoc t tests to
assess differences between each of the groups were corrected for multiple comparisons using a two state linear
step-up procedure of Benjamini, Krieger and Yekuteli for ordinary ANOVA and Dunn’s procedure for Kruskal–
Wallis ANOVA. For gender distribution differences across groups we performed a Chi-square test. Correlations
were calculated with Pearson’s coefficient. All analyses used an alpha of 0.05 to determine significance.
fMRI preprocessing. Data were analyzed on Linux workstations using MATLAB R2011a (MathWorks) and
SPM12 (Wellcome Trust Centre for Neuroimaging, London, UK). Functional images were realigned and coreg-
istered to the T1 image. The anatomical T1 image was processed using a unified segmentation procedure com-
bining segmentation, bias correction, and spatial normalization64. The same normalization parameters were
then used to normalize the functional images. All functional images were detrended using a method for remov-
ing any linear components matching the global signal at each voxel65. Finally, functional images were smoothed
with a 6 mm FWHM isotropic Gaussian kernel.
Voxel‑wise fMRI analysis for group differences. We ran a voxel-wise analysis aimed at isolating brain regions
that respond to odor vs odorless in all olfactory impairment groups. For the time-series analysis on all partici-
pants’ data, a high-pass filter (300 s) was included in the filtering matrix (adjusted from the convention in SPM12
to reflect the longer period between two blocks) to remove low-frequency noise and slow drifts in the signal.
Condition-specific effects at each voxel were estimated using the general linear model. The response to events
was modeled by a canonical hemodynamic response function included in SPM12. The temporal derivative of the
hemodynamic response function was also included as part of the basis set to account for up to 1 s shifts in the
timing of the events66. There were two events of interest, “odor” and “odorless.” For “odor”, all odor ON blocks
(regardless of nostril or odor quality) were collapsed into a single event. For “odorless” we modeled all OFF
blocks. Each event had a duration of 20 s. The Artifact Detection Tools (ART) toolbox for MATLAB was used
Scientific Reports | (2021) 11:4043 | https://doi.org/10.1038/s41598-021-83621-2 9
Vol.:(0123456789)www.nature.com/scientificreports/
to detect global mean and motion outliers in the functional data (Gabrieli Laboratory, McGovern Institute for
Brain Research, Cambridge, MA, USA). Motion parameters were included as regressors in the design matrix at
the single-subject level. In addition, image volumes in which the z-normalized global brain activation exceeded
3 SDs from the mean of the run or showed 1 mm of composite (linear plus rotational) movement were flagged
as outliers and deweighted during SPM estimation. For each participant we created a single contrast of interest:
odor minus odorless.
To assess the effect of olfactory impairment we created a second-level analysis with between-subjects factor
“group.” The parameter estimate images of odor vs. odorless for each participant were entered into a one-way
ANOVA. We included covariates-of-no-interest for age and gender. We created a T-contrast for the average effect
of group and a linear F-contrast of group. The t-map threshold was set at punccorected < 0.005 and a minimum 5 voxel
cluster size. Clusters were considered significant at P < 0.05 Family Wise Error (FWE) corrected at the cluster
level. A less stringent region of interest (ROI) correction approach was used for responses in predicted regions
of olfactory cortex. We performed small volume searches using spheres (6 mm radius) around coordinates in
thalamus, insula, and piriform from previous w ork47.
Equivalence testing. We used Han et al. to determine an expected meaningful effect size for differences between
groups in piriform cortex38. We then tested for the significant absence of an effect (or the equivalence of two
groups) with the “Two One-Sided Tests” (TOST) procedure67,68. This procedure can be used to determine
whether an effect size is surprisingly small compared to an existing effect. We used the TOST two-sample stu-
dent t test with parameter estimates extracted from the peak voxel in the four clusters in piriform cortex (Sup-
plementary Table S2) where we observed a main effect of odor-odorless.
Connectome‑based predictive modeling. We performed Connectome-based Predictive Modeling (CPM) on the
entire time-series acquired to examine whether whole-brain functional connectivity correlates with olfactory
impairment category (i.e. functional anosmia, hyposmia, or normosmia). Normalized, motion-corrected images
were preprocessed in BioImage Suite for use in our functional connectivity analysis69. Motion correction at this
stage included regression of 24 parameters of motion, comprising six rigid-body motion parameters, their tem-
poral derivatives, and their s quares70. We regressed the mean time courses of the global signal, CSF, and white
matter from the data, implemented linear trend removal and low-pass filtering. We then created functional
connectivity matrices for each participant using a 268-node whole-brain p arcellation71. Functional connectivity
matrices were created in BioImage Suite by averaging the BOLD signal among all voxels within a given node and
correlating, using Pearson’s r, this time course with those obtained from every other node. This process was then
repeated iteratively until a 268 × 268 correlation matrix was obtained for each participant. Connectivity matrices
were then Fisher Transformed to convert the skewed distribution of r values to an approximately normal distri-
bution. Matrices were averaged across runs to generate a mean matrix per participant, which was then collapsed
across participants to yield a 268 × 268 × N-participant matrix.
CPM implements linear regression to correlate, using Pearson’s r, each edge (i.e. connection) in each connec-
tivity matrix with TDI scores or ‘impairment group membership’ per participant. Because CPM is not optimized
to discriminate among multiple classes, we used it as a binary classifier to discriminate between functional
anosmia and normosmia, normosmia and hyposmia, and functional anosmia and hyposmia patient statuses. In
this case, status was coded as either a 0 or 1 and estimates for these values were rounded either up (to 1) or down
(to 0) to determine model accuracy. Following correlation, each edge is subsequently associated with a p value
and a threshold is applied, in this case p = 0.01, to determine the most relevant edges to build our brain-behavior
model. Two networks are then created, a positive network consisting of positive edges (i.e. positively correlated
with behavior), and a negative network consisting of negative edges (i.e. negatively correlated with behavior). A
single subject summary value, ‘network strength’ is then calculated for both positive and negative networks by
summing their respective strengths. This analysis uses a leave-one-out cross validation framework, with models
created on N-1 participants to relate positive and negative network strengths to behavior. The model is then
applied prospectively to the left-out participant’s network strengths to generate an estimated behavioral score.
Correlations between observed and estimated scores were only obtained for TDI scores. To determine the
significance of these correlations, we conducted permutation testing; here, 1000 repetitions of CPM with ran-
domly shuffled observed scores were used to generate estimated scores and networks. The 1000 correlation
coefficients comprised a null distribution against which the correlation coefficients obtained in Results were
tested for significance. The final p values were the number of permutations out of 1000 that resulted in higher
correlation coefficients than those reported in “Results”.
Average frame-to-frame displacement (FTF) was used as a covariate in our CPM analysis due to the con-
founding nature of subject motion in functional connectivity analyses. In brief, FTF was calculated by taking the
Euclidean distance from the center of gravity of one image to the next, summing these distances within a run,
and then averaging across runs to create a single score per p articipant70.
Ethics statement. The study was performed in accordance with the Declaration of Helsinki on Biomedical
Studies Involving Human Subjects.
Informed consent . Informed written consent was obtained from all the participants. The study design and
consent approach were approved by the University of Dresden Medical Faculty Ethics Review Board.
Scientific Reports | (2021) 11:4043 | https://doi.org/10.1038/s41598-021-83621-2 10
Vol:.(1234567890)www.nature.com/scientificreports/
Received: 5 June 2020; Accepted: 29 January 2021
References
1. Hummel, T. et al. Position paper on olfactory dysfunction. Rhinol. J. 10, 1–30 (2017).
2. Schofield, P. W., Moore, T. M. & Gardner, A. Traumatic brain injury and olfaction: A systematic review. Front. Neurol. 5, 20 (2014).
3. Ciofalo, A. et al. Mild traumatic brain injury: Evaluation of olfactory dysfunction and clinical–neurological characteristics. Brain
Inj. 32, 550–556 (2018).
4. Kruijk, J. R. D. et al. Olfactory function after mild traumatic brain injury. Brain Inj. 17, 73–78 (2003).
5. Hummel, T., Urbig, A., Huart, C., Duprez, T. & Rombaux, P. Volume of olfactory bulb and depth of olfactory sulcus in 378 con-
secutive patients with olfactory loss. J. Neurol. 262, 1046–1051 (2015).
6. Reden, J. et al. Recovery of olfactory function following closed head injury or infections of the upper respiratory tract. Arch.
Otolaryngol. Neck Surg. 132, 265–269 (2006).
7. Giguère, F. L., Frasnelli, A., Guise, É. D. & Frasnelli, J. Olfactory, cognitive and affective dysfunction assessed 24 hours and one
year after a mild Traumatic Brain Injury (mTBI). Brain Inj. 33, 1184–1193 (2019).
8. Hummel, T., Sekinger, B., Wolf, S. R., Pauli, E. & Kobal, G. ‘Sniffin’ sticks’: Olfactory performance assessed by the combined testing
of odor identification, odor discrimination and olfactory threshold. Chem. Senses 22, 39–52 (1997).
9. Finn, E. S. et al. Functional connectome fingerprinting: Identifying individuals using patterns of brain connectivity. Nat. Neurosci.
18, 1664–1671 (2015).
10. Rosenberg, M. D. et al. Methylphenidate modulates functional network connectivity to enhance attention. J. Neurosci. 36, 9547–
9557 (2016).
11. Hsu, W.-T., Rosenberg, M. D., Scheinost, D., Constable, R. T. & Chun, M. M. Resting-state functional connectivity predicts neu-
roticism and extraversion in novel individuals. Soc. Cogn. Affect. Neurosci. 13, 224–232 (2018).
12. Farruggia, M. C. et al. Identification of a brain fingerprint for overweight and obesity. Physiol. Behav. 222, 112940 (2020).
13. Yip, S. W., Scheinost, D., Potenza, M. N. & Carroll, K. M. Connectome-based prediction of cocaine abstinence. Am. J. Psychiatry
176, 156–164 (2019).
14. Fjaeldstad, A. et al. Brain fingerprints of olfaction: A novel structural method for assessing olfactory cortical networks in health
and disease. Sci. Rep. 7, 42534 (2017).
15. Frasnelli, J., Fark, T., Lehmann, J., Gerber, J. & Hummel, T. Brain structure is changed in congenital anosmia. NeuroImage 83,
1074–1080 (2013).
16. Bitter, T. et al. Anosmia leads to a loss of gray matter in cortical brain areas. Chem. Senses 35, 407–415 (2010).
17. Han, P. et al. Alterations of brain gray matter density and olfactory bulb volume in patients with olfactory loss after traumatic brain
injury. J. Neurotrauma 35, 2632–2640 (2018).
18. Sobel, N. et al. Odorant-induced and sniff-induced activation in the cerebellum of the human. J. Neurosci. 18, 8990–9001 (1998).
19. Rombaux, P. et al. Retronasal and orthonasal olfactory function in relation to olfactory bulb volume in patients with posttraumatic
loss of smell. Laryngoscope 116, 901–905 (2006).
20. Rombaux, P. et al. Olfactory function and olfactory bulb volume in patients with postinfectious olfactory loss. Laryngoscope 116,
436–439 (2006).
21. Hummel, T. et al. Depth of olfactory sulcus and olfactory function. Brain Res. 975, 85–89 (2003).
22. Han, P., Zang, Y., Akshita, J. & Hummel, T. Magnetic resonance imaging of human olfactory dysfunction. Brain Topogr. 20, 20
(2019).
23. Reichert, J. L. & Schöpf, V. Olfactory loss and regain: Lessons for neuroplasticity. Neuroscientist 24, 22–35 (2018).
24. Schriever, V. A. et al. Time frequency analysis of olfactory induced EEG-power change. PLoS One 12, e0185596 (2017).
25. Hummel, T. & Welge-Luesen, A. Assessment of olfactory function. Adv. Otorhinolaryngol. 63, 84–98 (2006).
26. Huart, C., Legrain, V., Hummel, T., Rombaux, P. & Mouraux, A. Time-frequency analysis of chemosensory event-related potentials
to characterize the cortical representation of odors in humans. PLoS One 7, e33221 (2012).
27. Hummel, T. & Kobal, G. Olfactory event-related potentials. In Methods and Frontiers in Chemosensory Research 429–464 (CRC
Press, Boca Raton, 2001).
28. Loetsch, J. & Hummel, T. The clinical significance of electrophysiological measures of olfactory function. Behav. Brain Res. 170,
78–83 (2006).
29. Iravani, B., Arshamian, A., Ohla, K., Wilson, D. A. & Lundström, J. N. Non-invasive recording from the human olfactory bulb.
Nat. Commun. 11, 1–10 (2020).
30. Lee, V. K., Nardone, R., Wasco, F., Panigrahy, A. & Zuccoli, G. Delayed activation of the primary orbitofrontal cortex in post-
traumatic anosmia. Brain Inj. 30, 1737–1741 (2016).
31. Levy, L. M., Henkin, R. I., Lin, C. S. & Finley, A. Rapid imaging of olfaction by functional MRI (fMRI): Identification of presence
and type of hyposmia. J. Comput. Assist. Tomogr. 23, 767 (1999).
32. Levy, L. M., Henkin, R. I., Lin, C. S., Hutter, A. & Schellinger, D. Odor memory induces brain activation as measured by functional
MRI. J. Comput. Assist. Tomogr. 23, 487 (1999).
33. Henkin, R. I. & Levy, L. M. Functional MRI of congenital hyposmia: Brain activation to odors and imagination of odors and tastes.
J. Comput. Assist. Tomogr. 26, 39 (2002).
34. Iannilli, E. et al. Differences in anosmic and normosmic group in bimodal odorant perception: A functional-MRI study. Rhinology
49, 458–463 (2011).
35. Iannilli, E., Gerber, J., Frasnelli, J. & Hummel, T. Intranasal trigeminal function in subjects with and without an intact sense of
smell. Brain Res. 1139, 235–244 (2007).
36. Levy, L. M., Henkin, R. I., Hutter, A., Lin, C. S. & Schellinger, D. Mapping brain activation to odorants in patients with smell loss
by functional MRI. J. Comput. Assist. Tomogr. 22, 96 (1998).
37. Kollndorfer, K. et al. Olfactory training induces changes in regional functional connectivity in patients with long-term smell loss.
NeuroImage Clin. 9, 401–410 (2015).
38. Han, P. et al. Impaired brain response to odors in patients with varied severity of olfactory loss after traumatic brain injury. J.
Neurol. 265, 2322–2332 (2018).
39. Moon, W.-J., Park, M., Hwang, M. & Kim, J. K. Functional MRI as an objective measure of olfaction deficit in patients with trau-
matic anosmia. Am. J. Neuroradiol. 39, 2320–2325 (2018).
40. Reichert, J. L. et al. Severity of olfactory deficits is reflected in functional brain networks—an fMRI study. Hum. Brain Mapp. 39,
3166–3177 (2018).
41. Pellegrino, R. et al. Olfactory function in patients with hyposmia compared to healthy subjects—an fMRI study. Rhinology 54,
374–381 (2016).
42. Doty, R. L. et al. Smell identification ability: Changes with age. Science 226, 1441–1443 (1984).
43. Carmichael, S. T., Clugnet, M. C. & Price, J. L. Central olfactory connections in the macaque monkey. J. Comp. Neurol. 346, 403–434
(1994).
Scientific Reports | (2021) 11:4043 | https://doi.org/10.1038/s41598-021-83621-2 11
Vol.:(0123456789)www.nature.com/scientificreports/
44. Saleem, K. S., Kondo, H. & Price, J. L. Complementary circuits connecting the orbital and medial prefrontal networks with the
temporal, insular, and opercular cortex in the macaque monkey. J. Comp. Neurol. 506, 659–693 (2008).
45. Seubert, J., Freiherr, J., Djordjevic, J. & Lundström, J. N. Statistical localization of human olfactory cortex. NeuroImage 66, 333–342
(2013).
46. Zhou, G., Lane, G., Cooper, S. L., Kahnt, T. & Zelano, C. Characterizing functional pathways of the human olfactory system. eLife
8, e47177 (2019).
47. Veldhuizen, M. G. & Small, D. M. Modality-specific neural effects of selective attention to taste and odor. Chem. Sens. 36, 747–760
(2011).
48. Buckner, R. L., Andrews-Hanna, J. R. & Schacter, D. L. The brains default network: Anatomy, function, and relevance to disease.
In The Year in Cognitive Neuroscience 2008 (ed. Sath, D.) 1–38 (Blackwell Publishing, New York, 2008).
49. Weissman, D. H., Roberts, K. C., Visscher, K. M. & Woldorff, M. G. The neural bases of momentary lapses in attention. Nat. Neu‑
rosci. 9, 971–978 (2006).
50. Mason, M. F. et al. Wandering minds: The default network and stimulus-independent thought. Science 315, 393–395 (2007).
51. Buckner, R. L. & DiNicola, L. M. The brain’s default network: Updated anatomy, physiology and evolving insights. Nat. Rev. Neurosci.
20, 593–608 (2019).
52. Zhou, H.-X. et al. Rumination and the default mode network: Meta-analysis of brain imaging studies and implications for depres-
sion. NeuroImage 116287, 20. https://doi.org/10.1016/j.neuroimage.2019.116287 (2019).
53. Doty, R. L., Genow, A. & Hummel, T. Scratch density differentiates microsmic from normosmic and anosmic subjects on the
University of Pennsylvania Smell Identification Test. Percept. Mot. Skills 86, 211–216 (1998).
54. Courtiol, E. & Wilson, D. A. Neural representation of odor-guided behavior in the rat olfactory thalamus. J. Neurosci. 36, 5946–5960
(2016).
55. Plailly, J., Howard, J. D., Gitelman, D. R. & Gottfried, J. A. Attention to odor modulates thalamocortical connectivity in the human
brain. J. Neurosci. 28, 5257–5267 (2008).
56. Tham, W. W. P., Stevenson, R. J. & Miller, L. A. The functional role of the medio dorsal thalamic nucleus in olfaction. Brain Res.
Rev. 62, 109–126 (2009).
57. Lorig, T. S. Beyond self-report: Brain imaging at the threshold of odor perception. Chemosens. Percept. 5, 46–54 (2012).
58. Sobel, N. et al. Blind smell: Brain activation induced by an undetected air-borne chemical. Brain 122(Pt 2), 209–217 (1999).
59. Zucco, G. M., Priftis, K. & Stevenson, R. J. From blindsight to blindsmell: A mini review. Transl. Neurosci. 6, 20 (2014).
60. Arzi, A., Rozenkrantz, L., Holtzman, Y., Secundo, L. & Sobel, N. Sniffing patterns uncover implicit memory for undetected odors.
Curr. Biol. 24, R263–R264 (2014).
61. Peter, M. G. et al. Normal olfactory functional connectivity despite lifelong absence of olfactory experiences. Cortex Cereb. https
://doi.org/10.1093/cercor/bhaa217 (2021).
62. Lötsch, J. et al. A brain-lesion pattern based algorithm for the diagnosis of posttraumatic olfactory loss. Rhinology 53, 365–370
(2015).
63. Stöcker, T. & Shah, N. J. MP-SAGE: A new MP-RAGE sequence with enhanced SNR and CNR for brain imaging utilizing square-
spiral phase encoding and variable flip angles. Magn. Reson. Med. 56, 824–834 (2006).
64. Ashburner, J. & Friston, K. J. Unified segmentation. NeuroImage 26, 839–851 (2005).
65. Macey, P. M., Macey, K. E., Kumar, R. & Harper, R. M. A method for removal of global effects from fMRI time series. NeuroImage
22, 360–366 (2004).
66. Henson, R. N., Price, C. J., Rugg, M. D., Turner, R. & Friston, K. J. Detecting latency differences in event-related BOLD responses:
Application to words versus nonwords and initial versus repeated face presentations. NeuroImage 15, 83–97 (2002).
67. Lakens, D. Equivalence tests: A practical primer for t tests, correlations, and meta-analyses. Soc. Psychol. Personal. Sci. 8, 355–362
(2017).
68. Lakens, D., Scheel, A. M. & Isager, P. M. Equivalence testing for psychological research: A tutorial. Adv. Methods Pract. Psychol.
Sci. 1, 259–269 (2018).
69. Joshi, A. et al. Unified framework for development, deployment and robust testing of neuroimaging algorithms. Neuroinformatics
9, 69–84 (2011).
70. Satterthwaite, T. D. et al. An improved framework for confound regression and filtering for control of motion artifact in the pre-
processing of resting-state functional connectivity data. NeuroImage 64, 20 (2013).
71. Shen, X., Tokoglu, F., Papademetris, X. & Constable, R. T. Groupwise whole-brain parcellation from resting-state fMRI data for
network node identification. NeuroImage 82, 403–415 (2013).
Acknowledgements
We would like to thank Nicole Reither and Thomas Hummel for assistance with data acquisition and Dustin
Scheinost for help in implementing Connectome-based Predictive Modeling. This work was supported by the
National Institutes of Health training Grant T32NS041228 (M.C.F.); the Yale Medical School Fellowship (M.C.F.).
Funding for open access to this research was provided by University of Tennessee’s Open Publishing Support
Fund (R.P.). This publication/paper has been produced benefiting from the 2232 International Fellowship for
Outstanding Researchers Program of TÜBİTAK (Project No. 118C299) to M.G.V. However, the entire respon-
sibility of the publication/paper belongs to the owner of the publication/paper. The financial support received
from TÜBİTAK does not mean that the content of the publication is approved in a scientific sense by TÜBİTAK.
Author contributions
Conceptualization—R.P., M.C.F., D.M.S., and M.G.V.; data analysis—R.P., M.C.F. and M.G.V.; writing – R.P.,
M.C.F.,D.M.S., and M.G.V.; visualization—M.G.V. and M.C.F.; supervision—M.G.V.; funding acquisition—R.P.
Competing interests
The authors declare no competing interests.
Additional information
Supplementary Information The online version contains supplementary material available at https://doi.
org/10.1038/s41598-021-83621-2.
Correspondence and requests for materials should be addressed to R.P.
Reprints and permissions information is available at www.nature.com/reprints.
Scientific Reports | (2021) 11:4043 | https://doi.org/10.1038/s41598-021-83621-2 12
Vol:.(1234567890)www.nature.com/scientificreports/
Publisher’s note Springer Nature remains neutral with regard to jurisdictional claims in published maps and
institutional affiliations.
Open Access This article is licensed under a Creative Commons Attribution 4.0 International
License, which permits use, sharing, adaptation, distribution and reproduction in any medium or
format, as long as you give appropriate credit to the original author(s) and the source, provide a link to the
Creative Commons licence, and indicate if changes were made. The images or other third party material in this
article are included in the article’s Creative Commons licence, unless indicated otherwise in a credit line to the
material. If material is not included in the article’s Creative Commons licence and your intended use is not
permitted by statutory regulation or exceeds the permitted use, you will need to obtain permission directly from
the copyright holder. To view a copy of this licence, visit http://creativecommons.org/licenses/by/4.0/.
© The Author(s) 2021
Scientific Reports | (2021) 11:4043 | https://doi.org/10.1038/s41598-021-83621-2 13
Vol.:(0123456789)You can also read