Tongue Fat and its Relationship to Obstructive Sleep Apnea
←
→
Page content transcription
If your browser does not render page correctly, please read the page content below
pii: sp-00806-13                                                                                                          http://dx.doi.org/10.5665/sleep.4072

    TONGUE FAT AND ITS RELATIONSHIP TO OBSTRUCTIVE SLEEP APNEA

Tongue Fat and its Relationship to Obstructive Sleep Apnea
Andrew M. Kim, BS1; Brendan T. Keenan, MS1; Nicholas Jackson, MPH1; Eugenia L. Chan, BA1; Bethany Staley, RPSGT, CRC1; Harish Poptani, PhD3;
Drew A. Torigian, MD, MA3; Allan I. Pack, MBChB, PhD1,2; Richard J. Schwab, MD1,2
Center for Sleep & Circadian Neurobiology, University of Pennsylvania, Philadelphia, PA; 2Division of Sleep Medicine, Department of Medicine,
1

University of Pennsylvania, Philadelphia, PA; 3Department of Radiology, University of Pennsylvania, Philadelphia, PA

    Study Objectives: The objective of this study was to determine whether tongue fat is increased in obese sleep apneics compared to obese
    subjects without sleep apnea. We hypothesized that excess fat is deposited in the tongue in obese patients with sleep apnea.
    Design: Case-control design.

                                                                                                                                                                  Downloaded from https://academic.oup.com/sleep/article-abstract/37/10/1639/2416812 by guest on 26 January 2020
    Setting: Academic medical center.
    Patients: We examined tongue fat in 31 obese controls (apnea-hypopnea index, 4.1 ± 2.7 events/h) and 90 obese apneics (apnea-hypopnea index,
    43.2 ± 27.3 events/h). Analyses were repeated in a subsample of 18 gender-, race-, age-, and BMI-matched case-control pairs.
    Interventions: All subjects underwent a MRI with three-point Dixon magnetic resonance imaging. We used sophisticated volumetric reconstruction
    algorithms to study the size and distribution of upper airway fat deposits in the tongue and masseter muscles within apneics and obese controls.
    Measurements and Results: The data supported our a priori hypotheses that after adjustment for age, BMI, gender, and race, the tongue in
    apneics was significantly larger (P = 0.001) and had an increased amount of fat (P = 0.002) compared to controls. Similar results were seen in our
    matched sample. Our data also demonstrate that within the apneic and normal tongue, there are regional differences in fat distribution, with larger
    fat deposits at the base of the tongue.
    Conclusions: There is increased tongue volume and deposition of fat at the base of tongue in apneics compared to controls. Increased tongue fat
    may begin to explain the relationship between obesity and obstructive sleep apnea.
    Keywords: obstructive sleep apnea, tongue fat
    Citation: Kim AM, Keenan BT, Jackson N, Chan EL, Staley B, Poptani H, Torigian DA, Pack AI, Schwab RJ. Tongue fat and its relationship to
    obstructive sleep apnea. SLEEP 2014;37(10):1639-1648.

INTRODUCTION                                                                   fat deposition in the tongue compared to wild-type controls.8,11
   Obstructive sleep apnea (OSA) is a major public health                      Tongue fat in the NZO mice was associated with a narrowed
burden affecting greater than 15 million adult Americans—                      upper airway.9
more worldwide—and is associated with important medical                           The primary goal of this study was to identify alterations in
consequences.1-5 The prevalence of OSA is increasing, mir-                     fat deposition within the tongue of obese apneics in comparison
roring the rising weight of the average individual, as obesity is              to obese subjects without sleep apnea, using the three-point
the strongest risk factor for the development of OSA.4,6,7                     Dixon method (a method for fat/water discrimination).12 The
   The mechanisms by which obesity confers risk for OSA,                       Dixon method has been validated in fat/water phantoms, and
however, are essentially unknown. We hypothesize that fat                      this imaging modality has been shown to be highly reproduc-
deposition will increase overall tissue volume in upper airway                 ible and accurate for determining fat volumes.9 We used a case-
structures, thereby playing an important role in the pathogen-                 control design to examine our a priori hypotheses that: (1) the
esis of OSA. Based on previous studies,8,9 we hypothesized                     volume of fat within the tongue is increased in obese patients
that fat deposition in the tongue could be a major link be-                    with OSA in comparison to obese subjects without OSA, sug-
tween obesity and OSA. An autopsy study demonstrated that                      gesting that increased tongue fat volume is an independent OSA
the human tongue has a high percentage of fat (with more                       risk factor; (2) the percentage of fat in the tongue is greater than
fat localized at the tongue base), and that tongue weight and                  in other upper airway muscles (e.g., masseters); and (3) based
tongue fat percentage were positively correlated to the degree                 on the previously mentioned autopsy study,10 tongue fat has a
of obesity.10 However, this study did not specifically examine                 specific regional topography, such that it is more prominent at
patients with OSA. A mutant mouse with obesity, the New                        the base of tongue. Portions of this investigation have been pre-
Zealand Obese (NZO), has also been shown to have increased                     viously presented as an abstract.13

                                                                                  METHODS
A commentary on this article appears in this issue on page 1583.
                                                                               Subjects
Submitted for publication December, 2013                                          The present study used a case-control design in overweight
Submitted in final revised form March, 2014                                    or obese apneics and non-apneics. The University of Penn-
Accepted for publication March, 2014                                           sylvania (Philadelphia, PA, USA) Institutional Review Board
Address correspondence to: Richard J. Schwab, MD, Division of Sleep            for human studies approved the protocol (protocol numbers
Medicine, Center for Sleep and Circadian Neurobiology, University of           808496 and 809398), and written informed consent was ob-
Pennsylvania Perelman School of Medicine, 3624 Market Street, Suite            tained from each subject. Overweight or obese cases were
205 Philadelphia, PA 19104; Tel: (215) 349-5477; E-mail: rschwab@mail.         recruited primarily from the Center for Sleep and Circadian
med.upenn.edu                                                                  Neurobiology (Philadelphia, PA) outpatient practice. Cases
SLEEP, Vol. 37, No. 10, 2014                                               1639             Tongue Fat in Patients with Obstructive Sleep Apnea—Kim et al.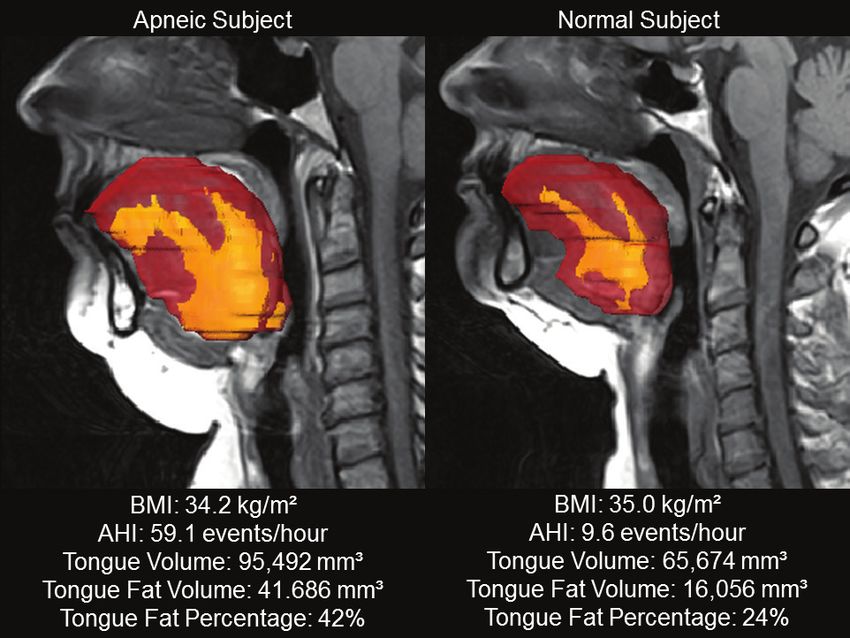
The MR imaging analysis was
                                                                                                                     split into 2 domains: volumetric
                                                                                                                     analysis of soft tissues (tongue
                                                                                                                     and masseter) and intramuscular
                                                                                                                     fat (tongue and masseter) quanti-
                                                                                                                     fication. Soft tissue volumes were
                                                                                                                     obtained from the standard T1
                                                                                                                     spin-echo axial images. The seg-
                                                                                                                     mented boundaries of the tongue
                                                                                                                     and masseter were determined
                                                                                                                     from the spin-echo images and
                                                                                                                     then superimposed on the Dixon
                                                                                                                     images for proper tissue visualiza-

                                                                                                                                                           Downloaded from https://academic.oup.com/sleep/article-abstract/37/10/1639/2416812 by guest on 26 January 2020
                                                                                                                     tion. Fat-weighted Dixon images
                                                                                                                     provide a clear indication of adi-
                                                                                                                     pose tissue, but the boundaries of
                                                                                                                     soft tissues are not as distinct in
                                                                                                                     comparison to the standard spin-
                                                                                                                     echo images (Figure 1). Intra-
                                                                                                                     muscular fat was then determined
                                                                                                                     using a thresholding method to
                                                                                                                     differentiate fat from the rest of
                                                                                                                     the tongue. The correct grayscale
                                                                                                                     setting to segment tongue fat was
                                                                                                                     chosen based on identifying the
                                                                                                                     appropriate grayscale intensity of
                                                                                                                     the surrounding subcutaneous and
  Figure 1—Comparison of tongue fat using standard T1-weighted spin echo MR imaging vs. fat-weighted Dixon
  MR imaging sequences in an apneic patient. Anatomic definitions of the upper airway regions are demonstrated:      neck fat (Figure S1, supplemental
  retropalatal (RP)—from level of hard palate to caudal margin of soft palate; and retroglossal (RG)—from caudal     material). The topographic distri-
  margin of soft palate to base of tongue. Soft palate, tongue, tongue fat, and airway are denoted with arrows.      bution of tongue fat was further
  Both sagittal images are mid-sagittal and axial images are shown at same level of (mid) tongue. Note that fat      determined by subdividing the
  deposits in tongue are more easily visualized using Dixon MR imaging sequence than the spin echo sequence.         tongue into 8 sections—4 within
                                                                                                                     the retropalatal and 4 within the
                                                                                                                     retroglossal regions of the tongue—
had an apnea-hypopnea index (AHI) ≥ 15 events/hour. Over-                            these regions were based on the craniocaudal axis from the mid-
weight or obese control subjects (BMI ≥ 28.7 kg/m2, AHI ≤ 10                         sagittal MR image (Figures 1 and 2). The retropalatal region of
events/h) were recruited in the Philadelphia area. Subjects                          the tongue was defined from the most rostral portion of the hard
with 10 < AHI < 15 were considered indeterminate and not                             palate to the most caudal tip of the soft palate. The retroglossal
included in this study. In addition to the overall case-control                      region of the tongue was defined from the most caudal margin of
sample, we created a matched subsample of gender, race, age                          the soft palate to the base of the epiglottis (Figure 1)
(within 10 years), and BMI (within 2.5 kg/m2) case-control                              Overall fat within the masseter muscle, within the axial range
pairs for complementary analyses.                                                    of the tongue, was examined as a comparable upper airway
                                                                                     muscle using the same method and grayscale settings. We ana-
Polysomnography                                                                      lyzed 20 subjects and showed there were no differences in the
   Standard polysomnograms were performed as described in                            volume of the masseter, volume of fat in the masseter or mas-
our previous studies.14 See supplemental material for details on                     seter fat percentage between the right and left masseter muscles.
conduct of sleep studies and definition of events and scoring.                       Therefore, fat percentage was determined from subjects’ left
                                                                                     masseter muscles. All MR imaging analyses were performed by
Upper Airway MRI Acquisition                                                         one trained technologist blinded to the subject’s status (apneic
   Using a 1.5 Tesla MAGNETOM Espree Scanner (Siemens                                or control) and supervised by one investigator (RJS).
Medical Systems, Malvern, PA), high resolution upper airway                             Reproducibility of the Dixon MRI was assessed using in-
MR imaging was performed identically in all subjects. See sup-                       traclass correlation coefficients for MR structures (soft tissue
plemental material for details regarding MR imaging sequences                        volumes, tongue fat, and airway volumes) based on measure-
utilized.                                                                            ments performed at 2 different time points in 10 different sub-
                                                                                     jects. Accuracy of our fat volume estimates were assessed by
Anatomic Definitions, Measurements, and Analysis                                     performing Dixon MR imaging of a hamburger (Figure S2,
   Using Amira 4.1.2 (Visage Imaging, San Diego, CA), MR                             supplemental material) and steak before and after injection of
images of the upper airway were manually examined at the                             a known volume of fat (lard) into the tissue (3 cc added to the
Pulmonary Sleep Imaging Center (University of Pennsylvania).                         hamburger and 6 cc added to the steak) and comparing the
SLEEP, Vol. 37, No. 10, 2014                                             1640             Tongue Fat in Patients with Obstructive Sleep Apnea—Kim et al.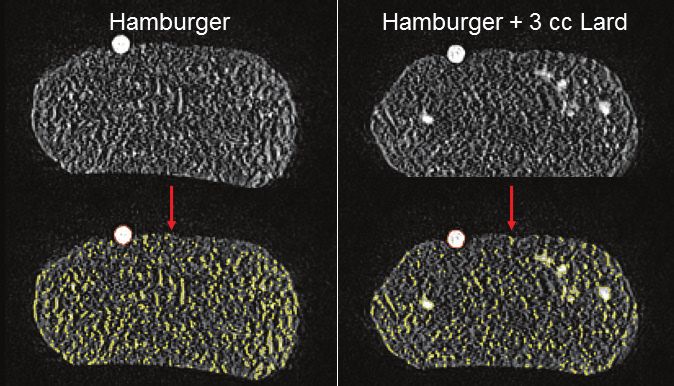
resulting estimates to the known
quantity. We also placed a fat and
water phantom next to each tissue.

Statistical Analysis
   Analyses were performed using
Stata, Version 12 (StataCorp, 2011,
Stata Statistical Software: Release
12. College Station, TX) or SAS
Software, Version 9.3 (SAS Insti-
tute Inc., Cary, NC). Chi-square
tests and unpaired t-tests exam-
ined differences in demographics,

                                                                                                                                                                Downloaded from https://academic.oup.com/sleep/article-abstract/37/10/1639/2416812 by guest on 26 January 2020
soft tissue, and intramuscular fat
volumes between OSA and con-
trol subjects. Differences between
OSA and controls adjusted for age,
BMI, gender, and race were as-
sessed using an analysis of covari-
ance (ANCOVA). Adjusted linear
associations of tongue fat on
AHI were examined using partial
Pearson correlations. The tongue
was divided into 4 subsections per
region in order to conduct within         Figure 2—Representative three-dimensional volumetric reconstruction of tongue (red) and fat within tongue
tongue region analyses. Regional          (yellow) from series of 3-mm contiguous axial MR images superimposed on a midsagittal image; 8 sections of
differences in tongue fat within          apneic tongue (red) including tongue fat (yellow), 4 within RP (retropalatal) region and 4 within RG (retroglossal)
apneics and controls were as-             region of tongue. There is substantially more fat at base of tongue.
sessed using repeated measures
ANOVA, accounting for the mul-
tiple regions per subject. To assess analysis reproducibility,                RESULTS
intraclass correlation coefficients were computed. This study
was adequately powered (80%) to detect medium effect sizes                    Demographics of Cases and Controls
(Cohen’s d = 0.6) or greater, with actual power achieved for the                  Descriptive statistics of our overall case-control sample and
primary outcome of volume of tongue fat being 89%.                            our   matched subset are shown in Table 1. Our case-control
   To further control for the impact of imbalance between cases               study    was comprised of 90 patients with OSA and 31 sub-
and controls in the primary covariates of age, BMI, gender,                   jects  without    OSA. Patients with OSA were required to have
and race, we performed a secondary analysis using a matched                   an   AHI   ≥  15   (mean ± SD: AHI of 43.2 ± 27.3 events/h) and
case-control subset. Matching was conducted based on an exact                 control    subjects    were required to have an AHI ≤ 10 (AHI of
match of gender and race, age within 10 years, and BMI within                4.1   ± 2.7  events/h)     (Table 1). We were able to recruit both over-
2.5 kg/m , and resulted in 18 matched case-control pairs for this
          2
                                                                             weight     and   obese    apneics   (mean ± SD BMI of 39.1 ± 8.3 kg/
secondary analysis. Differences in demographic characteristics                m  2
                                                                                  ) and controls (BMI of 34.1 ± 4.8 kg/m2). Cases were slightly
between matched cases and controls were assessed using paired                 older (P = 0.004) and also heavier (P < 0.001) than control sub-
t-tests for continuous variables and McNemar test for categor-                jects, although our control subjects were still quite obese. Both
ical variables. Unadjusted analyses examining the differences in              groups had BMI ranges that substantially overlapped, allowing
soft tissue and intramuscular fat volumes between matched OSA                 us to statistically adjust for differences in BMI. There were no
cases and controls were performed using paired t-tests. Analyses              significant differences between apneics and controls in the sub-
adjusted for the small remaining differences in BMI and age                   ject ratios of gender (P = 0.162) or race (P = 0.156).
after matching were performed using a linear regression, with                     To further mitigate the impact of the covariate differences
the dependent variable equal to the difference in soft tissue or              between cases and controls on our results, we also performed
intramuscular fat for each case-control pair (i) as follows:                  a secondary analysis on a subset of 18 BMI (± 2.5 kg/m2), age
                                                                             (± 10 years), gender, and race-matched case-control pairs. As
                    E(Phenotype Differencei ) =                               expected, the 2 groups no longer differed in terms of BMI
         β0 + β1 (BMI Differencei ) + β2 (Age Differencei )                  (P = 0.808) or age (P = 0.827) after matching (see Table 1).

We then used a Wald test to determine whether the intercept                        Volumetric MR analysis of Tongue and Tongue Fat Volumes
(β0 ), which represents the expected phenotype difference, was                        The primary focus of this study was to identify alterations
equal to 0. We note that in the absence of adjustments, this                       in tongue fat using Dixon MR imaging. In order to make sure
model is equivalent to the paired t-test.                                          these data were reproducible, intraclass correlation coefficients
SLEEP, Vol. 37, No. 10, 2014                                                1641             Tongue Fat in Patients with Obstructive Sleep Apnea—Kim et al.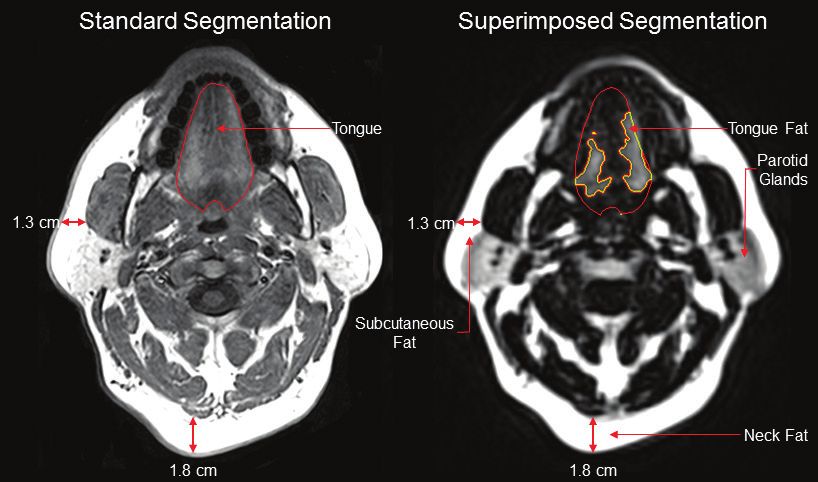
Table 1—Demographics of case and control subjects.
Overall Case-Control Sample Matched Case-Control Sample
Apneics (n = 90) Controls (n = 31) Apneics (n = 18) Controls (n = 18)
Factor Mean SD Mean SD P †
Mean SD Mean SD P‡
Age, years 49.6 9.9 41.6 13.2 0.004 50.3 2.8 50.1 4.4 0.827
BMI, kg/m2 39.1 8.3 34.1 4.8 < 0.001 33.6 4.5 33.5 4.1 0.808
AHI, events/h 43.2 27.3 4.1 2.7 < 0.001 28.2 12.8 3.9 2.5 < 0.0001
Gender, M:F 42:48 10:21 0.162 5:13 5:13 1.000
Race, C:AA 39:51 18:13 0.156 9:9 9:9 1.000
AHI, apnea-hypopnea index; BMI, body mass index; C, Caucasian; AA, African American. Significant differences shown in bold. † P-value from t-test (for
Downloaded from https://academic.oup.com/sleep/article-abstract/37/10/1639/2416812 by guest on 26 January 2020
continuous variables) or χ2 test (for categorical variables); ‡ P-value from paired t-test or McNemar test.
Table 2—Comparison of muscle volumes and tongue fat in case and control subjects.
Apneics (n = 90) Controls (n = 31)
Soft Tissue Volume Mean SD Mean SD P† P‡
Tongue, mm3 101,193 17,651 85,542 13,813 < 0.001 0.001
Tongue fat, mm3 32,791 9,175 23,390 5,511 < 0.001 0.002
Tongue fat, % 32.6 7.9 27.7 6.7 0.002 0.089
Tongue lean mass, mm3 68,401 15,336 62,152 13,370 0.046 0.123
Left masseter, mm3 16,204 6,633 14,517 6,342 0.214 0.794
Left masseter fat, mm3 786 859 599 766 0.262 0.118
Left masseter fat, % 5.2 5.9 4.8 6.1 0.794 0.384
Significant differences are presented in bold. † P-value from t-test; ‡ P-value after adjustment for age, BMI, gender, and race.
from repeated measures within 10 subjects were calculated for than controls (see Table 2 and Figure 3). After adjustment for
MR structures; all coefficients were > 0.95, indicating a highly age, BMI, gender, and race, tongue volume, and tongue fat re-
reproducible analysis. To measure accuracy, we used Dixon MR mained significantly increased in apneics compared to controls
imaging to quantify fat volumes in a hamburger (Figure S2) (P = 0.001, P = 0.002, respectively); this was not true for tongue
and steak before and after an injection of a known volume of fat fat percentage (P = 0.089).
(3 cc lard added to the hamburger and 6 cc added to the steak). When repeating these analyses within our age-, BMI-, gender-,
Our data show that we can accurately quantify the amount of and race-matched case-control subsample, we observed similar
fat added to these tissues using Dixon MR imaging (3.03 cc and differences between apneics and controls (Table 3). Apneics
5.96 cc, respectively; see also Table S1, supplemental material). had significantly larger tongue volumes (P = 0.022) and greater
tongue fat (P = 0.010) than controls (see Table 3). While the
Obesity Measures and Tongue Fat difference in tongue fat percentage was not significant in our re-
We assessed the relationship between clinical and MRI duced sample of 18 matched pairs, the magnitude of the differ-
measures of obesity and tongue volume, tongue fat volume, ence was similar in the matched subset and the overall sample
and tongue fat percentage (Table S2, supplemental material). (4.3% vs. 4.9%).
In general, patients with more obesity had larger tongue and We also examined tongue lean mass (Tables 2 and 3). In the
tongue fat volumes, as well as higher percentages of tongue fat. entire group, in the unadjusted model there was a borderline
There were significant correlations (0.44; P < 0.0001) between significant (P = 0.046) increased tongue lean mass in apneics
visceral fat in the abdomen and tongue fat. compared to controls (Table 2). However, this difference was
lost after controlling for age, BMI, gender, and race. There
Differences in Tongue Fat Volume between Apneics and were no statistically significant differences in tongue lean mass
Controls in the matched subset (Table 3). These data support our hypoth-
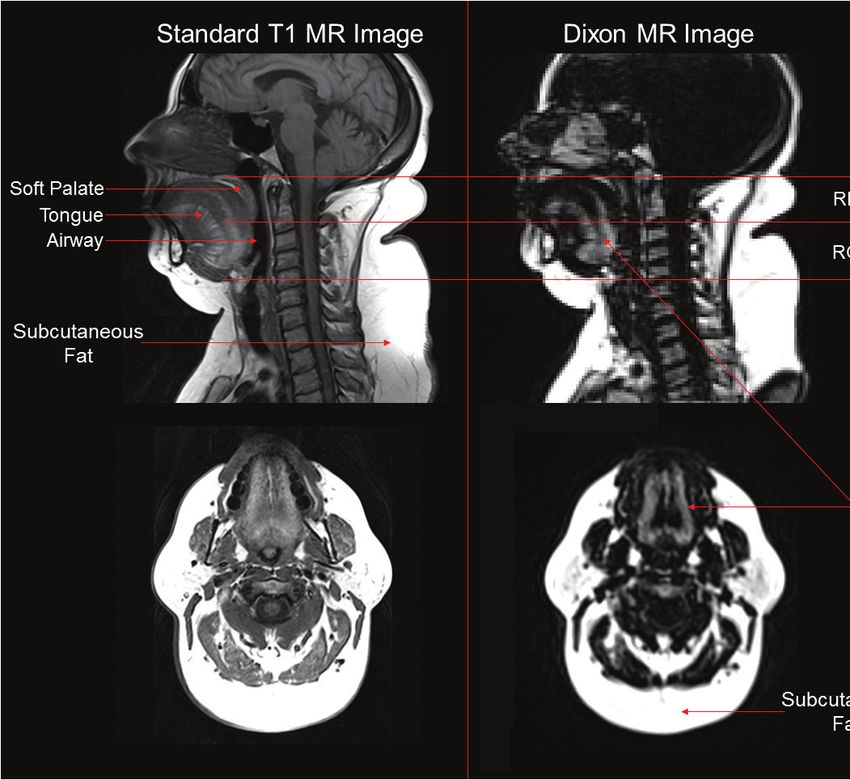
Apneic subjects had more tongue fat than controls (see esis that tongue fat is the major factor in explaining the increase
Table 2 and Figure 3). An apneic with an enlarged tongue and tongue volume in apneics compared to controls, although dif-
increased tongue fat deposition is shown in comparison to an ferences in tongue lean mass could play a lesser role.
obese control in Figure 4. In all subjects, using quantitative
volumetric measurements, apneics were shown to have signifi- Distribution of Fat within the Tongue
cantly greater tongue volumes (P < 0.001), greater tongue fat For the topography of tongue fat, we examined the data both
(P < 0.001), and a greater percentage of tongue fat (P = 0.002) within groups (apneic or control) and between groups (apneic
SLEEP, Vol. 37, No. 10, 2014 1642 Tongue Fat in Patients with Obstructive Sleep Apnea—Kim et al.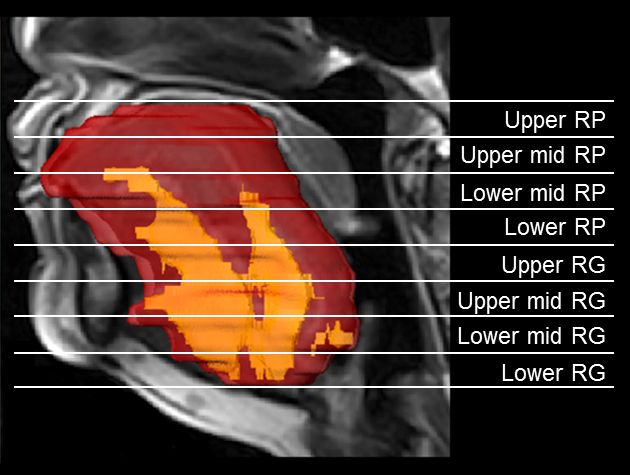
Downloaded from https://academic.oup.com/sleep/article-abstract/37/10/1639/2416812 by guest on 26 January 2020
  Figure 3—The mean and 95% confidence intervals for our primary outcomes of interest are shown for cases and controls, both in our overall sample and
  for the age, BMI, gender, and race-matched pairs. * After adjustment for age, BMI, gender, and race, we observe significant differences between cases and
  controls for tongue volume and tongue fat, both in the overall population (P = 0.001 and P = 0.002, respectively) and in our matched sample (P = 0.022 and
  P = 0.010, respectively). There were no significant differences in masseter fat between the apneics and controls. In all subjects tongue fat % is greater than
  masseter fat %.

vs. control). There were signifi-
cant differences in intramuscular
fat percentage among the 4 sec-
tions (P < 0.001) of the RP and
RG regions of the tongue, as well
as across all 8 sections (P < 0.001)
within apneics and within con-
trols, indicating heterogeneous fat
distribution in both groups (see
Figure 5 and Table 4).
   Examination of differences be-
tween groups showed that the per-
centage of fat in the retroglossal
region of the tongue was signifi-
cantly greater in apneics than in
controls (P = 0.023), whereas there
were no significant differences in
the percentage of tongue fat in
the retropalatal region (P = 0.993)
after adjustment for age, BMI,
gender, and race (Table 4). When
examining the differences in more
detail, the lower mid and lower
sections of the retroglossal region
of the tongue had significantly
higher percentages of fat in ap-
neics than controls after adjust-               Figure 4—Representative three-dimensional volumetric reconstructions of tongue (red) and fat within tongue
                                                (yellow) from series of 3-mm contiguous axial MR images superimposed on midsagittal images in BMI-matched
ments for age, BMI, gender, and
                                                post-menopausal female patient with OSA (left) and post-menopausal female control subject (right) (subjects
race (P = 0.003 and P < 0.001,                  also matched for age and ethnicity). The apneic tongue is much larger and there is increased tongue fat
respectively) (Table 4). These                  deposition throughout the apneic tongue.
data indicate that there are region
SLEEP, Vol. 37, No. 10, 2014                                                  1643              Tongue Fat in Patients with Obstructive Sleep Apnea—Kim et al.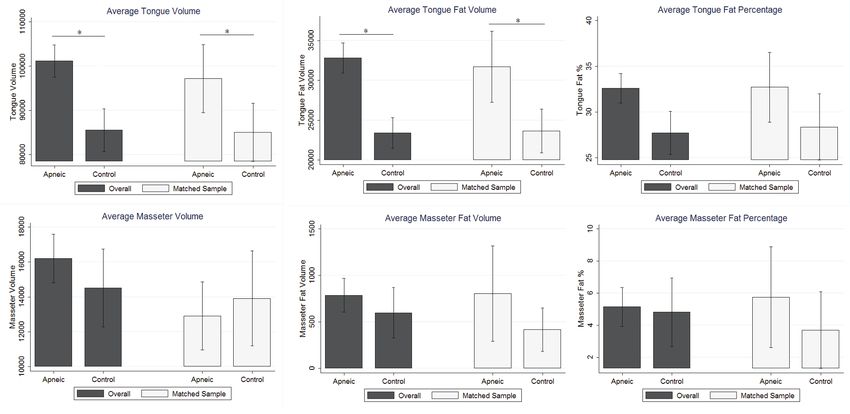
Table 3—Comparison of muscle volumes and tongue fat in BMI-, age-, gender-, and race-matched case-control pairs.
                                           Apneics (n = 18)                      Controls (n = 18)
    Soft Tissue Volume                  Mean              SD                   Mean               SD                P†              P‡
      Tongue, mm3                       97,188          16,626                 85,067           14,199            0.014           0.022
      Tongue fat, mm3                   31,712           9,695                 23,638            5,979            0.009           0.010
      Tongue fat, %                       32.7              8.3                  28.4               7.8           0.147           0.142
      Tongue lean mass, mm3             65,476          14,404                 61,429           14,684            0.390           0.436
      Left masseter, mm3                12,906           4,230                 13,910            5,903            0.528           0.450
      Left masseter fat, mm3               806           1,109                    417              508            0.173           0.196
      Left masseter fat, %                  5.8             6.8                    3.7              5.2           0.266           0.291

                                                                                                                                                                    Downloaded from https://academic.oup.com/sleep/article-abstract/37/10/1639/2416812 by guest on 26 January 2020
  Significant differences are presented in bold. † P-value from paired t-test; ‡ P-value resulting from regression analysis on difference in outcome, after
  adjustment for age and BMI differences.

                                                                                         Relationship between AHI and Tongue Fat
              Tongue Fat Distribution in Apneics and Controls                               We next assessed whether there was correlation between con-
                  Upper RP
                                                                                         tinuous AHI and tongue volume, fat volume, and fat percentage.
              Mid/Upper RP                                                               There was a significant positive correlation between AHI and
              Mid/Lower RP                                                               both tongue volume (P = 0.0001) and tongue fat (P = 0.001)
   Apneics

                  Lower RP                                                               after adjustment for age, BMI, gender, and race. There was a
                  Upper RG
              Mid/Upper RG                                                               nonsignificant correlation for tongue fat percentage (P = 0.117)
              Mid/Lower RG                                                               (Table 5). There were no statistically significant correlations
                  Lower RG                                                               between AHI and any of the RP regional tongue fat percentages
                  Upper RP
                                                                                         (Table S4, supplemental material). We observed significant
              Mid/Upper RP                                                               correlations between AHI and both the upper (P = 0.029) and
              Mid/Lower RP                                                               lower-mid (P = 0.034) RG regions. We also observed border-
   Controls

                  Lower RP                                                               line nonsignificant correlations for the total RG fat percentage
                  Upper RG
              Mid/Upper RG                                                               (P = 0.068) and the upper-mid RG region (P = 0.073) (see
              Mid/Lower RG                                                               Table S4).
                  Lower RG
                             0     20             40     60        80                Differences in Fat Volumes in the Masseter Muscles
                                 Tongue Fat Percentage (%)                              While we saw differences in fat in the tongue between ap-
                                                                                     neics and controls, there were no differences in fat volume
  Figure 5—Graphical box and whisker plot comparison of tongue fat                   (P = 0.118) or fat percentage (P = 0.384) between apneics and
  distribution within apneics and controls. The gray box represents the              controls in the masseter muscle (a control muscle) after adjust-
  interquartile range (IQR = 75th Percentile – 25th Percentile), with the            ment for age, BMI, gender, and race (Figure 3 and Table 2).
  black line within the box showing the median value. The “whiskers”                 Similarly, there was no significant difference in the matched
  extend from the box either to the respective minimum or maximum value,             case-control subset for either the volume (P = 0.196) or per-
  or 1.5 × IQR from the 25th and 75th percentiles if points lie outside this         centage (P = 0.291) of fat in the masseter muscle (Figure 3
  range. After adjustment for age, gender, BMI, and race, the percentage
                                                                                     and Table 3). Masseter volume, masseter fat, and masseter fat
  of intramuscular fat in the lower mid RG (P = 0.003) and lower RG
  (P < 0.001) regions of tongue is significantly greater in apneics than in          percentage were not statistically significantly correlated to
  controls. RP = retropalatal and RG = retroglossal.                                 AHI (Table 5). The percentage of fat within the apneic tongue
                                                                                     (32.6%) was significantly greater (P < 0.001) than in the mas-
                                                                                     seter muscle (5.2%) (Table 2). This was also true in controls,
specific differences in the distribution of RP and RG tongue                         where the percentage of fat in the tongue (27.7%) was signifi-
fat within apneics and controls as well as between apneics and                       cantly greater (P < 0.001) than in the masseter muscle (4.8%).
controls.
   Within our matched case-control sample (Table S3, supple-                             DISCUSSION
mental material), we once again observed a significantly higher                             This is the first study showing that the amount of tongue fat
percentage of fat in apneics compared to controls within the                             in obese apneics is greater than in obese controls. We have dem-
lower RG region (P = 0.010), but not for the lower mid RG                                onstrated that (1) apneics have enlarged tongue volumes and
(P = 0.072). There was a significant difference in fat percentage                        increased fat within the tongue compared to control subjects,
within the lower mid RP region (P = 0.044). Therefore, our                               after adjustment for age, BMI, gender, and race; this was true in
matched sample results support the overall observation of an                             the entire sample and in a secondary analysis in a well-matched
increased deposition of tongue fat within the lower regions of                           case-control subset; (2) there was more fat in the tongue than in
the retroglossal region of the tongue in apneics.                                        a control upper airway muscle (masseter) in both apneics and
SLEEP, Vol. 37, No. 10, 2014                                                     1644              Tongue Fat in Patients with Obstructive Sleep Apnea—Kim et al.
Table 4—Comparison of tongue fat percentage and distribution within retropalatal (RP) and retroglossal (RG) regions in case and control subjects.
Apneics (n = 90) Controls (n = 31)
Tongue Fat Percentage Mean SD Mean SD P† P‡
Total RP, % 24.4 9.0 21.0 8.5 0.065 0.993
Upper RP, % 5.3 8.7 5.6 11.7 0.887 0.137
Upper mid RP, % 17.4 11.7 15.2 10.8 0.334 0.739
Lower mid RP, % 28.6 11.3 23.4 9.4 0.015 0.454
Lower RP, % 33.3 12.8 27.9 11.4 0.032 0.714
Total RG, % 45.5 11.7 37.6 8.7 < 0.001 0.023
Upper RG, % 40.4 12.9 33.9 12.0 0.013 0.365
Upper mid RG, % 47.1 11.9 41.0 9.8 0.007 0.122
Downloaded from https://academic.oup.com/sleep/article-abstract/37/10/1639/2416812 by guest on 26 January 2020
Lower mid RG, % 50.5 13.8 40.3 13.4 0.001 0.003
Lower RG, % 47.3 19.7 33.5 14.2 < 0.001 < 0.001
Significant differences are presented in bold. † P-value from t-test; ‡ P-value after adjustment for age, BMI, gender, and race. RP, retropalatal; RG, retroglossal;
SD, standard deviation.
controls; (3) tongue fat percentage in apneics was increased in Table 5—Relationship between AHI and fat measurements in the tongue
specific locations of the tongue (greater in the retroglossal re- and masseter in all subjects.
gion); (4) tongue fat volume correlates with AHI and BMI. Our
Primary Soft Tissue Partial Rho P†
data provide evidence of a novel mechanistic pathway which
Tongue, mm3 0.35 0.0001
may explain the relationship between obesity and sleep apnea.
Tongue fat, mm3 0.30 0.001
Importance of Tongue Fat Tongue fat, % 0.15 0.117
Previous autopsy10 and fast spin echo imaging15 studies have Left masseter, mm3 0.05 0.599
shown that the tongue, a primary upper airway soft tissue risk Left masseter fat, mm3 0.05 0.632
factor for OSA, has a high percentage of fat. These studies, Left masseter fat, % 0.04 0.644
however, did not specifically examine subjects with OSA. We
have shown that in obese apneics, the tongue has a very high Significant correlations are presented in bold. † P-value after adjustment
percentage of intramuscular fat (32.6%). Our reported tongue for age, BMI, gender, and race.
fat percentages in controls (27.7%) were slightly greater, on
average, than those reported in the previous autopsy10 and im-
aging15 studies, likely because our recruited population was shown to have obesity-related influences on OSA.18 The herita-
heavier. In contrast, we found that the masseter muscle did bility of fat deposits in the upper airway muscles (tongue) has
not have a high percentage of fat, suggesting that fat is not de- yet to be studied. Although we have shown that tongue volume
posited uniformly in muscles of the upper airway and that the is heritable,19 patients with OSA appear to preferentially deposit
tongue may be a unique reservoir for fat deposition. Our study fat in the tongue as well as in the soft palate.20 Increased intra-
also found that the apneic tongue is enlarged and composed of muscular tongue fat and fat percentage, particularly at the base
a larger amount of intramuscular fat than the tongue in controls. of tongue, may be important intermediate phenotypes for OSA.
Although the differences in the overall tongue fat percentage
between cases and controls were not statistically significant Role of Tongue Fat in the Pathogenesis of OSA
after covariate adjustment (32.6% vs. 27.7%, P = 0.089), we The tongue is known to be the most important pharyngeal
did observe statistically significant differences between ap- dilator muscle.21 It is a unique freely moving muscle that, un-
neics and controls in fat percentage within the RG region of the like other muscles, is anchored to bone at only one end, the
tongue, particularly near the base. Within these same apneics base, by four extrinsic (external bony origin and insertion into
and controls, no differences were found in masseter muscle the tongue base) muscles (genioglossus, hyoglossus, stylo-
volume and masseter fat composition. glossus, palatoglossus). These extrinsic muscles are respon-
These findings raise important questions as to why intramus- sible for tongue positioning,22 while the four intrinsic (origin
cular fat percentage differs so greatly between muscles of the and insertion within the tongue) muscles (superior and inferior
upper airway and what factors are driving the preferential de- longitudinal, verticalis, transversus) found towards the top of
position of fat in the tongue. We believe increased fat in the tongue control shape changes. Tongue muscles have distinctive
apneic tongue may in part be explained by the role of genetics. fiber compositions,23,24 which contribute to the functional abili-
Genetic heritability of fat distribution phenotypes has been ties of the tongue to preserve airway patency. We propose that
demonstrated,16 and deposition of total, trunk, and lower body increased tongue fat not only increases the size of the tongue,
fat has been shown to be under genetic control.17 Fat deposits in which affects airway size and collapsibility, but also may ad-
the abdomen in men and neck in women have been previously versely affect muscle function. Specifically, the increased
SLEEP, Vol. 37, No. 10, 2014 1645 Tongue Fat in Patients with Obstructive Sleep Apnea—Kim et al.presence of intramuscular fat may alter the tongue’s shape and data show that, independent of age, BMI, gender, and race,
reduce its contractile force, affecting the tongue’s ability to intramuscular tongue fat is increased in apneics compared
properly perform as a pharyngeal dilator muscle. We found a to controls, providing a novel mechanism for explaining the
higher percentage of fat at the base of the tongue in apneics, relationship between obesity and OSA. We also showed that
the location where extrinsic muscles anchor the tongue to bone. tongue fat is correlated with visceral abdominal fat and other
This increased fat may affect the ability of each of the extrinsic fat deposits. It is not clear why the tongue has so much fat com-
muscles to properly position the tongue away from the airway. pared to the other upper airway muscles, but this fat deposi-
The tongue is an important factor in mediating upper airway tion may be another form of visceral fat. Weight loss or upper
size and shape. The increased fat at the base of the tongue may airway exercises (which have been shown to improve OSA39)
alter the shape of the tongue in the retroglossal region, thereby may decrease tongue fat. In the future, removal of tongue fat
reducing the size of the retroglossal airway and increasing the (via weight loss, upper airway exercises, or surgery) may be
risk of sleep apnea. Airway shape has been shown to be an im- a potential treatment for OSA. Future studies examining such
portant in mediating airway closure during apnea.25,26 Further- interventions are needed.
Downloaded from https://academic.oup.com/sleep/article-abstract/37/10/1639/2416812 by guest on 26 January 2020
more, changes in size and shape of the tongue (secondary to
fat) may alter airway collapsibility and closing pressure (pcrit). Study Limitations
During sleep, interdigitated intrinsic and extrinsic muscles There are several potential limitations of the present study
are co-activated in order to properly maintain the patency of that need to be addressed. Three-point Dixon MR images pro-
the airway.27 Increase in intramuscular fat may modify how vide excellent separation of water and fat, although they are
forceful contractions are transmitted across multiple muscles unable to clearly define tissue boundaries when adjacent tis-
within the tongue.28 Fat infiltration at these critical junctions sues have similar tissue composition. This limitation was ad-
may affect the shape changes needed to prevent apneic events. dressed by superimposing standard T1 spin-echo images on
Eckert et al. have shown that task failure in a tongue force fa- top of the Dixon MR images, which greatly improved tissue
tigability test (maintenance of repetitive isometric contractions boundary visualization. The analysis of intramuscular fat was
at 90% of maximal force protrusion) occurred more rapidly in conducted using a thresholding method, which may be subject
apneics than controls.29 Blumen et al. reported similar findings, to over or under segmentation of fat. We believe the potential
indicating that apneics had longer recovery times between sub- for this bias in our fat estimates is limited for several reasons.
maximal effort.30 These examples of lowered resistance to fa- First, we observed excellent reproducibility (ICC > 0.95) and
tigue in tongue endurance exercises may, at least in part, be due the analysis was completed by a single analyst. Second, all in-
to the contribution of increased intramuscular fat in the apneic tramuscular fat measurements were completed using the same
tongue. However, it should be noted that in the Eckert investi- thresholding setting, and masseter fat percentages were found
gation maximal tongue protrusion force was greater in apneics to be low, characteristic of normal muscle composition. Third,
than controls.29 Tongue fat was not measured in this investiga- we were able to accurately quantify a known amount of fat in
tion, and the BMI of both the apneics and controls was lower our phantom studies of hamburger and steak (Figure S2 and
than the BMI of our subjects.29 Table S1). Finally, our tongue fat percentages were comparable
to those found in both the Nashi autopsy study (10% to 32%)10
Relationship of Obesity to OSA and Humbert’s IDEAL-FSE (iterative decomposition of water
Obesity is the strongest risk factor for OSA, but the mecha- and fat with echo asymmetry and least squares estimation - fast
nisms underlying this relationship are not well understood. spin echo) imaging study (average tongue fat of 26.5%).15
Weight loss has been shown to result in decreases in both fat Recruitment of obese controls (BMI ≥ 30 kg/m2) aged 40-50
and lean mass, although more than twice as much fat was lost years is difficult, particularly for male controls, in part because
compared to lean mass.35 Weight gain has also been shown to OSA is highly prevalent in this demographic group. Therefore,
result in a greater increase in fat than fat free tissue.36,37 Thus, we defined controls as those with an AHI ≤ 10 events/h, rather
the relationship between obesity and OSA may be related to in- than using an AHI criterion of ≤ 5. There are several reasons
creases in both fatty and muscular tissue. The increase in mus- why this cutpoint does not appear problematic. We scored
cular tissue with obesity may be secondary to fat infiltration the sleep studies using the alternative scoring method of the
within the muscle. American Academy of Sleep Medicine,40 which is a more lib-
Parapharyngeal fat pads have also been shown to be enlarged eral scoring system than the recommended criteria, potentially
in apneics and to contribute to airway narrowing.38 However, making the higher cutpoint more reasonable. Moreover, despite
other data has shown that the size of the fat pads were not statis- this higher cutpoint, the AHI in apneics was still much higher
tically significantly different between apneics and normals after than in controls. Increasing the AHI cut-point for controls could
adjustment for craniofacial size, age, ethnicity, and gender.14 have made it more difficult to find differences between apneics
Such data suggest that obesity compromises the upper airway and controls; nonetheless, we found differences in tongue fat
in apneics through mechanisms other than fat deposition in even with this cut-point for normals.
the parapharyngeal fat pads. Using standard T1-weighted spin There was a noticeable, although not statistically signifi-
echo MRI, Li et al. have shown that apneics have increased cant, difference in the gender distribution between apneics
deposition of fat within the soft palate compared to controls, (47% male) and controls (32% male). It is possible that this
independent of BMI.20 We did not examine fat in the soft palate imbalance may have confounded our results. We addressed this
due to the difficulty in determining the boundary between the potential confounding by not only adjusting for the effect of
two muscles (tongue and soft palate) using Dixon images. Our gender (in addition to age, BMI, and race) within our primary
SLEEP, Vol. 37, No. 10, 2014 1646 Tongue Fat in Patients with Obstructive Sleep Apnea—Kim et al.analysis, but also by repeating analyses within a subset of well- DISCLOSURE STATEMENT
matched apneics and controls. Similar results were observed in This was not an industry supported study. This study was
this matched subsample, suggesting that covariate imbalance supported by grants from the National Institutes of Health
was not driving the observed result in the overall sample. (R01HL089447 and P01HL094307). The authors have indi-
Since the goal of this study was to specifically examine cated no financial conflicts of interest.
tongue fat, we did not examine differences in other upper
airway soft tissue structures or airway measures between the REFERENCES
apneics and controls. However, we note that our group has pub- 1. Somers VK, White DP, Amin R, et al. Sleep apnea and cardiovascular
disease: an American Heart Association/American College of Cardiology
lished similar data in the past.14 The difference in the total per- Foundation scientific statement from the American Heart Association
centage of tongue fat between apneic and controls did not quite Council for High Blood Pressure Research Professional Education
reach statistical significant after adjustment (P = 0.089). How- Committee, Council on Clinical Cardiology, Stroke Council, and Council
ever, this difference was significant in the unadjusted models on Cardiovascular Nursing. Circulation 2008;118:1080-111.
2. Tufik S, Santos-Silva R, Taddei JA, Bittencourt LR. Obstructive sleep
(P = 0.002), and there were statistically significant regional
Downloaded from https://academic.oup.com/sleep/article-abstract/37/10/1639/2416812 by guest on 26 January 2020
apnea syndrome in the Sao Paulo Epidemiologic Sleep Study. Sleep Med
tongue fat percentage differences between apneics and controls. 2010;11:441-6.
We did not find a correlation between tongue volume and 3. Marin JM, Carrizo SJ, Vicente E, Agusti AG. Long-term cardiovascular
body mass index, which has been found in other studies.41 This outcomes in men with obstructive sleep apnoea-hypopnoea with
or without treatment with continuous positive airway pressure: an
lack of correlation with BMI may be due to the restricted BMI observational study. Lancet 2005;365:1046-53.
range of the obese subjects recruited for this study. While spe- 4. Foster GD, Borradaile KE, Sanders MH, et al. A randomized study
cifically examining only obese patients may have limited our on the effect of weight loss on obstructive sleep apnea among obese
ability to observe strong correlations between BMI and tongue patients with type 2 diabetes: the Sleep AHEAD study. Arch Intern Med
2009;169:1619-26.
volumes, this was an essential aspect of the design in order to 5. Marshall NS, Wong KK, Liu PY, Cullen SR, Knuiman MW, Grunstein
minimize the effect of BMI in primary comparisons between RR. Sleep apnea as an independent risk factor for all-cause mortality: the
controls and apneics. Despite this limited BMI range, it should Busselton Health Study. Sleep 2008;31:1079-85.
be noted that tongue fat was statistically significantly correlated 6. Kelly T, Yang W, Chen CS, Reynolds K, He J. Global burden of obesity in
2005 and projections to 2030. Int J Obes (Lond) 2008;32:1431-7.
with BMI. 7. Peppard PE, Young T, Barnet JH, Palta M, Hagen EW, Hla KM. Increased
Finally, we did not examine the effect of tongue fat on ge- prevalence of sleep-disordered breathing in adults. Am J Epidemiol
nioglossus activity, as this was not the purpose of the present 2013;177:1006-14.
study. However, we note that it is likely that tongue fat affects 8. Glover GH. Multipoint Dixon technique for water and fat proton and
susceptibility imaging. J Magn Reson Imaging 1991;1:521-30.
the mechanical function of the tongue. Therefore, such a study 9. Kovanlikaya A, Guclu C, Desai C, Becerra R, Gilsanz V. Fat quantification
would be a logical future direction. As mentioned above, it is using three-point dixon technique: in vitro validation. Acad Radiol
also of interest to examine the effect of weight loss and upper 2005;12:636-9.
airway exercises on tongue fat. 10. Nashi N, Kang S, Barkdull GC, Lucas J, Davidson TM. Lingual fat at
autopsy. Laryngoscope 2007;117:1467-73.
11. Brennick MJ, Pack AI, Ko K, et al. Altered upper airway and soft tissue
CONCLUSIONS structures in the New Zealand Obese mouse. Am J Respir Crit Care Med
We have combined spin echo and Dixon MR imaging into 2009;179:158-69.
a novel paradigm to quantitatively assess fat deposits in the 12. Kovanlikaya A, Mittelman SD, Ward A, Geffner ME, Dorey F, Gilsanz V.
Obesity and fat quantification in lean tissues using three-point Dixon MR
tongue, in an obese population with and without OSA. After imaging. Pediatr Radiol 2005;35:601-7.
adjusting for covariates (age, BMI, gender, and race), tongue 13. Kim C, Jackson N, Chawla S, Maislin G, Schwab RJ. Quantification of
volume and tongue fat were significantly enlarged in patients tongue fat by novel MRI techniques and its relationship to BMI. Am J
with OSA when compared to obese controls. We have shown Respir Crit Care Med 2011;183:A3678.
14. Schwab RJ, Pasirstein M, Pierson R, et al. Identification of upper airway
this in our entire case-control sample and in our subsample anatomic risk factors for obstructive sleep apnea with volumetric magnetic
matched specifically for age, BMI, gender, and race. We be- resonance imaging. Am J Respir Crit Care Med 2003;168:522-30.
lieve this increase in fat deposition not only enlarges tongue 15. Humbert IA, Reeder SB, Porcaro EJ, Kays SA, Brittain JH, Robbins J.
size, but also may decrease tongue force and hinder the tongue Simultaneous estimation of tongue volume and fat fraction using IDEAL-
FSE. J Magn Reson Imaging 2008;28:504-8.
from properly functioning as an upper airway dilator muscle. 16. Bouchard C. Genetic determinants of regional fat distribution. Hum
Additionally, tongue size and tongue fat correlated with AHI. Reprod 1997;12 Suppl 1:1-5.
Further studies need to determine if weight loss decreases 17. Malis C, Rasmussen EL, Poulsen P, et al. Total and regional fat distribution
tongue fat, and whether improvements in sleep-disordered is strongly influenced by genetic factors in young and elderly twins. Obes
Res 2005;13:2139-45.
breathing are associated with changes in tongue fat. 18. Simpson L, Mukherjee S, Cooper MN, et al. Sex differences in the
association of regional fat distribution with the severity of obstructive
ACKNOWLEDGMENTS sleep apnea. Sleep 2010;33:467-74.
The authors thank Dana Concio, Elizabeth Kneeland, Doris 19. Schwab RJ, Pasirstein M, Kaplan L, et al. Family aggregation of upper
airway soft tissue structures in normal subjects and patients with sleep
Cain, Jackie Meeks, Joan Sparano, Krista Harriger, Patricia apnea. Am J Respir Crit Care Med 2006;173:453-63.
O’Donnell, and Norman Butler for their contributions to this 20. Li Y, Na L, Ye J, Chang Q, Han D, Sperry A. Upper airway fat tissue
paper. Author Contributions: Conception and Design: AMK, NJ, distribution differences in patients with obstructive sleep apnea and
ELC, HP, AP, RJS; Analysis and Interpretation: AMK, BTK, NJ, controls as well as its effect on retropalatal mechanical loads. Respir Care
2012;57:1098-105.
BS, DAT RJS; Drafting of the Manuscript: AMK; Critical revi- 21. White DP. Sleep apnea. Proc Am Thorac Soc 2006;3:124-8.
sion: NJ, HP, BTK, DAT, AP, RJS; Final approval of the version
to be published: AMK, BTK, ELC, BS, HP, DAT, AP, RJS.
SLEEP, Vol. 37, No. 10, 2014 1647 Tongue Fat in Patients with Obstructive Sleep Apnea—Kim et al.22. Sauerland EK, Mitchell SP. Electromyographic activity of intrinsic and 32. Mezzanotte WS, Tangel DJ, White DP. Waking genioglossal
extrinsic muscles of the human tongue. Tex Rep Biol Med 1975;33:444- electromyogram in sleep apnea patients versus normal controls (a
55. neuromuscular compensatory mechanism). J Clin Invest 1992;89:1571-9.
23. Stal P, Marklund S, Thornell LE, De Paul R, Eriksson PO. Fibre 33. Kuiken TA, Lowery MM, Stoykov NS. The effect of subcutaneous
composition of human intrinsic tongue muscles. Cells Tissues Organs fat on myoelectric signal amplitude and cross-talk. Prosthet Orthot Int
2003;173:147-61. 2003;27:48-54.
24. Saboisky JP, Butler JE, Fogel RB, et al. Tonic and phasic respiratory drives 34. Saboisky JP, Stashuk DW, Hamilton-Wright A, et al. Neurogenic changes
to human genioglossus motoneurons during breathing. J Neurophysiol in the upper airway of patients with obstructive sleep apnea. Am J Respir
2006;95:2213-21. Crit Care Med 2012;185:322-9.
25. Leiter JC. Upper airway shape: Is it important in the pathogenesis of 35. Beavers KM, Miller ME, Rejeski WJ, Nicklas BJ, Krichevsky SB. Fat
obstructive sleep apnea? Am J Respir Crit Care Med 1996;153:894-8. mass loss predicts gain in physical function with intentional weight loss
26. Watanabe T, Isono S, Tanaka A, Tanzawa H, Nishino T. Contribution in older adults. J Gerontol A Biol Sci Med Sci 2013;68:80-6.
of body habitus and craniofacial characteristics to segmental closing 36. Hill JO, Sparling PB, Shields TW, Heller PA. Effects of exercise and food
pressures of the passive pharynx in patients with sleep-disordered restriction on body composition and metabolic rate in obese women. Am
breathing. Am J Respir Crit Care Med 2002;165:260-5. J Clin Nutr 1987;46:622-30.
27. Bailey EF, Janssen PL, Fregosi RF. PO2-dependent changes in intrinsic 37. Wadden TA, Foster GD, Letizia KA, Mullen JL. Long-term effects
Downloaded from https://academic.oup.com/sleep/article-abstract/37/10/1639/2416812 by guest on 26 January 2020
and extrinsic tongue muscle activities in the rat. Am J Respir Crit Care of dieting on resting metabolic rate in obese outpatients. JAMA
Med 2005;171:1403-7. 1990;264:707-11.
28. Kjaer M. Role of extracellular matrix in adaptation of tendon and skeletal 38. Shelton KE, Woodson H, Gay S, Suratt PM. Pharyngeal fat in obstructive
muscle to mechanical loading. Physiol Rev 2004;84:649-98. sleep apnea. Am Rev Respir Dis 1993;148:462-6.
29. Eckert DJ, Lo YL, Saboisky JP, Jordan AS, White DP, Malhotra A. 39. Guimaraes KC, Drager LF, Genta PR, Marcondes BF, Lorenzi-Filho G.
Sensorimotor function of the upper-airway muscles and respiratory Effects of oropharyngeal exercises on patients with moderate obstructive
sensory processing in untreated obstructive sleep apnea. J Appl Physiol sleep apnea syndrome. Am J Respir Crit Care Med 2009;179:962-6.
2011;111:1644-53. 40. Iber C, Ancoli-Israel S, Chesson A, Quan SF. The AASM manual for the
30. Blumen MB, de La Sota AP, Quera-Salva MA, Frachet B, Chabolle F, scoring of sleep and associated events: rules, terminology and technical
Lofaso F. Tongue mechanical characteristics and genioglossus muscle specifications. Westchester, IL: American Academy of Sleep Medicine,
EMG in obstructive sleep apnoea patients. Respir Physiol Neurobiol 2007.
2004;140:155-64. 41. Shigeta Y, Ogawa T, Ando E, Clark GT, Enciso R. Influence of tongue/
31. BuSha BF, Strobel RJ, England SJ. The length-force relationship of the mandible volume ratio on oropharyngeal airway in Japanese male patients
human genioglossus in patients with obstructive sleep apnea. Respir with obstructive sleep apnea. Oral Surg Oral Med Oral Pathol Oral Radiol
Physiol Neurobiol 2002;130:161-8. Endod 2011;111:239-43.
SLEEP, Vol. 37, No. 10, 2014 1648 Tongue Fat in Patients with Obstructive Sleep Apnea—Kim et al.SUPPLEMENTAL MATERIAL
SUPPLEMENTAL METHODS neck coil,3 this neutral position was defined by aligning the
Frankfurt plane, a plane from the soft tissue orbit of the eye to
Polysomnography the superior portion of the tragus of the ear, perpendicular to
Standard overnight sleep studies were performed, as de- the scanning table. Subjects were instructed to breathe through
scribed in our previous studies.1 Polysomnograms were scored the nose with the mouth closed and to refrain from swallowing
using the alternative criteria from the American Academy of during scanning. All MR scans were performed identically in
Sleep Medicine (2007).2 The AHI was calculated as the mean both case and control subjects.
number of apnea and hypopnea events per hour of sleep. Ob- All images utilized an initial 9 second sagittal localizer scans
structive apneas were defined as ≥ 90% drop in the thermal (TR [repetition time] = 20 msec, TE [echo time] = 20 msec,
sensor excursion of baseline lasting at least 10 seconds; hypop- 256 × 128 matrix, 1 NEX [number of signal averages]) in order
Downloaded from https://academic.oup.com/sleep/article-abstract/37/10/1639/2416812 by guest on 26 January 2020
neas were defined as a 50% reduction in airflow for > 10 sec- to identify the boundaries of the nasopharynx and the larynx,
onds and associated with > 3% decrement in oxyhemoglobin which comprised the range of subsequent axial scans. Contin-
saturation and/or an arousal. Nasal pressure monitors were used uous 6.93 minute axial (TR = 500 msec, TE = 12 msec, 3 mm
in all subjects to measure airflow. An event was called central thick, Base Resolution = 256, Phase Resolution = 100%, Phase
when there was no associated chest wall movement. Mixed ap- Oversampling = 60%, 256 × 128 matrix, 1 NEX) and 4.83
neic events were scored as obstructive. Oxygen saturation was minute sagittal spin echo T1-weighted MR images (TR = 500
plotted across the time of night.
Upper Airway MRI Acquisition Table S1—Fat determinations in tissue phantoms.
High resolution upper airway MR imaging was performed
Measured Measured Measure Measured
on a 1.5 Tesla MAGNETOM Espree Scanner (Siemens Medical Hamburger Hamburger Fat Steak Fat Steak Fat (mm³)
Systems, Malvern, PA) equipped with a prototype-enhanced Fat (mm³) at (mm³) after 3 cc (mm³) at after 6cc of
gradient system. Patients were positioned supine with the head Baseline of Injected Fat Baseline Injected Fat
in a neutral anatomic position and secured using a head and 54.36 57.39 59.55 65.51
Table S2—Relationship between obesity and fat measurements in the tongue.
Total Subcutaneous Visceral Abdominal
BMI Weight Abdominal Fat Abdominal Fat Fat
Primary Soft Tissue Rho P Rho P Rho P Rho P Rho P
Tongue, mm3 0.06 0.5080 0.26 0.0037 0.02 0.8714 -0.16 0.0851 0.34 0.0003
Tongue fat, mm3 0.23 0.0102 0.27 0.0025 0.31 0.0009 0.11 0.2325 0.44 < 0.0001
Tongue fat, % 0.23 0.0105 0.13 0.1627 0.37 0.0001 0.28 0.0034 0.27 0.0047
Significant Pearson’s correlations are presented in bold.
Table S3—Comparison of tongue fat percentage and distribution within RP and RG regions in BMI, age, gender, and race-matched case-control pairs.
Apneics (n = 18) Controls (n = 18)
Intramuscular Fat Percentage Mean SD Mean SD P† P‡
Total RP, % 24.7 9.1 21.5 8.5 0.308 0.308
Upper RP, % 2.8 2.8 3.8 4.8 0.257 0.159
Upper mid RP, % 14.9 10.2 15.5 9.5 0.875 0.871
Lower mid RP, % 30.0 11.8 23.2 9.0 0.039 0.044
Lower RP, % 35.4 13.9 30.5 12.6 0.283 0.276
Total RG, % 44.8 9.8 39.0 10.0 0.141 0.135
Upper RG, % 40.4 11.8 37.4 11.7 0.466 0.415
Upper mid RG, % 44.4 10.6 42.7 10.7 0.679 0.616
Lower mid RG, % 49.1 10.9 39.5 15.5 0.069 0.072
Lower RG, % 51.0 18.8 31.5 16.5 0.007 0.010
Significant differences are presented in bold. † P-value from paired t-test; ‡ P-value from from regression analysis on difference in outcome, after adjustment
for age and BMI differences; RP = retropalatal; RG = retroglossal.
SLEEP, Vol. 37, No. 10, 2014 1648A Tongue Fat in Patients with Obstructive Sleep Apnea—Kim et al.Anatomic Definitions,
Measurements, and Analysis
Using Amira 4.1.2 (Visage
Imaging, San Diego, CA), MR
images of the upper airway were
manually examined at the Pulmo-
nary Imaging Center (University
of Pennsylvania). The MRI anal-
ysis was split into three domains:
airway measurements, volumetric
analysis of soft tissues (tongue
and masseter), and intramuscular
fat (tongue and masseter) quan-
Downloaded from https://academic.oup.com/sleep/article-abstract/37/10/1639/2416812 by guest on 26 January 2020
tification. Airway measurements
and soft tissue volumes were ob-
tained from the standard T1 spin
echo axial images. The segmented
boundaries of the tongue and
masseter were determined from
Figure S1—Axial standard T1-weight spin echo (left) and fat-weighted Dixon (right) MR images of the upper the spin echo images and then
airway are shown above. Segmentation of the apneic tongue using standard T1-weighted spin echo MR image superimposed on the Dixon MR
with superimposed segmentation on corresponding anatomic level of a Dixon image. Note that this correctly images for proper tissue visualiza-
thresholded example shows comparable thicknesses of neck and subcutaneous fat within each image and tion. This method allows for direct
visualization of parotid glands.
measurement of intramuscular fat
without segmenting the Dixon MR
images. Fat-weighted Dixon MR
images provide a clear indication
of adipose tissue, but the bound-
aries of soft tissues are not as dis-
tinct in comparison to the standard
spin echo images (Figure 1). Intra-
muscular fat was then determined
using a thresholding method to
differentiate fat from the rest of
the tongue. The correct grayscale
setting to segment tongue fat was
chosen based on identifying the
appropriate grayscale intensity of
the surrounding subcutaneous and
neck fat (Figure S1). The topo-
graphic distribution of tongue fat
was further determined by subdi-
viding the tongue into 8 sections,
4 within the retropalatal and 4
Figure S2—Coronal MR Dixon images of hamburger (left at baseline; right after 3 cc of lard were injected into
within the retroglossal regions of
same hamburger meat). Lard phantom is visible at top of hamburger, but water phantom is not visible (since
Dixon MR images only highlight fat). Bright white areas on two right images indicate where fat was injected.
the tongue (see Figure 3 in manu-
Segmented Dixon MR images for fat (yellow) are shown below. Note that segmented hamburger with injected script). These sections were de-
fat (bottom right image) includes large areas of injected fat. fined based on an equal number of
axial slices (in each section) based
on the craniocaudal axis from the
msec, TE = 12 msec, 5 mm thick, Base Resolution = 256, midsagittal MRI, ranging from the upper and lower bound-
Phase Resolution = 100%, Phase Oversampling = 13%, 256 × aries of the tongue. Fat within the masseter was examined as
128 matrix, 1 NEX) of the upper airway were acquired. The a comparable upper airway muscle using the same method and
following 20 second T1-weighted gradient echo sequence grayscale settings. A bilateral analysis of the masseter (N = 20)
(TR = 6.91 msec, 3 mm thick, Base Resolution = 128, Phase indicated no differences from a unilateral analysis. Therefore,
Resolution = 100%, Phase Oversampling = 0%, Slice Overs- fat percentage was determined from subjects’ left masseter mus-
ampling = 13%, TE1 = 2.38 msec, TE2 = 4.76 msec, 256 × cles. Subjects with major dental artifacts were excluded from
128 matrix, 1 NEX) was performed to obtain three-point the Dixon analysis. Dental artifacts can affect the mandible po-
Dixon MR images. sition by causing a protrusion of the bone into the boundaries of
SLEEP, Vol. 37, No. 10, 2014 1648B Tongue Fat in Patients with Obstructive Sleep Apnea—Kim et al.You can also read